-
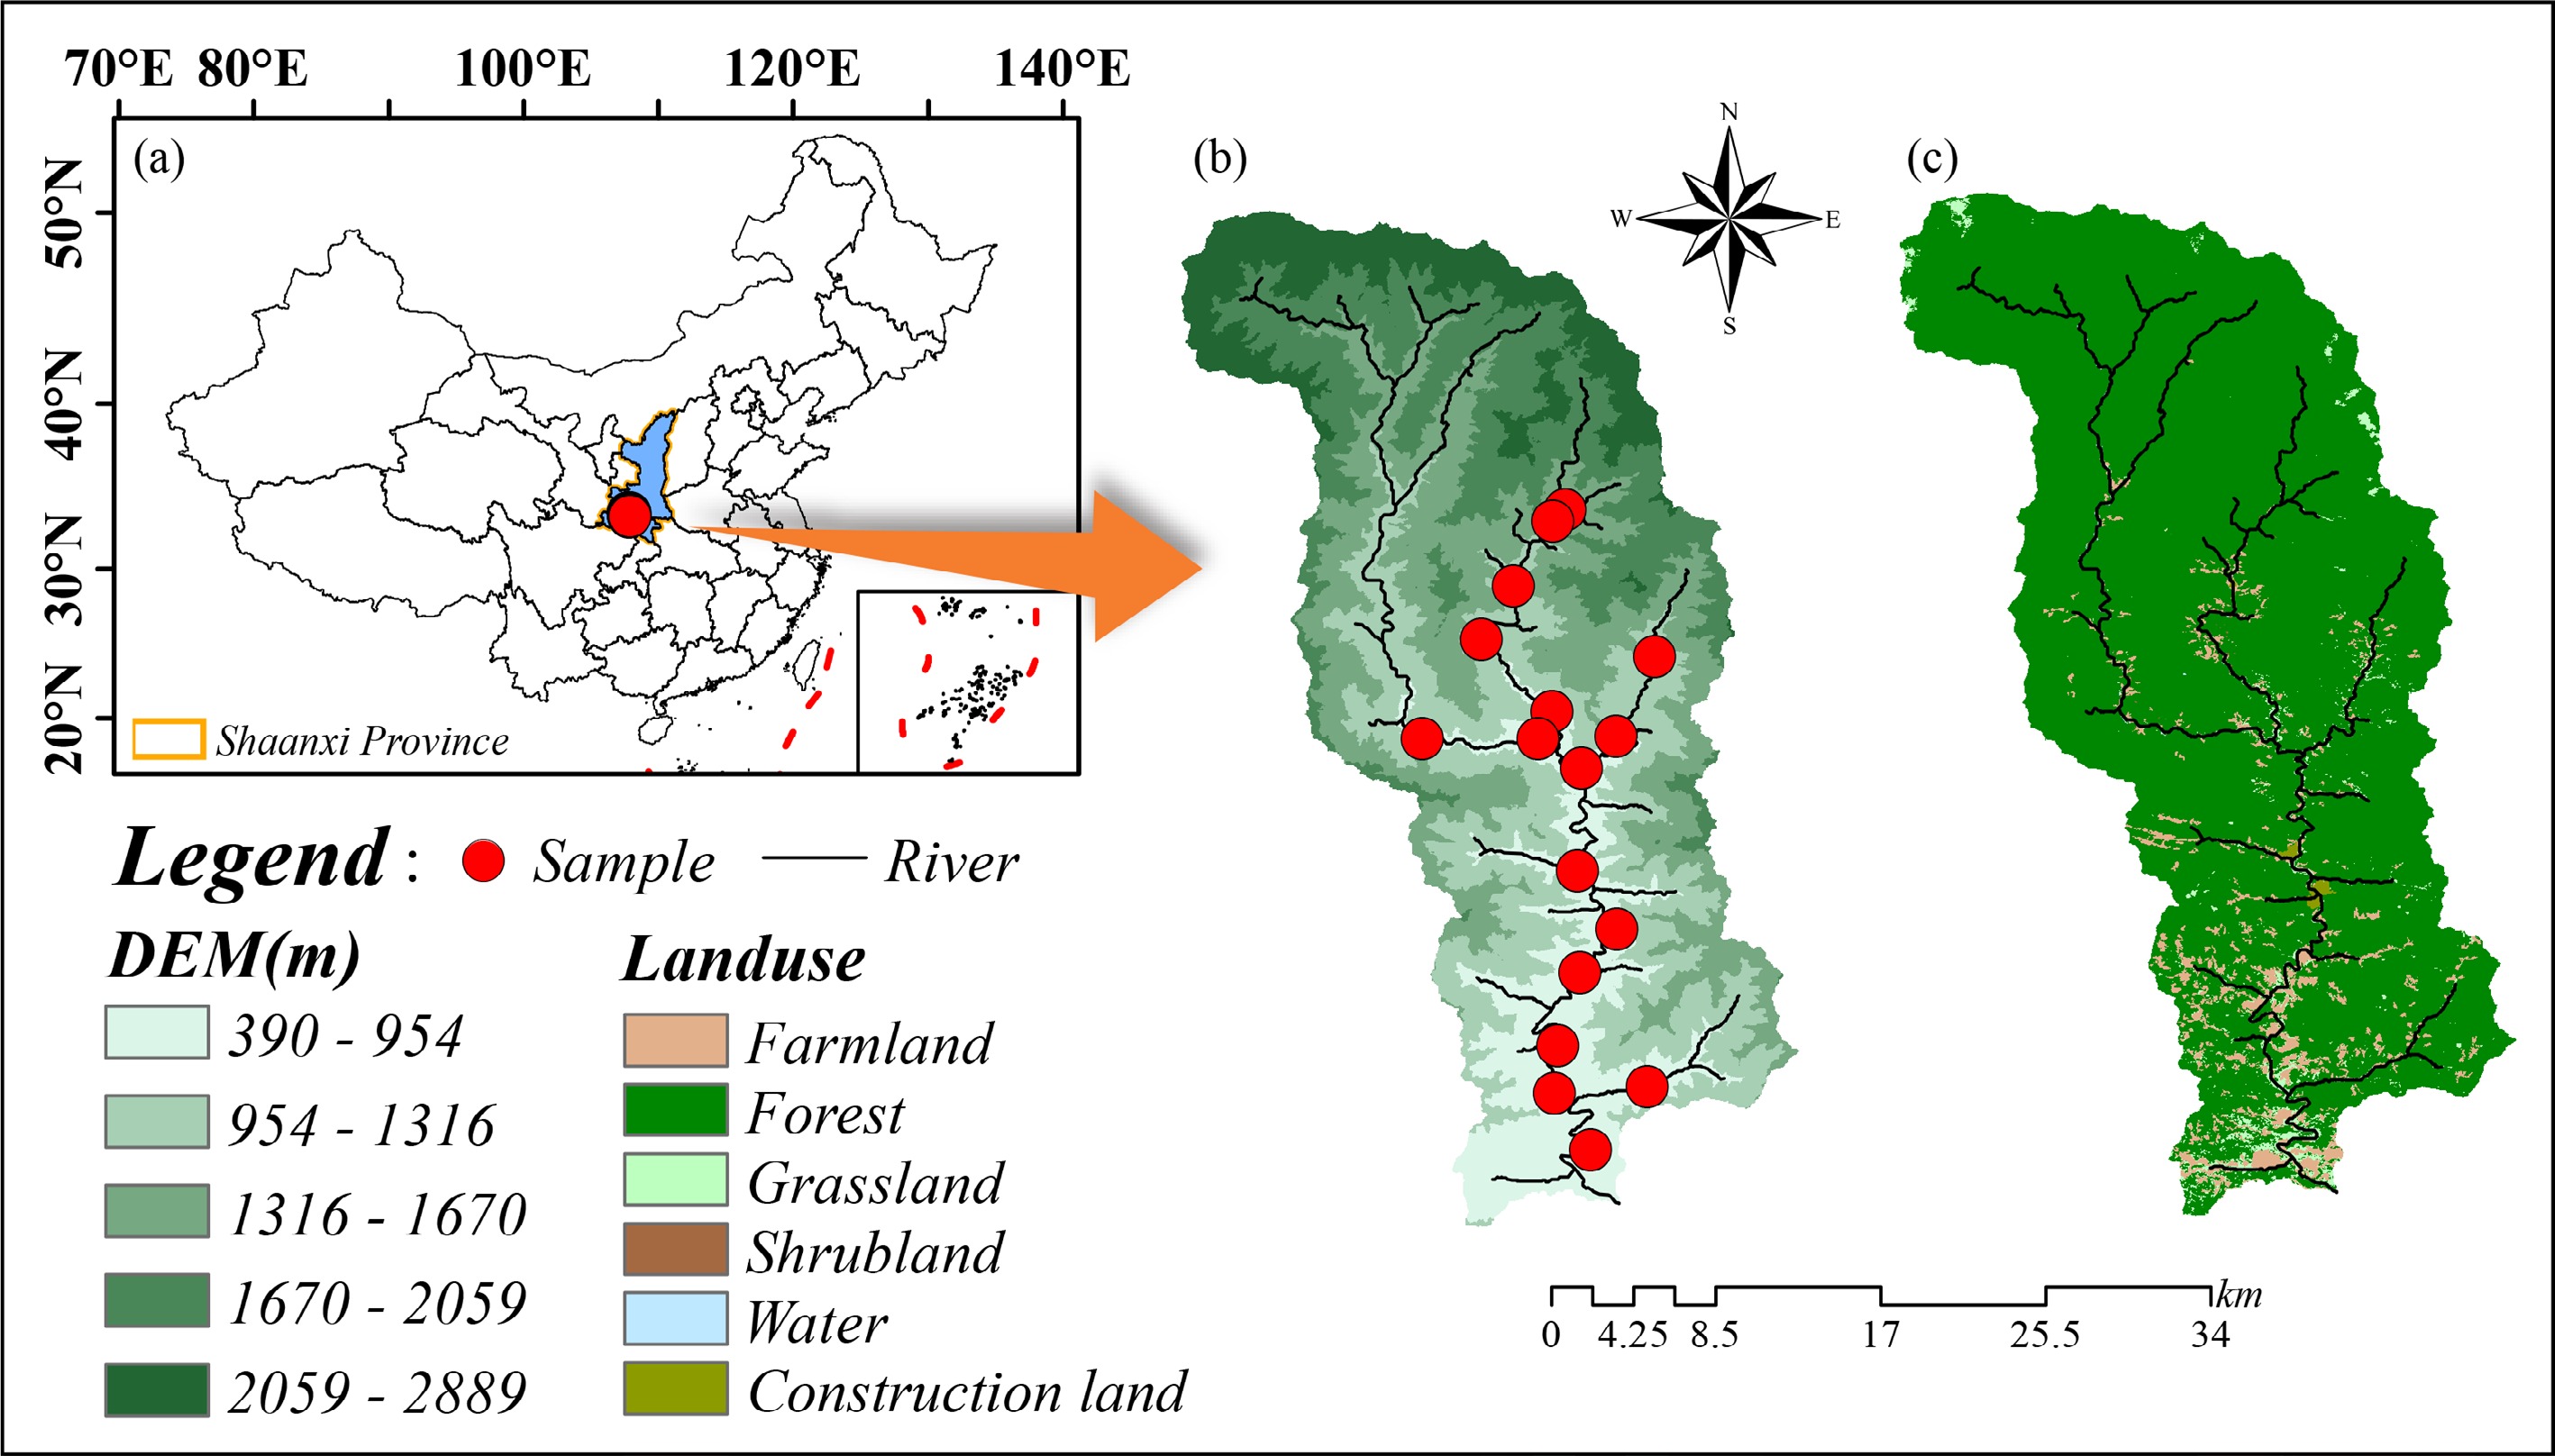
Figure 1.
Locations of the study sites across the Jinshui River. (a) Location of the catchment; (b) the topography of the catchment and the distribution of the sampling sites; (c) the land use types of the catchment.
-
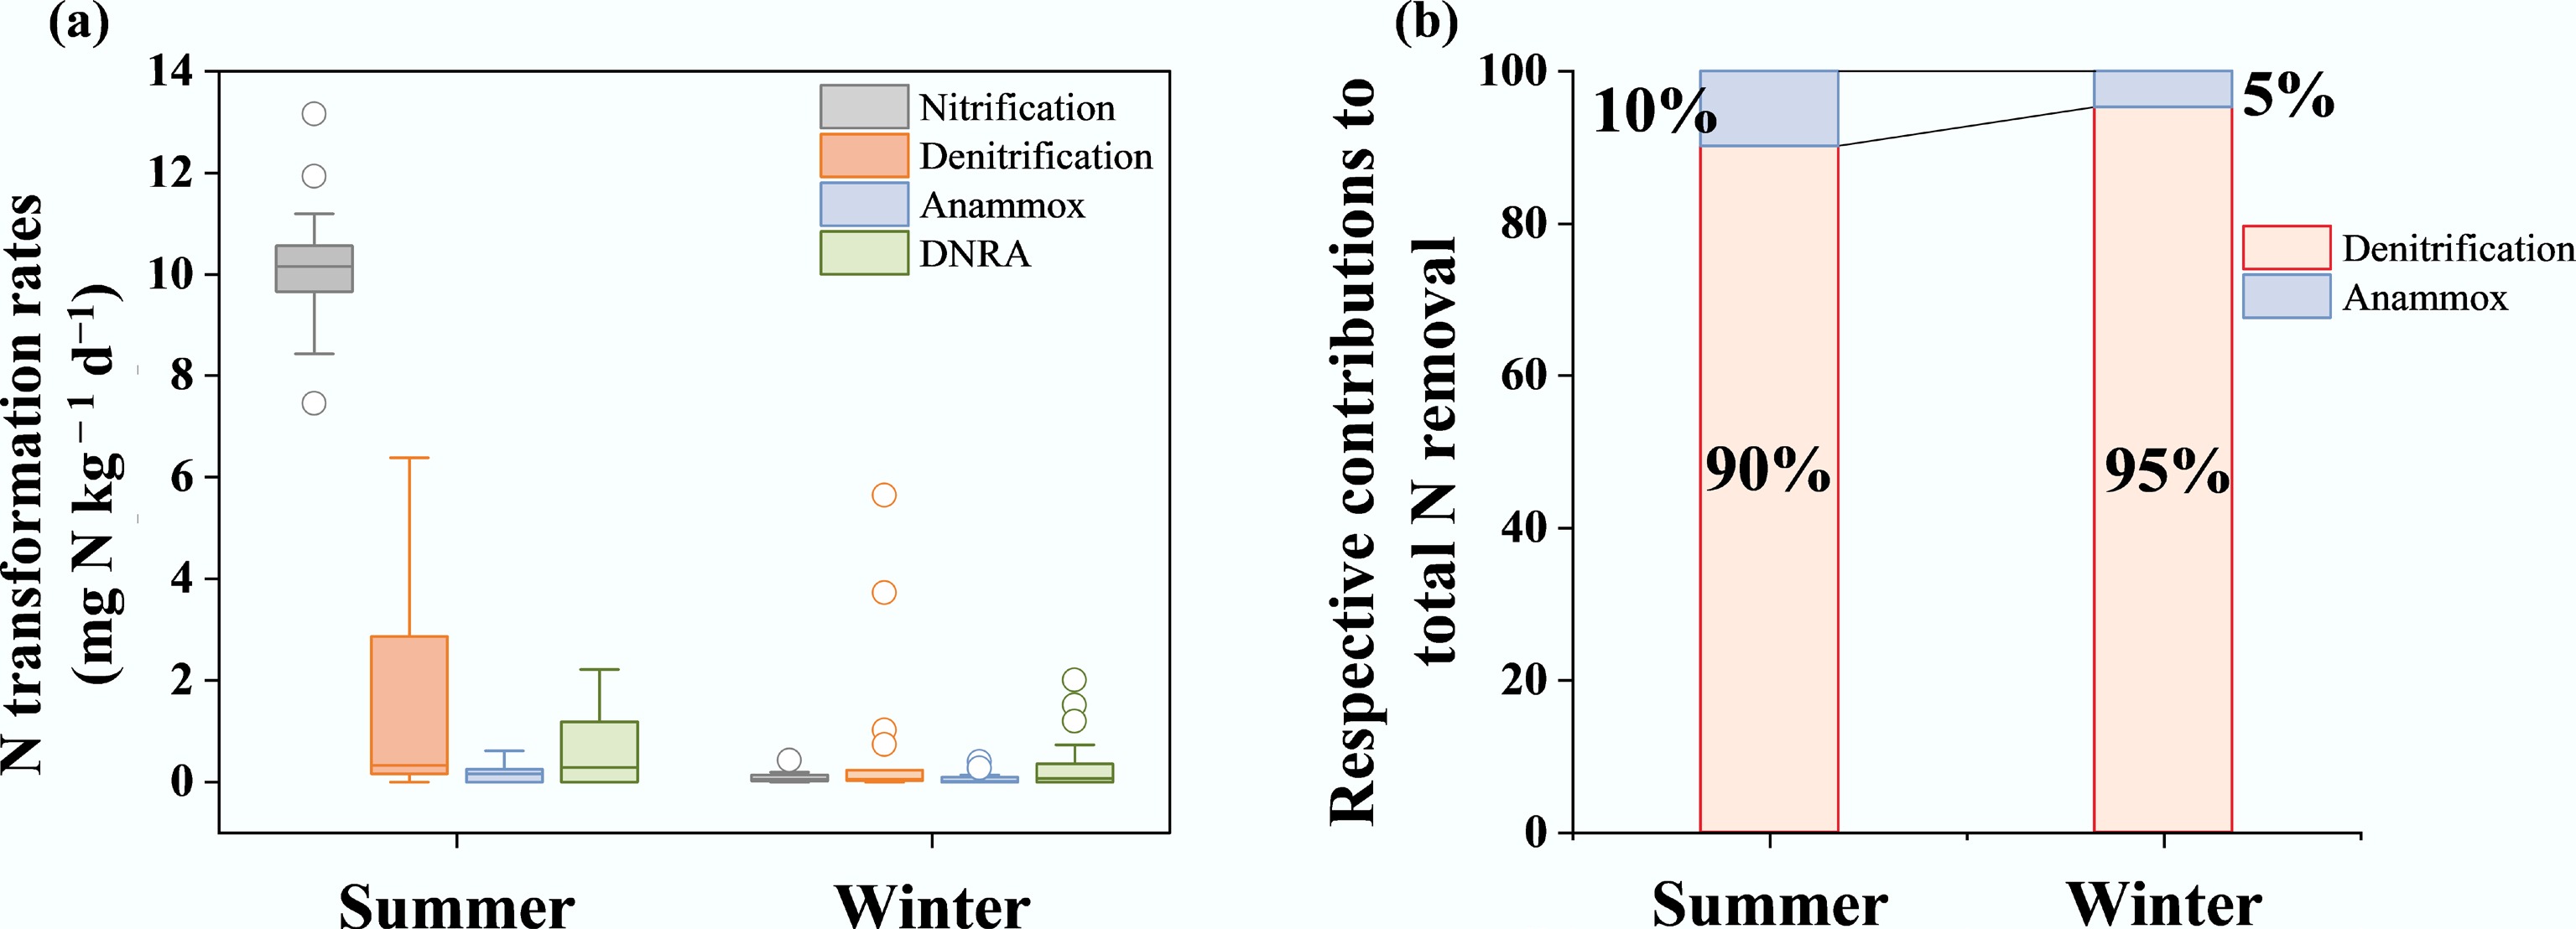
Figure 2.
(a) A box plot displaying the nitrification, denitrification, anammox, and DNRA rates of the sediments in summer and winter. The boxes and whiskers indicate the 5th, 25th, 50th, 75th, and 95th percentiles. The circles are outliers. (b) A bar chart showing the respective contributions of denitrification and anammox to total N removal. The relative contributions of denitrification and anammox were calculated based on the average rates during each season.
-
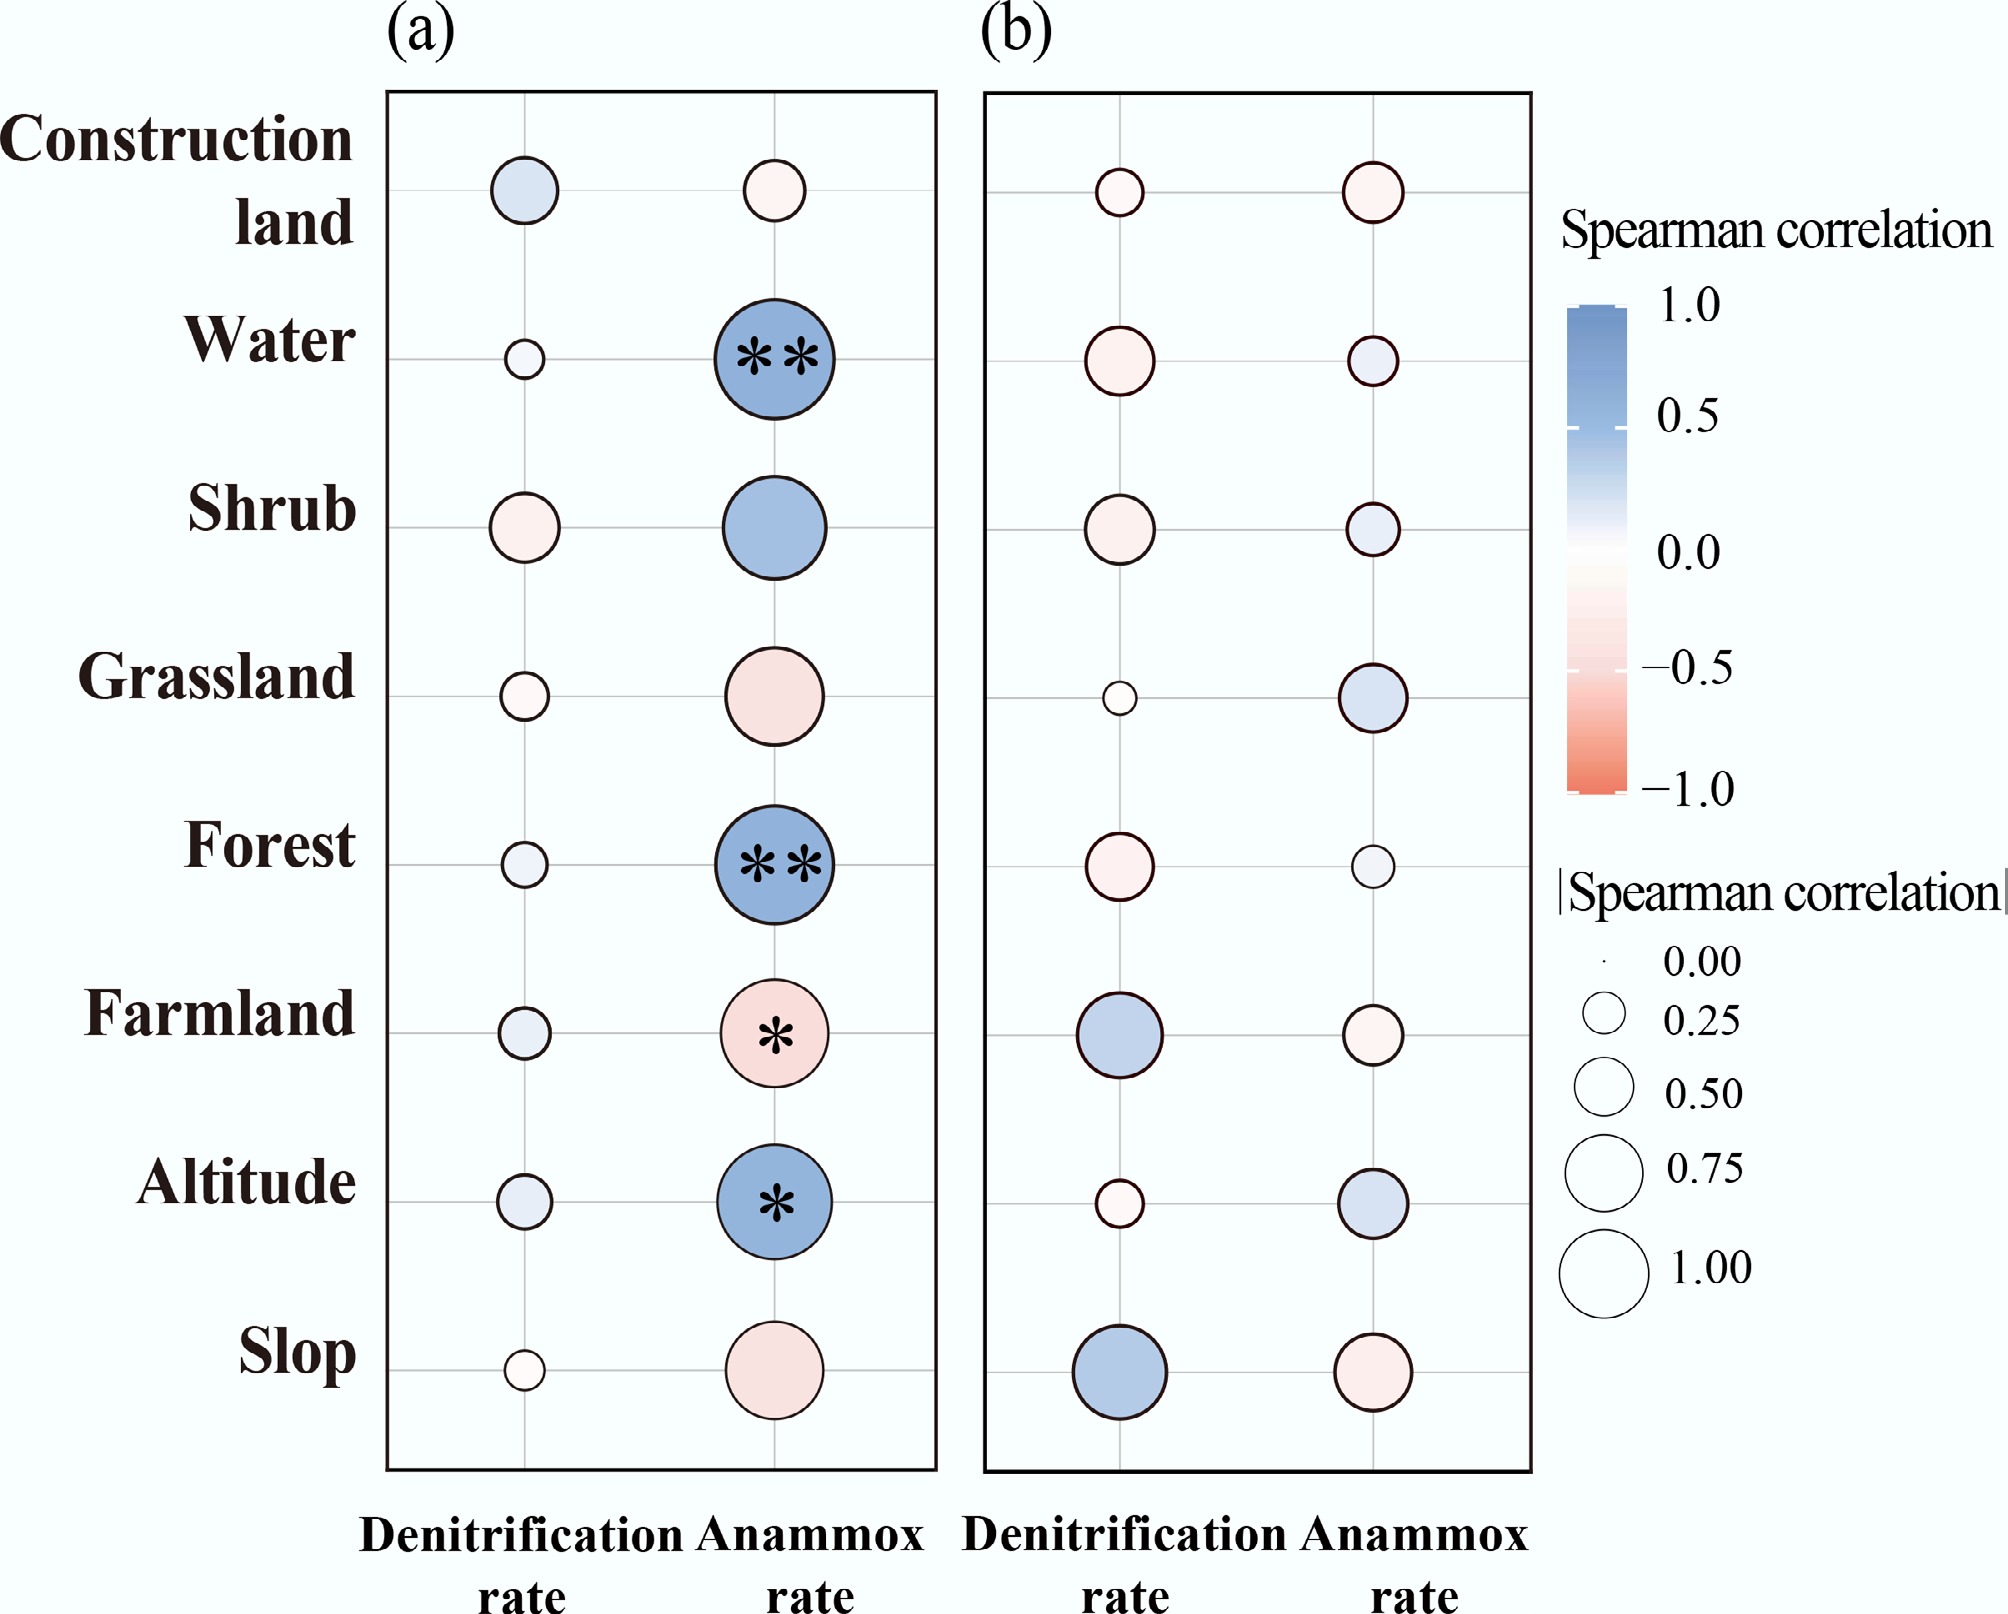
Figure 3.
Correlations of denitrification and anammox rates with geographic factors during (a) summer and (b) winter. * p < 0.05; ** p < 0.01.
-
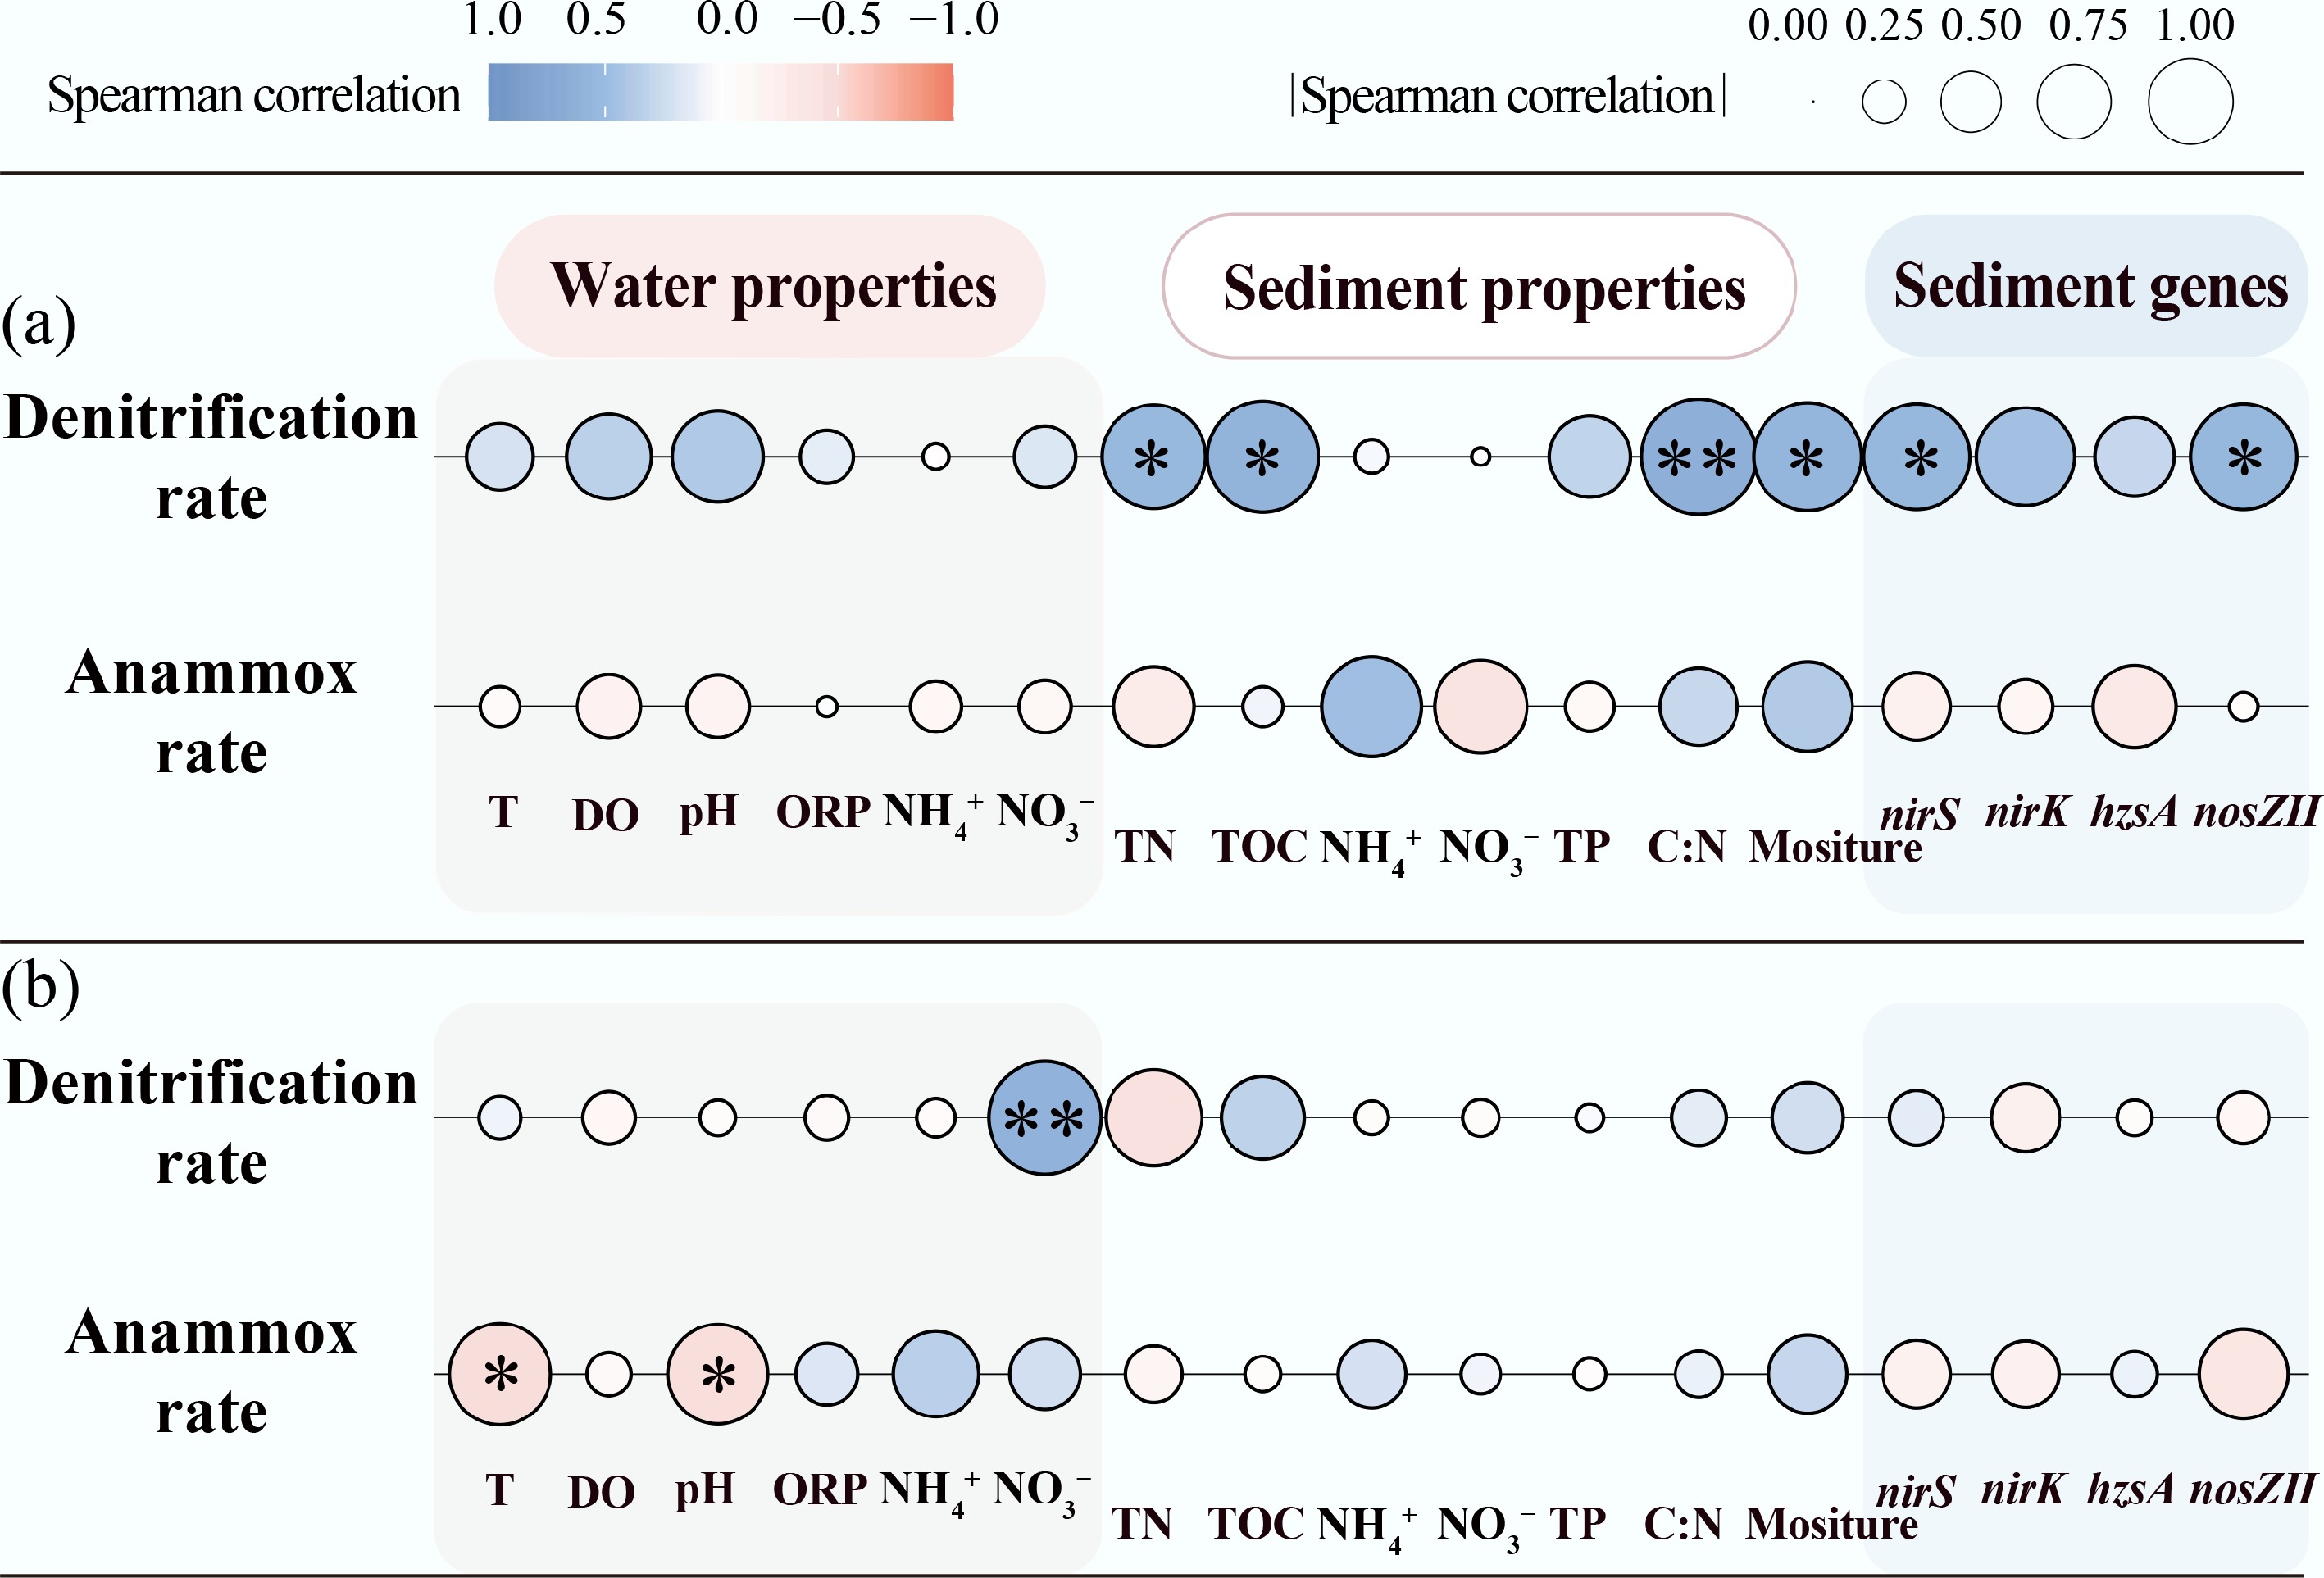
Figure 4.
Correlation of water properties, sediment properties, and abundance of key genes with denitrification and anammox: (a) summer; (b) winter. * p < 0.05; ** p < 0.01.
-
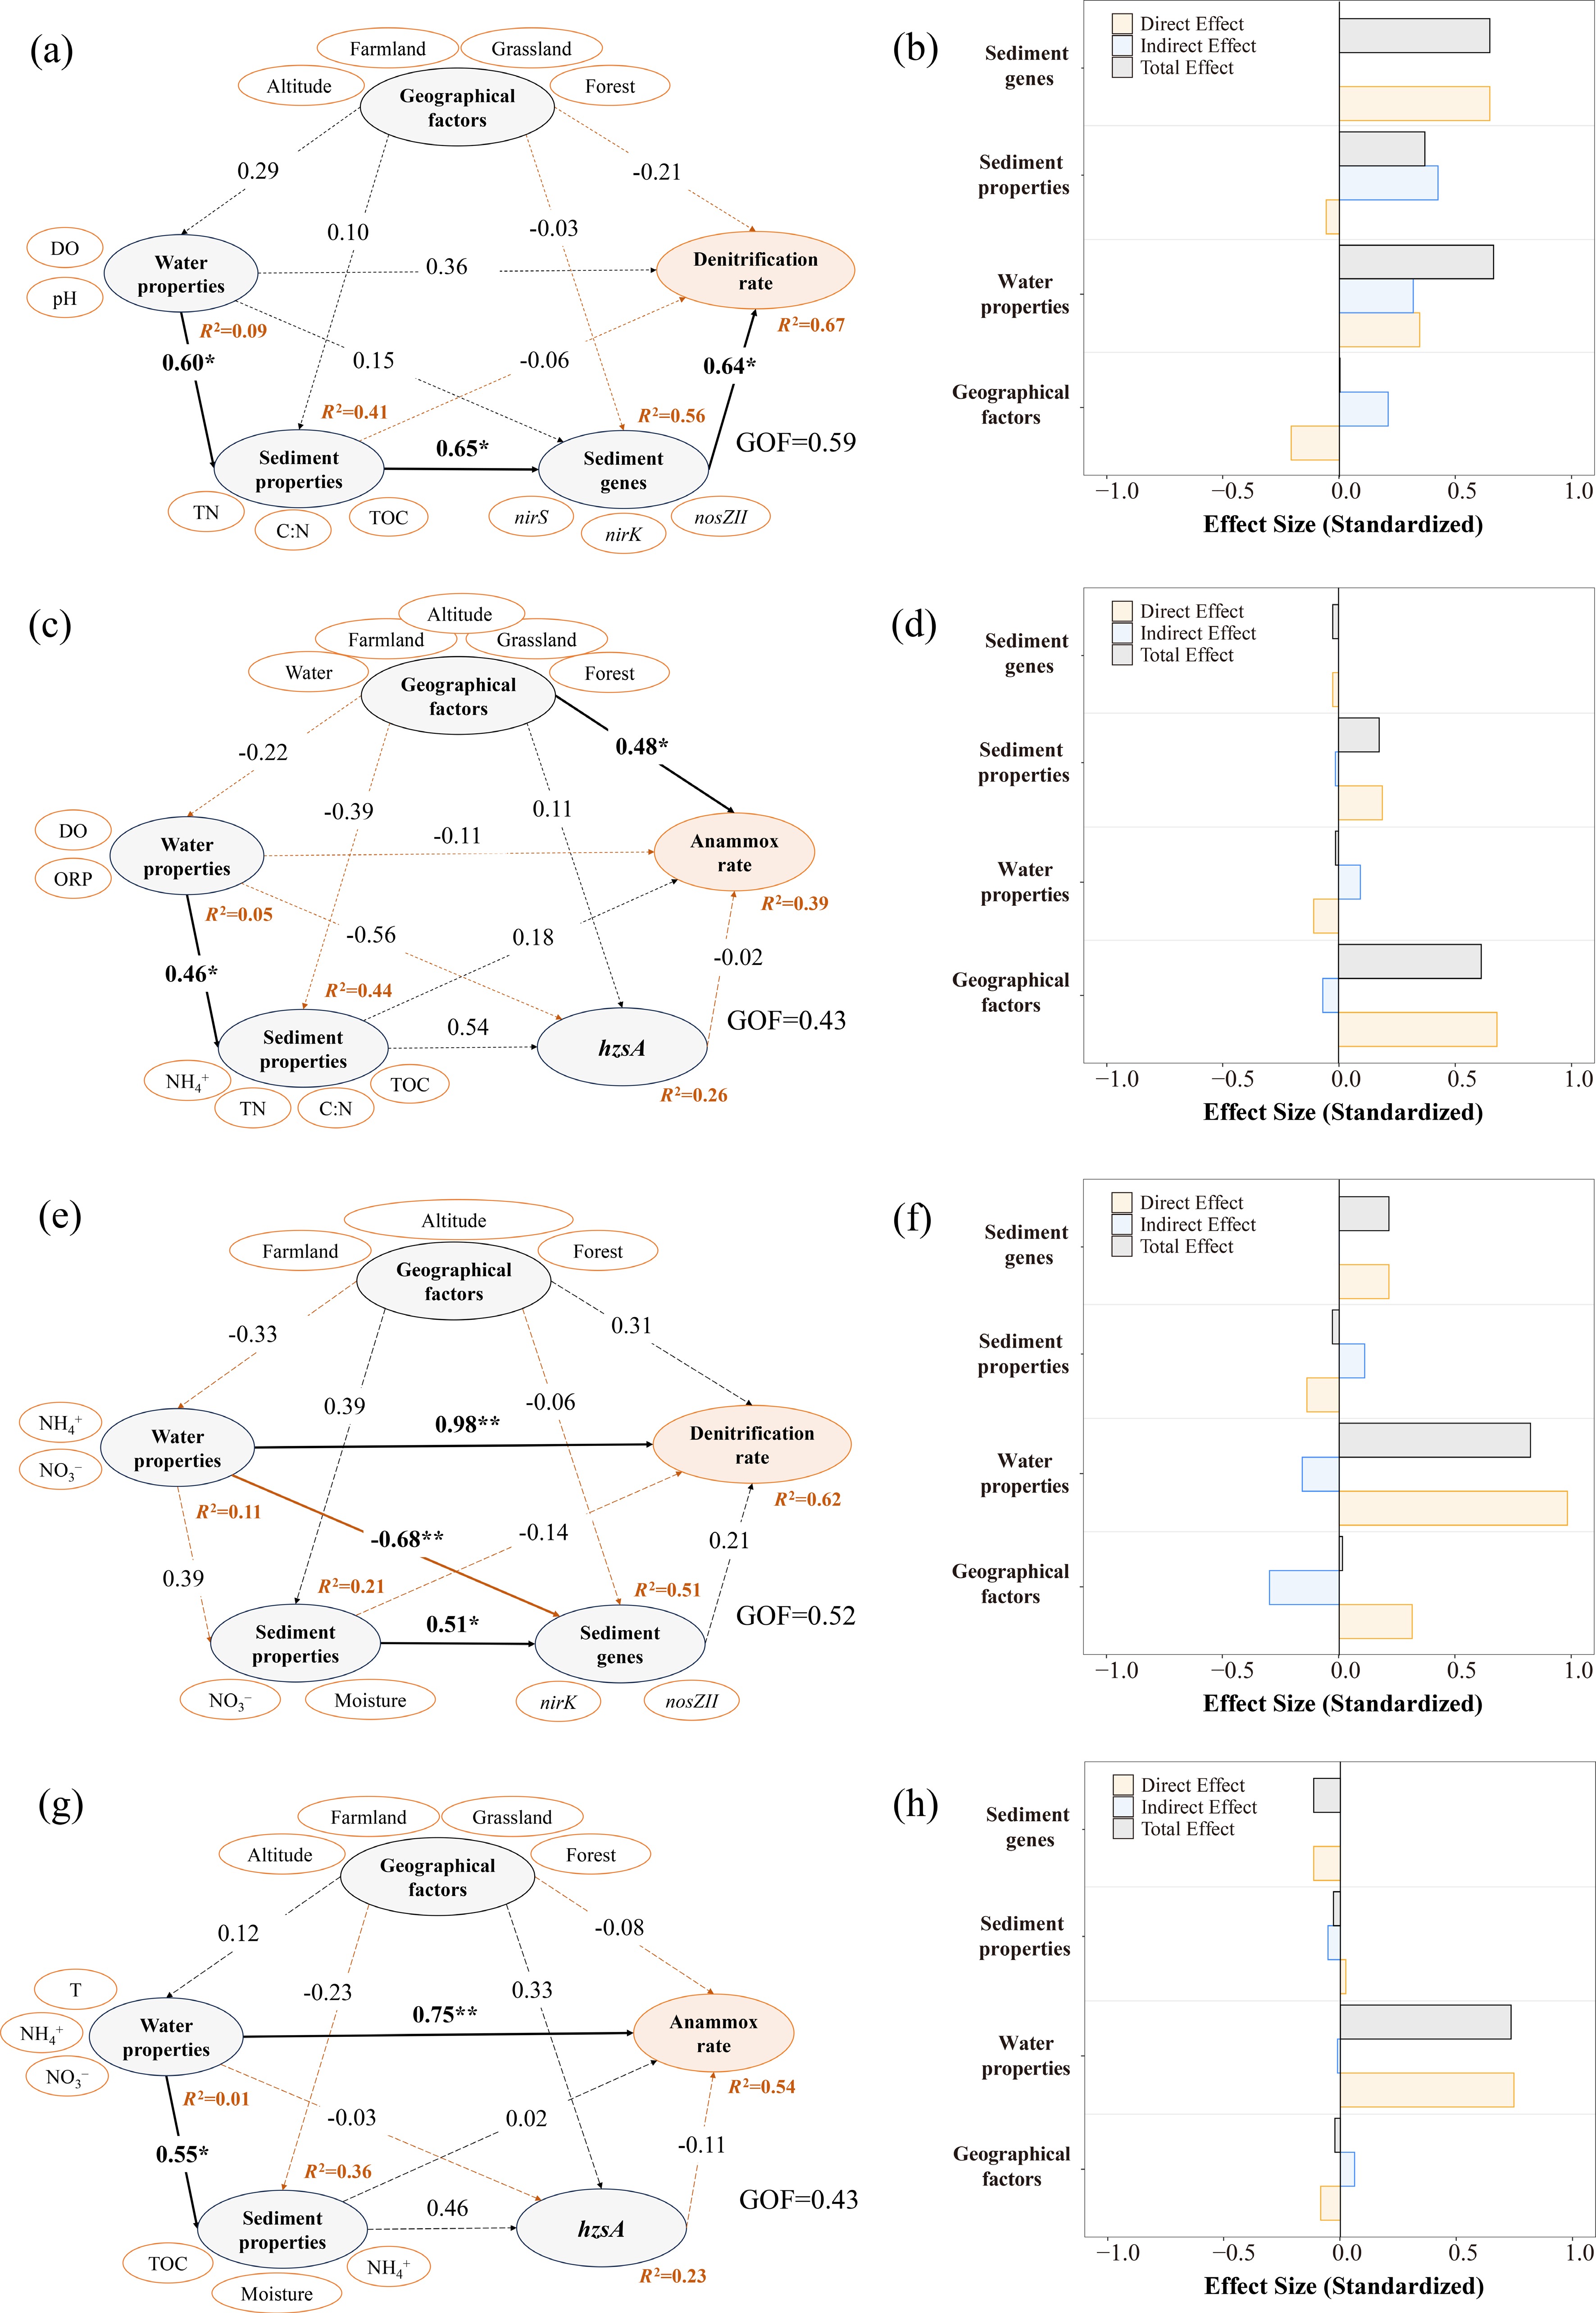
Figure 5.
PLS-PM demonstrates the impacts of geographic and micro-environmental factors on the denitrification and anammox rates in (a)–(d) summer, and (e)–(h) winter. Bold lines indicate significant effects, and dashed lines indicate non-significant effects. Positive and negative pathways are depicted with black and orange lines, respectively. Numbers adjacent to arrows are standardized path coefficients (* p < 0.05; ** p < 0.01; *** p < 0.001). The bar charts represented the normalized direct, indirect, and total effects of factors obtained from PLS-PM.
-
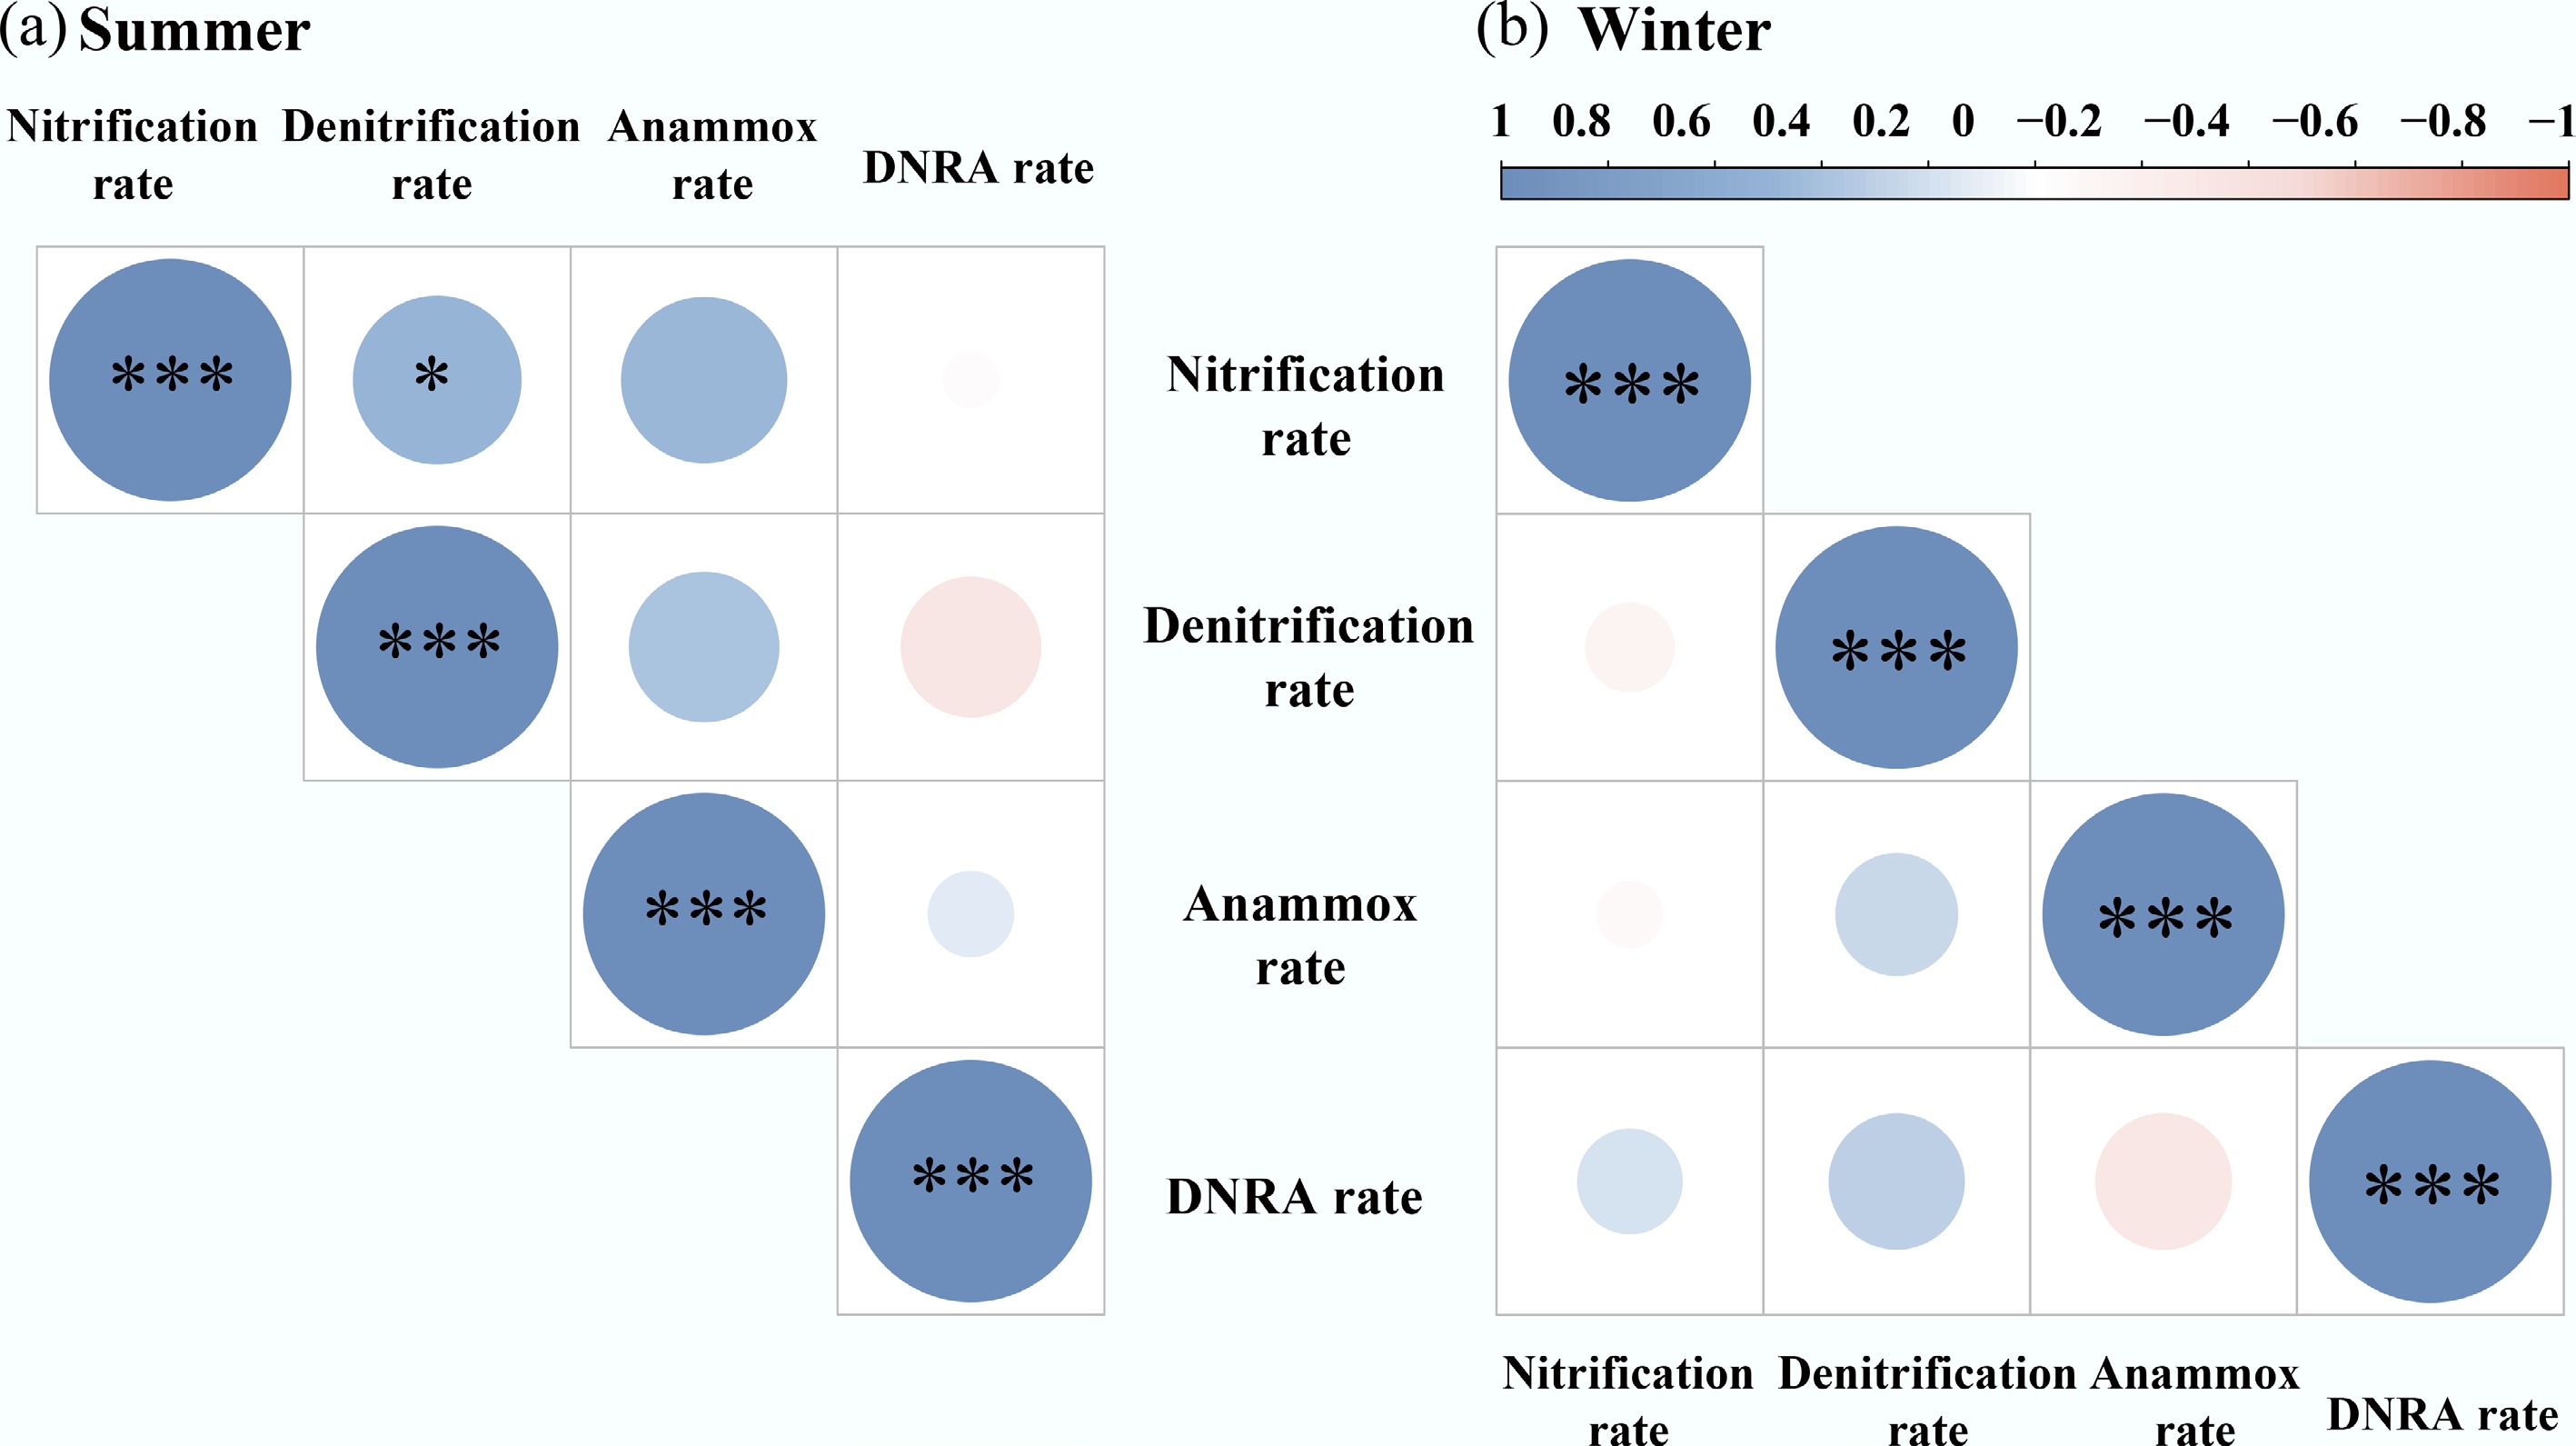
Figure 6.
Correlation coefficients among the N transformation processes in sediments, including net nitrification, denitrification, anammox, and DNRA in (a) summer, and (b) winter. * p < 0.05; *** p < 0.001.
Figures
(6)
Tables
(0)