-
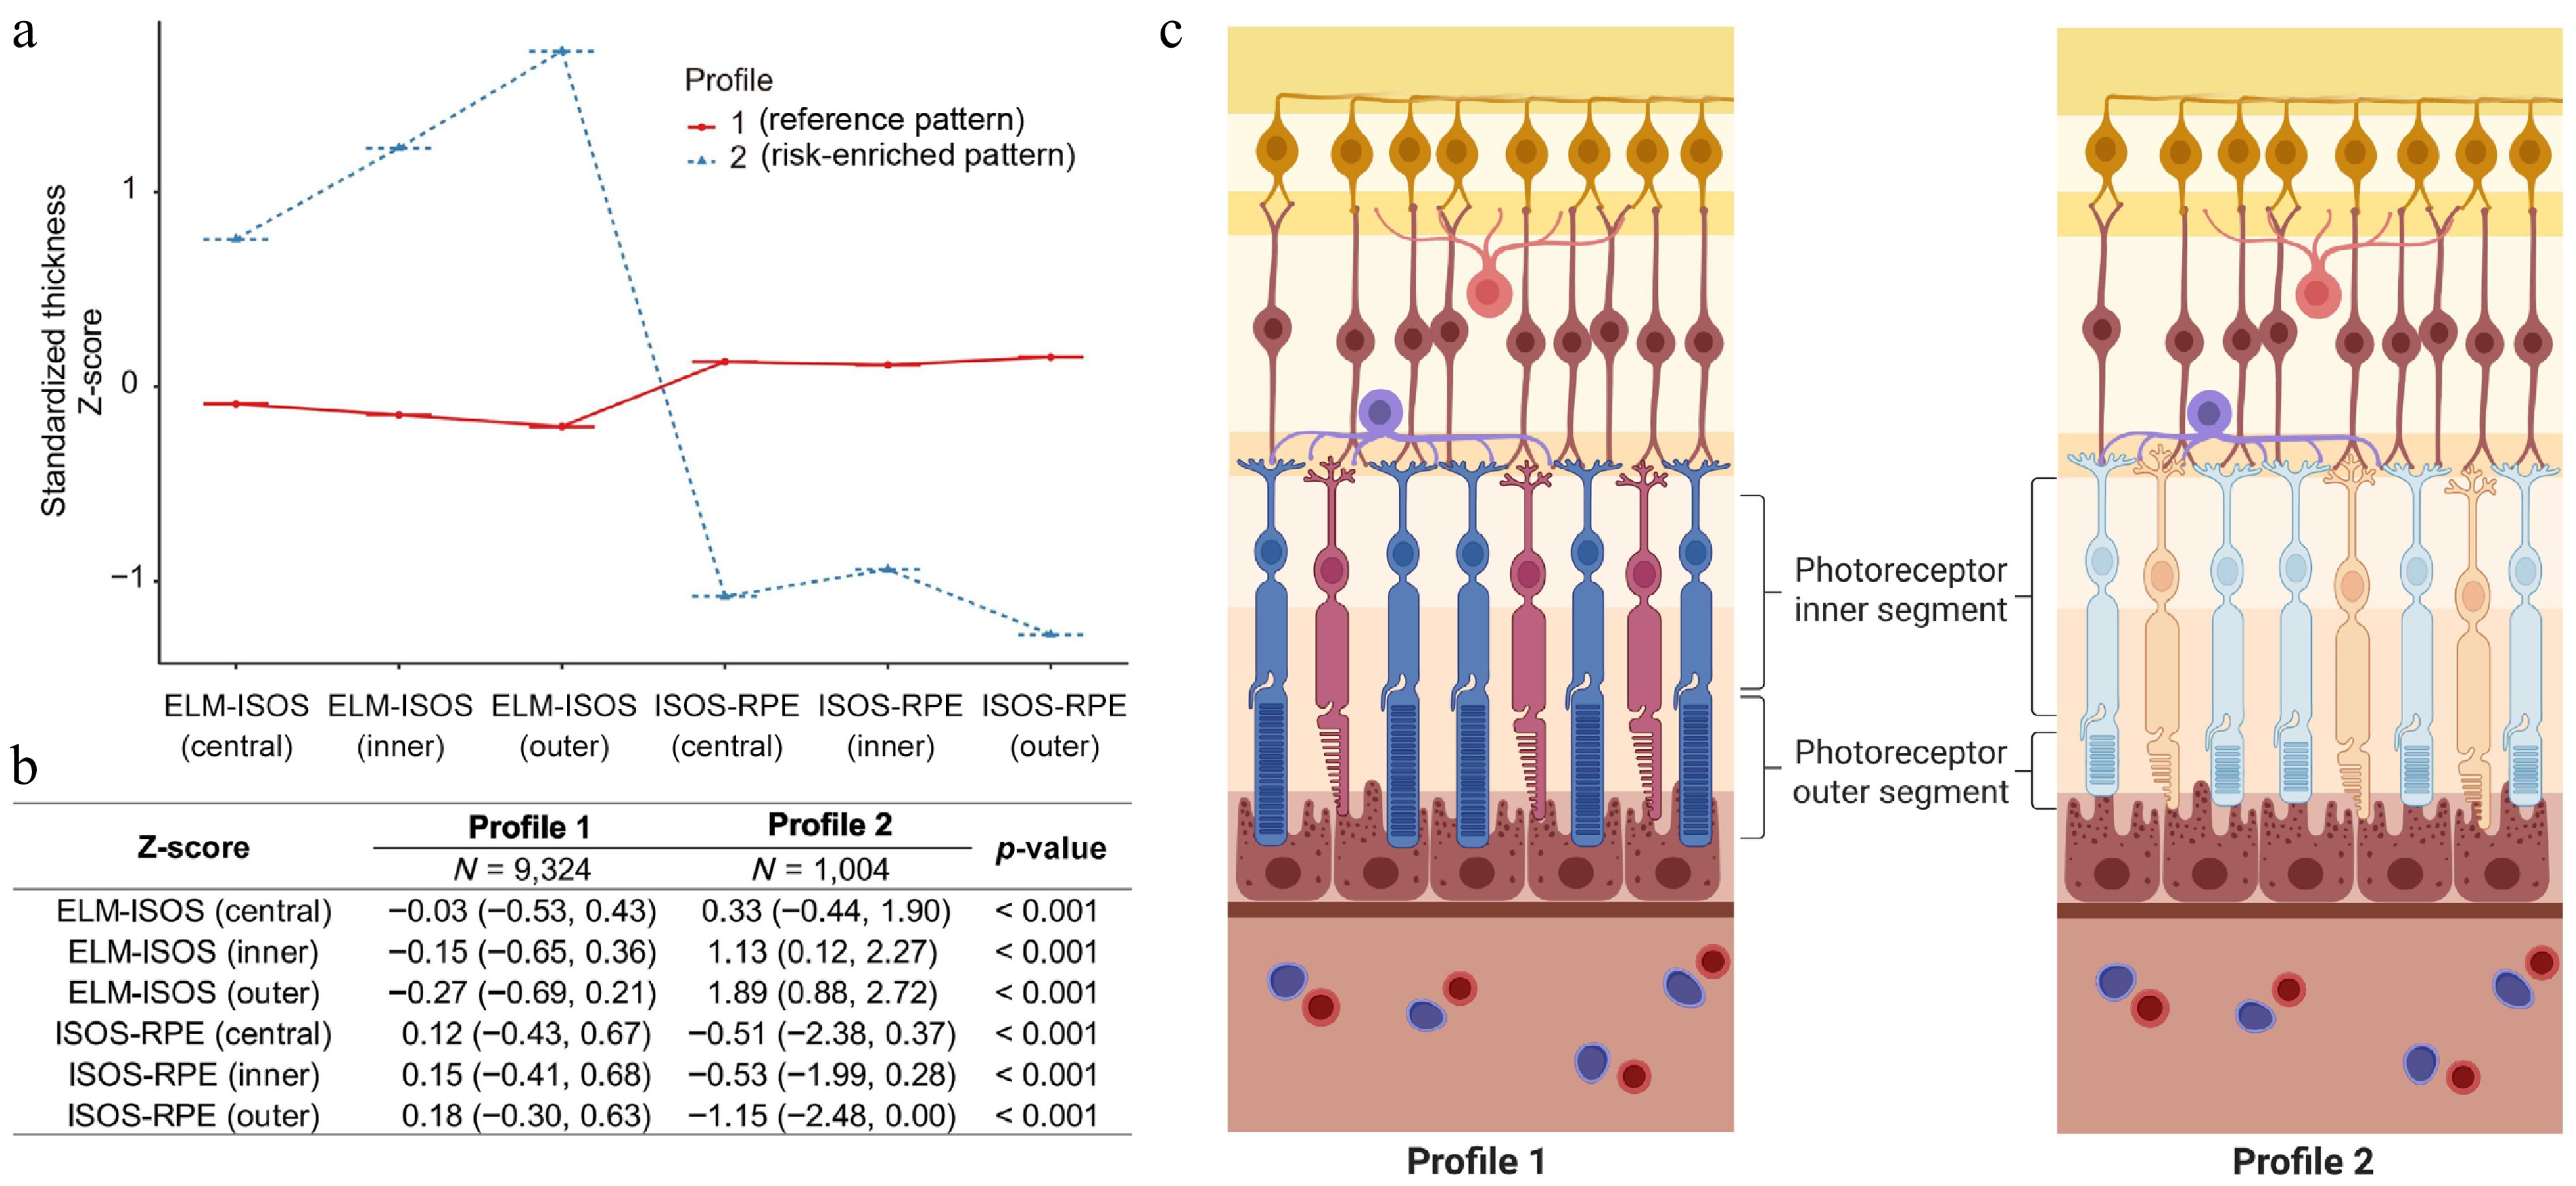
Figure 1.
Distribution of Z-scores for PR thickness, comparing distinct profiles derived via LPA. (a) Distribution of Z-scores among participants. Positive values indicate thicker values relative to the cohort mean; negative values indicate thinner values. (b) Comparison of PR thickness parameters across identified profiles. (c) Visualization of the two identified PR profiles to conceptually summarize the relative differences in the inner and outer PR segments (schematic illustration, not to scale). ELM, external limiting membrane; ISOS, inner and outer PR segments; RPE, retinal pigment epithelium.
-
Model Profile AIC BIC Entropy Sample proportion (smallest class) Sample proportion (largest class) A 2 156,930.18 157,067.79 1.00 0.02 0.98 A 3 147,606.78 147,795.09 0.86 0.02 0.56 A 4 143,841.44 144,080.44 0.83 0.02 0.47 A 5 141,507.19 141,796.89 0.84 0.02 0.44 B 2 151,501.49 151,682.55 0.95 0.07 0.93 B 3 138,565.49 138,840.71 0.88 0.07 0.47 B 4 132,870.19 133,239.56 0.86 0.06 0.39 B 5 130,586.77 131,050.29 0.83 0.06 0.30 C 2 122,149.30 122,395.55 1.00 0.03 0.97 C 3 123,259.51 123,556.46 0.41 0.04 0.53 C 4 119,228.96 119,576.61 0.52 0.00 0.95 C 5 117,364.12 117,762.47 0.62 0.02 0.81 D 2 112,026.30 112,424.64 0.91 0.10 0.90 D 3 109,411.13 110,012.27 0.74 0.09 0.69 D 4 107,692.97 108,496.90 0.75 0.07 0.69 D 5 106,719.06 107,725.78 0.74 0.06 0.53 AIC, Aikake information criterion; BIC, Bayesian information criterion. Table 1.
Model fit indices for the LPA of PR thickness.
-
Characteristics Profile 1 (N = 9,324) Profile 2 (N = 1,004) p-Value Age 55.00 (48.00, 61.00) 56.00 (49.00, 62.00) < 0.001 Gender < 0.001 Female 5,015.00 (53.79%) 460.00 (45.82%) Male 4,309.00 (46.21%) 544.00 (54.18%) Ethnicity 0.193 Non-White 783.00 (8.40%) 97.00 (9.66%) White 8,541.00 (91.60%) 907.00 (90.34%) Education 0.064 College 4,593.00 (49.26%) 526.00 (52.39%) Other levels 4,731.00 (50.74%) 478.00 (47.61%) TDI −1.62 (−3.37, 0.87) −1.44 (−3.26, 1.26) 0.090 BMI 0.451 Underweight 46.00 (0.49%) 7.00 (0.70%) Normal 3,335.00 (35.77%) 338.00 (33.67%) Overweight 3,910.00 (41.93%) 427.00 (42.53%) Obese 2,033.00 (21.80%) 232.00 (23.11%) Ideal physical activity 0.146 No 3,758.00 (40.30%) 429.00 (42.73%) Yes 5,566.00 (59.70%) 575.00 (57.27%) Sleep duration 7.00 (6.00, 8.00) 7.00 (6.00, 8.00) 0.995 Smoking status 0.495 Never 5,017.00 (53.81%) 556.00 (55.38%) Previous 3,258.00 (34.94%) 332.00 (33.07%) Current 1,049.00 (11.25%) 116.00 (11.55%) Drinking status 0.376 Never 364.00 (3.90%) 43.00 (4.28%) Previous 336.00 (3.60%) 44.00 (4.38%) Current 8,624.00 (92.49%) 917.00 (91.33%) HBP 0.043 No 7,090.00 (76.04%) 734.00 (73.11%) Yes 2,234.00 (23.96%) 270.00 (26.89%) Diabetes 0.405 No 8,874.00 (95.17%) 949.00 (94.52%) Yes 450.00 (4.83%) 55.00 (5.48%) IOP 15.80 (13.80, 18.02) 15.96 (13.71, 18.18) 0.320 MSE −2.18 (−3.72, −1.29) −2.85 (−4.87, −1.72) < 0.001 BMI, body mass index; TDI, Townsend deprivation index; HBP, high blood pressure; IOP, intraocular pressure; MSE, mean spherical equivalent. Non-normally distributed variables are presented as median (interquartile range, IQR) and compared using the Wilcoxon rank-sum test. Categorical variables are expressed as numbers (percentages) and compared using the χ2 test. Table 2.
Baseline characteristics of the participants between PR thickness profiles.
-
Model 1 Model 2 Model 3 HR (95% CI) p-Value p-Value for interaction HR (95% CI) p-Value p-Value for interaction HR (95% CI) p-Value p-Value for interaction Overall 2.23 (1.35−3.68) 0.002 − 2.12 (1.28−3.50) 0.003 − 1.79 (1.07−2.99) 0.027 − Subgroup analysis Age group Middle-aged adults 2.30 (1.20−4.43) 0.012 0.818 2.23 (1.16−4.29) 0.017 0.807 2.10 (1.08−4.06) 0.028 0.712 Older adults 2.05 (0.94−4.47) 0.070 1.99 (0.91−4.34) 0.083 1.89 (0.86−4.15) 0.114 Gender Female 1.57 (0.61−4.00) 0.347 0.404 1.55 (0.61−3.96) 0.360 0.405 1.34 (0.51−3.51) 0.550 0.388 Male 2.50 (1.37−4.55) 0.003 2.47 (1.35−4.50) 0.003 2.24 (1.22−4.10) 0.009 Ethnicity Non-White 3.24 (0.63−16.72) 0.160 0.641 2.88 (0.56−14.94) 0.208 0.639 2.04 (0.37−11.29) 0.412 0.598 White 2.16 (1.28−3.66) 0.004 2.06 (1.21−3.49) 0.007 1.88 (1.10−3.20) 0.021 Ideal physical activity No 1.06 (0.37−2.98) 0.916 0.073 1.00 (0.35−2.83) 0.999 0.075 0.96 (0.34−2.73) 0.939 0.070 Yes 3.15 (1.76−5.64) < 0.001 3.00 (1.68−5.39) < 0.001 2.65 (1.47−4.78) 0.001 Sleep duration Long 2.98 (1.34−6.60) 0.007 0.377 2.69 (1.21−5.99) 0.015 0.392 2.50 (1.11−5.64) 0.027 0.370 Short 1.88 (0.99−3.60) 0.055 1.84 (0.96−3.51) 0.067 1.68 (0.87−3.23) 0.120 IOP High 1.54 (0.73−3.27) 0.255 0.150 1.44 (0.68−3.06) 0.340 0.141 1.36 (0.64−2.89) 0.426 0.190 Low 3.24 (1.64−6.41) 0.001 3.19 (1.61−6.31) 0.001 2.66 (1.33−5.35) 0.006 MSE High 2.16 (0.84−5.58) 0.112 0.918 2.13 (0.82−5.51) 0.120 0.894 2.04 (0.79−5.31) 0.142 0.822 Low 2.04 (1.13−3.68) 0.018 1.88 (1.04−3.40) 0.038 1.84 (1.01−3.35) 0.045 HR, hazard ratio; CI, confidence interval; IOP, intraocular pressure; MSE, mean spherical equivalent. Profile 1 PR thickness was set as the reference. In the subgroup analysis, sleep duration, IOP, and MSE were reorganized as binary variables based on the median levels of the participants. Table 3.
Associations between PR thickness profiles and the incidence of RD among individuals with myopia.
Figures
(1)
Tables
(3)