-
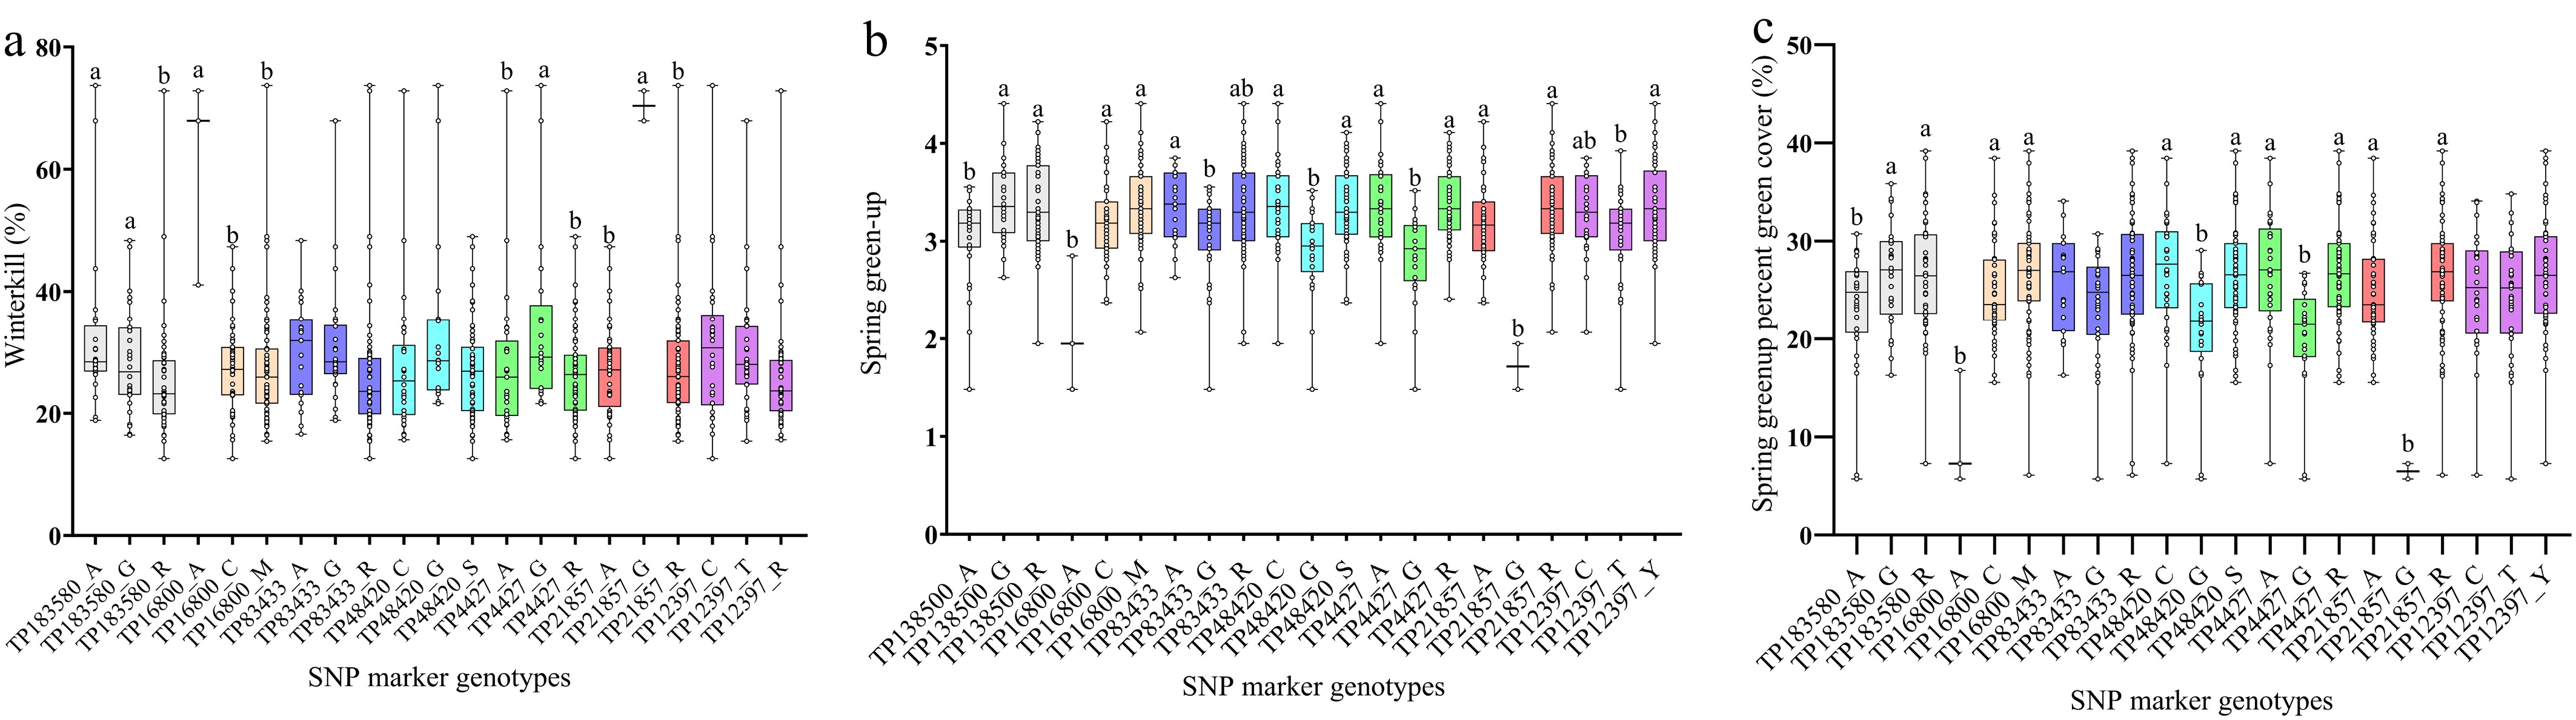
Figure 1.
Phenotype analysis of SNP markers for winterkill (a), spring green-up (b), and spring green-up percent green cover (c) based on the winter hardiness data reported by Yu et al.[10]. The x-axis is the SNP marker alleles, and the y-axis is the mean phenotype of each trait. Dots in bars indicate the phenotypical value of plants. Within each SNP marker, different letters indicate that the mean phenotypical values of each allele type are significantly different at the 0.05 probability level according to a pairwise t-test.
-
KASP markera QTLb Chromosome Position Allele Allele-specific primerc Non-allele-specific primer TP183580-KASP1 QCTSG3/QCTWK2 3 56,078,869 A/G ACGCCACTGCCGTAAGAGCTGa/g ACCTGCGGTACCAGATGCTTCT TP16800-KASP1 QCTSG1/QCTWK1 9 16,202,201 A/C AGTCGTCGGGCAGCACGGGa/c CGGTCGTCCACCATCCCTGCATT TP16800-KASP3 QCTSG1/QCTWK1 9 16,202,201 A/C GAGTCGTCGGGCAGCACGGGa/c GCGCTGTCTTCAGGTCACAGT TP83433-KASP1 QCTSG3/QCTWK2 3 55,932,542 A/G AGTCCGGACGCAAATGGCTGAa/g CGCTGCAGCGCGATTCATGATG TP83433-KASP3 QCTSG3/QCTWK2 3 55,932,542 A/G CGGATTTTTGCGGTTGGATGTt/c ACCAAAGCCTACGCTCCTGAC TP48420-KASP2 QCTSG2 1 8,390,517 C/G CACGGAAGACAAACCGTAATTCCc/g CGCCTCCGTTCTTTGGTAAGTCGTT TP48420-KASP3 QCTSG2 1 8,390,517 C/G GTGATAAAAAGGGTCCAGCGAc/g CCAGAAATAATTCCACGGCC TP48420-KASP4 QCTSG2 1 8,390,517 C/G GTGATAAAAAGGGTCCAGCGAc/g CGAAAGCAACGTCTGGTACTG TP4427-KASP2 QCTSG2 1 8,174,024 C/T CACCACCACGTAGCTCCCc/t CAGACCGGAACTGACAAAACTCGC TP21857-KASP1 QCTSG1/QCTWK1 9 16,588,718 A/G GCCCGGAAGAGCTAGCGCTt/c TCAAGTGCCTGGAGACGAGAG TP21857-KASP3 QCTSG1/QCTWK1 9 16,588,718 A/G GGCCCGGAAGAGCTAGCGCTt/c AGATGTTCACGTGGGGCACGT TP12397-KASP3 QCTSG3/QCTWK2 3 54,083,563 A/G AGCACCACGTTGTGCTCGGAc/t GCTTCAACGAGAGCCTGCTCT TP12397-KASP5 QCTSG3/QCTWK2 3 54,083,563 A/G AGCACCACGTTGTGCTCGGAc/t TCCGTGGCCATACTCTTGGATC a Markers were designed based on the SNP sequences published in Yu et al.[10]. Multiple primer pairs were designed for each SNP. b The designed KASP markers are located within the QTL regions identified by Yu et al.[10]. c The last two letters separated by a backslash are the SNP. Table 1.
A list of primers for SNP-based KASP that were tightly linked to winter hardiness QTL and their putative physical locations in the African bermudagrass reference genome.
-
Dataseta Traitb Cross-validationc GBLUP RF 19K WK Fivefold 0.11 ± 0.06 0.24 ± 0.06 LOO −0.10 0.22 SG Fivefold 0.43 ± 0.04 0.48 ± 0.06 LOO 0.43 0.52 SGPGC Fivefold 0.29 ± 0.05 0.38 ± 0.06 LOO 0.25 0.42 609 WK Fivefold 0.14 ± 0.06 0.35 ± 0.05 LOO 0.00 0.37 SG Fivefold 0.43 ± 0.04 0.50 ± 0.05 LOO 0.43 0.56 SGPGC Fivefold 0.30 ± 0.05 0.39 ± 0.05 LOO 0.26 0.42 153 WK Fivefold 0.13 ± 0.05 0.47 ± 0.04 LOO −0.06 0.53 SG Fivefold 0.36 ± 0.04 0.37 ± 0.05 LOO 0.35 0.35 SGPGC Fivefold 0.23 ± 0.05 0.30 ± 0.05 LOO 0.18 0.30 a Three datasets represent low, medium, and high-quality SNP markers that comprise 19,460, 609, and 153 SNPs, respectively. b Winterkill was visually rated on a scale from 0% to 100%, where 0 = no winterkill and 100% = complete winterkill. Spring green-up was visually rated on a scale from 1 to 9 where 1 = dormant turf and 9 = fully green turf. Spring green-up percent green cover measured by digital image analysis, calculating the percentage of live cover on a scale from 0% to 100%, where 0% = no green cover and 100% = the whole plot is green. All data are derived from Yu et al.[10]. c Fivefold and leave-one-out (LOO) cross-validation was used to determine the predictive accuracy. Table 2.
Genomic prediction accuracies for winter hardiness measured by winterkill (WK), spring green-up (SG), spring green-up percent green cover (SGPGC) using genomic best linear unbiased prediction (GBLUP) and random forest (RF) models, based on three marker datasets.
Figures
(1)
Tables
(2)