-
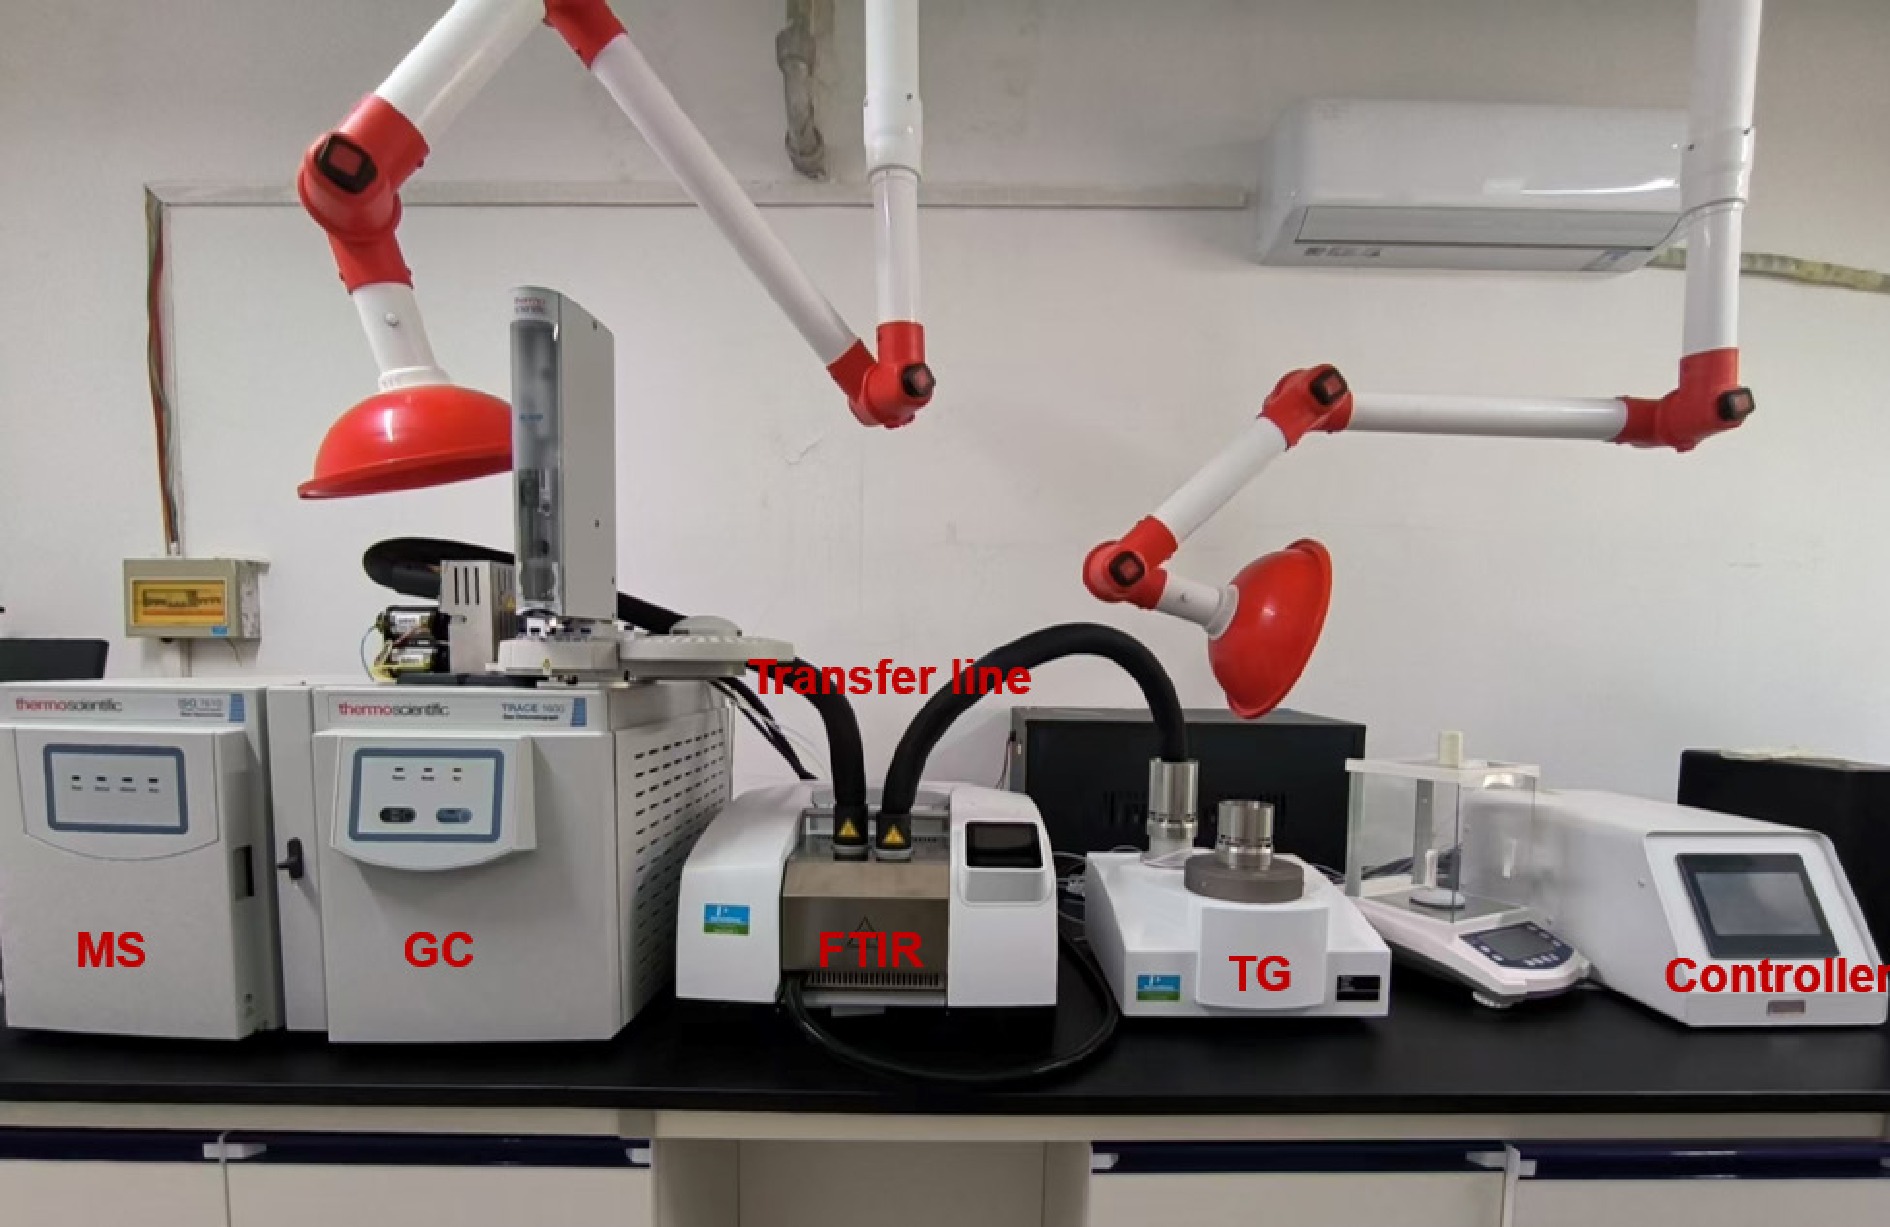
Figure 1.
Photograph of the TG-FTIR-GC/MS experimental setup.
-
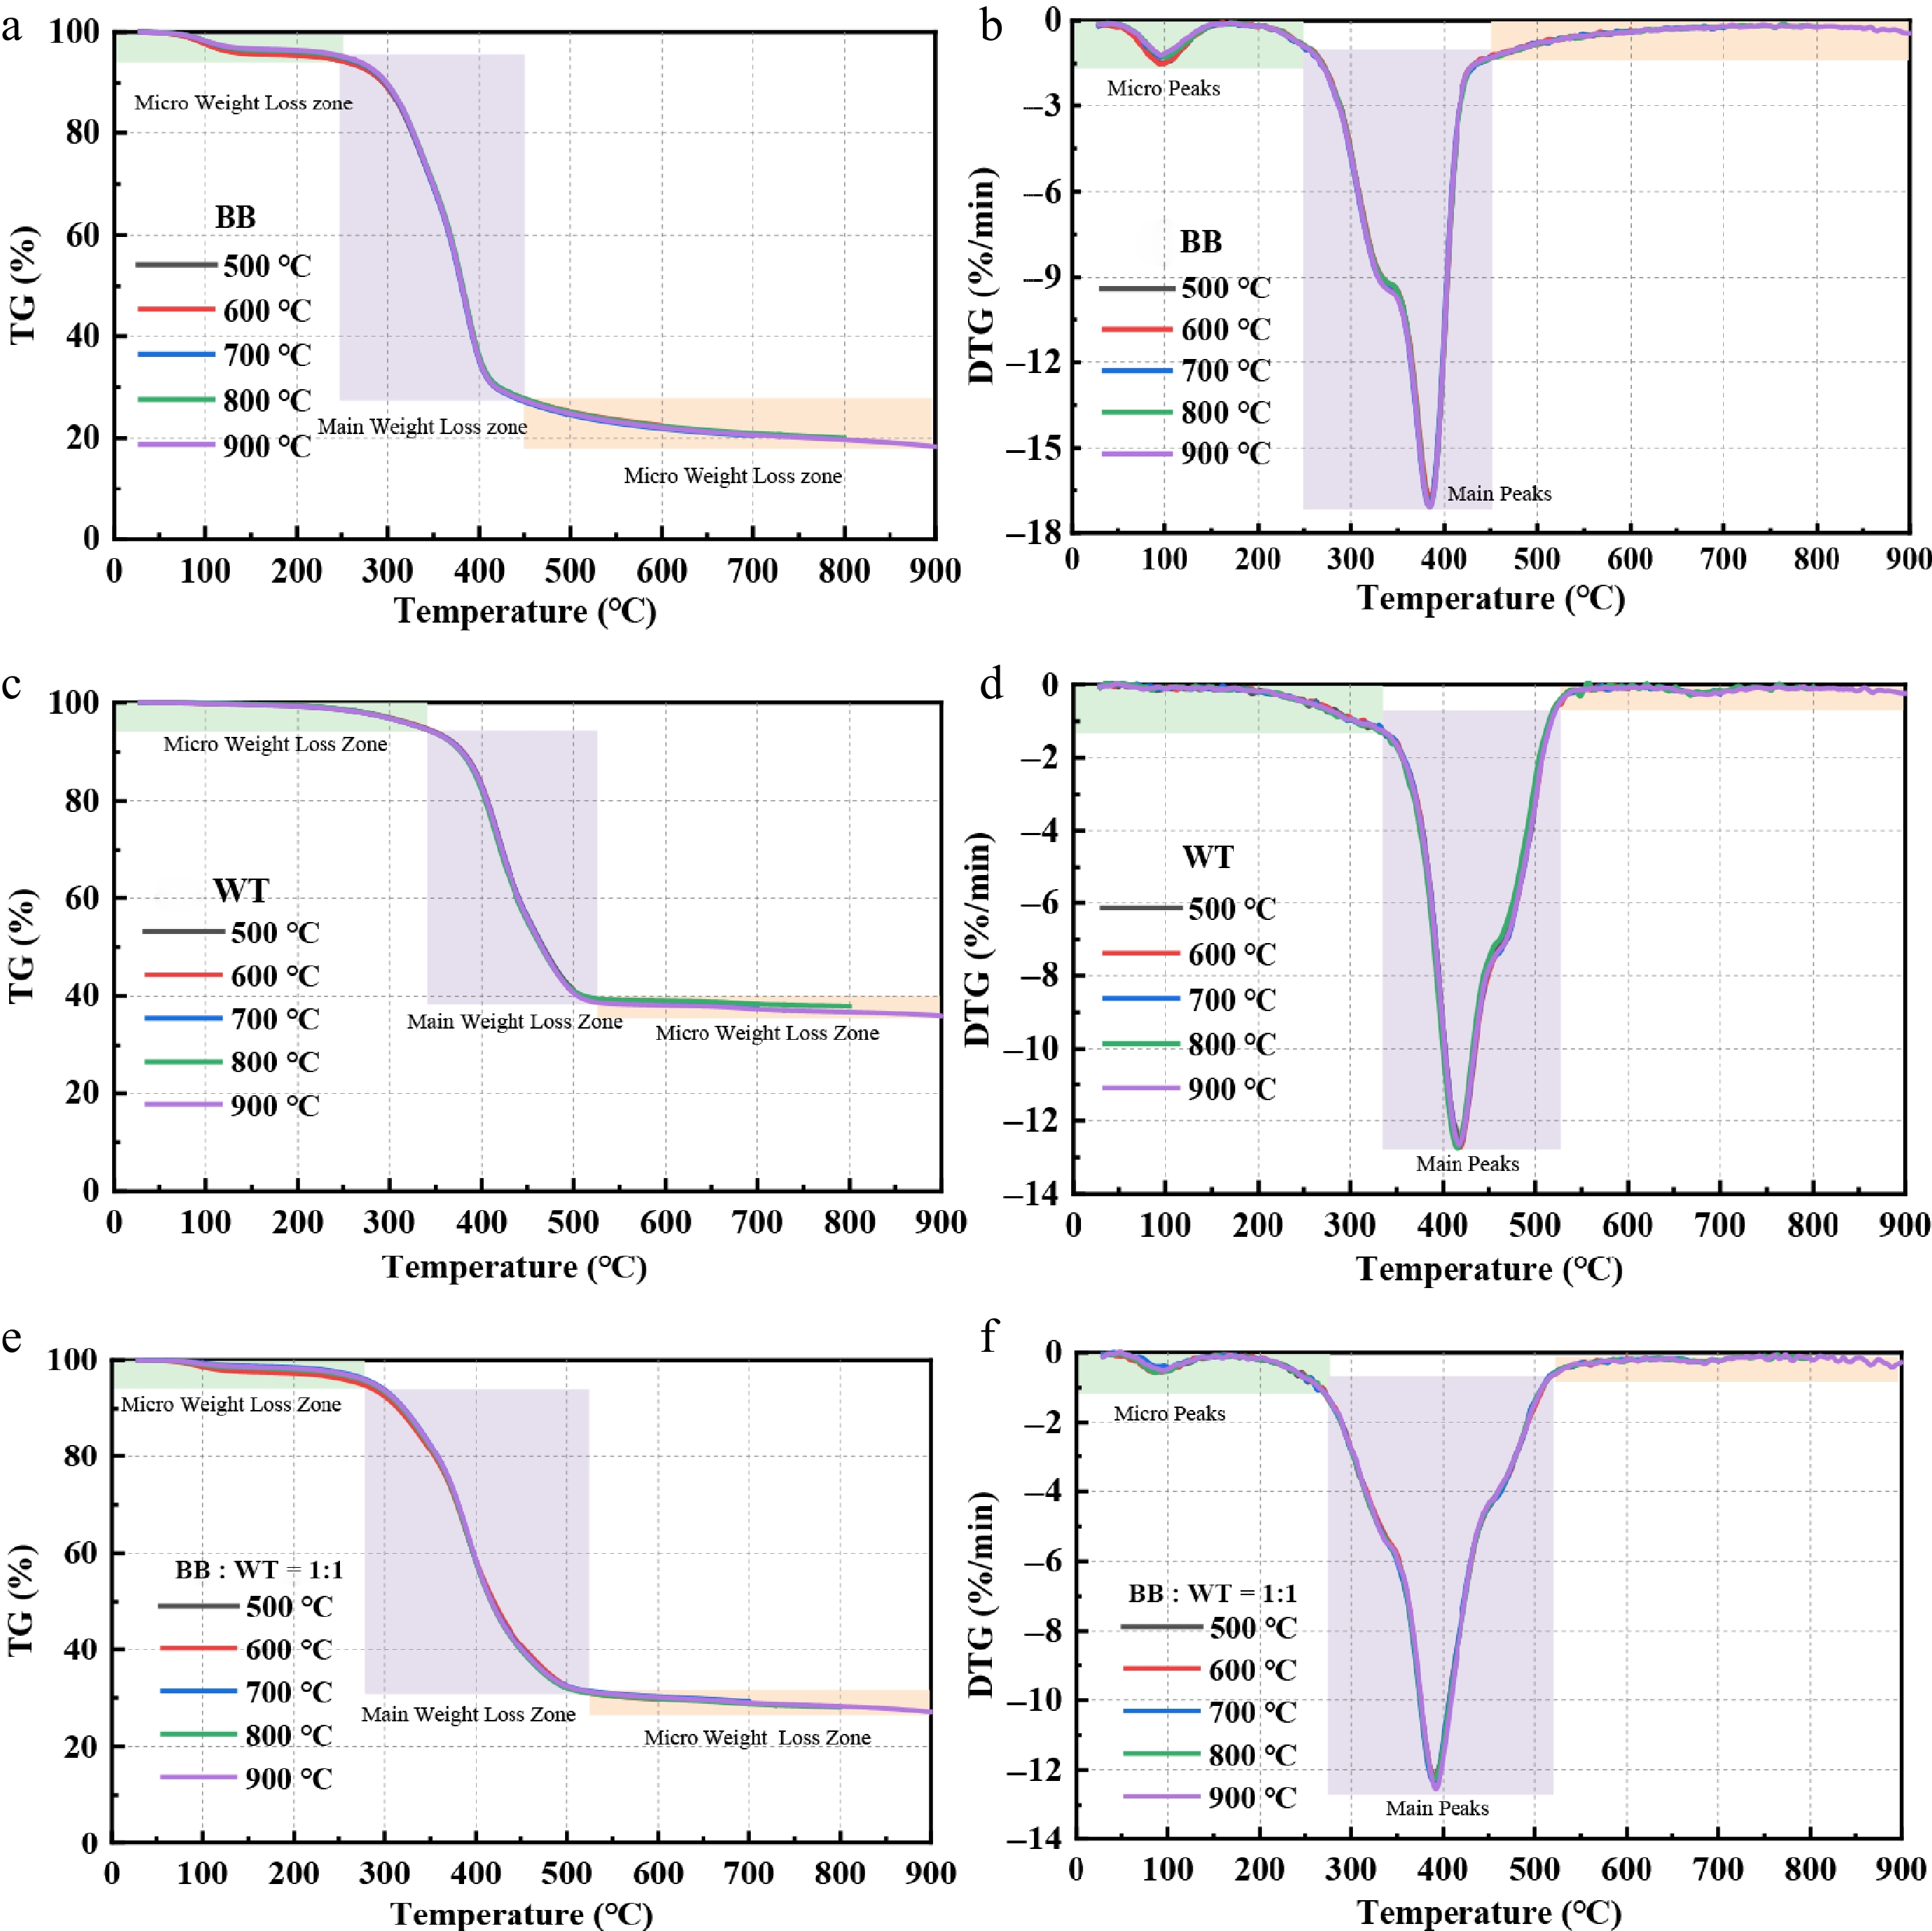
Figure 2.
TG and DTG curves of BB, WT, and their blends at different Tfinal.
-
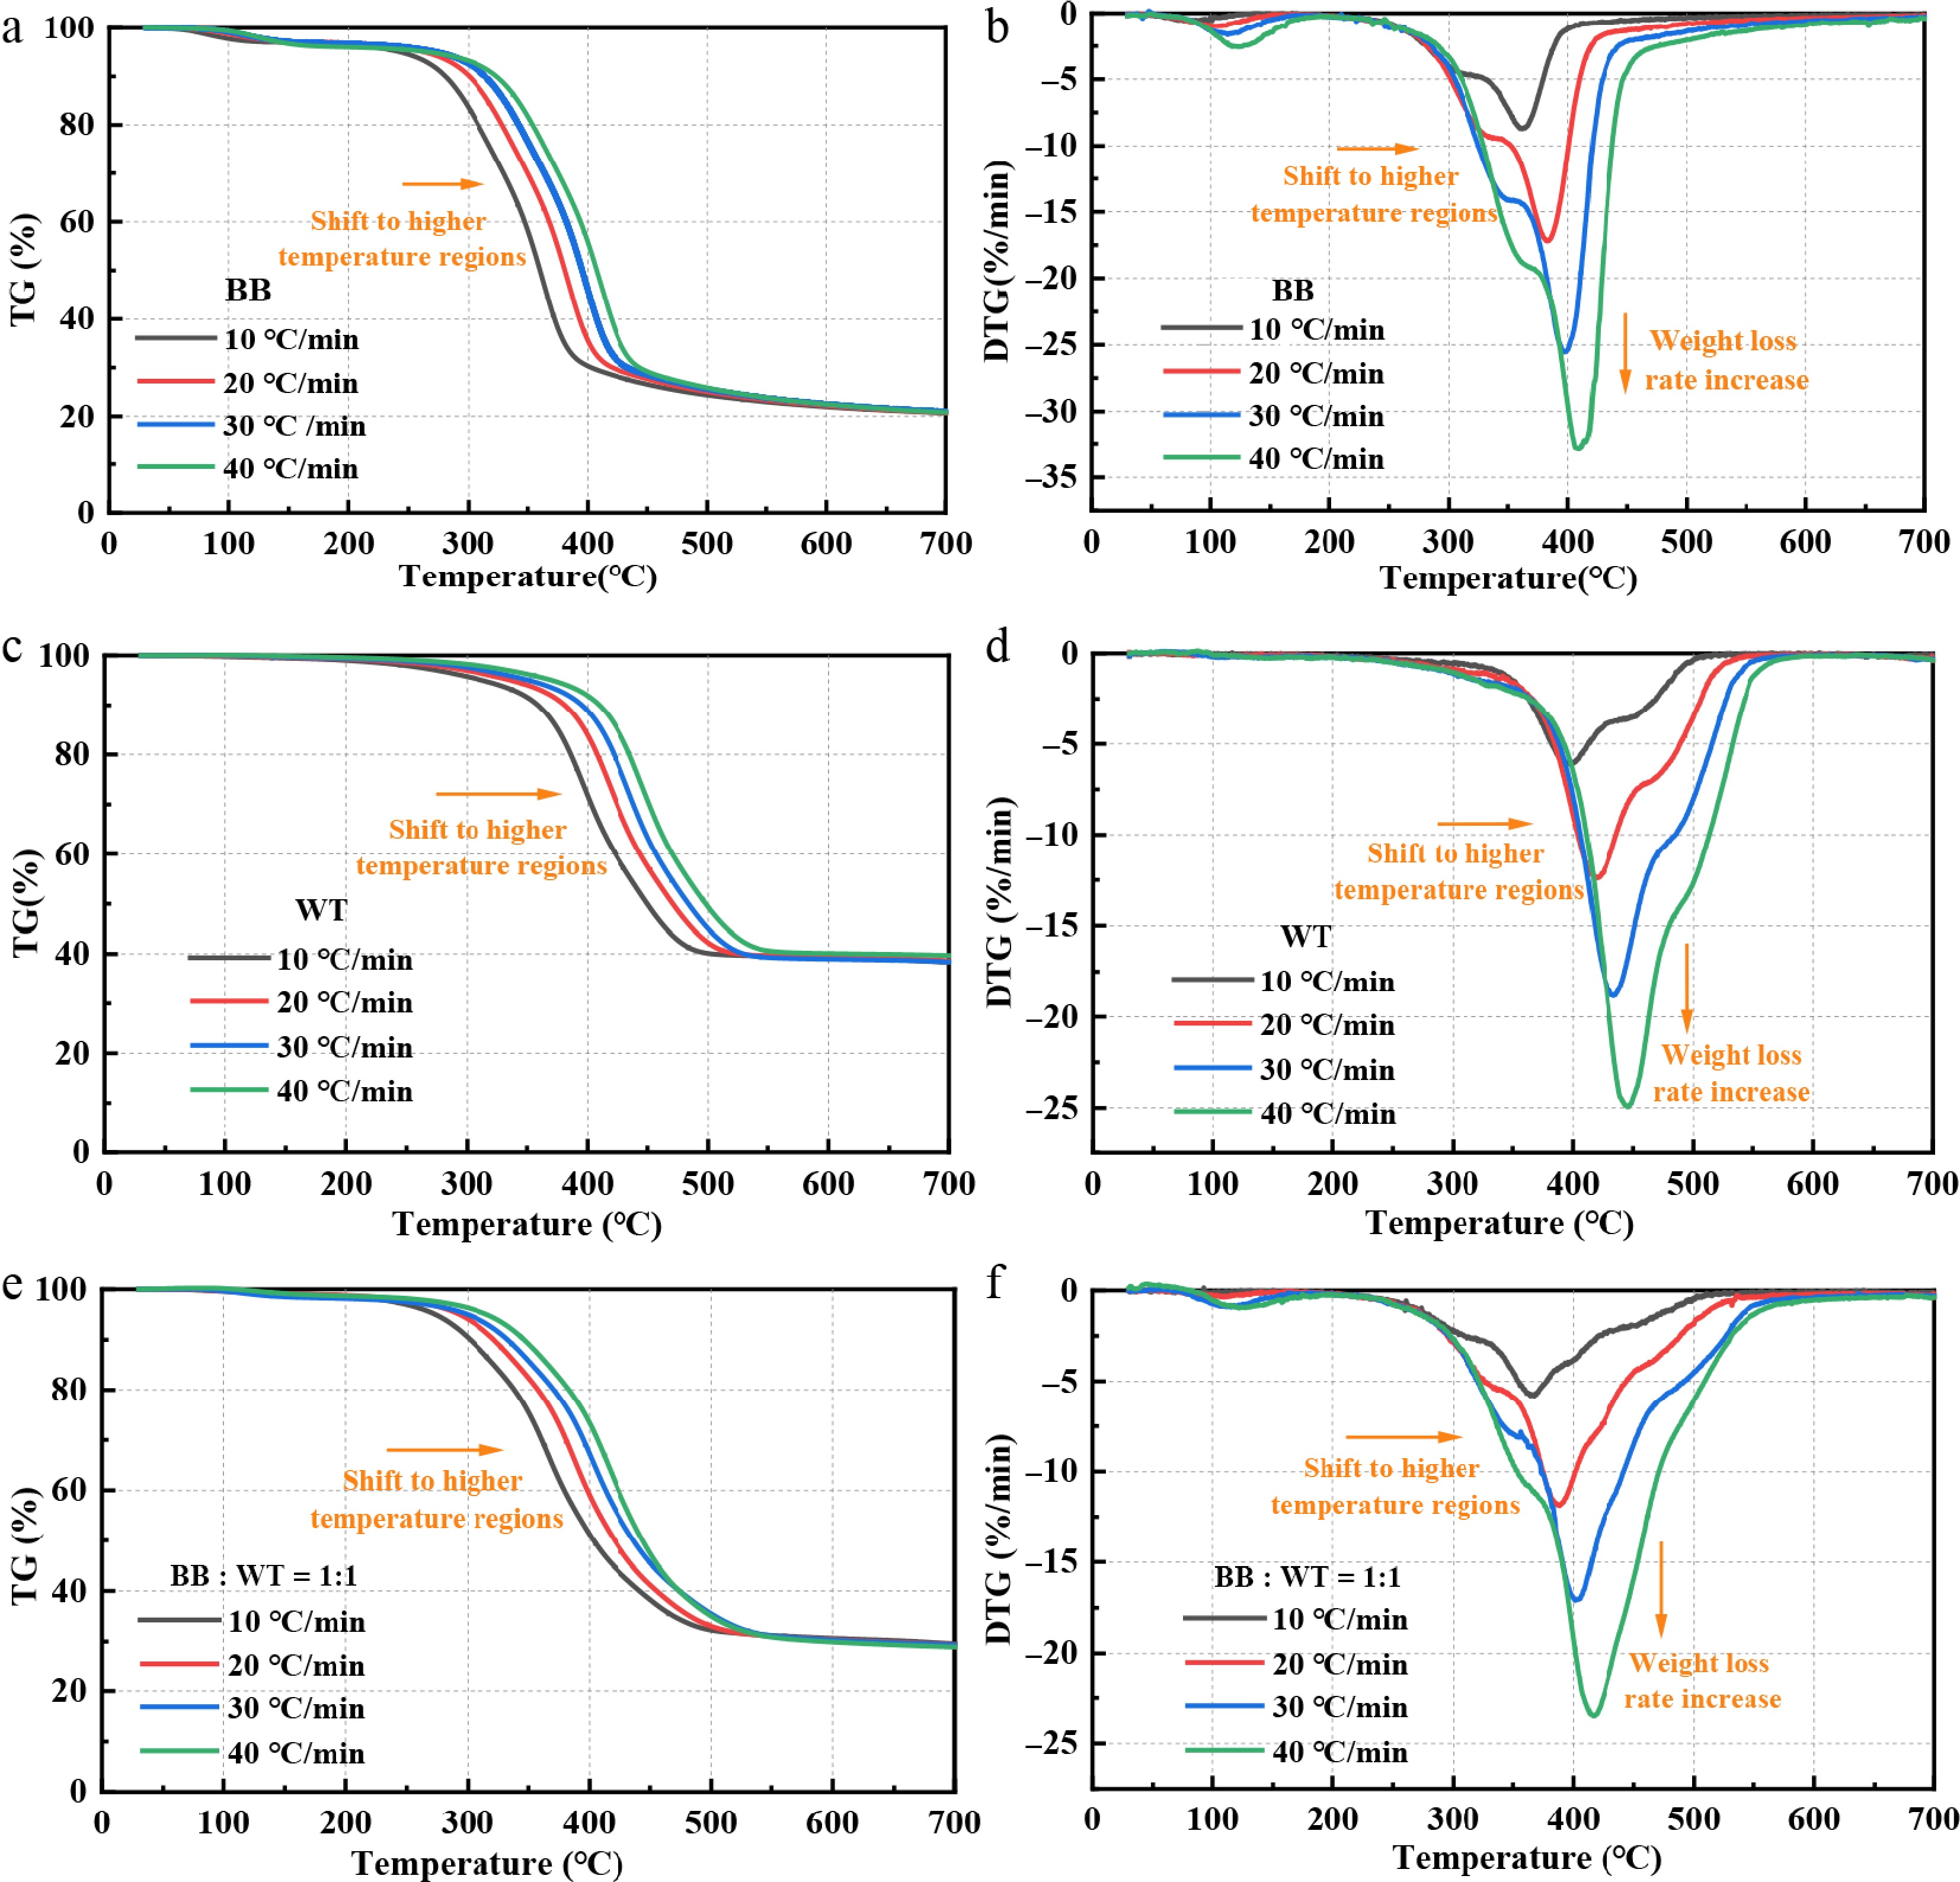
Figure 3.
TG and DTG curves of BB, WT, and their blends at different heating rates.
-
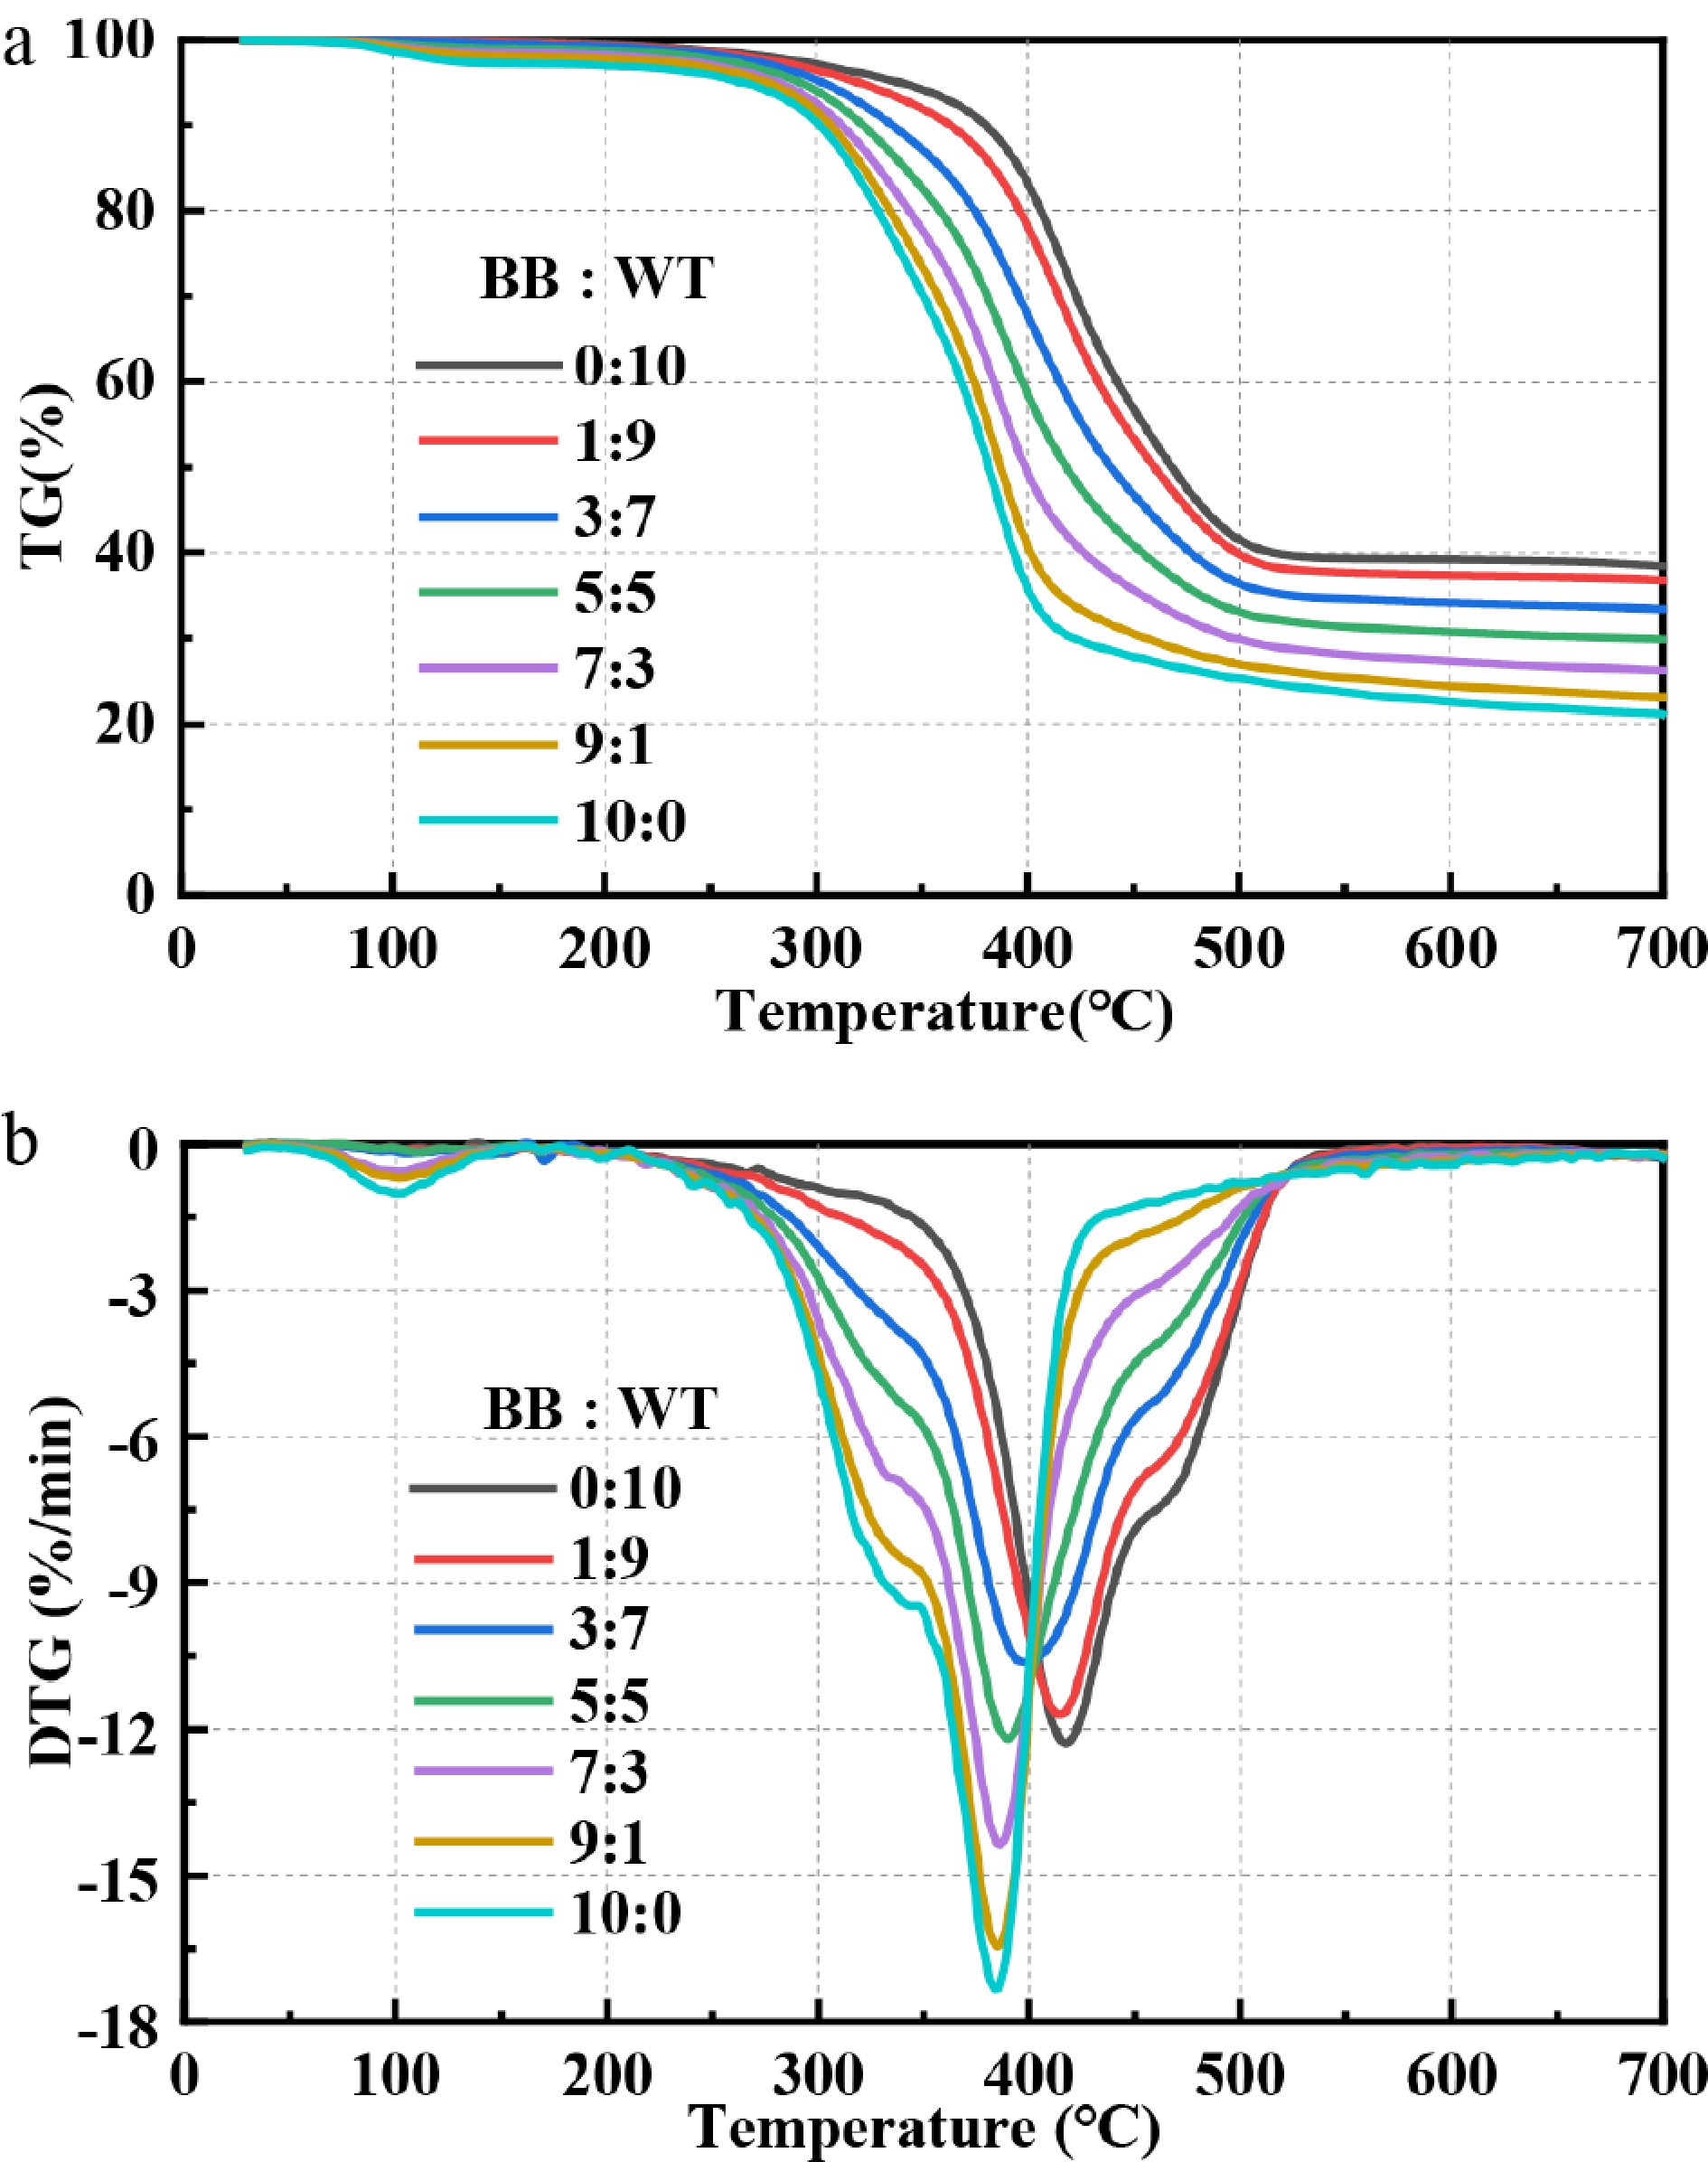
Figure 4.
TG and DTG curves of BB-WT blends at different blending ratios.
-
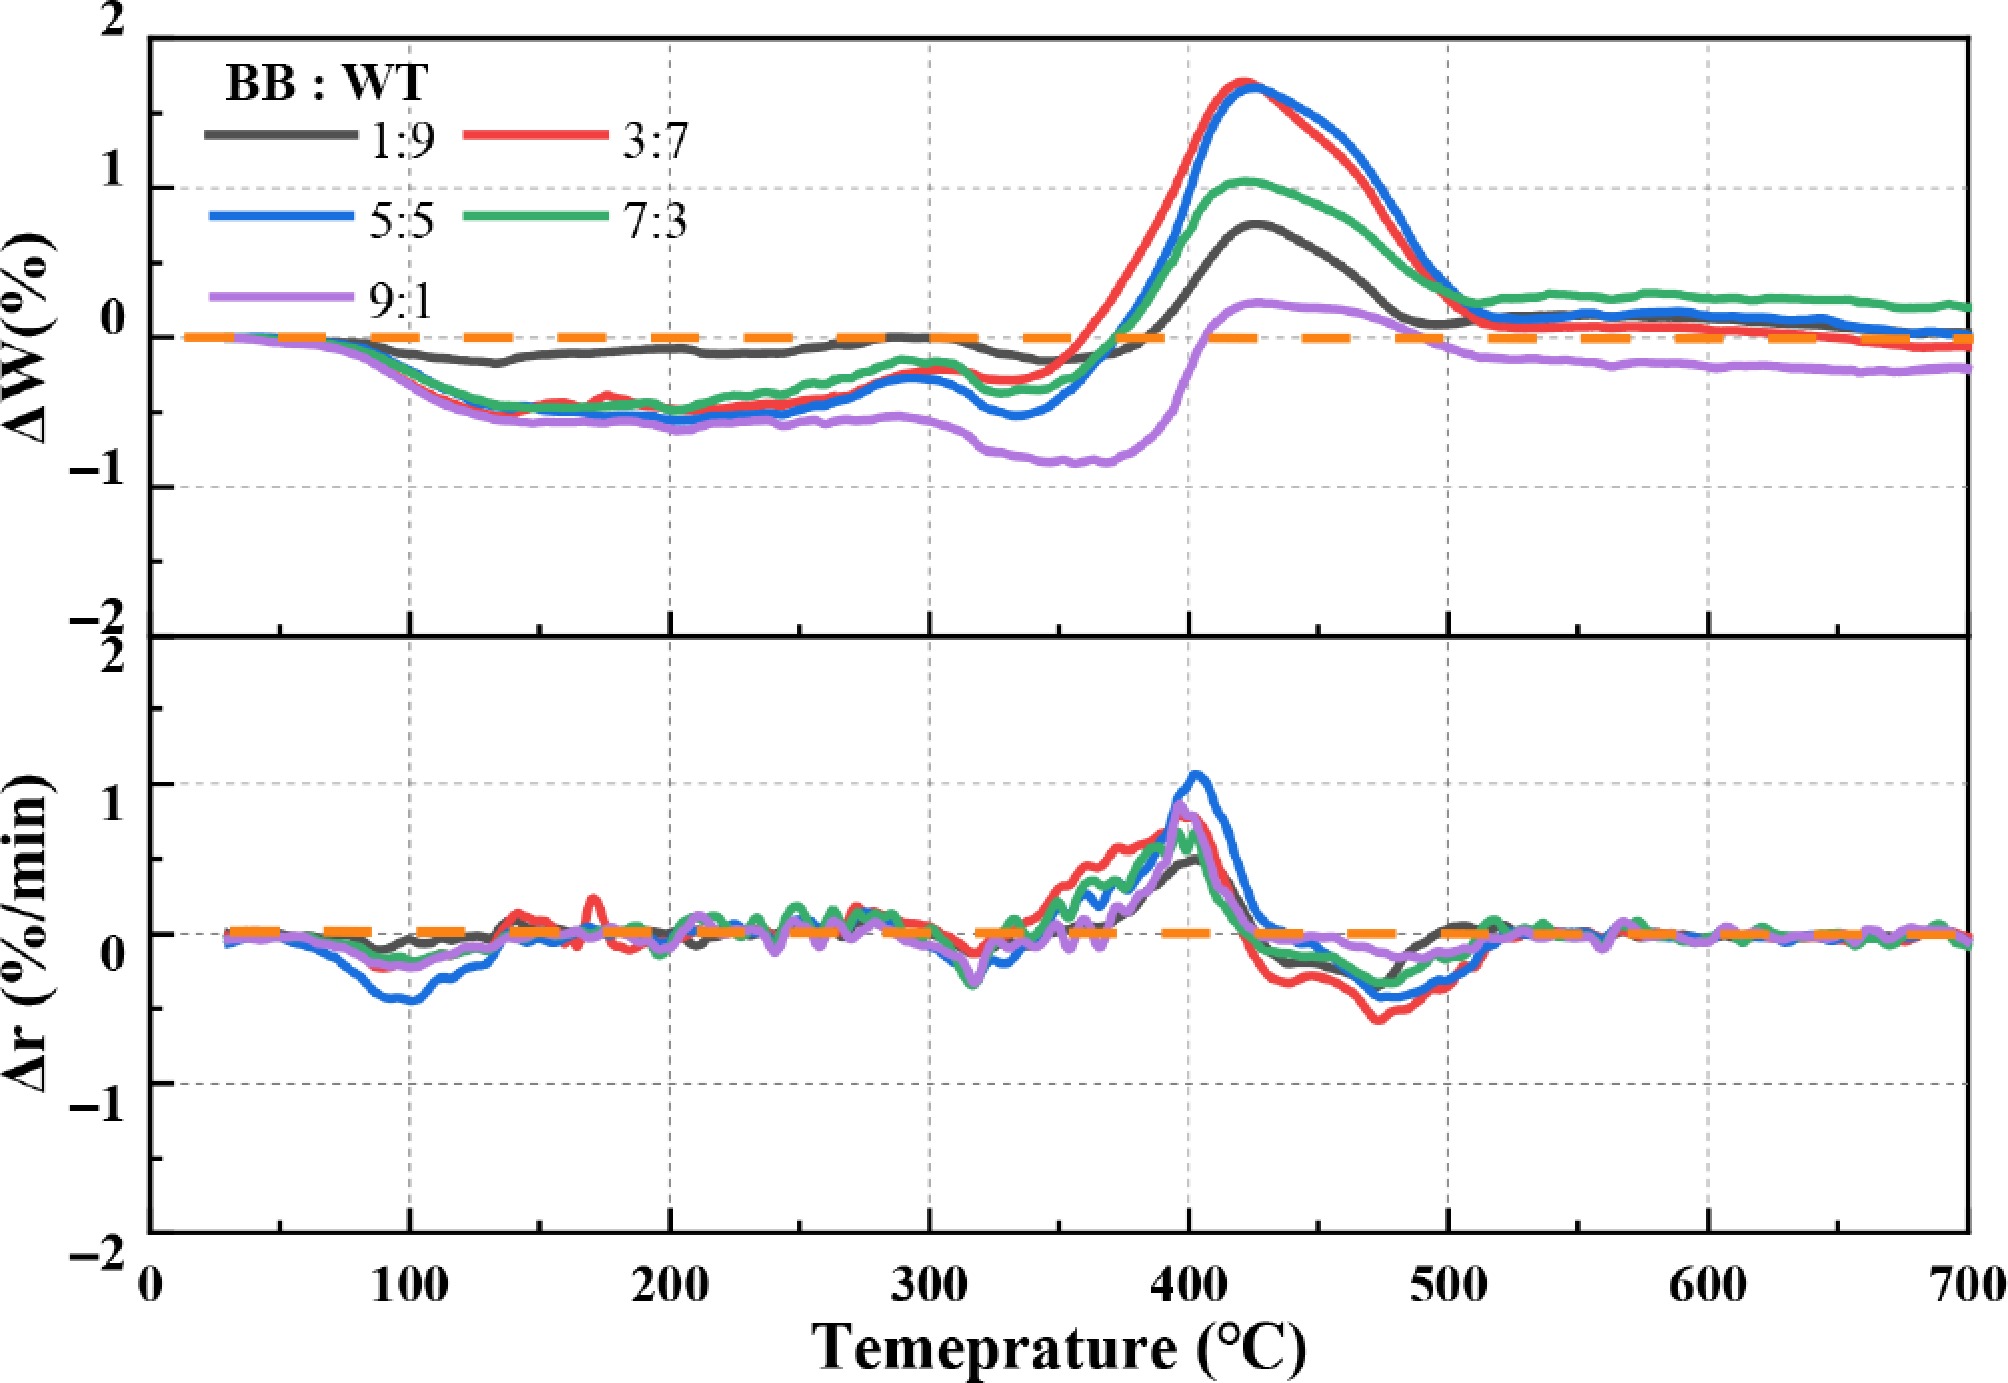
Figure 5.
Interactions during the co-pyrolysis of BB-WT blends.
-
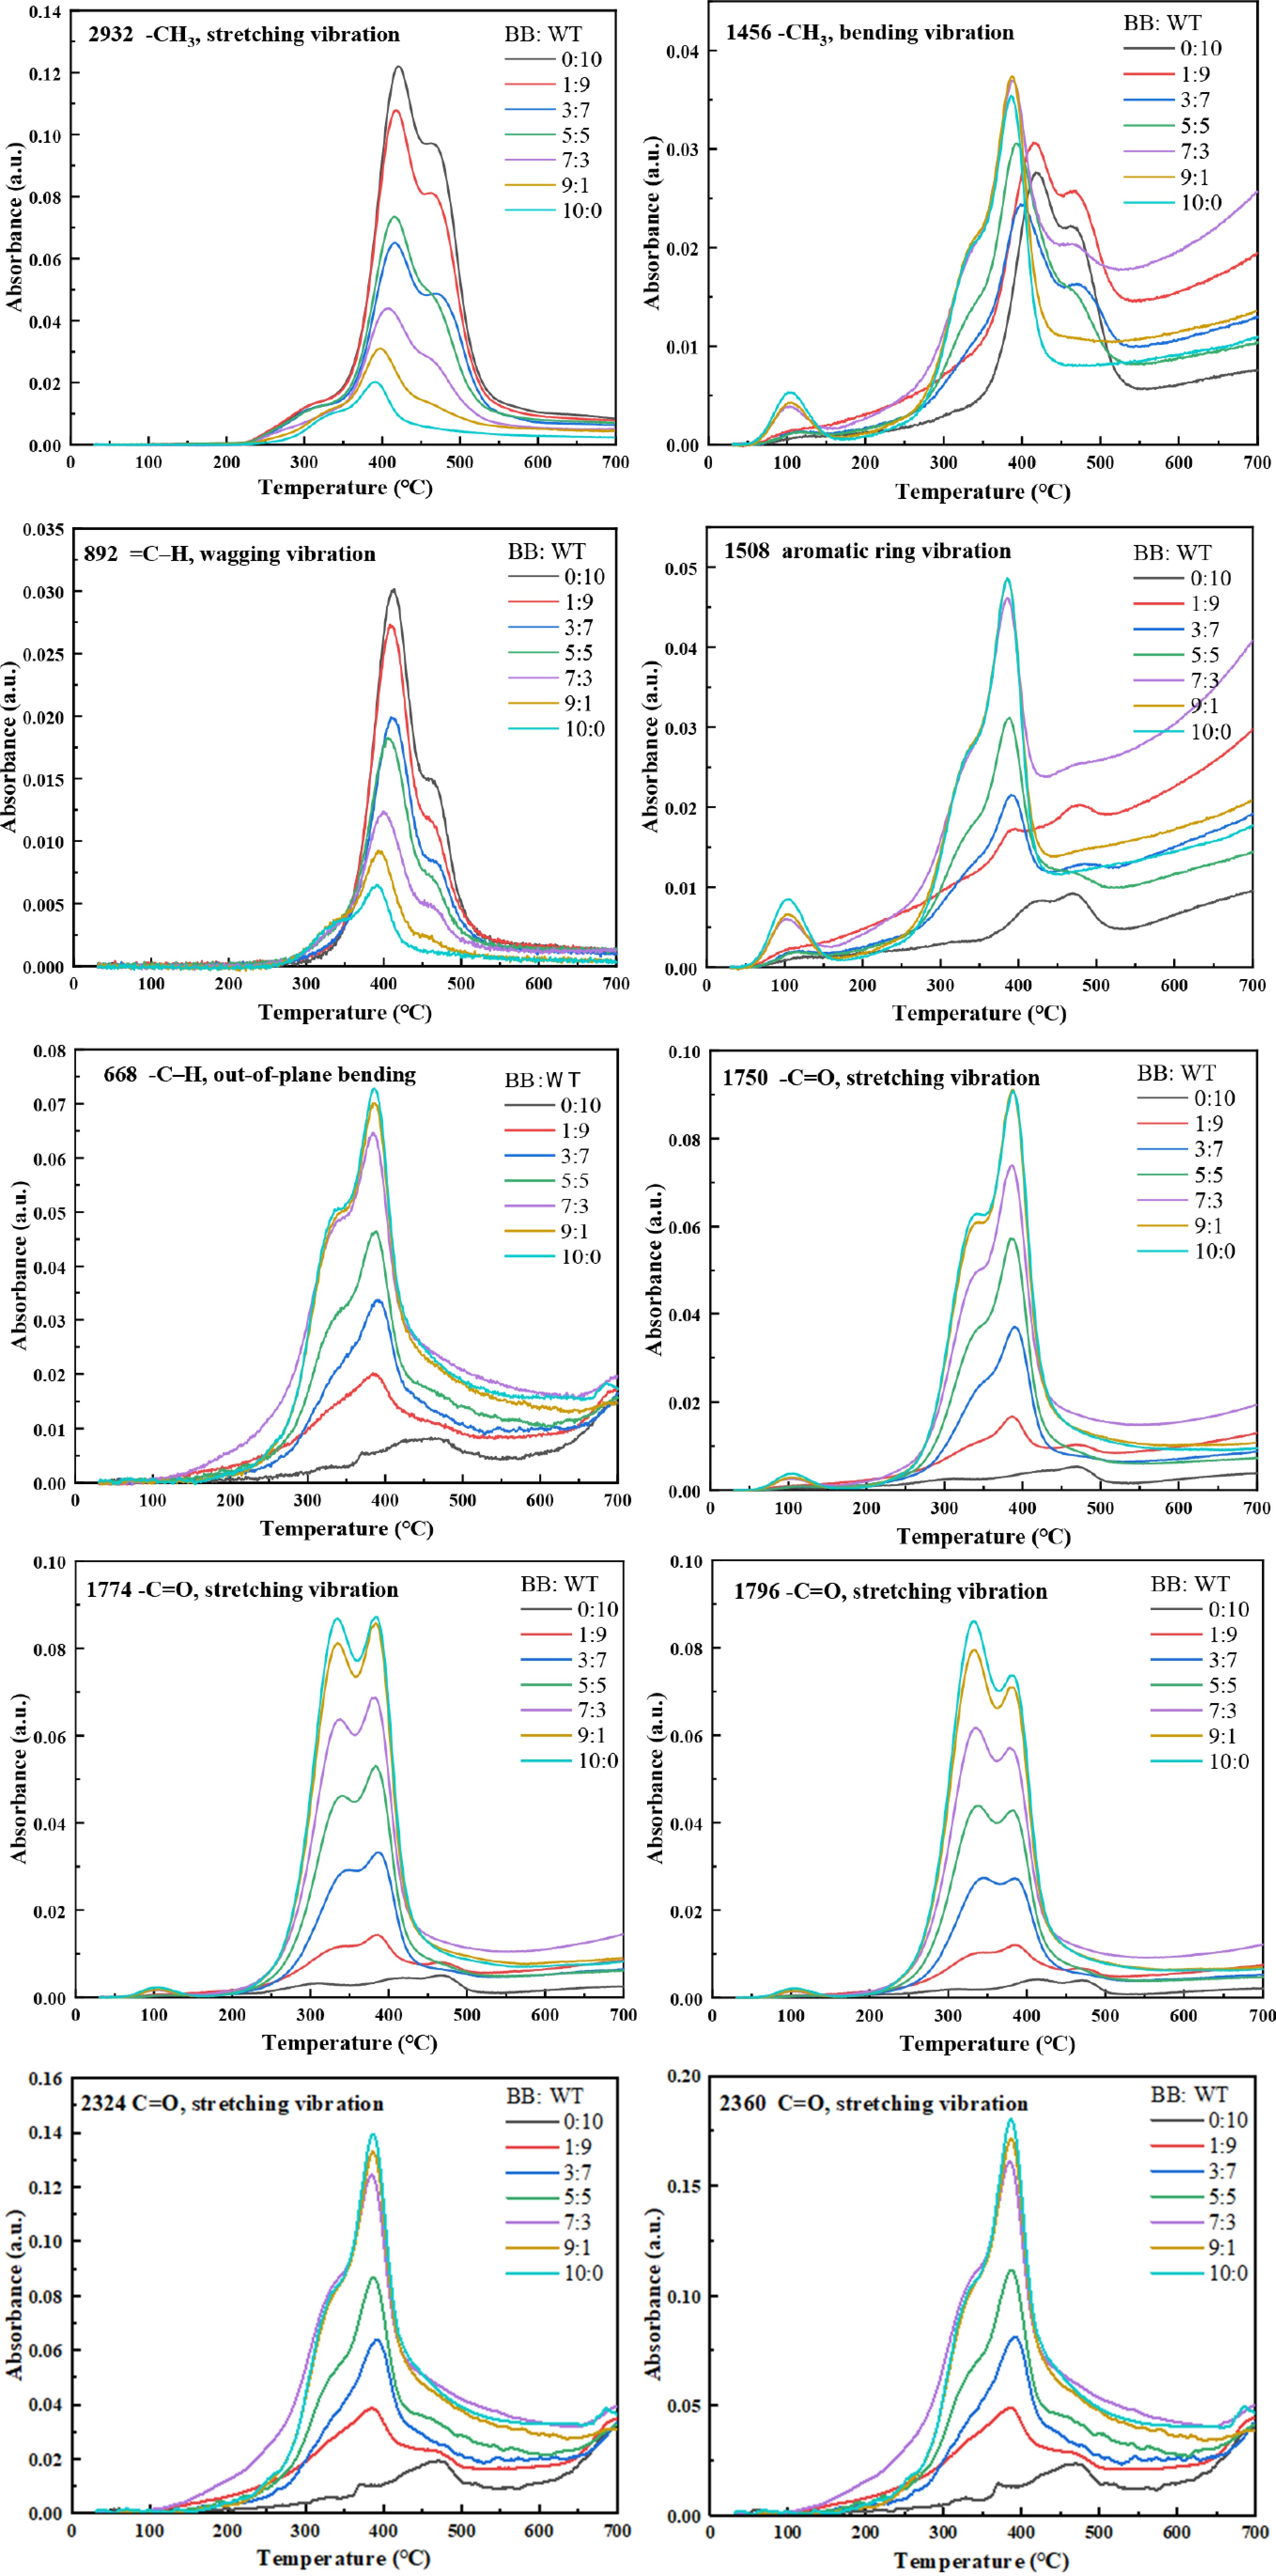
Figure 6.
FTIR evolution of characteristic functional groups with temperature during co-pyrolysis of BB-WT blends.
-
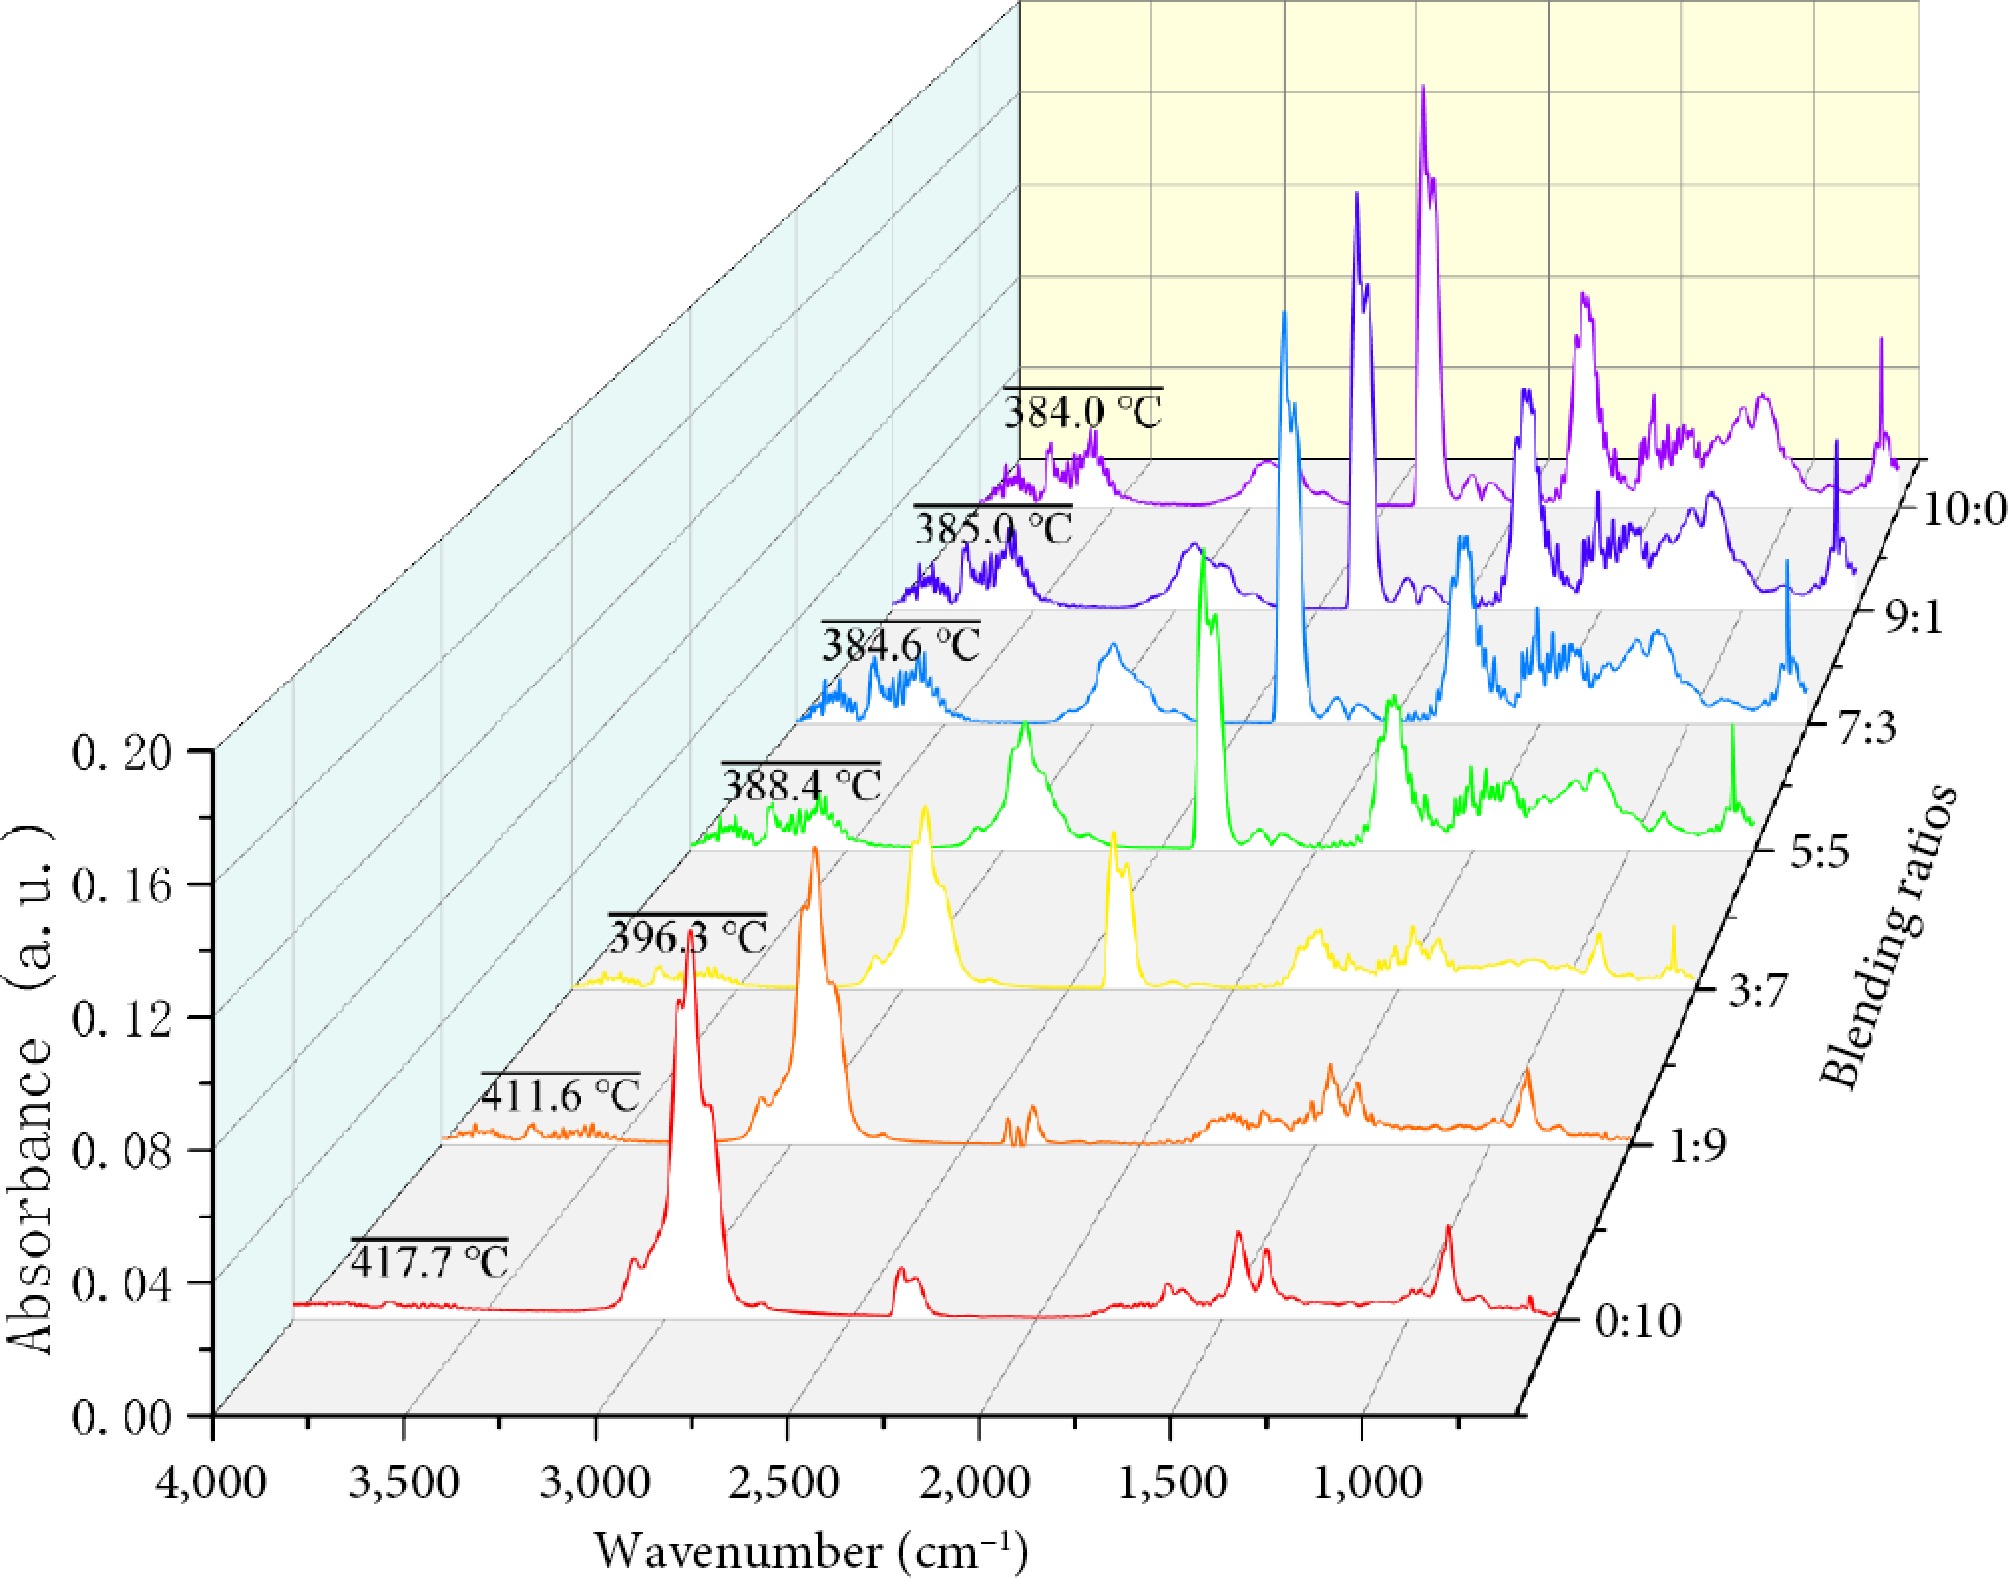
Figure 7.
FTIR spectra of Tp2 during co-pyrolysis.
-
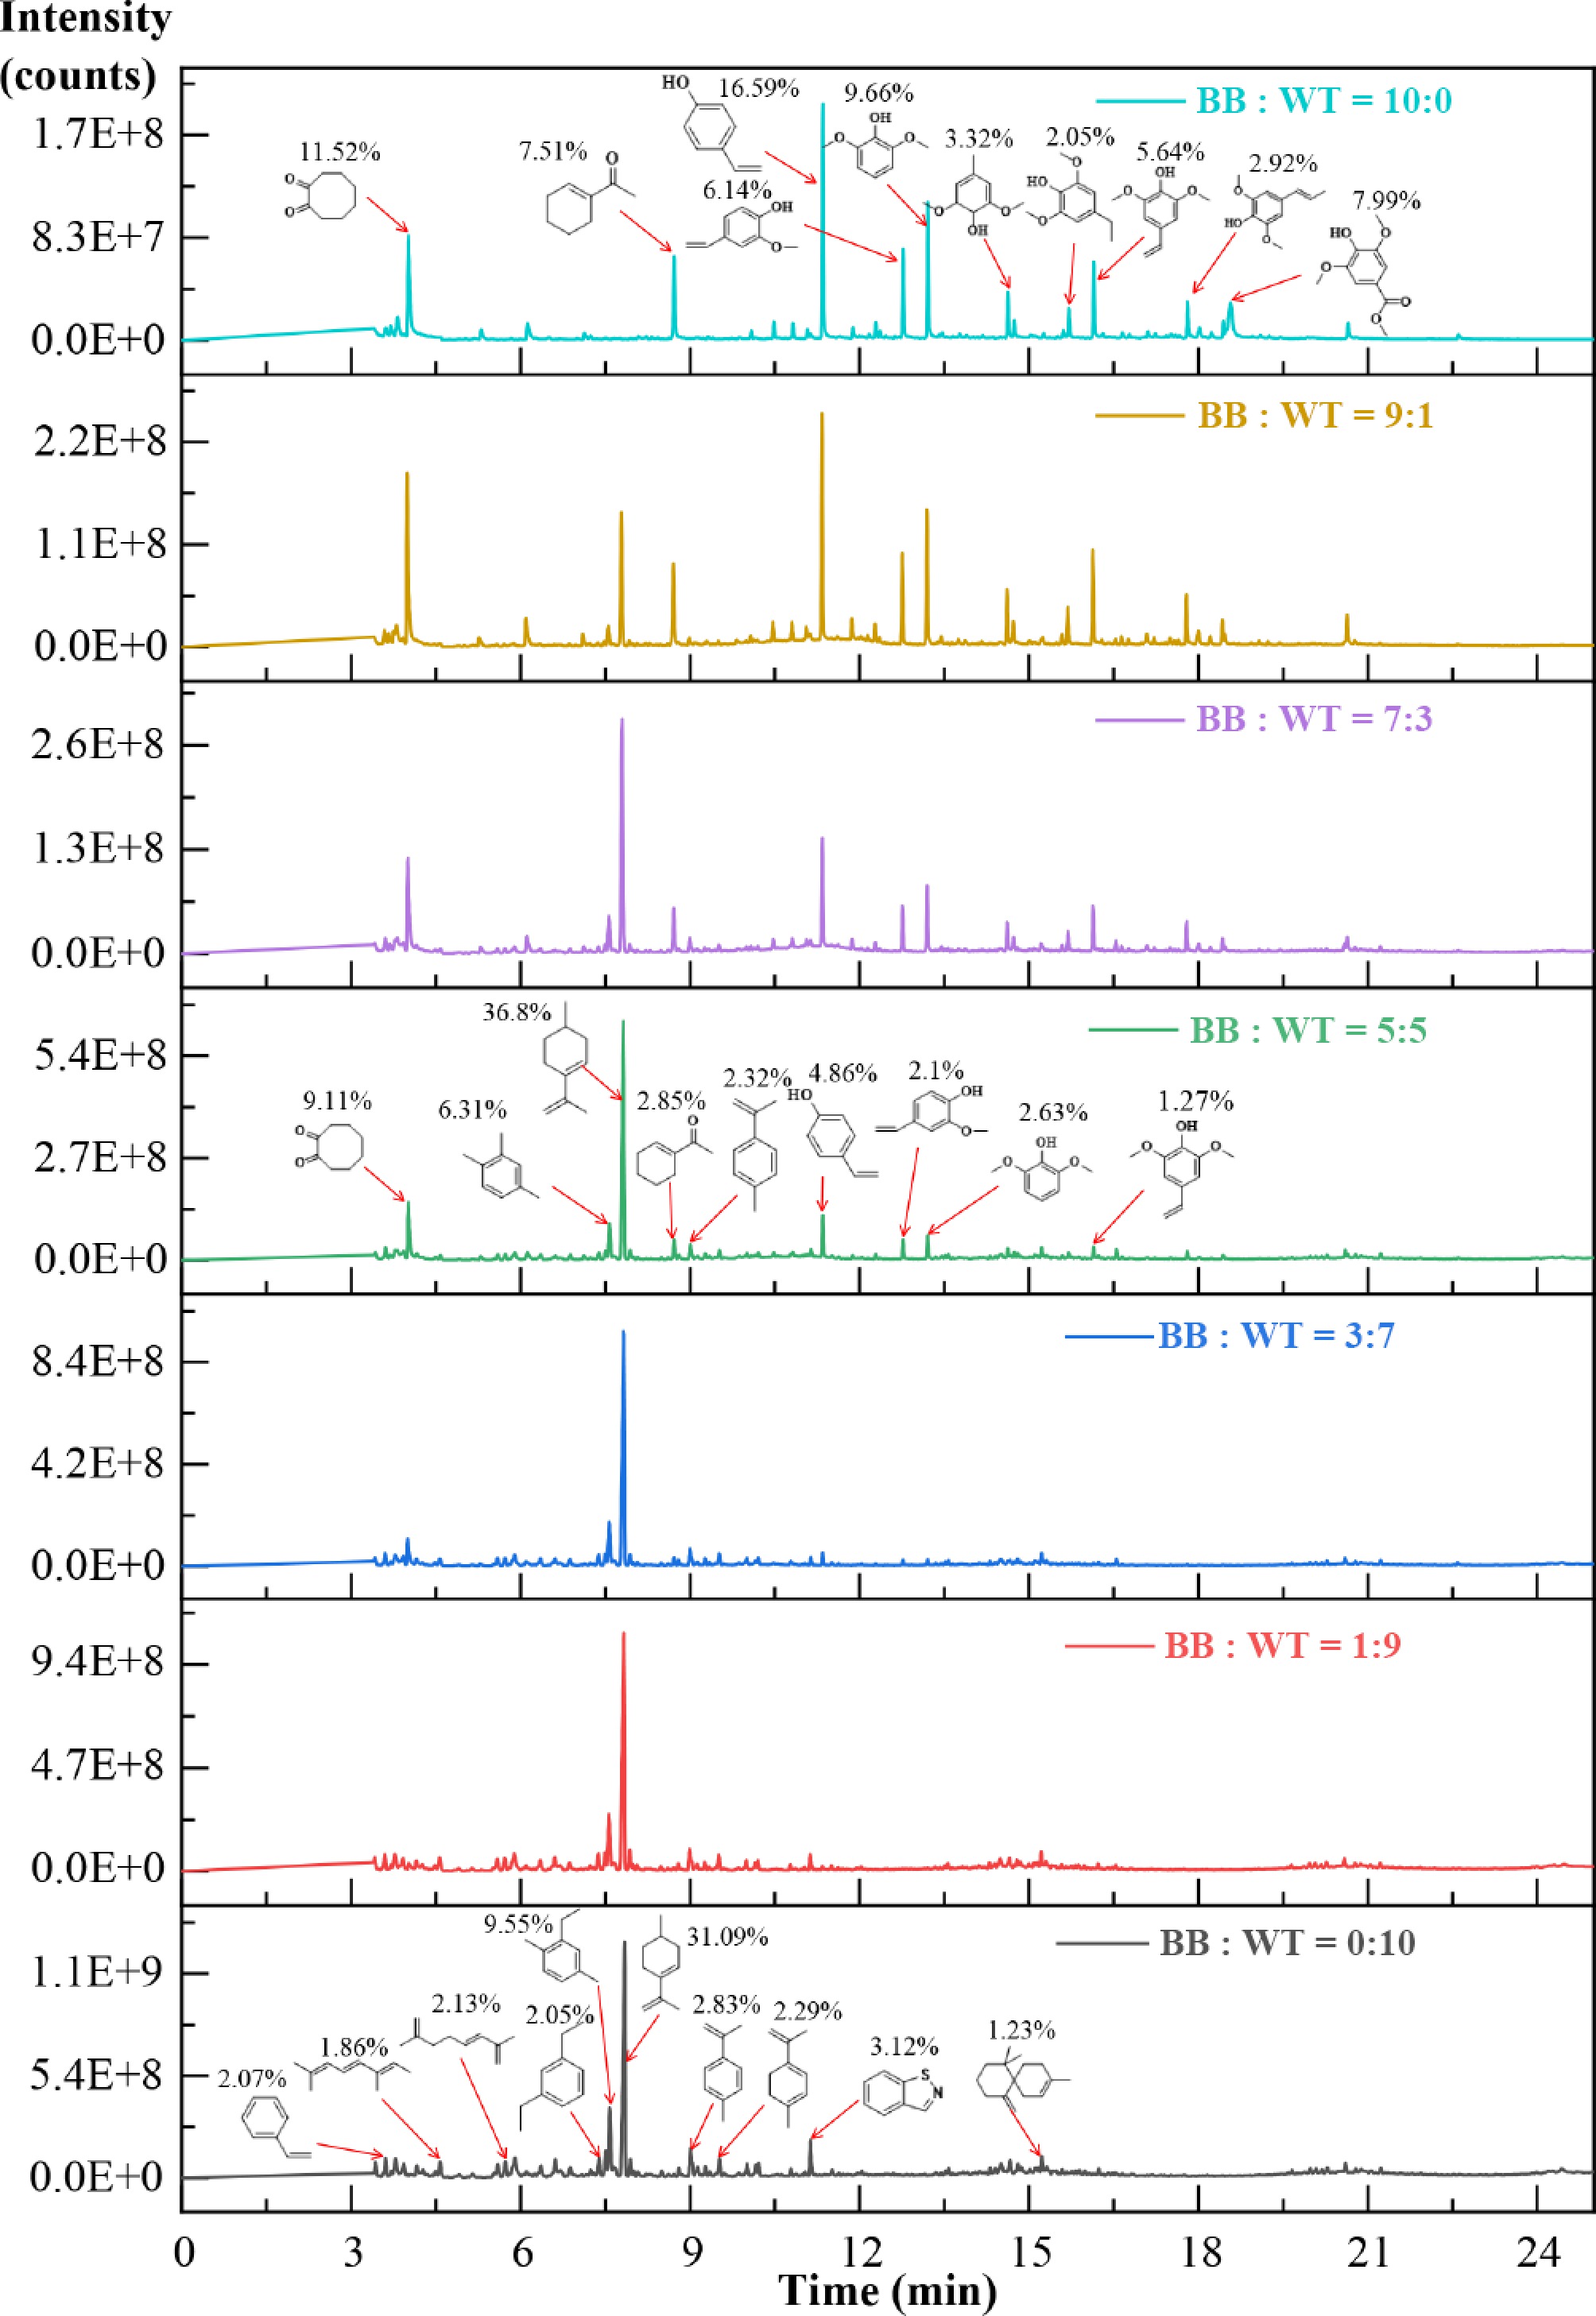
Figure 8.
GC/MS of Tp2 during co-pyrolysis.
-
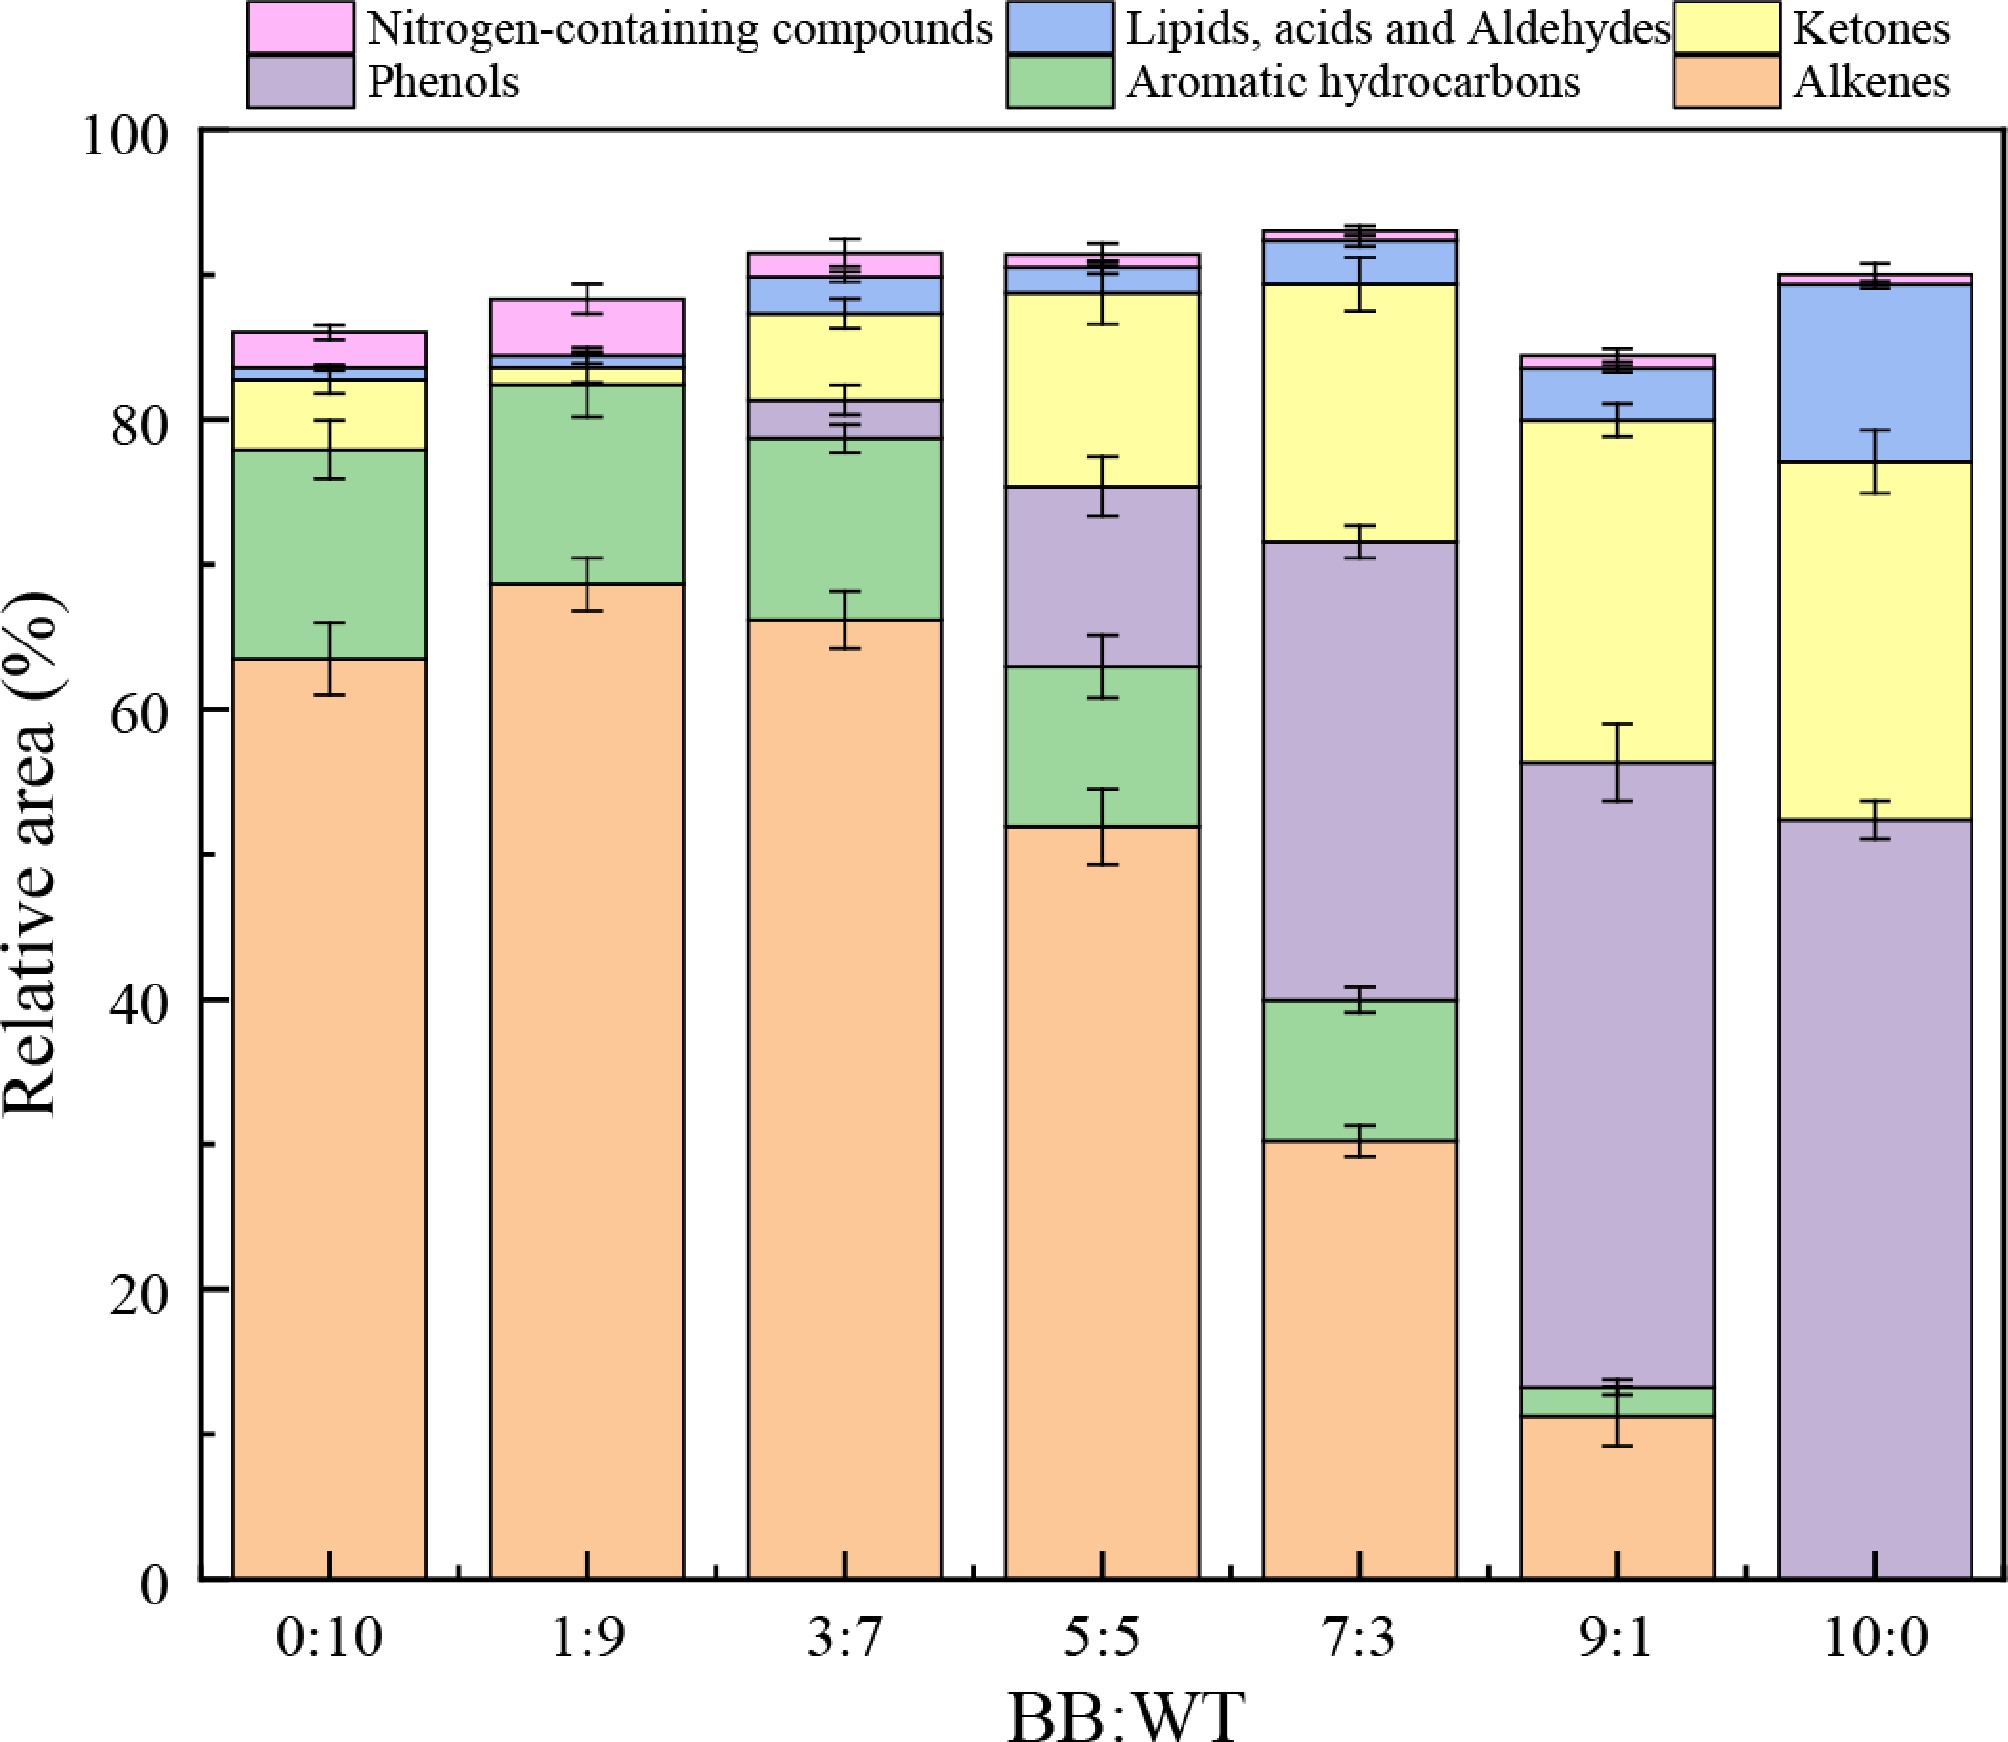
Figure 9.
Relative percentage of chemical compounds in co-pyrolysis of BB and WT.
-
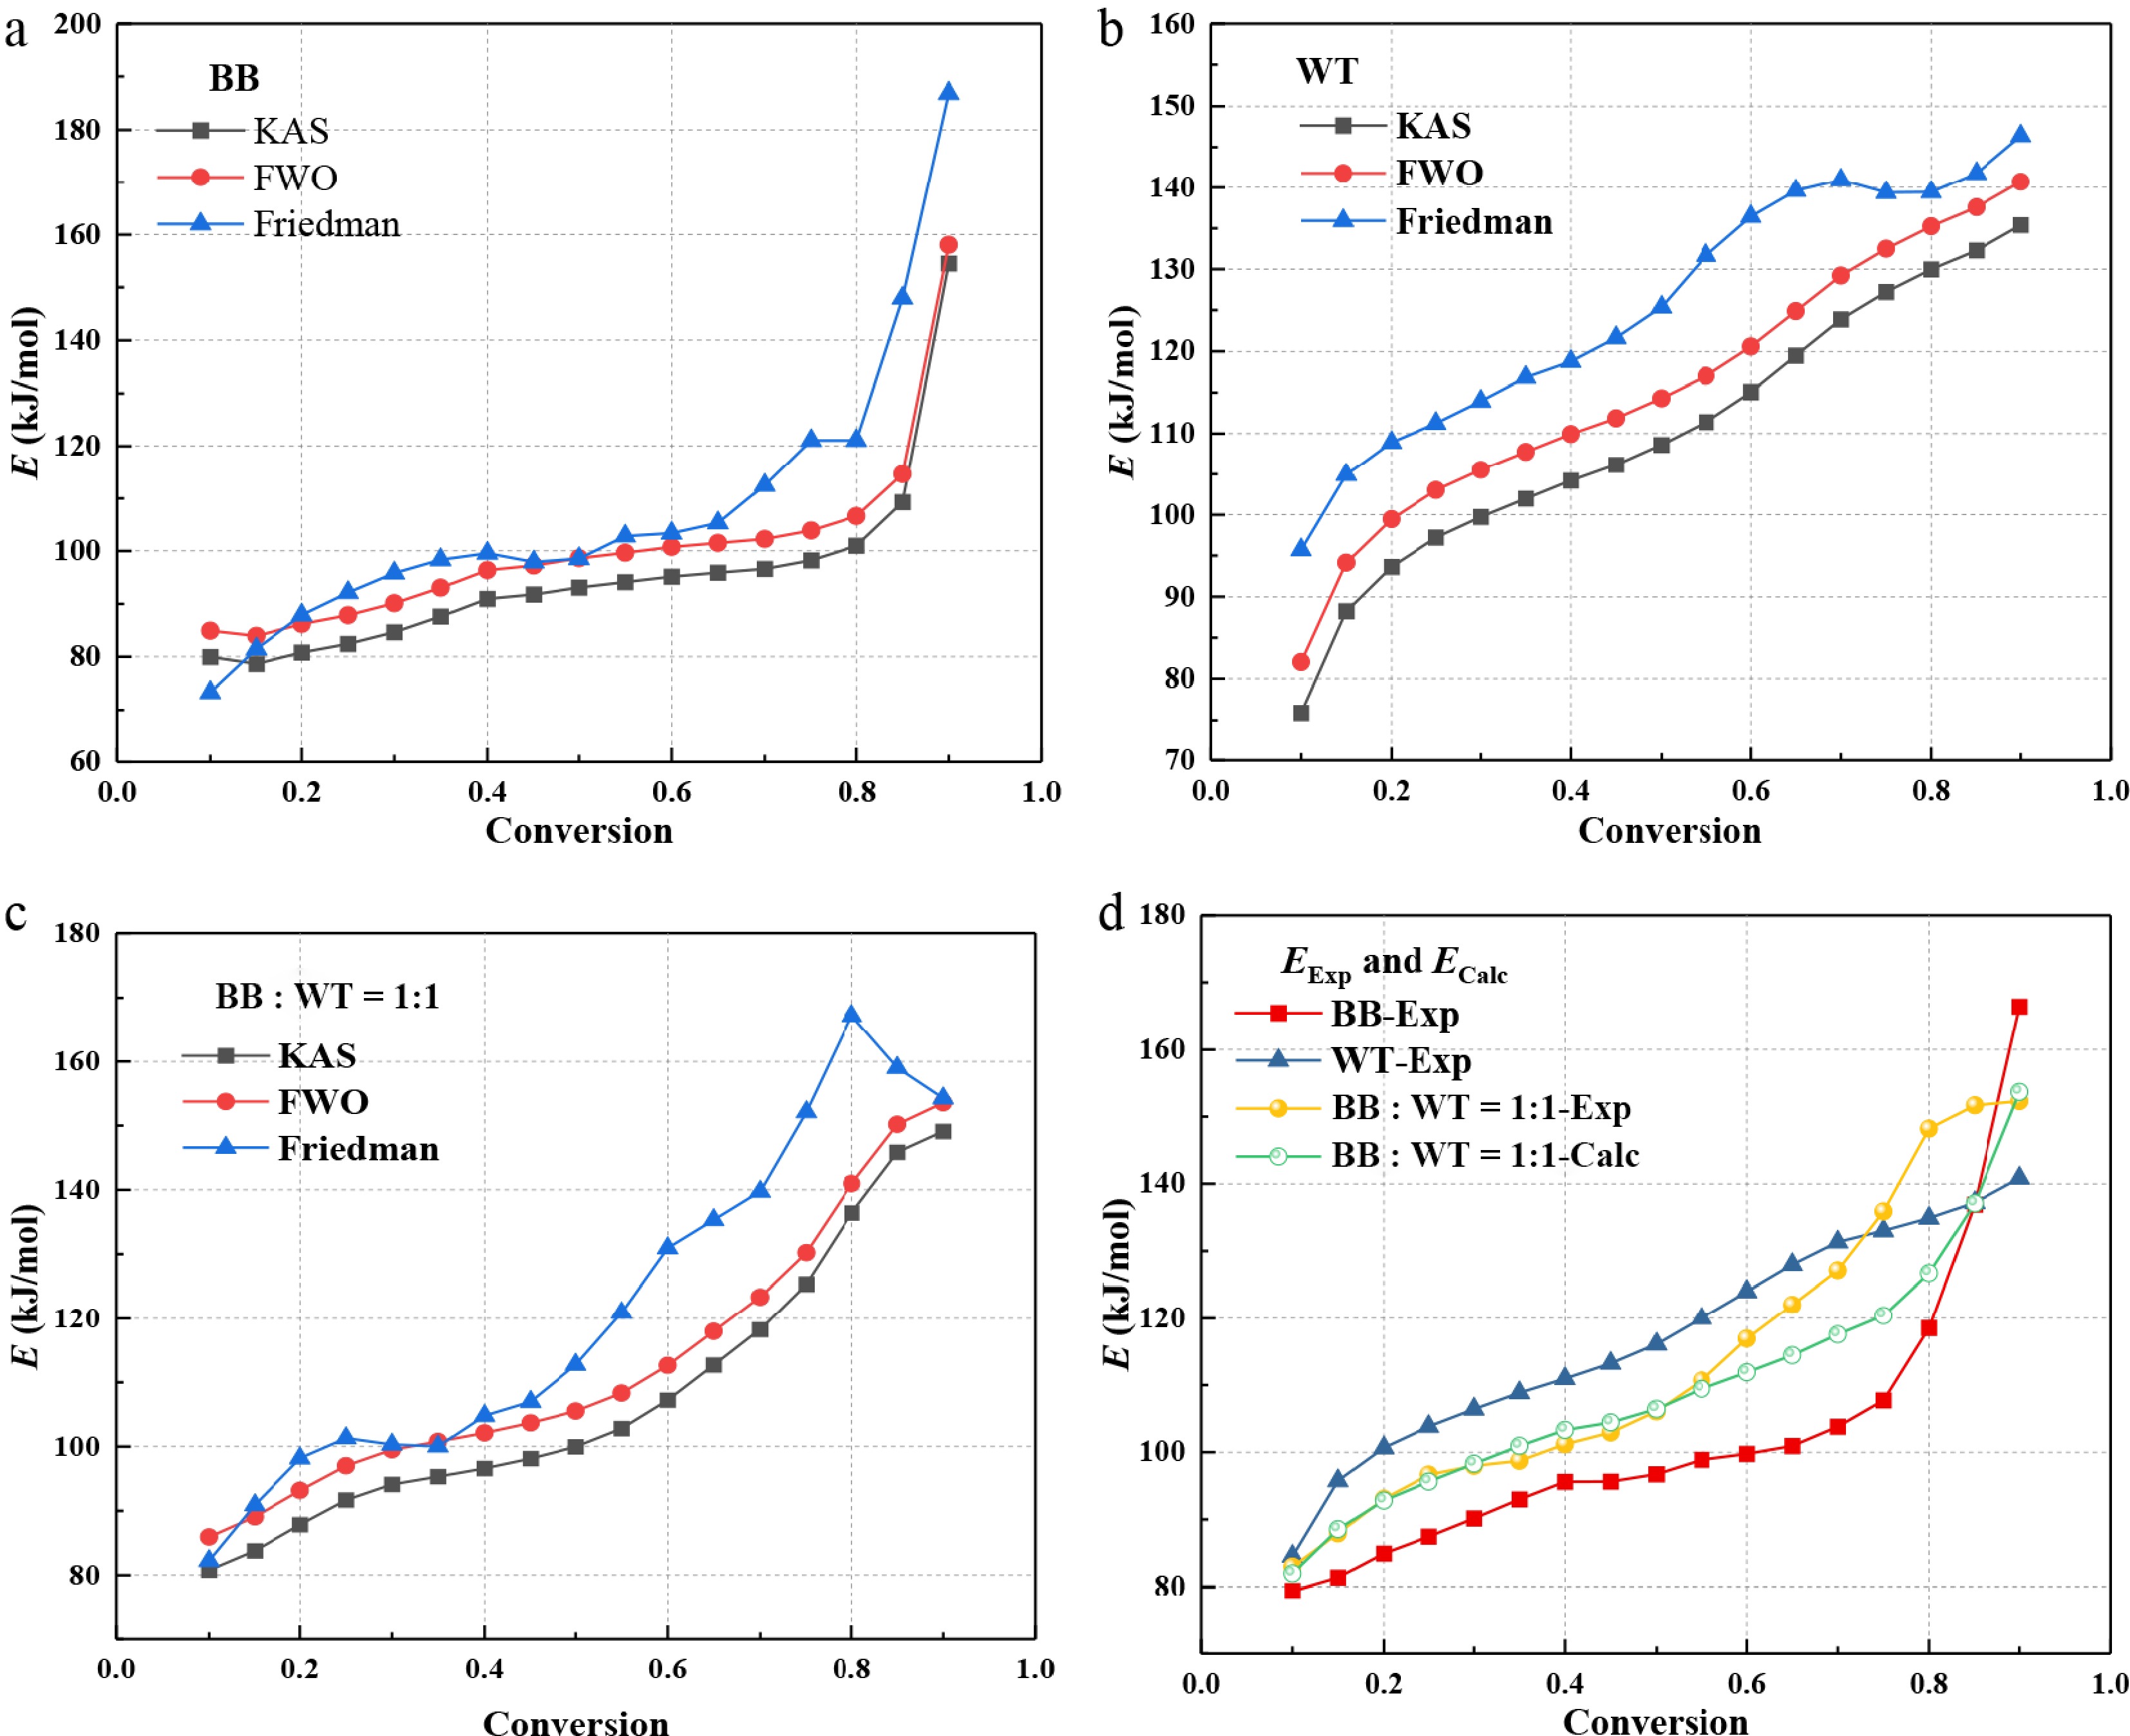
Figure 10.
$ {{E}}_{ \alpha } $ -
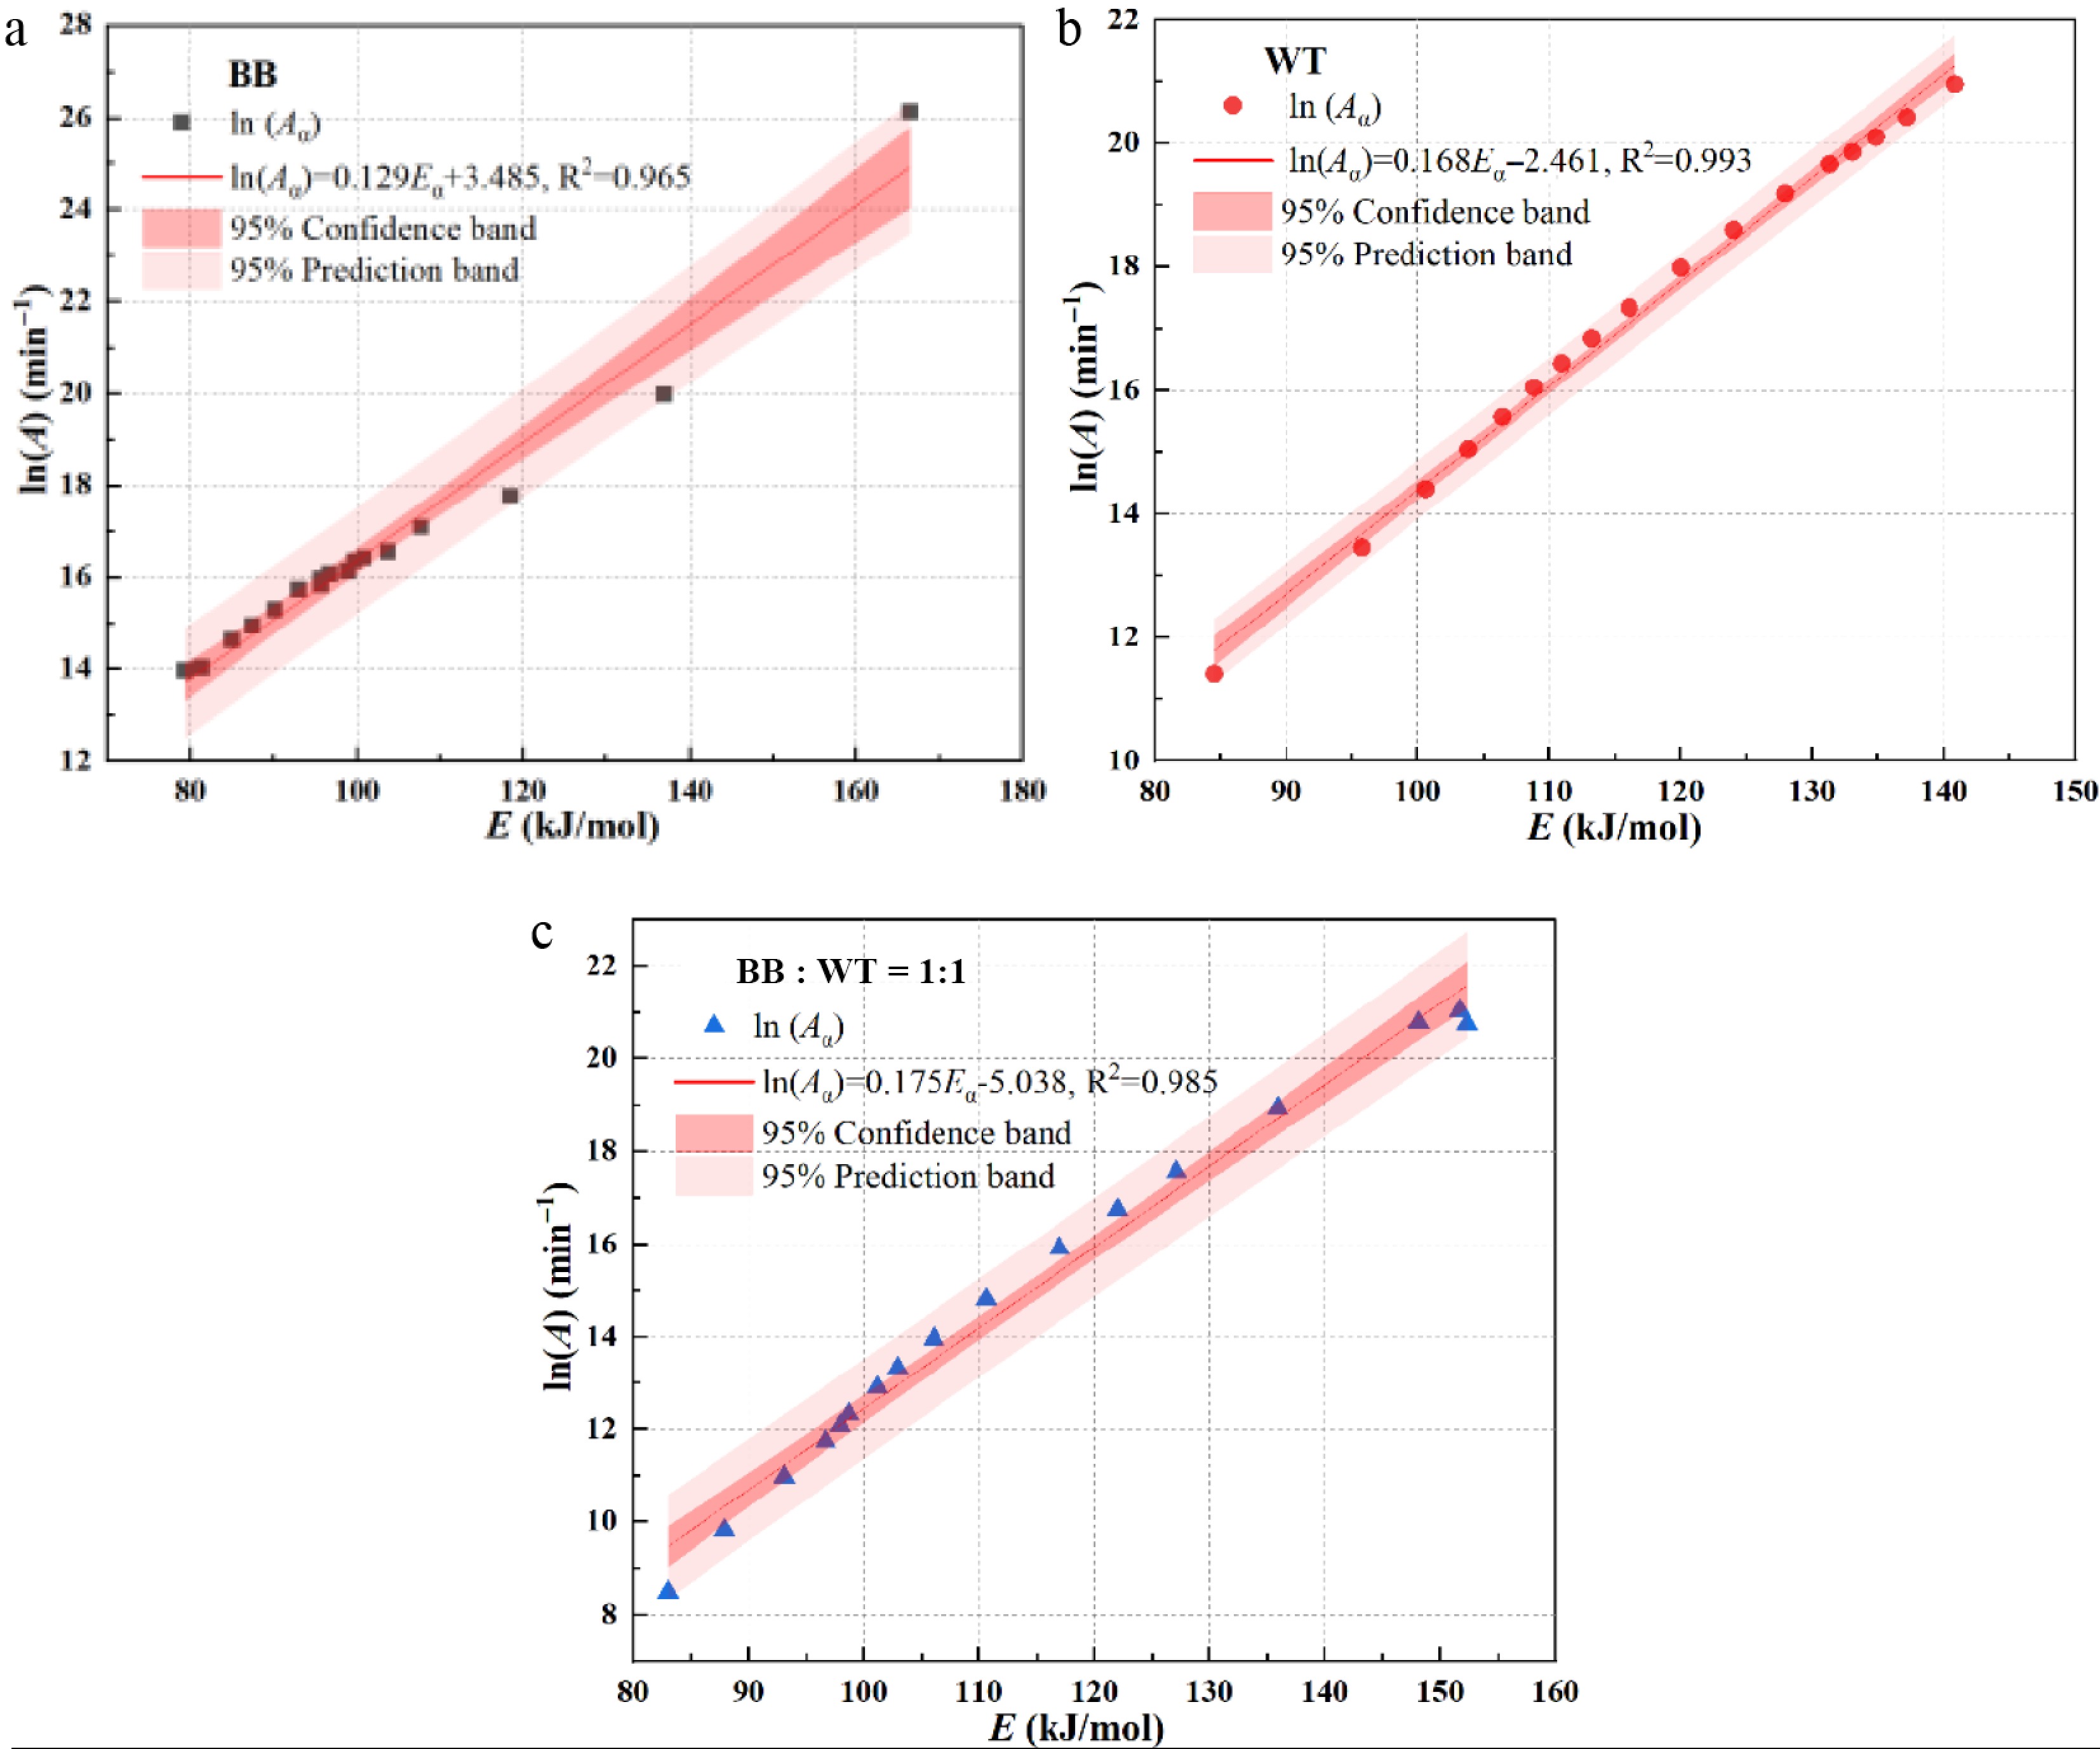
Figure 11.
Linear regression of the compensation effect.
-
Samples Proximate analysis (%) Ultimate analysis (%) Mad Vad Aad FCad HHV (MJ/kg) C H O N S BB 12.76 72.14 0.78 14.32 17.62 44.24 5.21 36.64 0.14 0.23 WT 1.23 61.94 13.04 23.79 36.62 76.08 7.15 1.75 0.53 1.75 M: moisture; V: volatile; A: ash; FC: fixed carbon. Table 1.
Proximate and ultimate analyses of the samples.
-
Reaction mechanism model No. Code $ G(\alpha ) $ $ f(\alpha ) $ Reaction model Chemical reaction 1 F1 $ -\ln (1-\alpha ) $ $ 1-\alpha $ n = 1 reaction 2 F3/2 $ 2[{(1-\alpha )}^{-1/2}-1] $ $ {(1-\alpha )}^{3/2} $ n = 1.5 reaction 3 F2 $ {(1-\alpha )}^{-1}-1 $ $ {(1-\alpha )}^{2} $ n = 2 reaction 4 F3 $ 1/2[{(1-\alpha )}^{-2}-1] $ $ {(1-\alpha )}^{3} $ n = 3 reaction Diffusion controlled reaction 5 D1 $ {\alpha }^{2} $ $ 1/2{\alpha }^{{-}1} $ Parabolic law 6 D2 $ (1-\alpha )\ln (1-\alpha )+\alpha $ $ {[-\ln (1-\alpha )]}^{-1} $ Valensi equation 7 D3 $ {[1-{{(1-\alpha )}^{1/3}}]}^{2} $ $ 3/2{(1-\alpha )}^{2/3}{[1-{{\left(1-\alpha \right)}^{1/3}}]}^{-1} $ Jander equation 8 G-B $ (1-2/3\alpha )-{\left(1-\alpha \right)}^{2/3} $ $ 3/2{\left[{\left(1-\alpha \right)}^{1/3}-1\right]}^{-1} $ Ginstling-Broushtein equation 9 ZH $ {[{{(1-\alpha )}^{-1/3}}-1]}^{2} $ $ 3/2{(1-\alpha )}^{4/3}{[{{\left(1-\alpha \right)}^{-1/3}}-1]}^{-1} $ Zhuralev-Lesokin-Tempelman equation Phase boundary reaction 10 R1 $ \alpha $ 1 1D 11 R2 $ 1-{(1-\alpha )}^{1/2} $ $ 2{(1-\alpha )}^{1/2} $ 2D, shrinking cylinder 12 R3 $ 1-{(1-\alpha )}^{1/3} $ $ 3{(1-\alpha )}^{2/3} $ 3D, shrinking sphere Random nucleation and
subsequent13 A3/2 $ {[-\ln (1-\alpha )]}^{2/3} $ $ 3/2(1-\alpha ){[-\ln (1-\alpha )]}^{1/3} $ Aeveami-Erofeev equation 14 A2 $ {[-\ln (1-\alpha )]}^{1/2} $ $ 2(1-\alpha ){[-\ln (1-\alpha )]}^{1/2} $ Aeveami-Erofeev equation 15 A3 $ {[-\ln (1-\alpha )]}^{1/3} $ $ 3(1-\alpha ){[-\ln (1-\alpha )]}^{2/3} $ Aeveami-Erofeev equation 16 A4 $ {[-\ln (1-\alpha )]}^{1/4} $ $ 4(1-\alpha ){[-\ln (1-\alpha )]}^{3/4} $ Aeveami-Erofeev equation 17 A1 $ [-\ln (1-\alpha )] $ $ (1-\alpha ) $ Aeveami-Erofeev equation 18 A2/3 $ {[-\ln (1-\alpha )]}^{3/2} $ $ 2/3(1-\alpha ){[-\ln (1-\alpha )]}^{-1/2} $ Aeveami-Erofeev equation 19 A1/2 $ {[-\ln (1-\alpha )]}^{2} $ $ 1/2(1-\alpha ){[-\ln (1-\alpha )]}^{-1} $ Aeveami-Erofeev equation 20 A1/3 $ {[-\ln (1-\alpha )]}^{3} $ $ 1/3(1-\alpha ){[-\ln (1-\alpha )]}^{-2} $ Aeveami-Erofeev equation 21 A1/4 $ {[-\ln (1-\alpha )]}^{4} $ $ 1/4(1-\alpha ){[-\ln (1-\alpha )]}^{-3} $ Aeveami-Erofeev equation Mampel power law 22 P1 $ {\alpha }^{1/4} $ $ 4{\alpha }^{3/4} $ Power law 23 P2 $ {\alpha }^{1/3} $ $ 3{\alpha }^{2/3} $ Power law 24 P3 $ {\alpha }^{1/2} $ $ 2{\alpha }^{1/2} $ Power law Table 2.
Common kinetic model functions.
-
Wavelength (cm−1) Functional group Species assignment Ref. 2,932 −CH3, stretching vibration Hydrocarbons [50] 2,324/2,360 C=O, stretching vibration CO2 [51] 1,796, 1,774,
and 1,750−C=O, stretching vibration Aldehydes and
ketones[50] 1,508 Aromatic ring vibration Aromatic [50] 1,456 −CH3, bending vibration Hydrocarbons [50] 892 =C–H, wagging vibration Alkene [52] 668 −C–H, out-of-plane bending Benzene [53] Table 3.
Characteristic wavenumber bands of functional groups and evolved gases.
-
α BB WT BB : WT = 1:1 KAS FWO Friedman KAS FWO Friedman KAS FWO Friedman 0.1 80.0 84.9 73.3 75.9 82.0 95.7 80.8 85.9 82.2 0.15 78.7 83.9 81.5 88.2 94.2 104.9 83.8 89.1 90.9 0.2 80.8 86.2 87.9 93.6 99.5 108.9 87.9 93.2 98.2 0.25 82.4 87.8 92.1 97.2 103.0 111.3 91.7 97.0 101.3 0.3 84.6 90.1 95.8 99.7 105.5 114.0 94.1 99.5 100.3 0.35 87.6 93.0 98.3 102.0 107.7 116.8 95.3 100.8 100.0 0.4 90.9 96.3 99.6 104.2 109.9 118.8 96.6 102.1 104.8 0.45 91.8 97.2 97.9 106.2 111.9 121.6 98.1 103.7 107.0 0.5 93.1 98.6 98.5 108.6 114.3 125.4 100.0 105.5 112.8 0.55 94.1 99.7 102.8 111.4 117.0 131.7 102.8 108.3 120.9 0.6 95.2 100.7 103.4 115.0 120.6 136.4 107.2 112.6 130.9 0.65 95.9 101.5 105.3 119.5 124.9 139.6 112.7 118.0 135.3 0.7 96.6 102.3 112.5 123.9 129.2 140.9 118.3 123.4 139.7 0.75 98.2 103.9 121.1 127.2 132.5 139.4 125.3 130.2 152.1 0.8 101.0 106.6 121.1 130.0 135.2 139.4 136.4 141.0 167.2 0.85 109.3 114.6 147.9 132.3 137.6 141.8 145.9 150.2 159.0 0.9 154.5 158.1 186.9 135.4 140.7 146.4 149.1 153.6 154.3 Average 95.0 100.3 107.4 110.0 115.6 125.5 107.4 112.6 121.0 Table 4.
E of BB, WT, and their blend at different conversion.
-
No. Code 10 °C/min 20 °C/min 30 °C/min 40 °C/min Average R2 Average E R2 E R2 E R2 E R2 E 1 F1 0.982 61.24 0.987 66.01 0.991 69.58 0.992 70.85 0.988 66.92 2 F3/2 0.984 74.27 0.985 79.96 0.985 84.18 0.983 85.41 0.984 80.96 3 F2 0.975 89.23 0.974 95.95 0.969 100.92 0.965 102.08 0.971 97.05 4 F3 0.945 123.89 0.940 133.02 0.931 139.70 0.922 140.67 0.935 134.32 5 D1 0.950 92.37 0.958 99.37 0.970 104.62 0.977 107.33 0.964 100.92 6 D2 0.965 103.44 0.972 111.23 0.982 117.07 0.987 119.81 0.977 112.89 7 D3 0.980 117.47 0.984 126.26 0.990 132.83 0.993 135.56 0.987 128.03 8 G-B 0.970 108.05 0.977 116.18 0.985 122.26 0.990 124.99 0.981 117.87 9 ZH 0.987 149.54 0.989 160.59 0.989 168.79 0.988 171.44 0.988 162.59 10 R1 0.935 41.12 0.947 44.46 0.962 46.98 0.971 48.25 0.954 45.20 11 R2 0.967 50.22 0.974 54.21 0.984 57.21 0.989 58.50 0.979 55.04 12 R3 0.973 53.67 0.980 57.91 0.988 61.09 0.992 62.37 0.983 58.76 13 A3/2 0.979 37.45 0.984 40.52 0.989 42.83 0.991 43.63 0.986 41.11 14 A2 0.974 25.56 0.981 27.78 0.987 29.46 0.989 30.02 0.983 28.21 15 A3 0.958 13.66 0.970 15.04 0.981 16.09 0.985 16.40 0.974 15.30 16 A4 0.924 7.71 0.948 8.67 0.969 9.40 0.976 9.60 0.954 8.85 17 A1 0.982 61.24 0.987 66.01 0.991 69.58 0.992 70.85 0.988 66.92 18 A2/3 0.984 96.92 0.988 104.24 0.992 109.69 0.993 111.60 0.989 105.61 19 A1/2 0.985 132.61 0.989 142.47 0.992 149.81 0.993 152.51 0.990 144.35 20 A1/3 0.986 203.96 0.989 218.93 0.993 230.04 0.993 234.18 0.990 221.78 21 A1/4 0.986 275.34 0.990 295.39 0.993 310.27 0.994 315.85 0.991 299.21 22 P1 0.430 2.68 0.550 3.28 0.676 3.76 0.738 3.95 0.599 3.42 23 P2 0.763 6.95 0.813 7.85 0.869 8.56 0.897 8.87 0.836 8.06 24 P3 0.882 15.50 0.907 17.01 0.934 18.16 0.975 18.72 0.925 17.35 Values in boldface indicate the reaction mechanism models with better fitting results. Table 5.
The R2 of linear fitting of
$ {\ln(} \dfrac{{g(\alpha)}}{{{T}}^{{2}}}{)} $ -
No. Code 10 °C/min 20 °C/min 30 °C/min 40 °C/min Average R2 Average E R2 E R2 E R2 E R2 E 1 F1 0.986 78.64 0.986 85.50 0.985 85.50 0.987 97.78 0.986 86.86 2 F3/2 0.986 95.03 0.987 103.35 0.986 108.45 0.991 118.03 0.988 106.22 3 F2 0.977 113.82 0.979 123.83 0.977 130.02 0.985 141.27 0.980 127.24 4 F3 0.946 157.38 0.949 171.31 0.948 180.04 0.958 195.18 0.950 175.98 5 D1 0.953 117.76 0.951 127.43 0.952 133.13 0.947 145.08 0.951 130.85 6 D2 0.968 131.71 0.967 142.58 0.967 149.05 0.964 162.25 0.967 146.40 7 D3 0.981 149.38 0.981 161.80 0.980 169.27 0.980 184.04 0.981 166.12 8 G-B 0.973 137.53 0.972 148.90 0.972 155.70 0.970 169.41 0.972 152.89 9 ZH 0.989 189.73 0.989 205.71 0.988 215.49 0.992 233.85 0.990 211.20 10 R1 0.942 53.30 0.940 57.96 0.942 60.69 0.937 66.55 0.940 59.63 11 R2 0.971 64.77 0.971 70.42 0.971 73.79 0.969 80.67 0.971 72.41 12 R3 0.978 69.12 0.977 75.14 0.977 78.76 0.977 86.03 0.977 77.26 13 A3/2 0.983 48.71 0.984 53.16 0.983 55.86 0.985 61.20 0.984 54.73 14 A2 0.980 33.74 0.981 36.99 0.980 38.96 0.983 42.90 0.981 38.15 15 A3 0.972 18.78 0.973 20.82 0.973 22.05 0.976 24.61 0.974 21.57 16 A4 0.956 11.29 0.960 12.74 0.959 13.60 0.966 15.46 0.960 13.27 17 A1 0.986 78.64 0.986 85.50 0.985 89.66 0.987 97.78 0.986 87.90 18 A2/3 0.987 123.54 0.987 134.01 0.986 140.37 0.988 152.66 0.987 137.65 19 A1/2 0.987 168.43 0.988 182.53 0.987 191.08 0.989 207.54 0.988 187.40 20 A1/3 0.988 258.22 0.988 279.55 0.987 292.49 0.989 317.30 0.988 286.89 21 A1/4 0.988 348.02 0.988 376.57 0.988 393.91 0.989 427.07 0.988 386.39 22 P1 0.658 4.96 0.692 5.85 0.714 6.36 0.736 7.65 0.700 6.21 23 P2 0.833 10.33 0.841 11.64 0.849 12.40 0.849 14.20 0.843 12.14 24 P3 0.906 21.08 0.907 23.22 0.910 24.47 0.905 27.29 0.907 24.02 Values in boldface indicate the reaction mechanism models with better fitting results. Table 6.
The R2 of linear fitting of
$ \ln( \dfrac{{g(\alpha)}}{{T}^{2}}) $ -
No. Code 10 °C/min 20 °C/min 30 °C/min 40 °C/min Average R2 Average E R2 E R2 E R2 E R2 E 1 F1 0.987 53.13 0.99 58.42 0.993 63.88 0.995 65.6 0.991 60.26 2 F3/2 0.996 64.99 0.997 71.29 0.994 77.97 0.995 79.64 0.996 73.47 3 F2 0.993 78.6 0.991 86.08 0.984 94.14 0.985 95.75 0.988 88.64 4 F3 0.97 110.18 0.965 120.37 0.951 131.65 0.952 133.09 0.960 123.82 5 D1 0.936 80.35 0.945 88.06 0.957 96.68 0.959 99.09 0.949 91.05 6 D2 0.957 90.39 0.964 98.96 0.974 108.65 0.975 111.04 0.968 102.26 7 D3 0.977 103.14 0.982 112.81 0.988 123.82 0.989 126.18 0.984 116.49 8 G-B 0.967 94.58 0.971 103.52 0.98 113.64 0.981 116.02 0.975 106.94 9 ZH 0.996 132.3 0.997 144.48 0.996 158.51 0.997 160.75 0.997 149.01 10 R1 0.913 34.86 0.926 38.57 0.94 42.12 0.947 43.9 0.932 39.86 11 R2 0.959 43.12 0.968 47.54 0.976 51.96 0.979 53.72 0.971 49.09 12 R3 0.971 46.26 0.977 50.94 0.984 55.69 0.986 57.44 0.980 52.58 13 A3/2 0.983 31.88 0.988 35.3 0.991 38.44 0.993 39.97 0.989 36.40 14 A2 0.977 21.25 0.984 23.75 0.987 25.72 0.992 27.15 0.985 24.47 15 A3 0.955 10.63 0.97 12.19 0.973 13 0.985 14.33 0.971 12.54 16 A4 0.894 5.31 0.935 6.41 0.932 6.64 0.971 7.93 0.933 6.57 17 A1 0.987 53.13 0.99 58.42 0.993 63.88 0.995 65.6 0.991 60.26 18 A2/3 0.989 85.01 0.992 93.09 0.994 102.06 0.995 104.05 0.993 96.05 19 A1/2 0.99 116.89 0.992 127.75 0.995 140.19 0.996 142.5 0.993 131.83 20 A1/3 0.99 180.65 0.993 197.09 0.995 216.51 0.996 219.4 0.994 203.41 21 A1/4 0.991 244.41 0.993 266.43 0.995 292.82 0.996 296.29 0.994 274.99 22 P1 0.062 0.75 0.143 1.45 0.065 1.2 0.405 2.5 0.169 1.48 23 P2 0.568 4.54 0.665 5.58 0.654 5.75 0.78 7.1 0.667 5.74 24 P3 0.823 12.12 0.856 13.82 0.869 14.84 0.9 16.3 0.862 14.27 Values in boldface indicate the reaction mechanism models with better fitting results. Table 7.
The R2 of linear fitting of
$ \ln( \dfrac{{g(\alpha)}}{{{T}}^{2}}) $
Figures
(11)
Tables
(7)