-
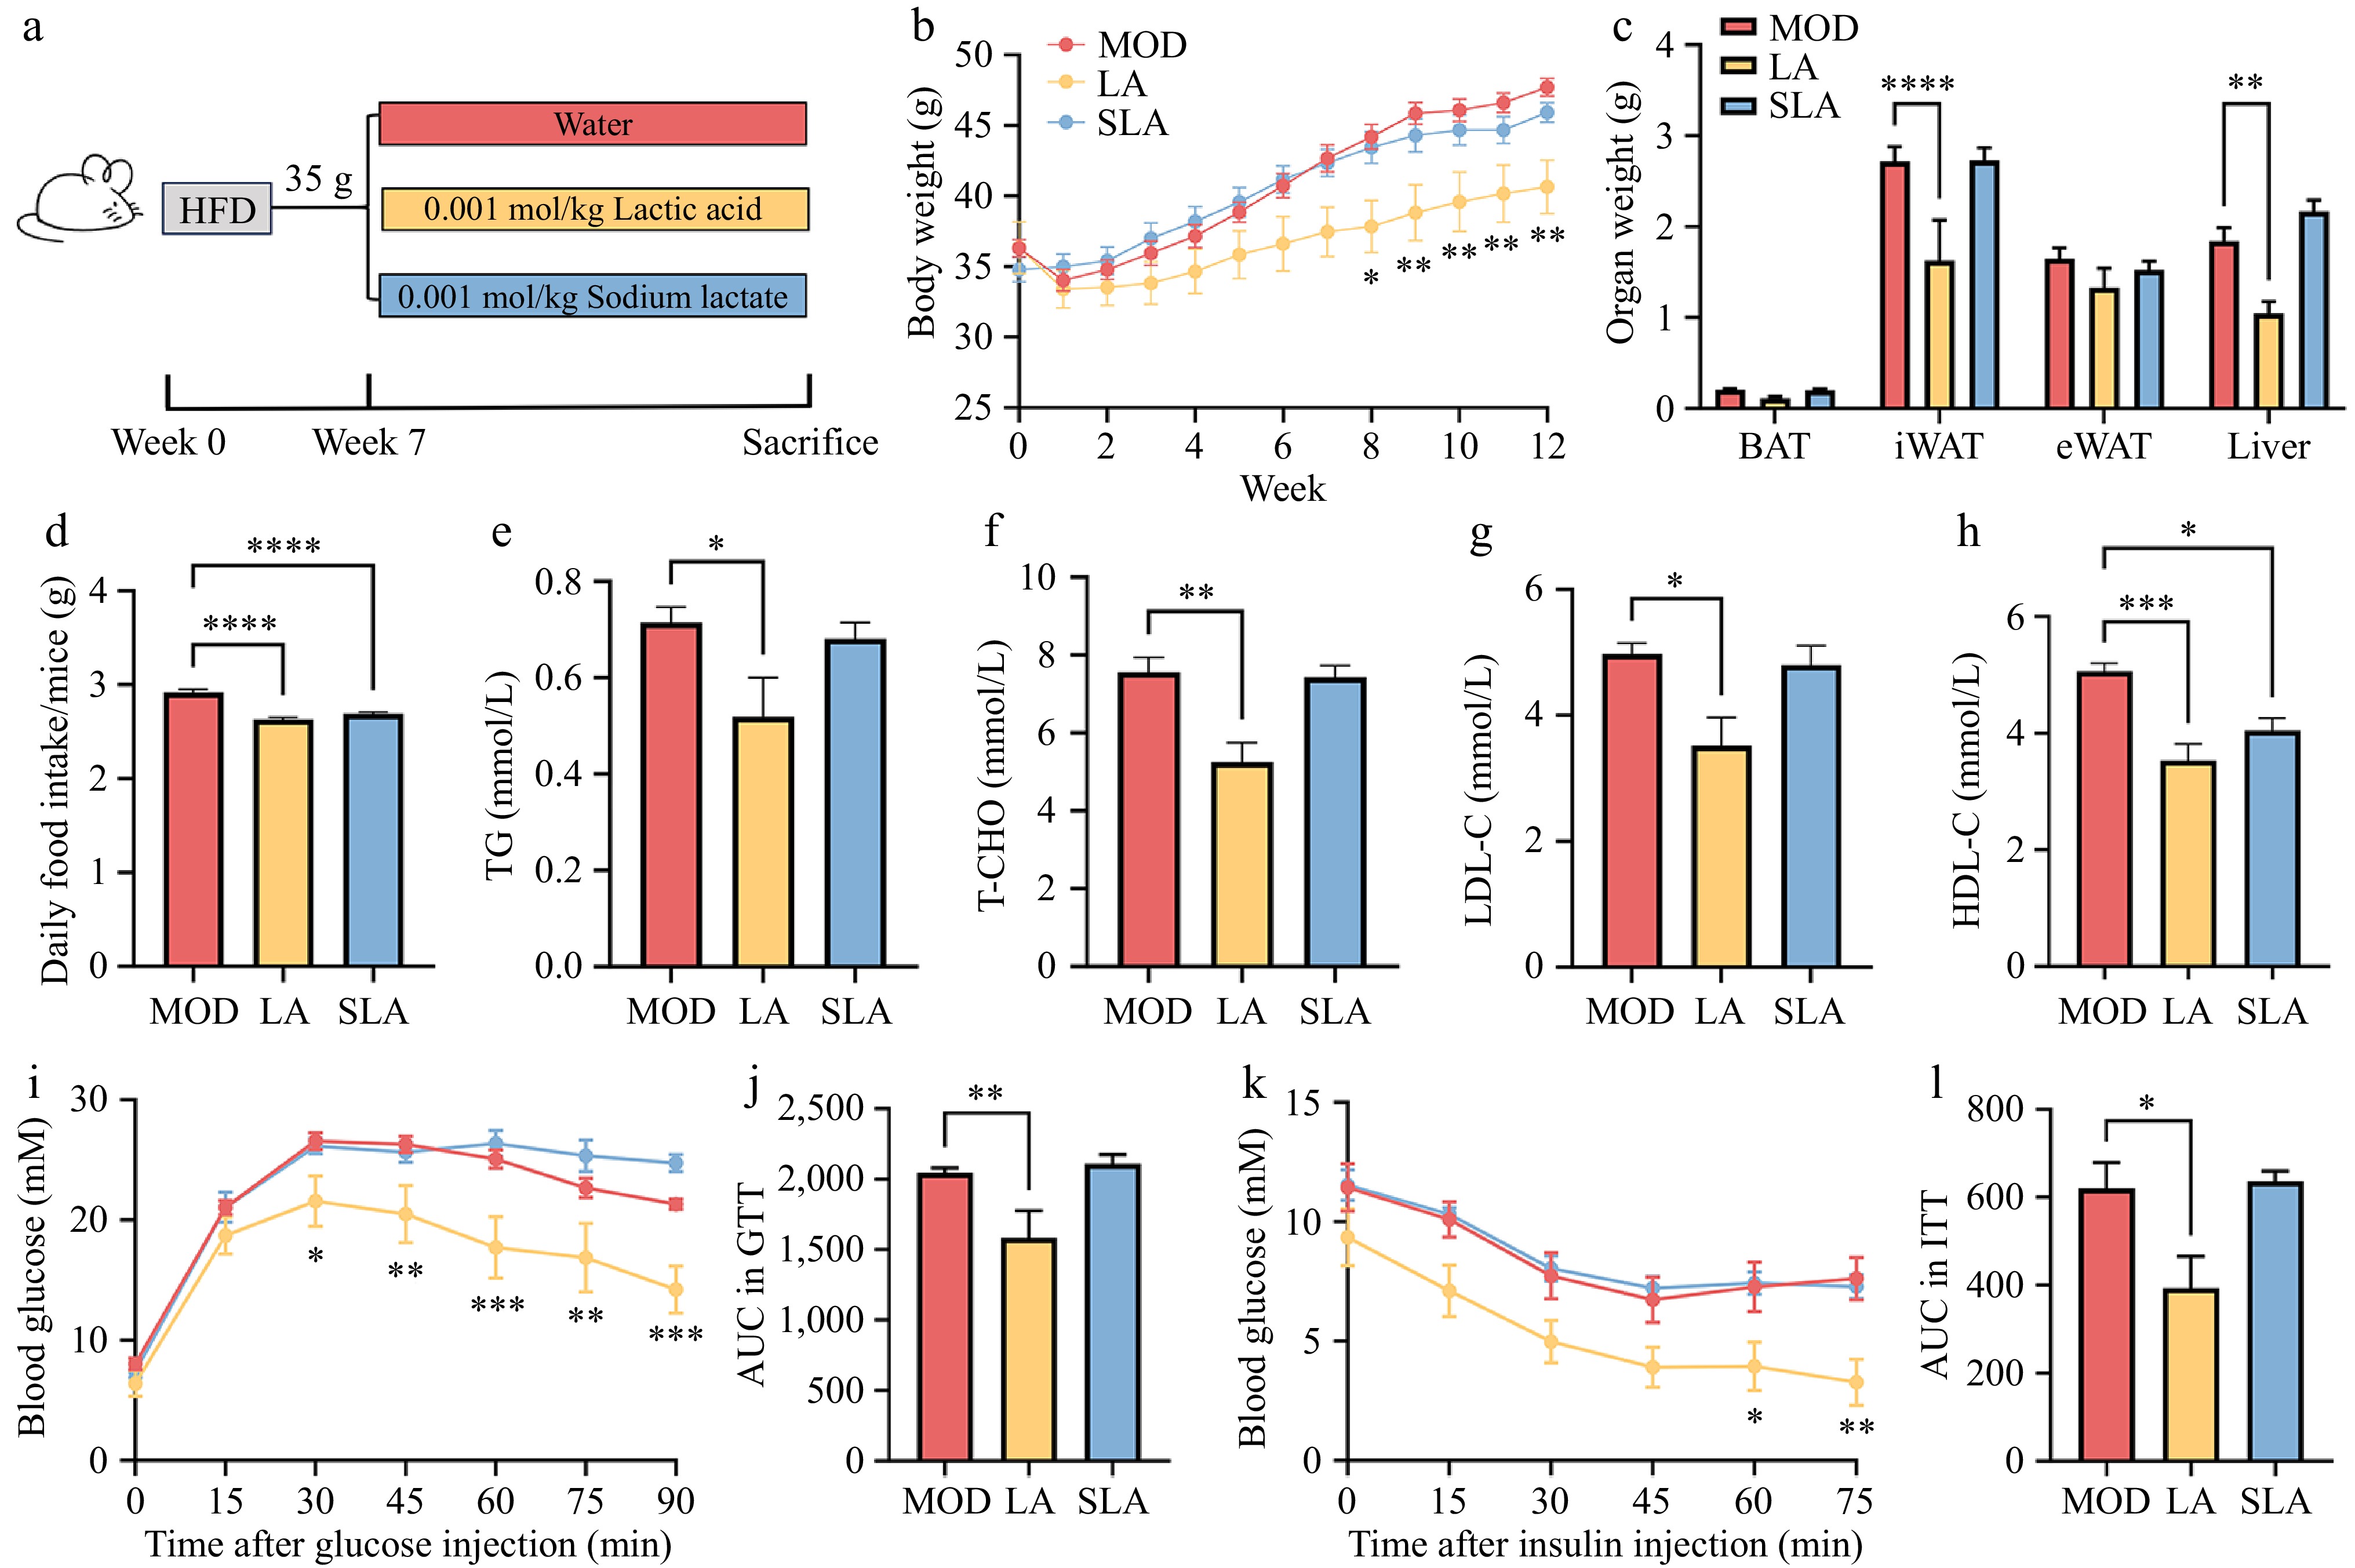
Figure 1.
Lactic acid treatment alleviates obesity in mice. Male WT mice were fed from 6 to 30 weeks of age [(b), n = 7, (c)–(l), n = 6]. (a) Schematic diagram of mouse treatment. (b) Body weight changes. (c) Tissue weight of BAT, iWAT, eWAT, and liver. (d) Food intake. (e) Serum levels of triglycerides, (f) total cholesterol, (g) low-density lipoprotein cholesterol, and (h) high-density lipoprotein cholesterol. (i) Glucose tolerance test curve, and (j) area under the curve (AUC). (k) Insulin tolerance test curve, and (l) area under the curve (AUC). Data are presented as mean ± SEM. * p < 0.05, ** p < 0.01, *** p < 0.001, and **** p < 0.0001 compared to control. Statistical analysis was performed using one-way ANOVA followed by Tukey's post hoc test.
-
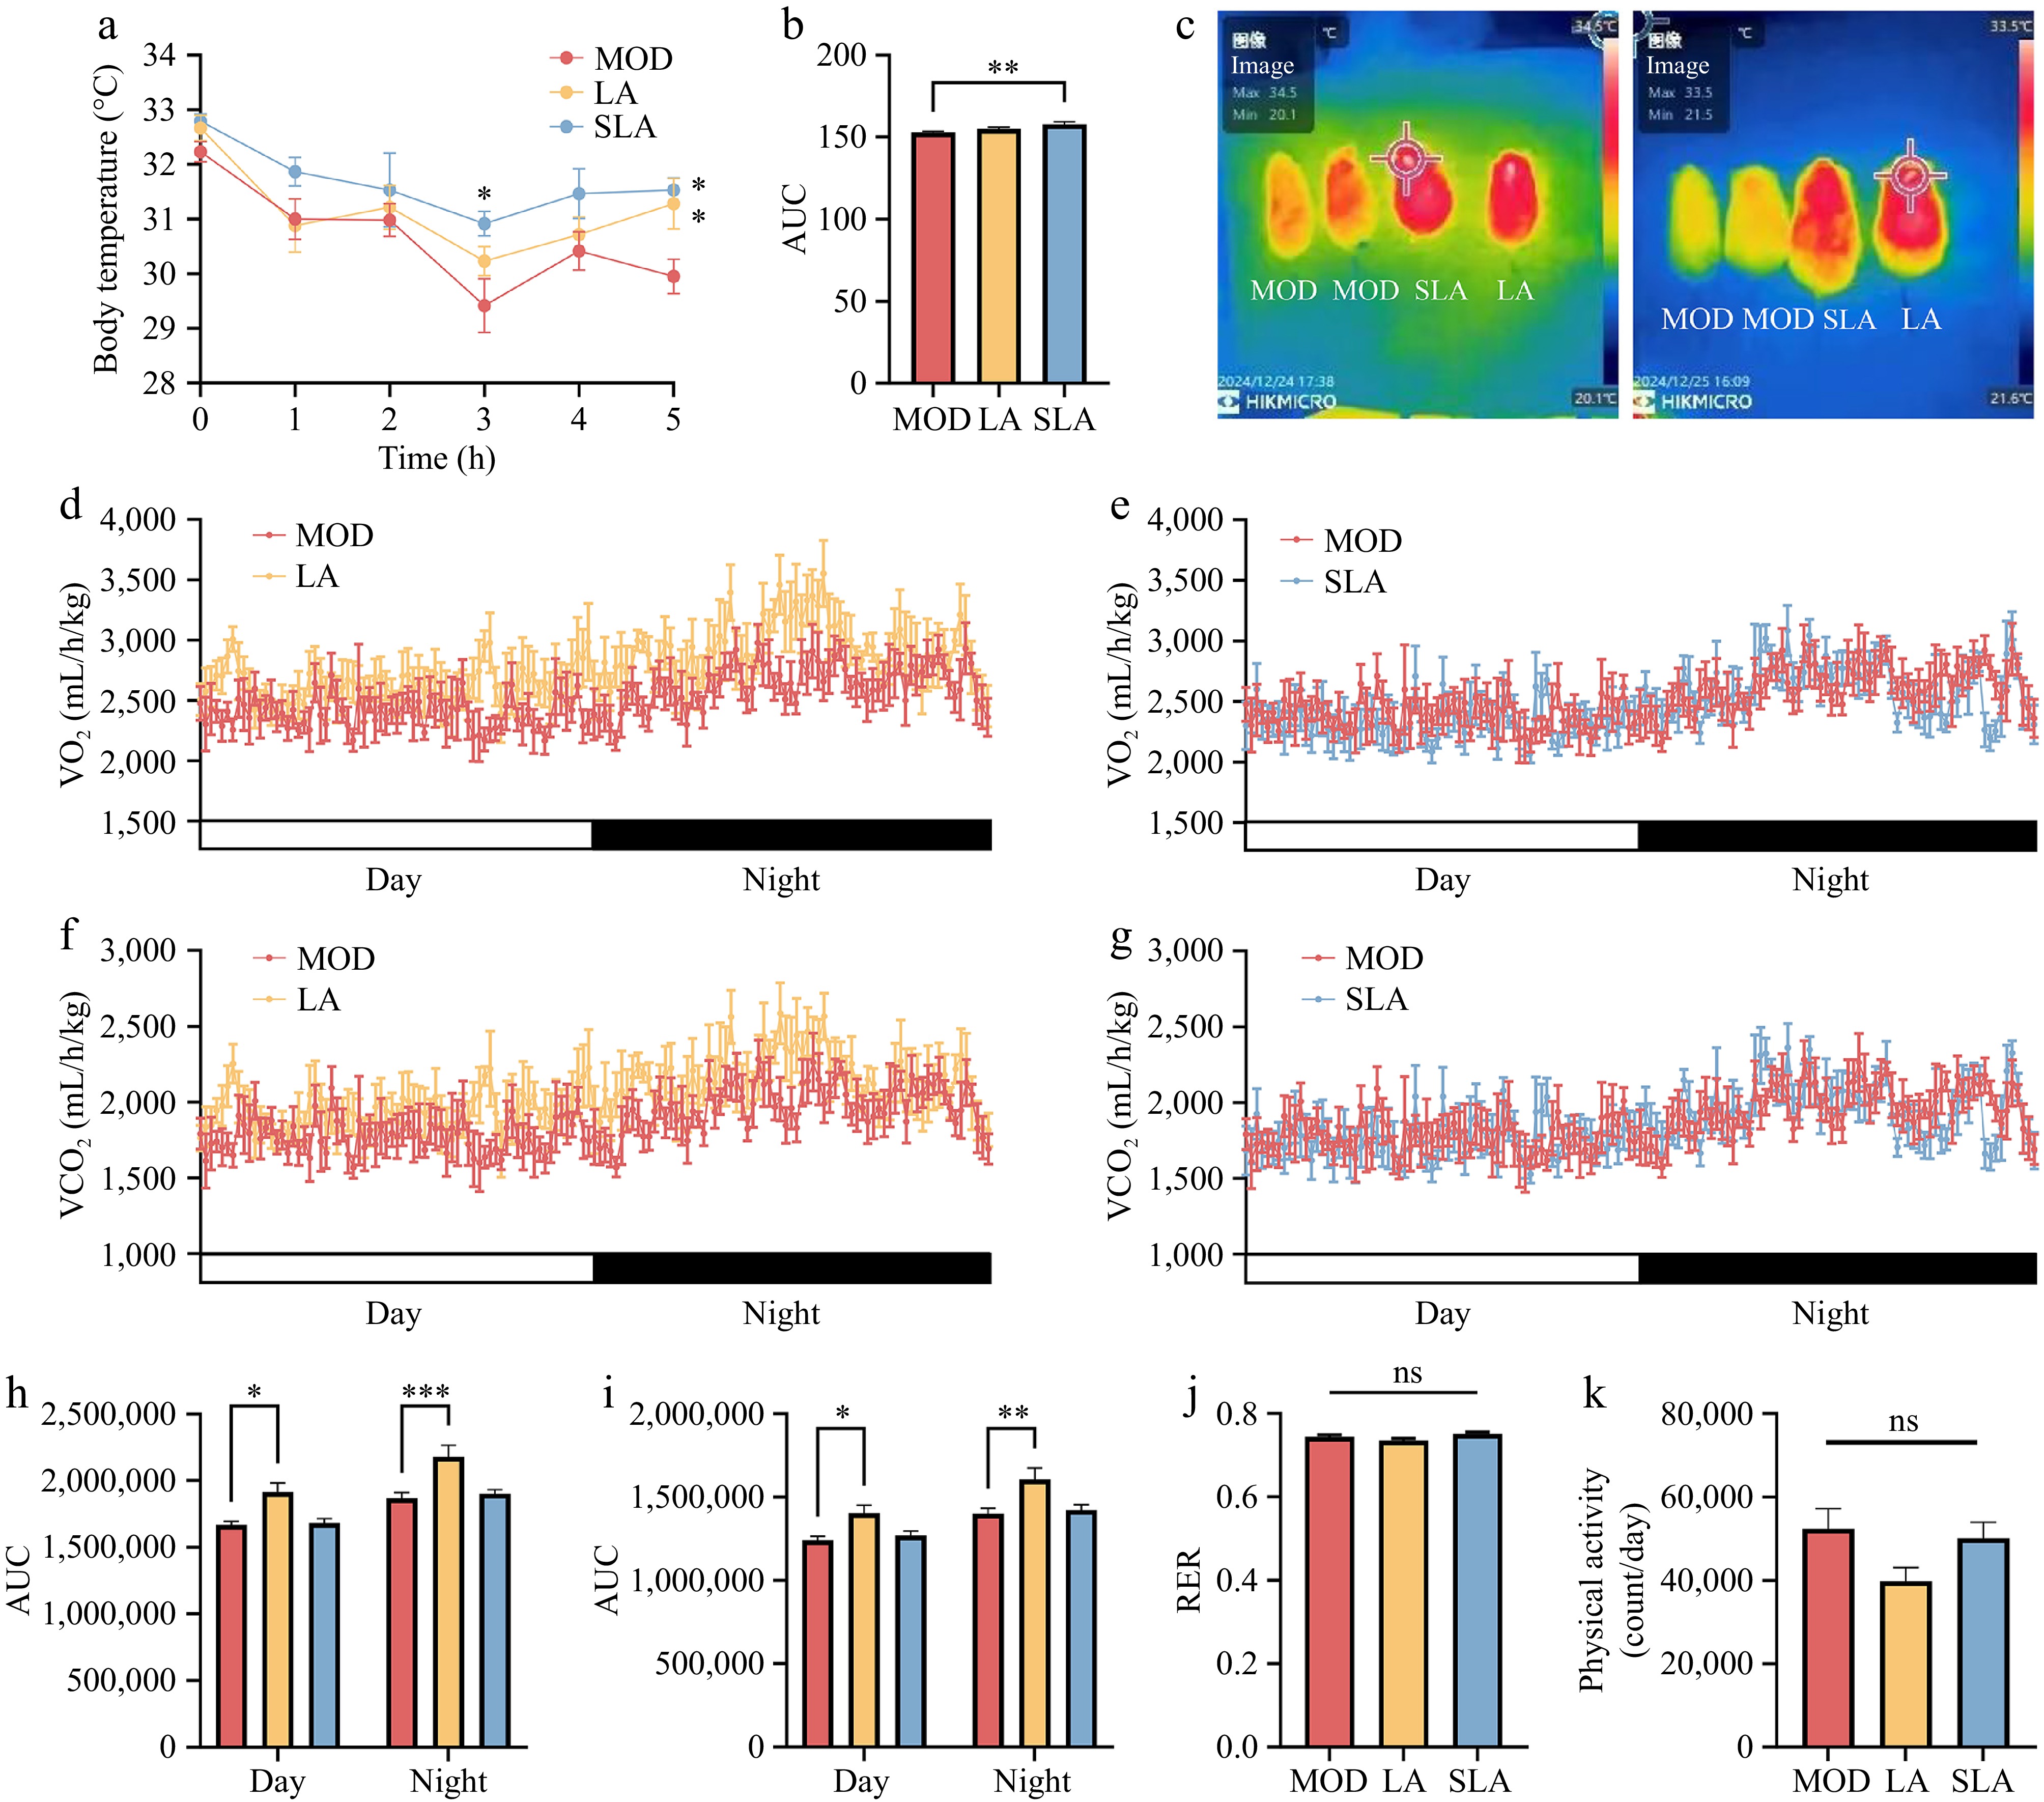
Figure 2.
Lactic acid treatment enhances metabolism and thermogenesis in mice (n = 6 for all animal experiments). (a) Changes in colonic temperature of mice at 4 °C, and (b) the area under the curve (AUC). (c) Infrared thermographic images of the back of mice after 5 h of 4 °C treatment. Oxygen consumption over 24 h in (d) lactic acid-treated mice, and (e) sodium lactate-treated mice. Carbon dioxide consumption over 24 h in (f) lactic acid-treated mice, and (g) sodium lactate-treated mice. AUC for (h) oxygen consumption, and (i) carbon dioxide consumption over 24 h. (j) Respiratory exchange ratio (RER) of mice. (k) Physical activity of mice. Data are presented as mean ± SEM. * p < 0.05, ** p < 0.01, *** p < 0.001, and **** p < 0.0001 compared to control. Statistical analysis was performed using one-way ANOVA followed by Tukey's post hoc test.
-
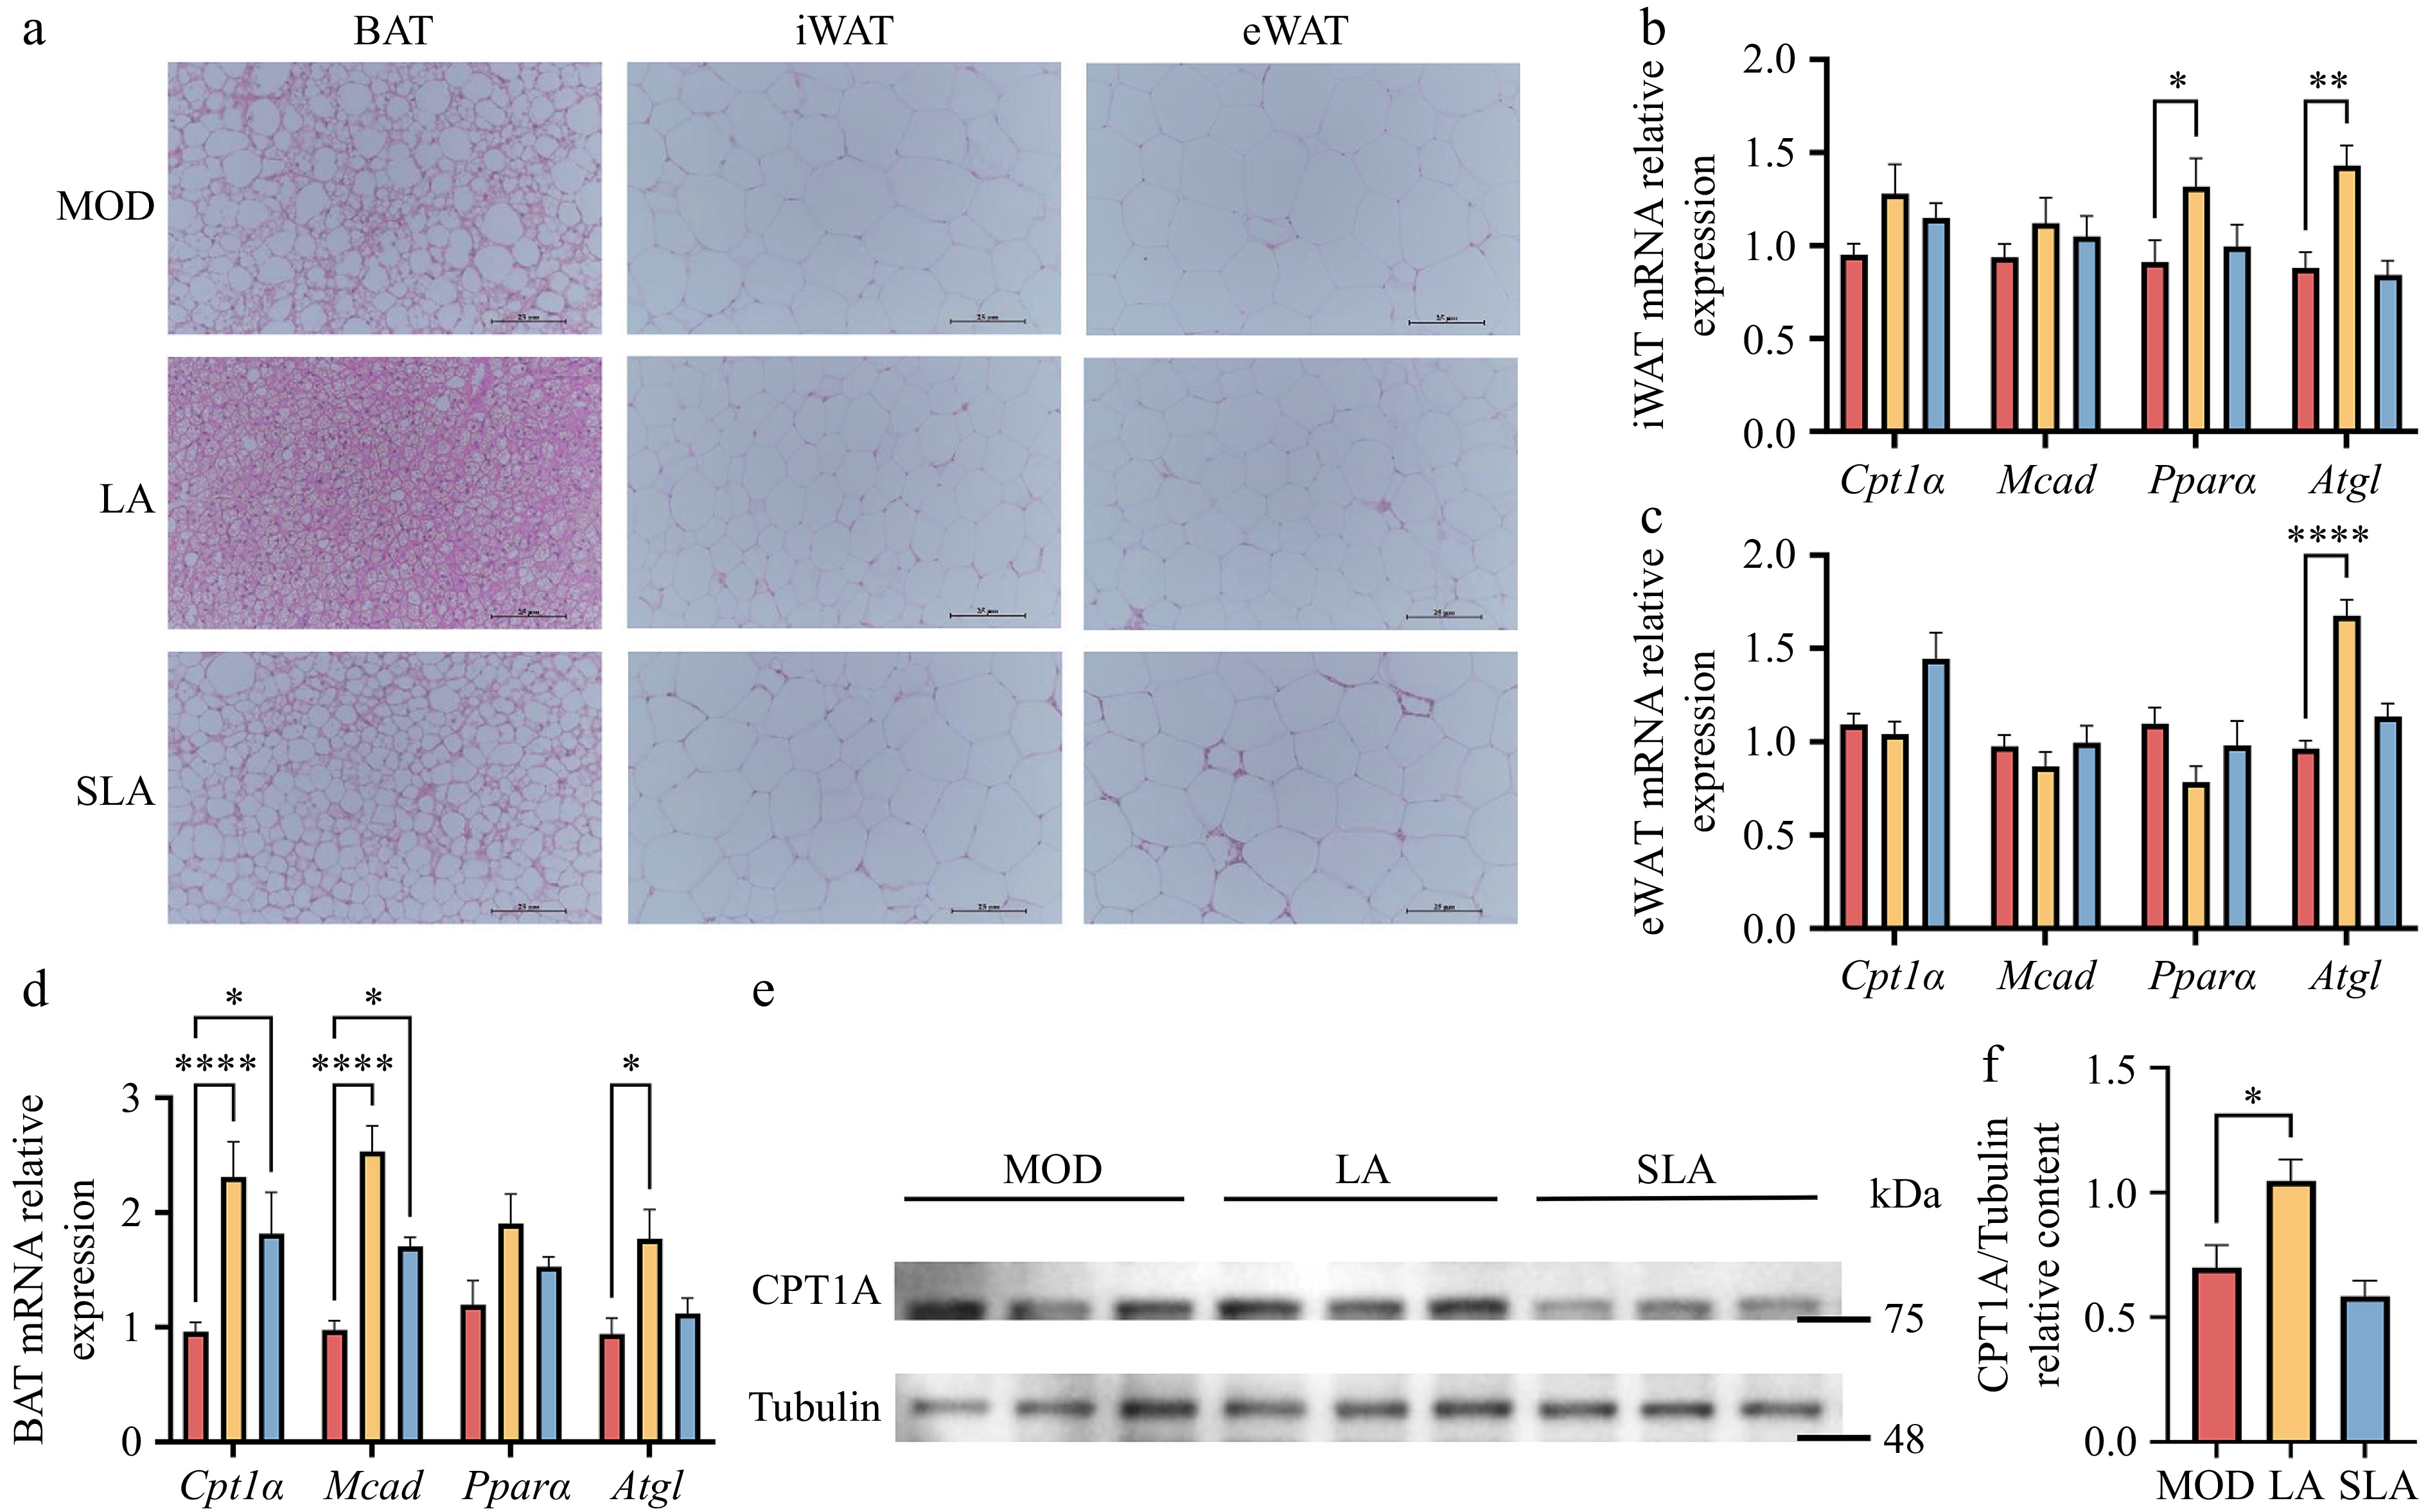
Figure 3.
Lactic acid treatment improves metabolic dysregulation in adipose tissue of high-fat diet mice [(b)–(d), n = 5; (e), (f), n = 3). (a) Representative H&E staining images of BAT, iWAT, and eWAT from mice in Fig. 1. Scale bar: 25 μm. Expression of lipid metabolism-related genes in (b) iWAT, (c) eWAT, and (d) BAT. (e) CPT1A protein expression in BAT. (f) Quantification of Cpt1A protein levels. Data are presented as mean ± SEM. * p < 0.05, ** p < 0.01, *** p < 0.001, and **** p < 0.0001 compared to control. Statistical analysis was performed using one-way ANOVA followed by Tukey's post hoc test.
-
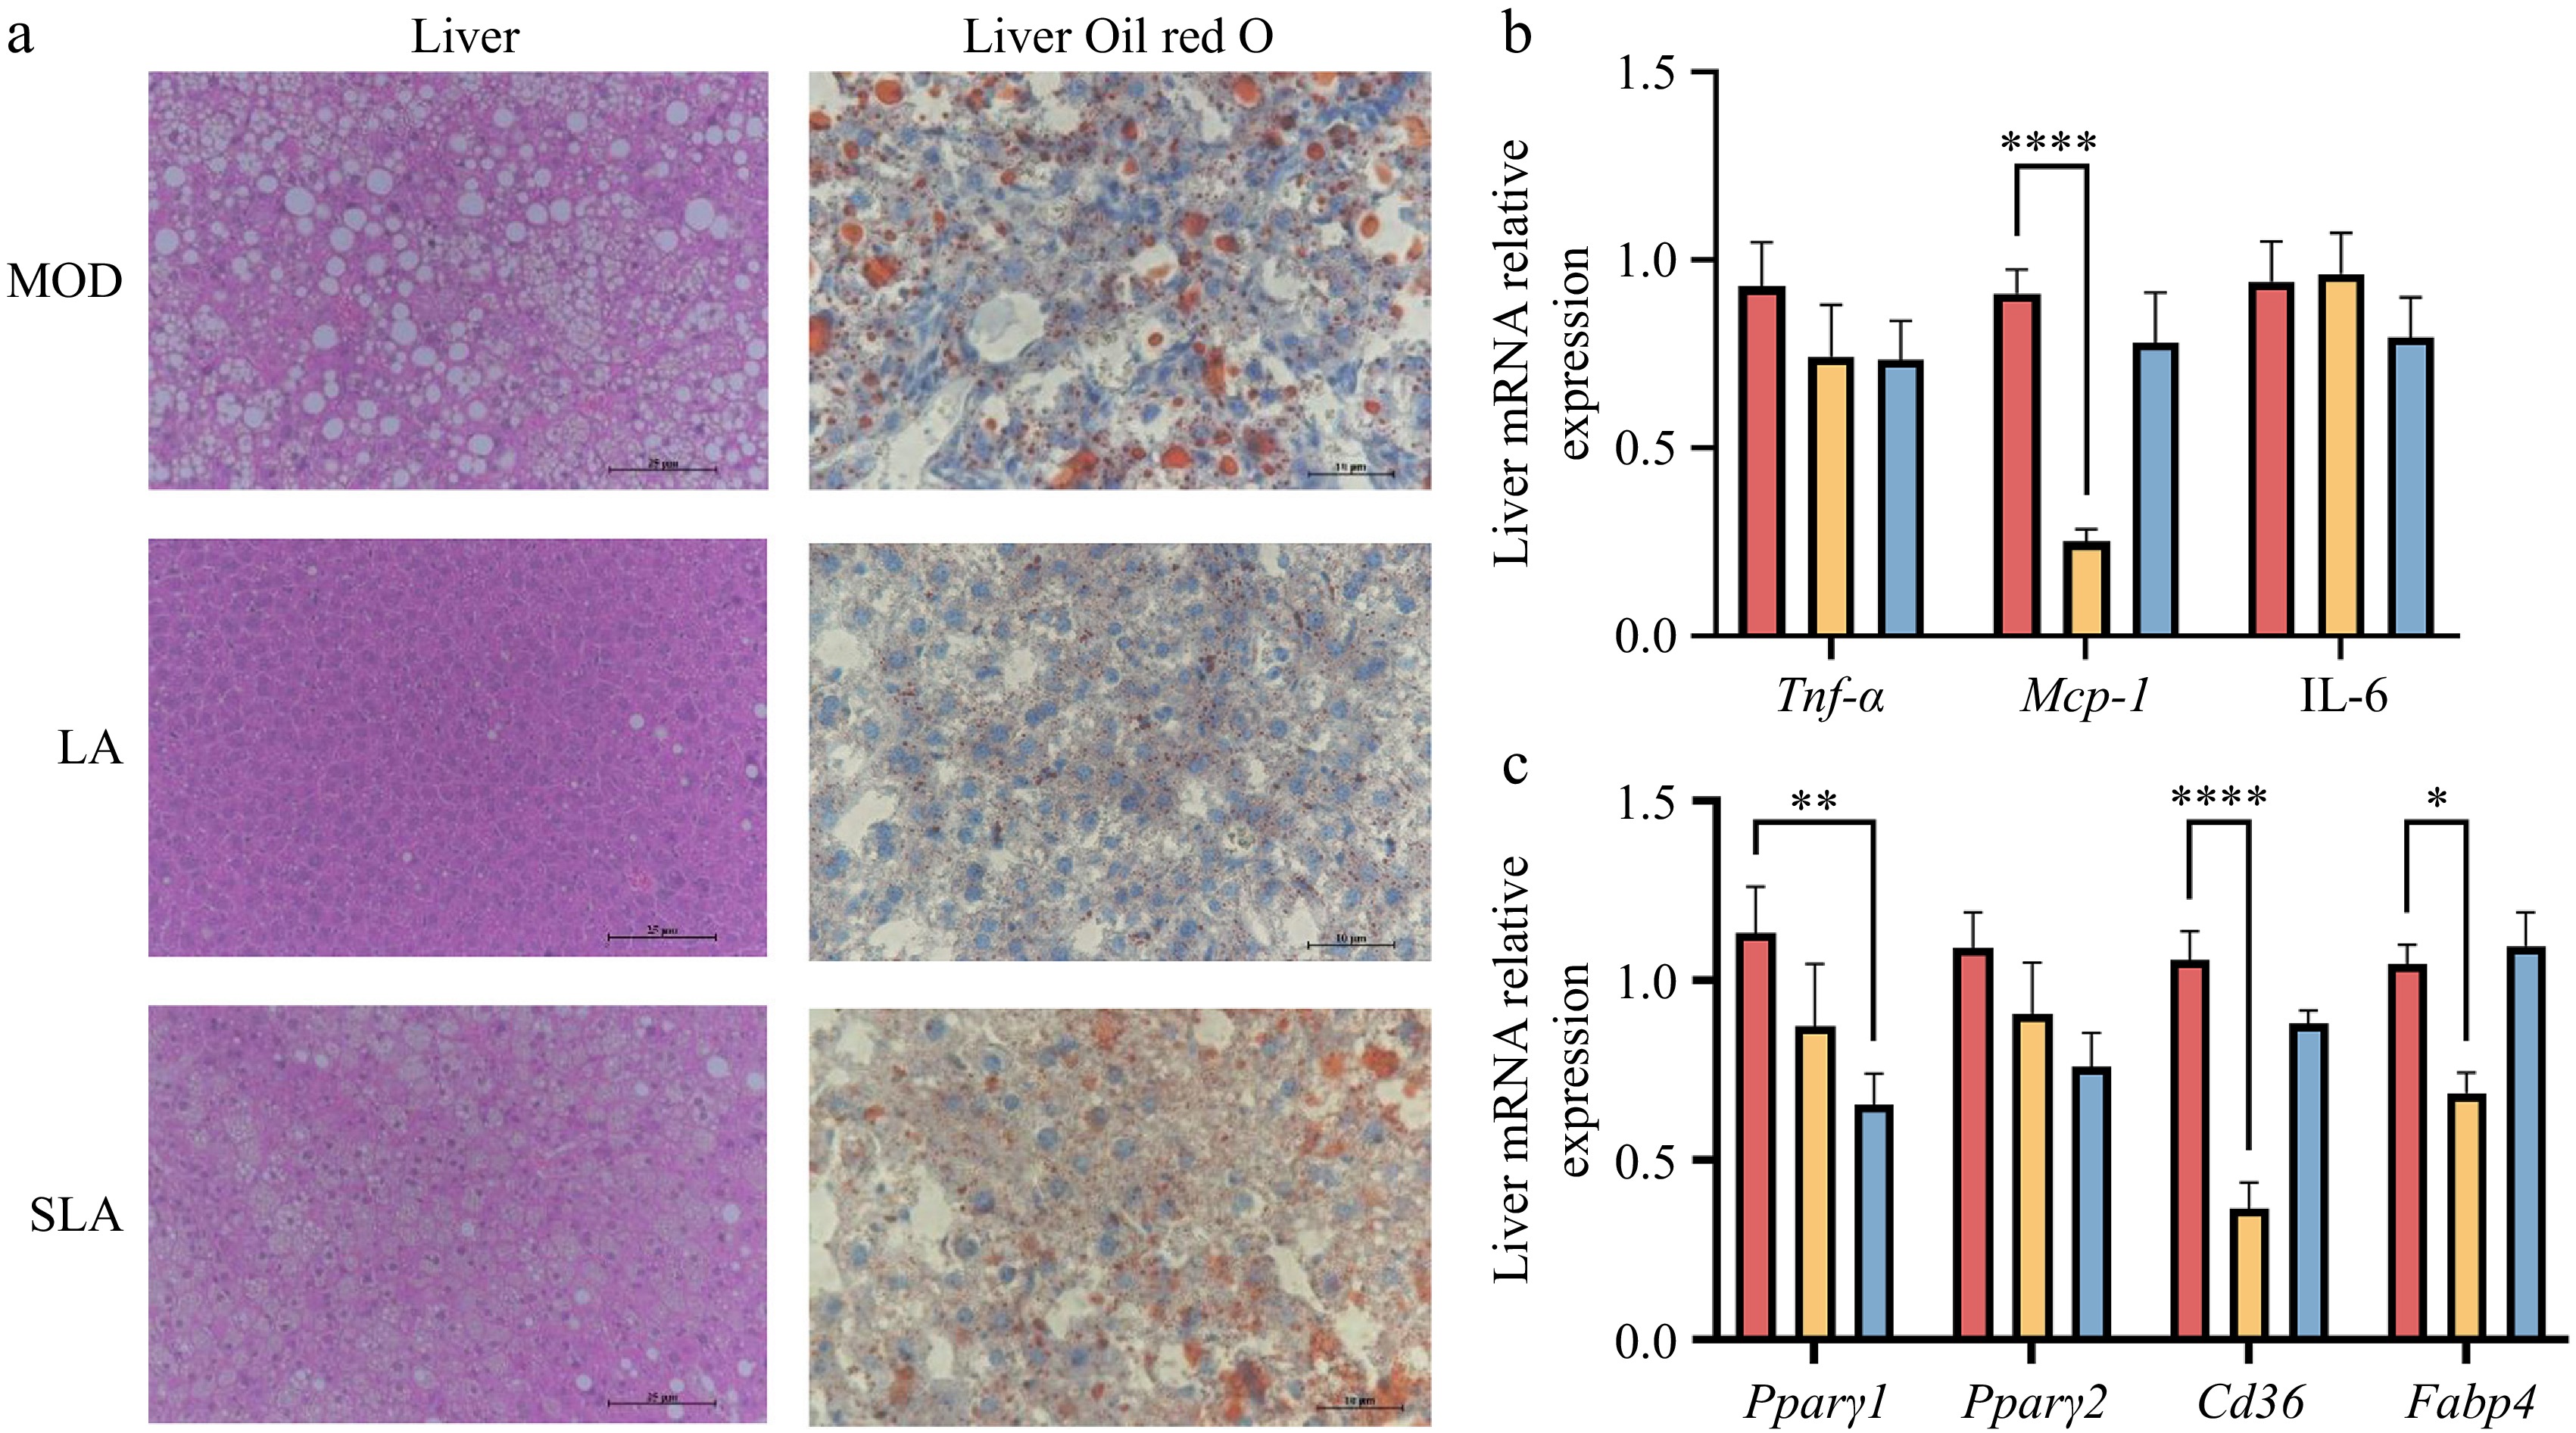
Figure 4.
Lactic acid treatment improves liver dysfunction in high-fat diet-induced obese mice [(b), (c), n = 5). (a) Representative H&E and Oil Red O staining images of liver from mice in Fig. 1. H&E scale bar: 25 μm, Oil red O scale bar: 10 μm. Expression of (b) inflammation, and (c) lipid storage related genes in the liver. Data are presented as mean ± SEM. * p < 0.05, ** p < 0.01, *** p < 0.001, and **** p < 0.0001 compared to control. Statistical analysis was performed using one-way ANOVA followed by Tukey's post hoc test.
-
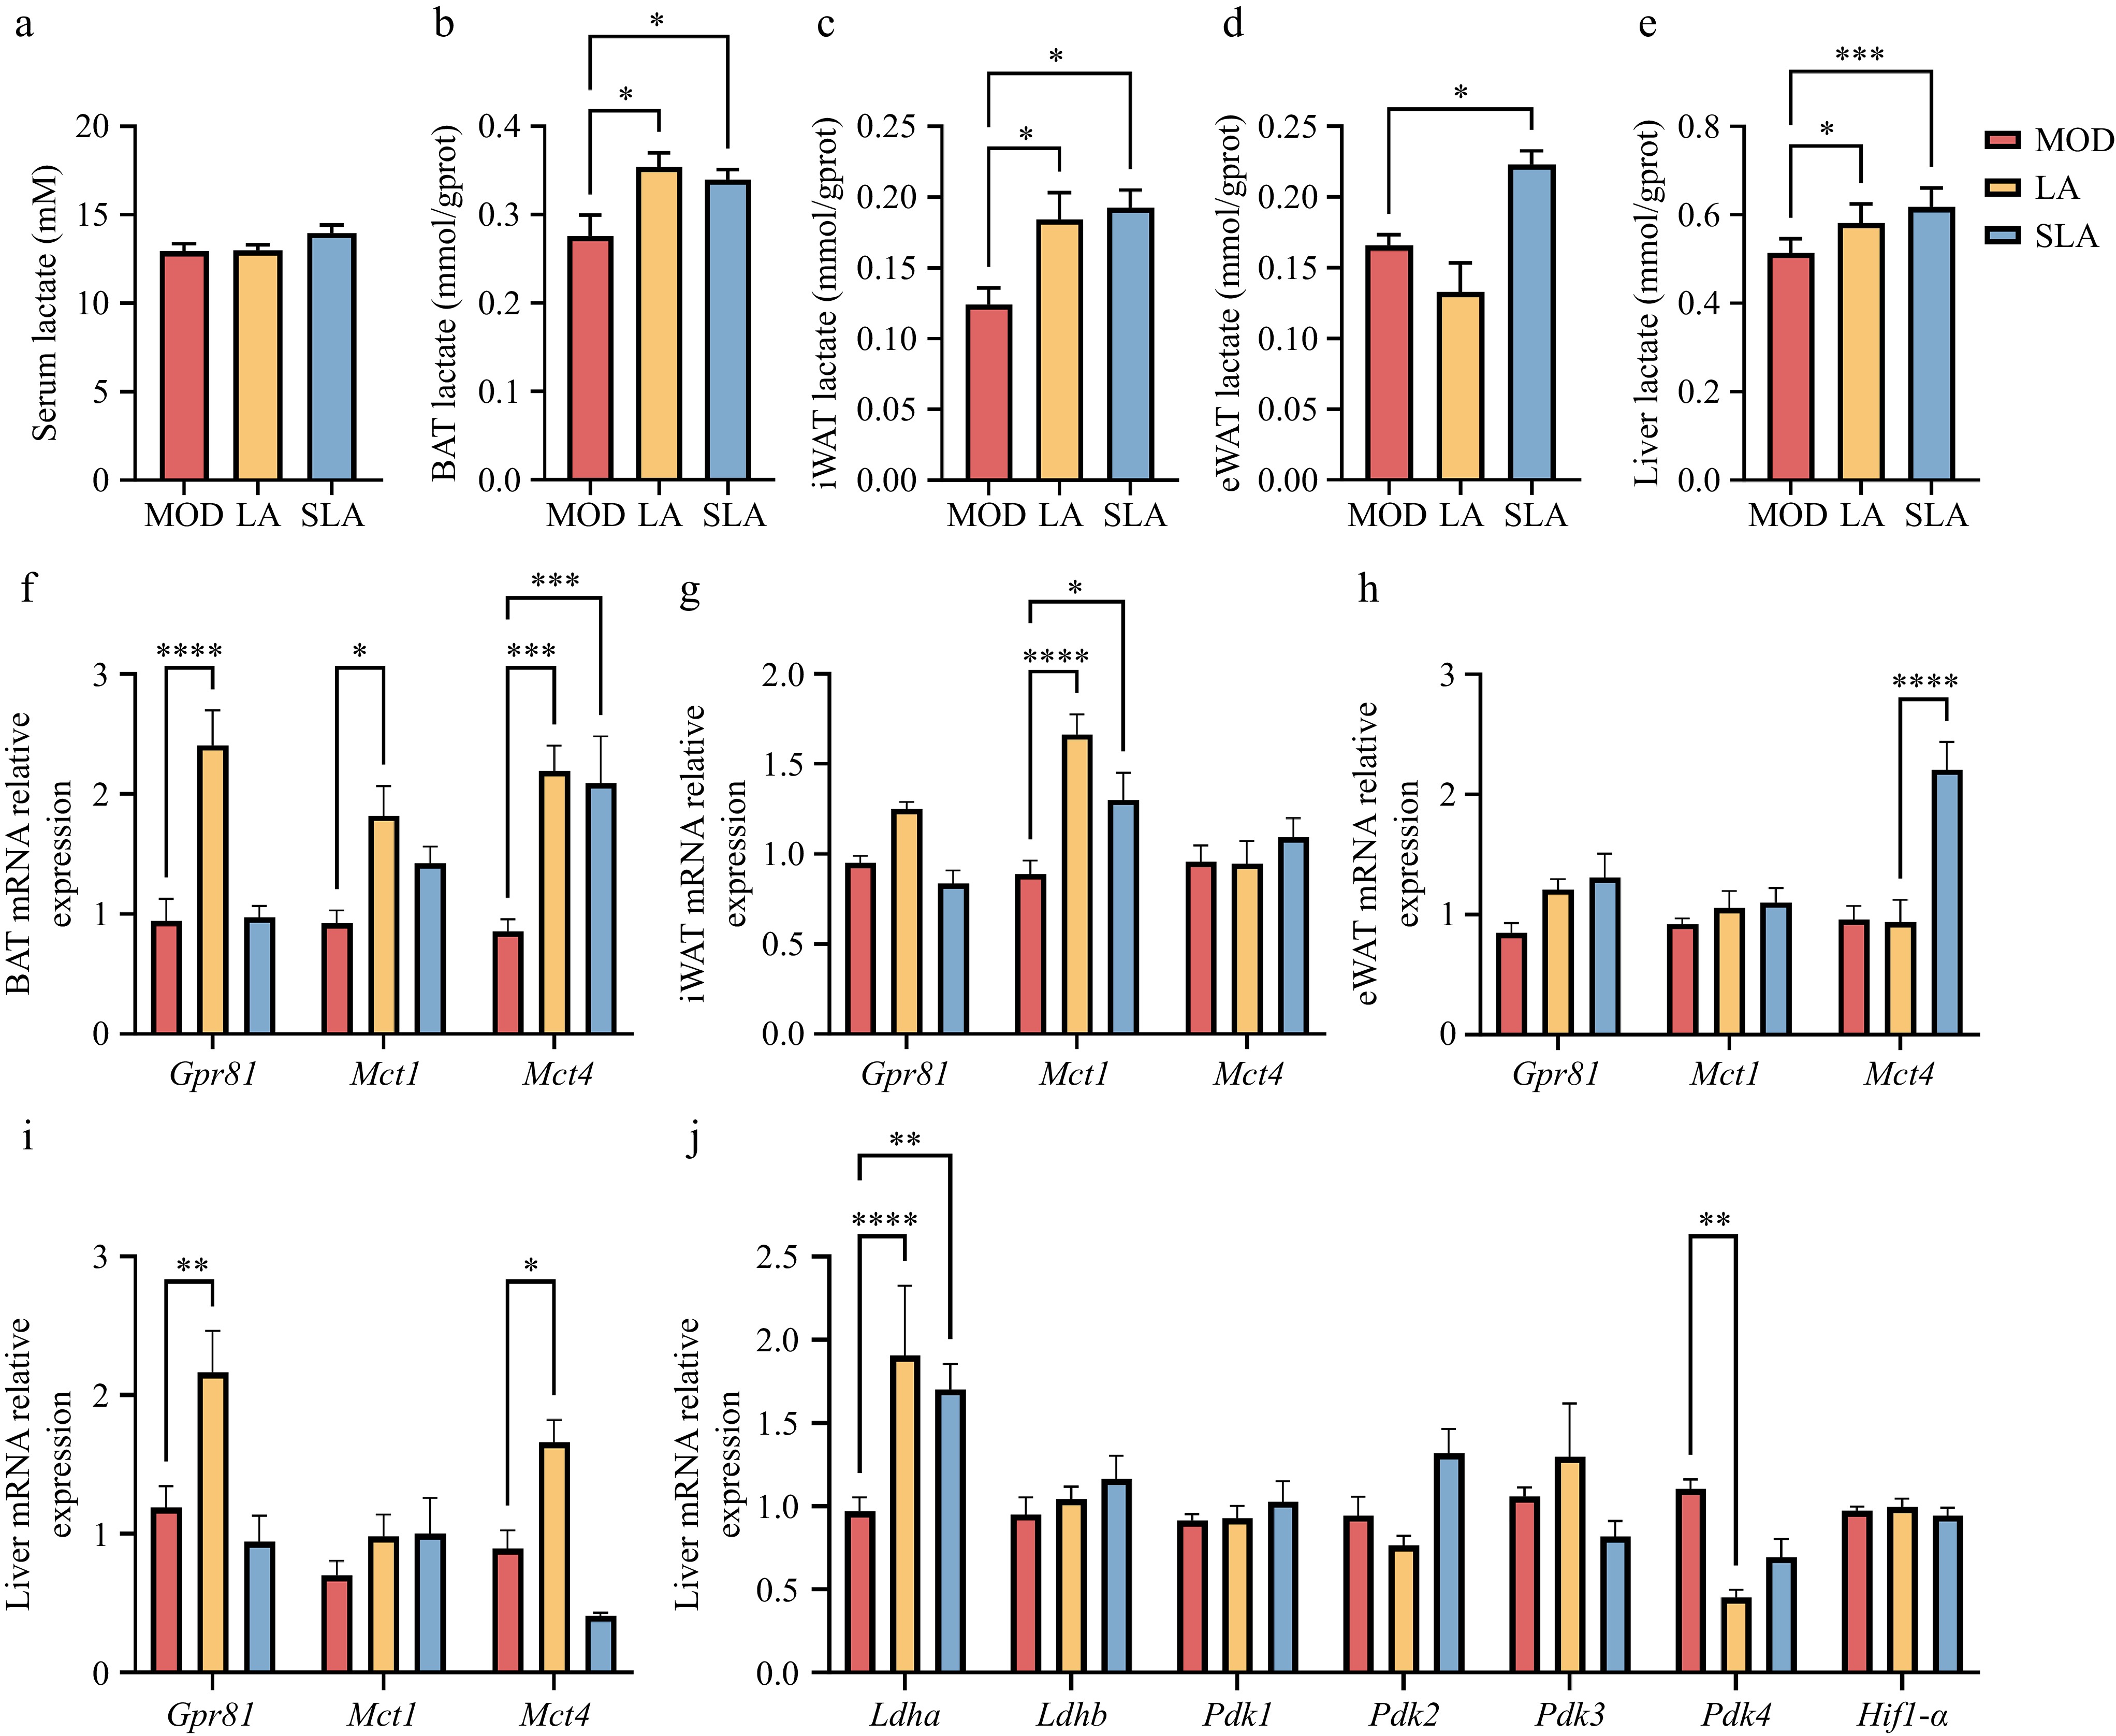
Figure 5.
Lactic acid treatment increases lactate levels in tissues and organs. [(a)–(e), n = 6; (f)–(j), n = 5]. Lactate levels in (a) serum, (b) BAT, (c) iWAT, (d) eWAT, and (e) liver of lactate-treated mice. Expression of lactate-related genes in (f) BAT, (g) iWAT, (h) eWAT, and (i), (j) liver. Data are presented as mean ± SEM. *p < 0.05, ** p < 0.01, *** p < 0.001, and **** p < 0.0001 compared to control. Statistical analysis was performed using one-way ANOVA followed by Tukey's post hoc test.
-
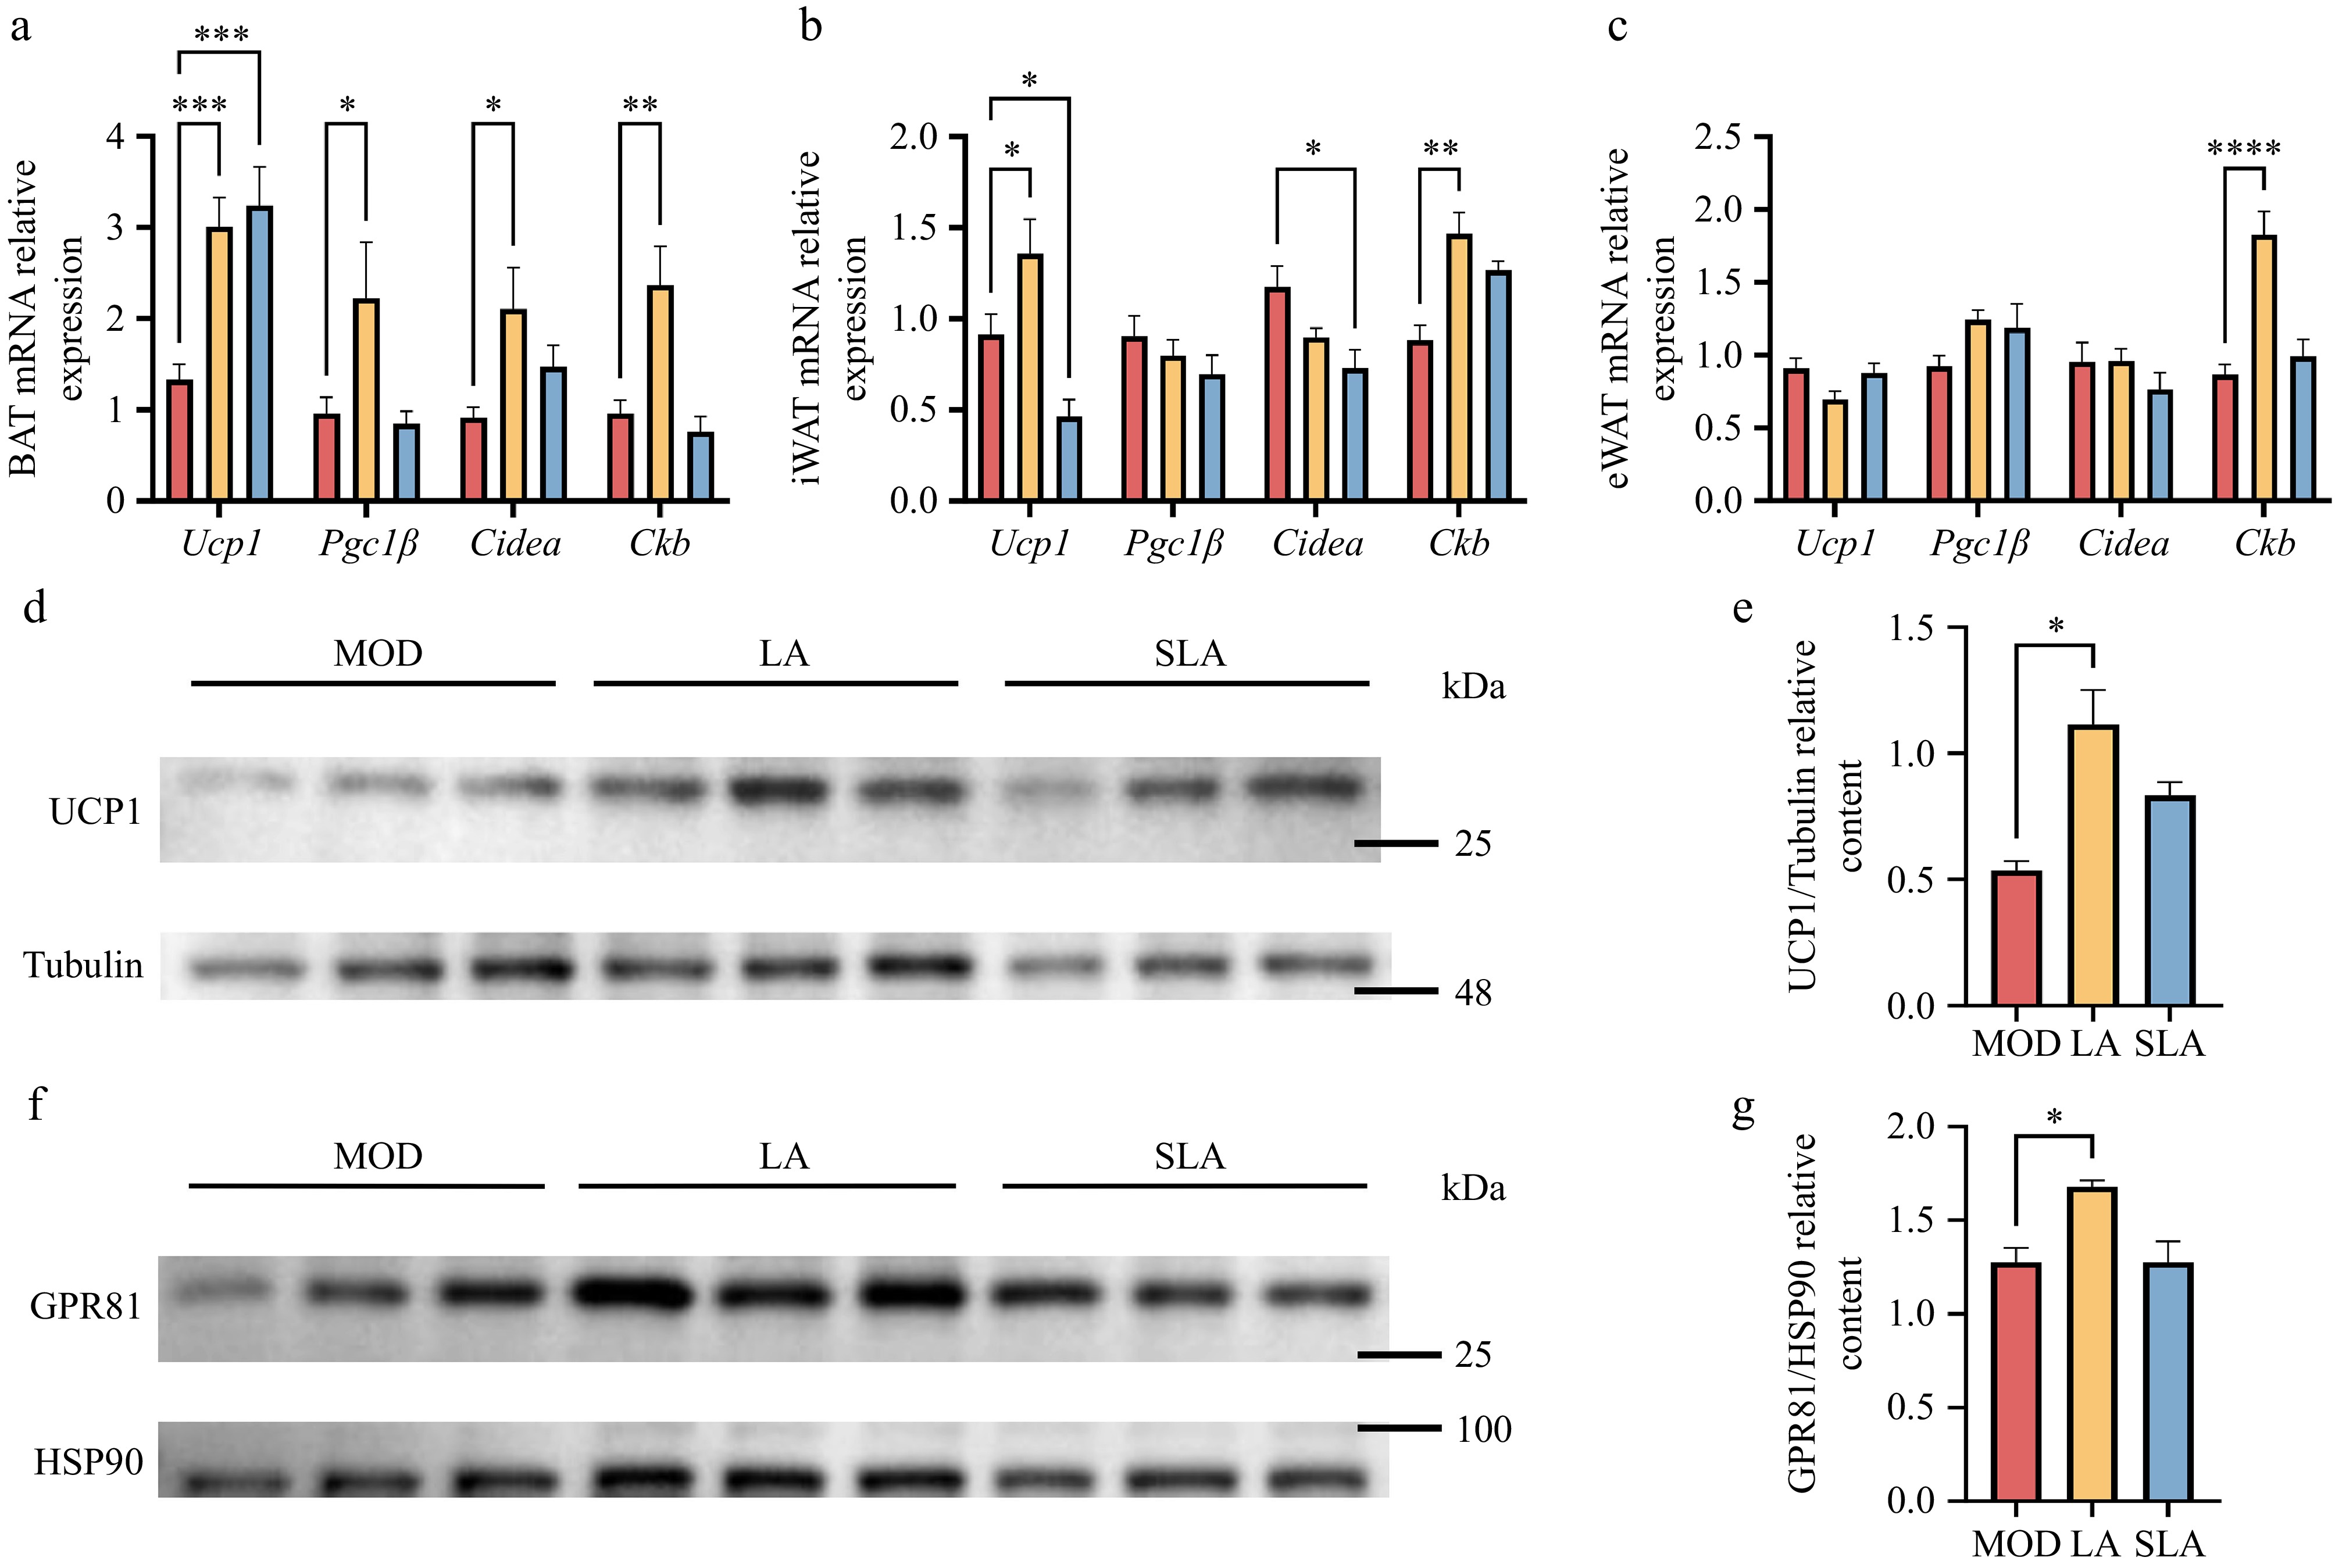
Figure 6.
Lactic acid treatment activates GPR81 to promote thermogenesis [(a)–(c), n = 5; (d)–(g), n = 3]. Expression of thermogenesis-related genes in (a) BAT, (b) iWAT, and (c) eWAT. Protein expression of (d) UCP1, (f) GPR81 in BAT, and quantification of (e) UCP1 and (g) GPR81 protein levels. Data are presented as mean ± SEM. * p < 0.05, ** p < 0.01, *** p < 0.001, and **** p < 0.0001 compared to control. Statistical analysis was performed using one-way ANOVA followed by Tukey's post hoc test.
Figures
(6)
Tables
(0)