-
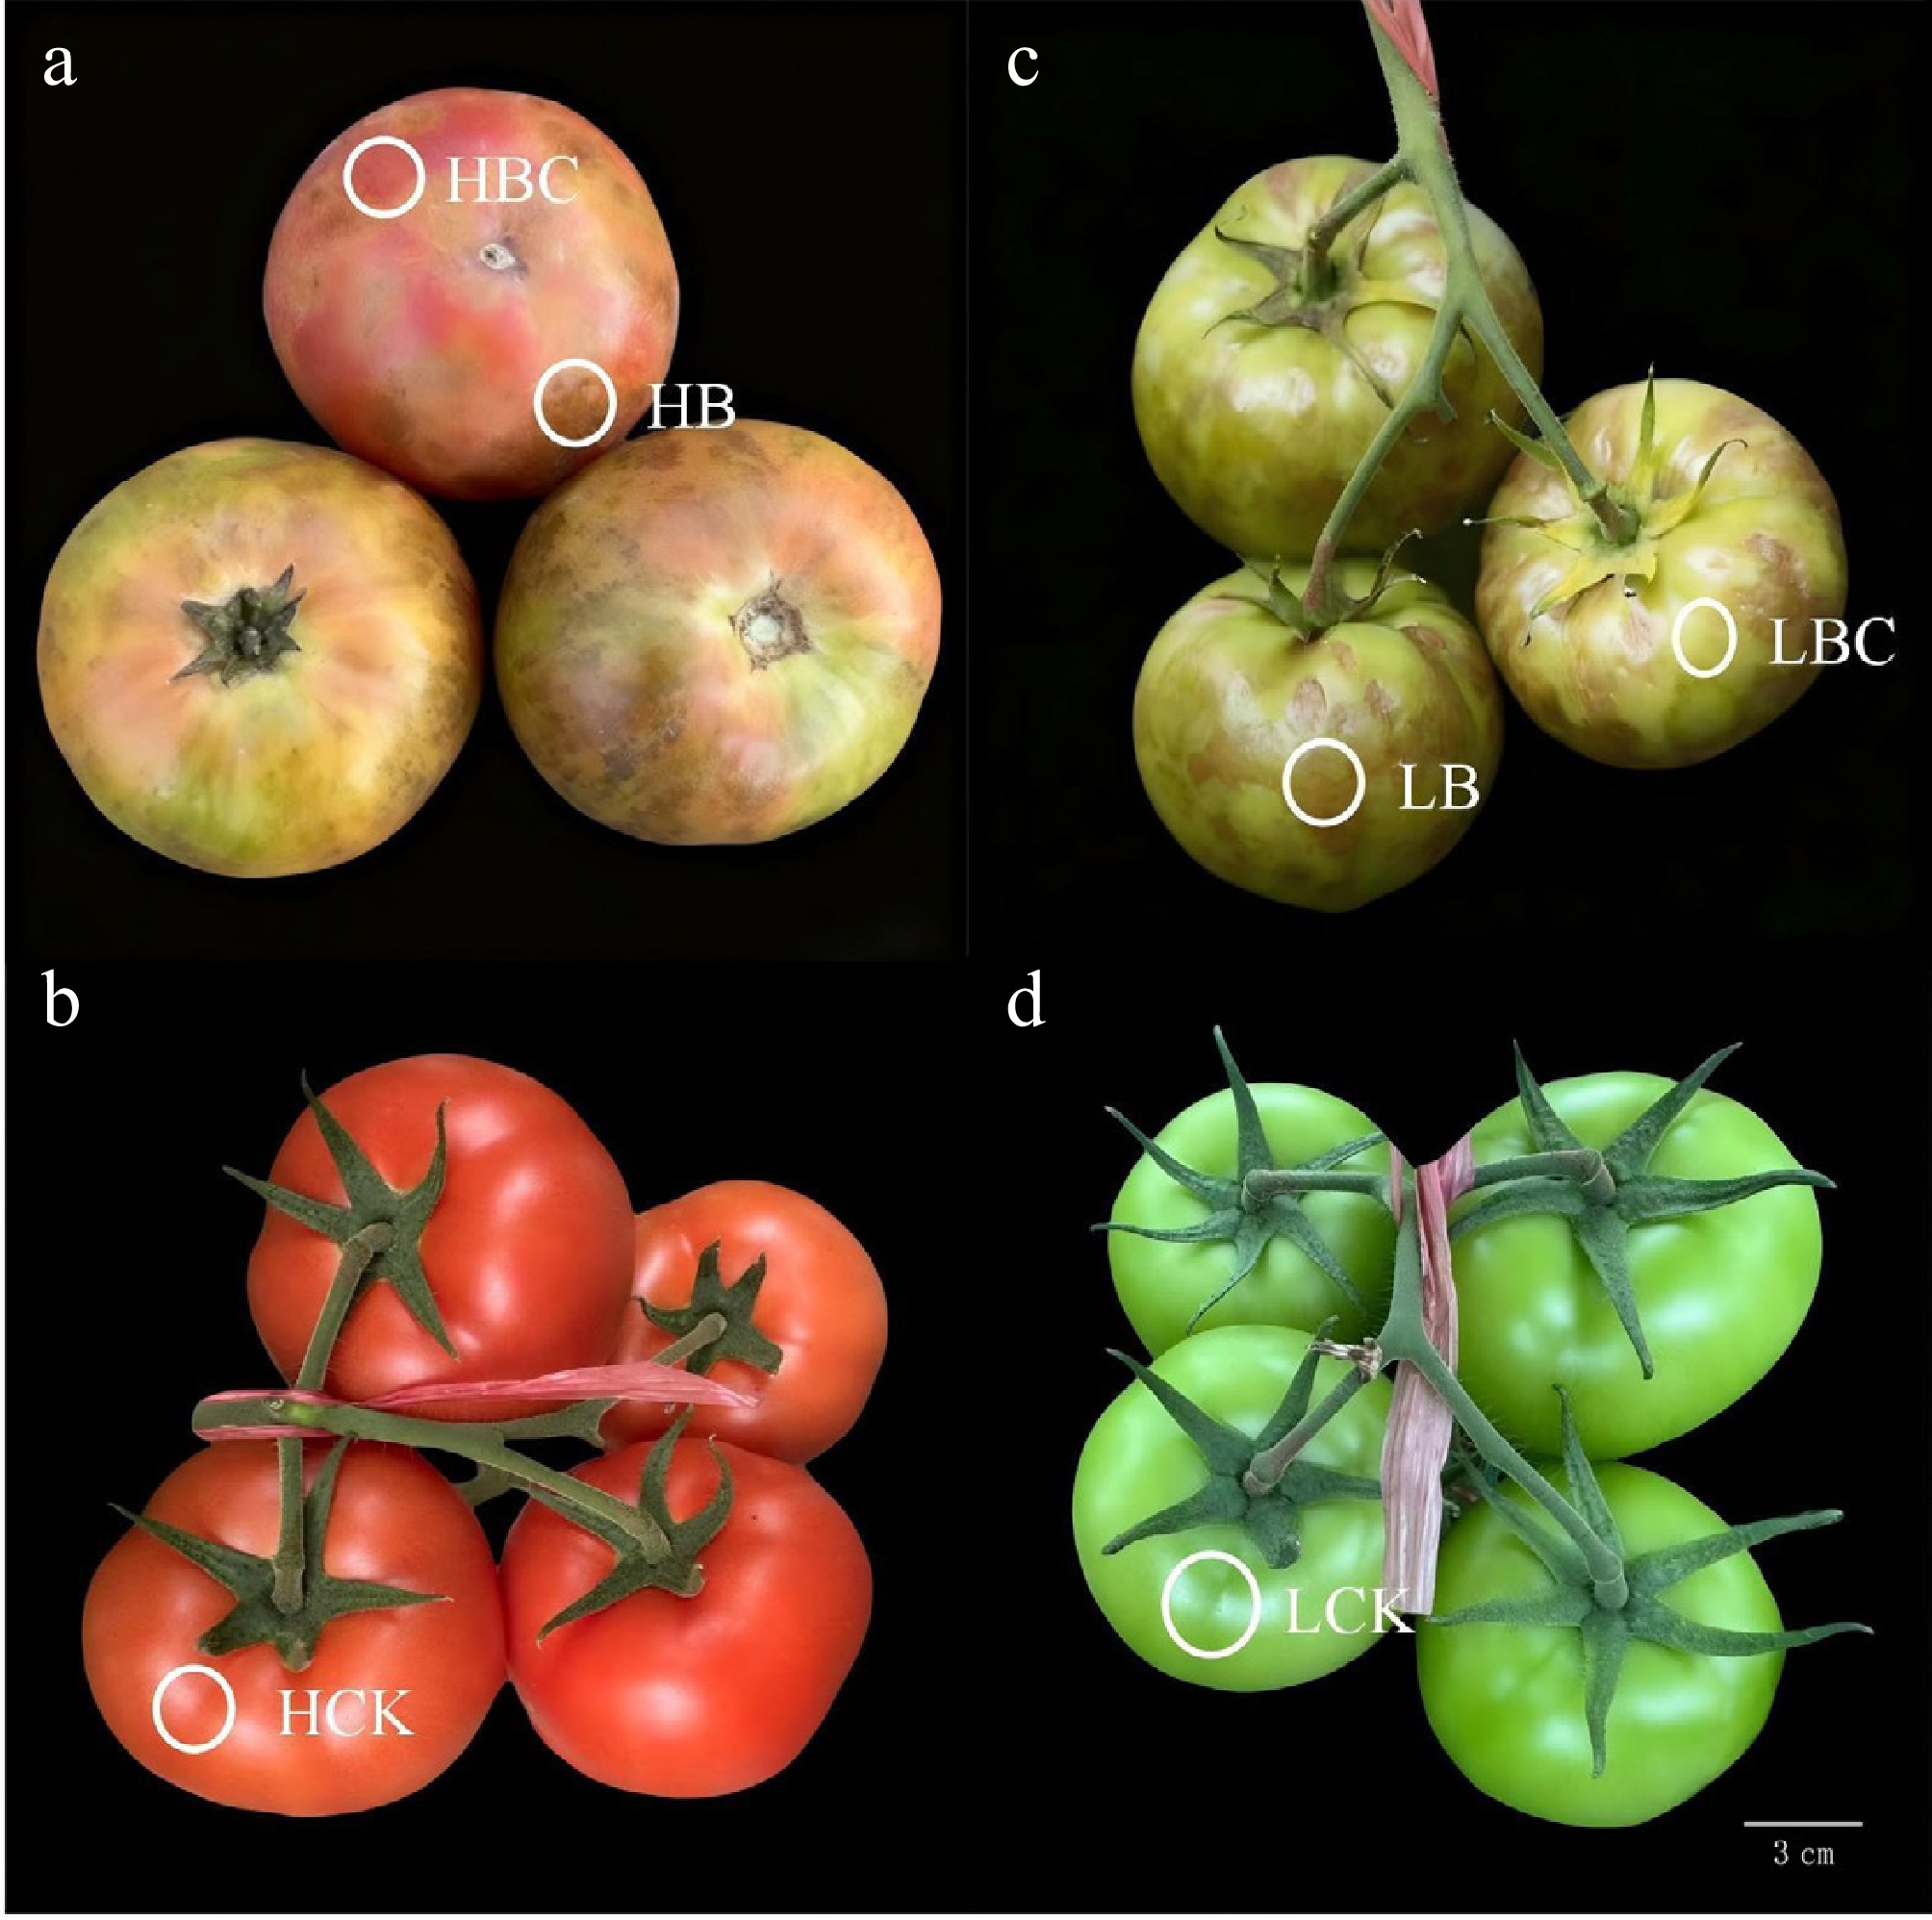
Figure 1.
Schematic diagram of sample collection for transcriptome sequencing. Fruit tissues were selected at two key growth stages: green-ripe (L) and red-ripe (H), and divided into six sample groups: green-ripe diseased brown areas (LB), green-ripe diseased non-brown areas (LBC), green-ripe healthy controls (LCK), red-ripe diseased brown areas (HB), red-ripe diseased non-brown areas (HBC), and red-ripe healthy controls (HCK).
-
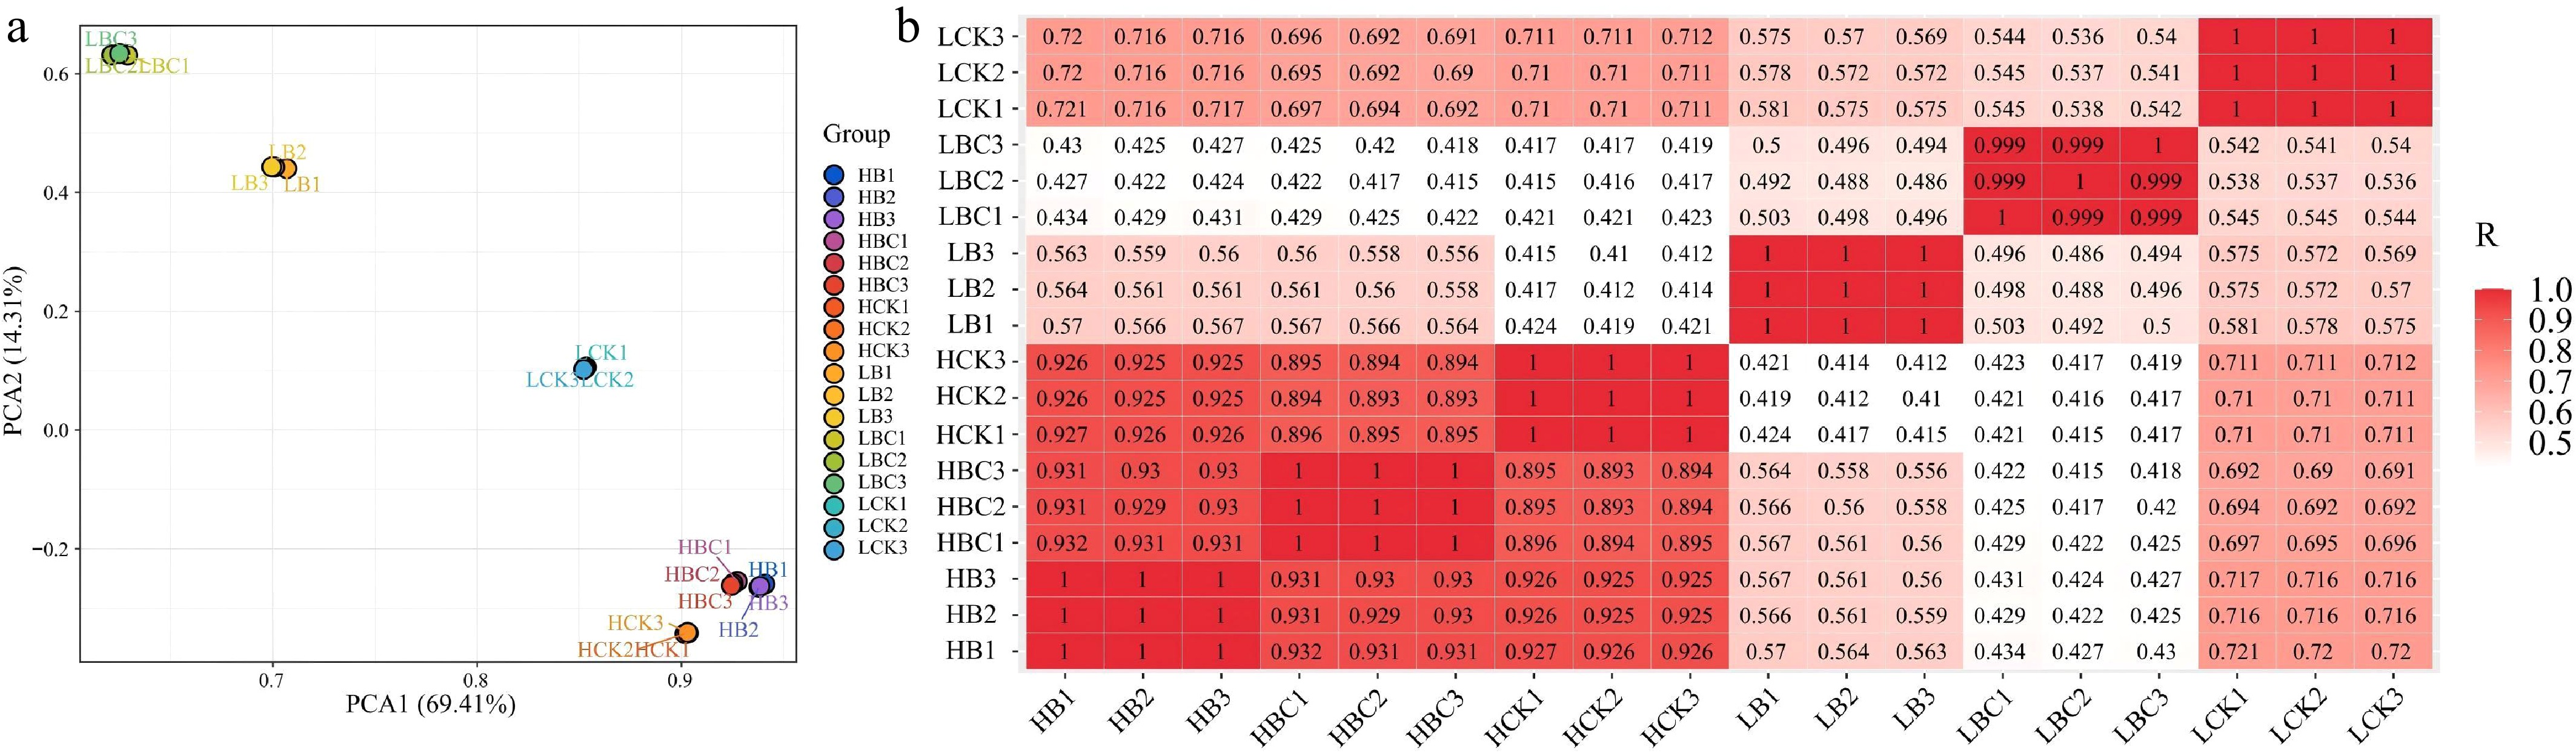
Figure 2.
Correlations among sample replicates from different tissues. (a) Two-dimensional principal component analysis (PCA) plot. (b) Heatmap illustrating Pearson correlation coefficients.
-
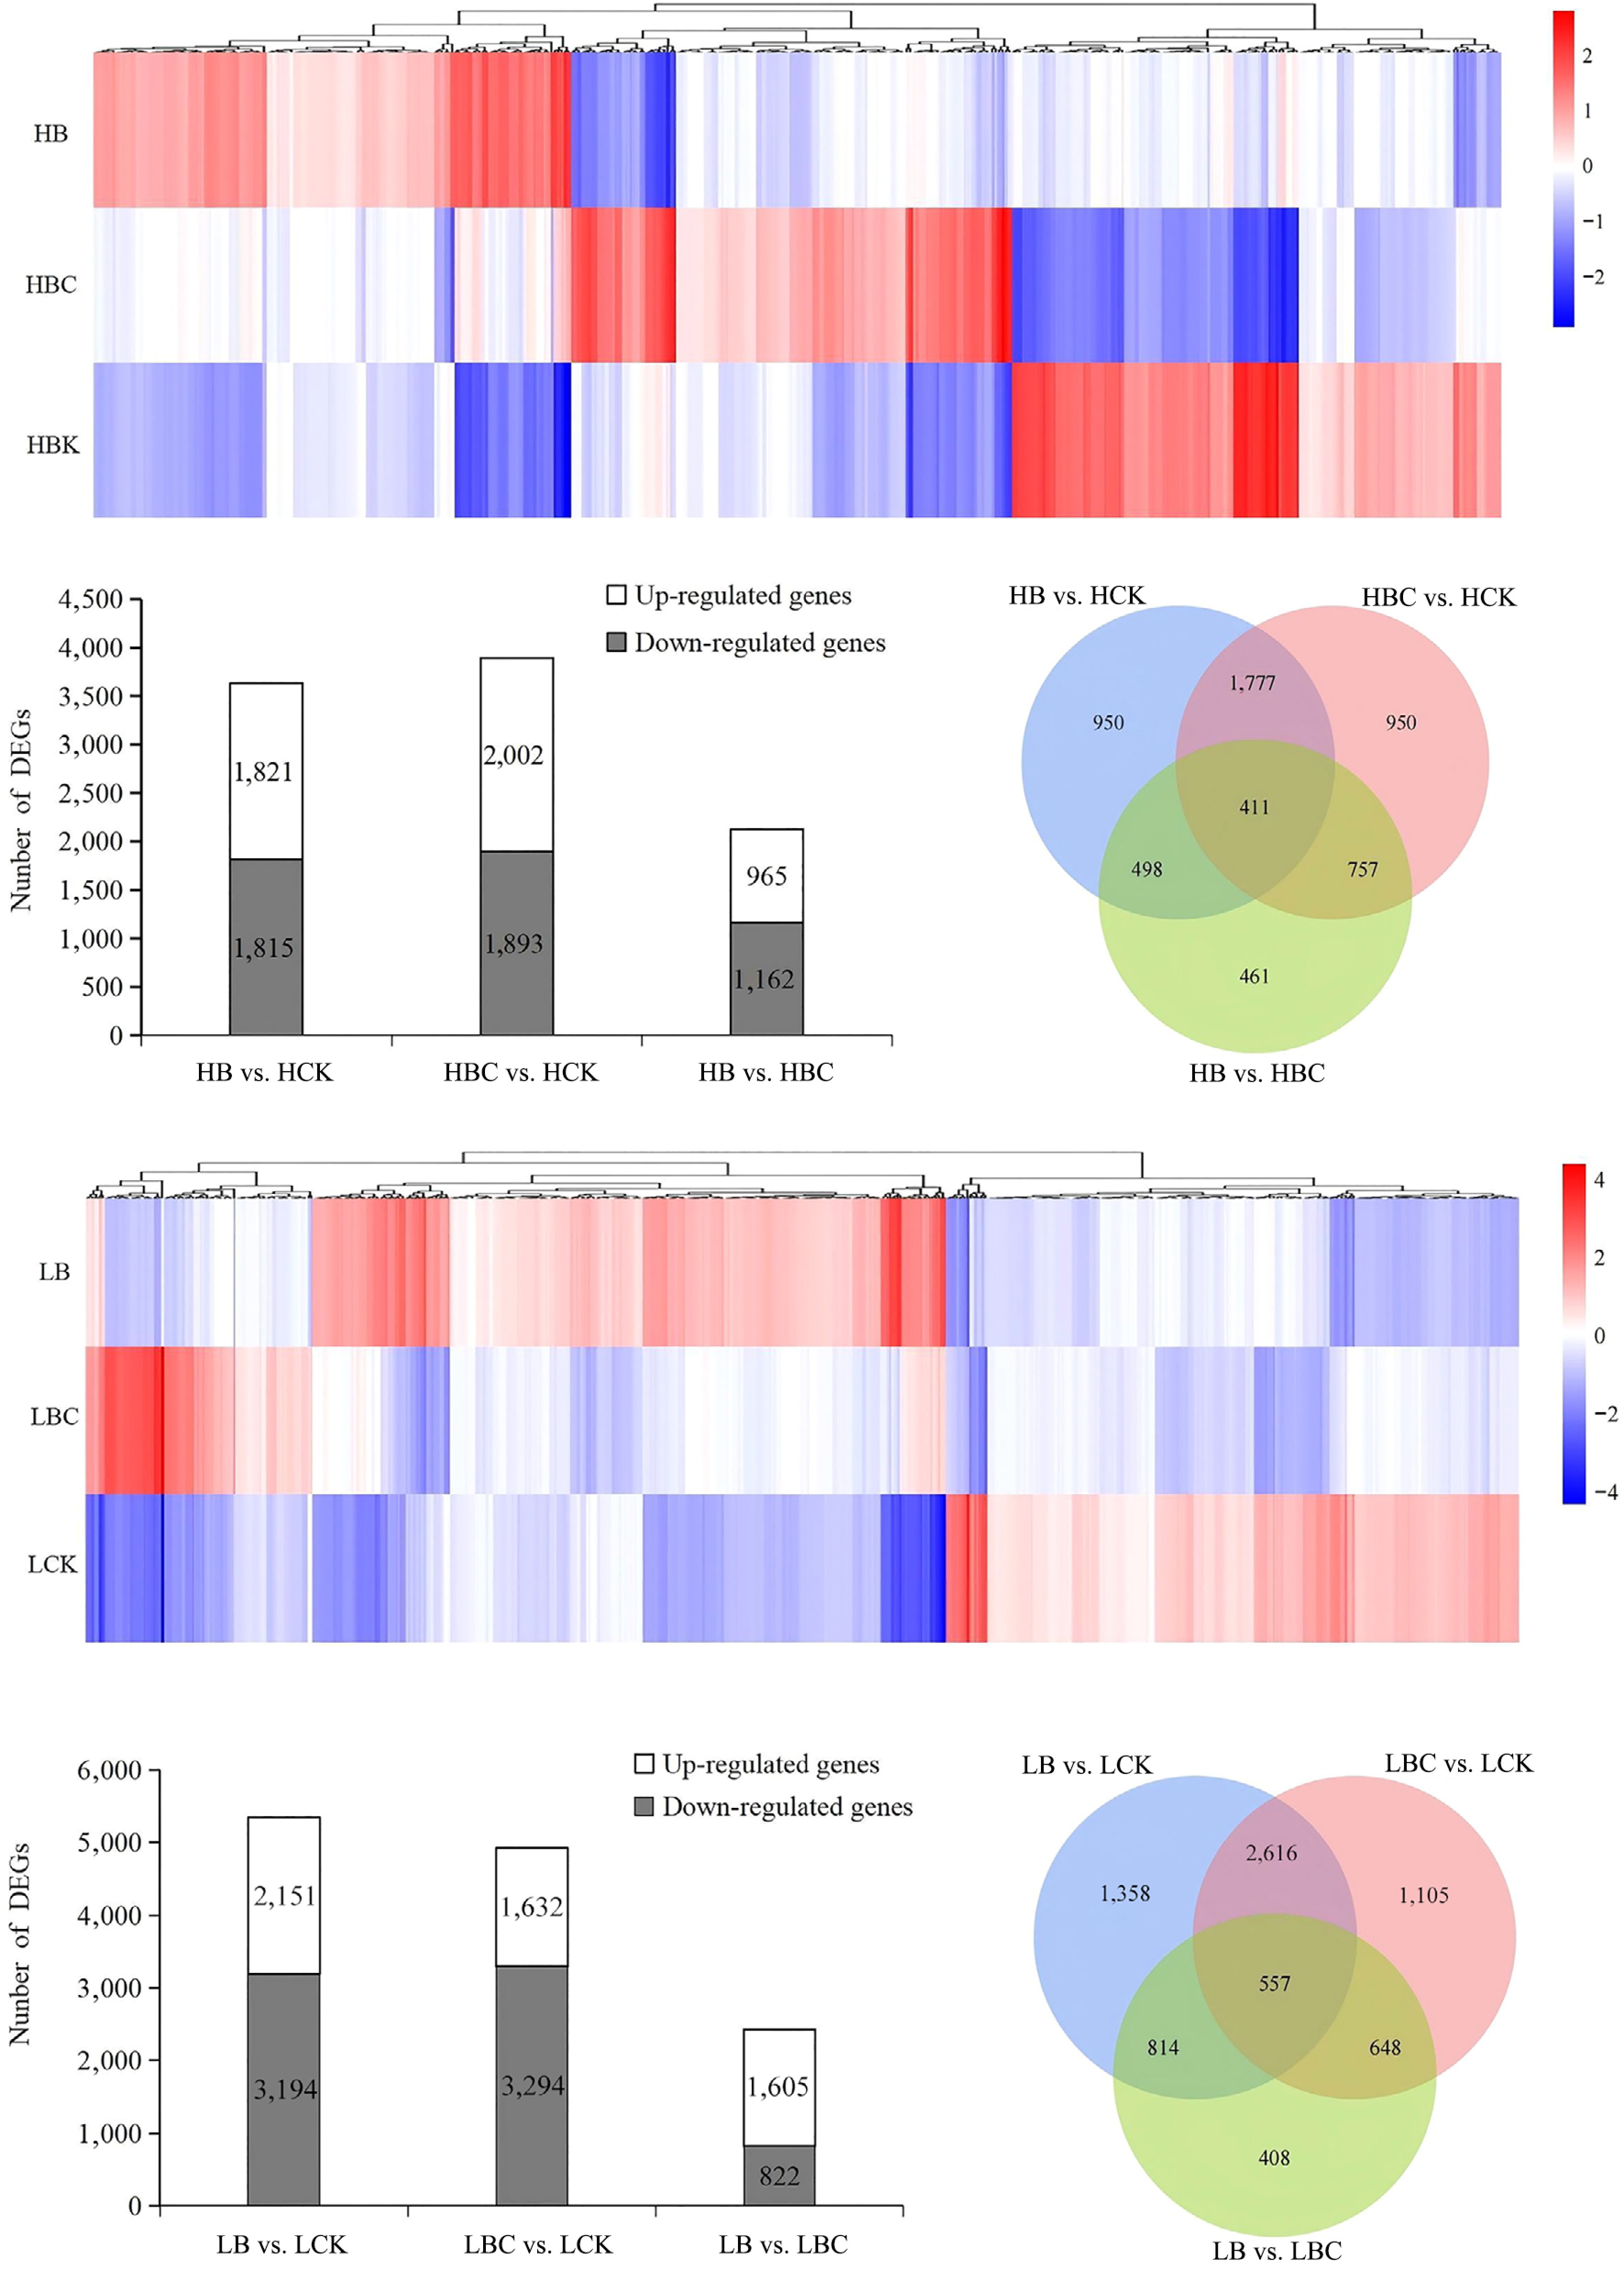
Figure 3.
Transcriptional response statistics of tomato tissues. (a) Differentially expressed gene heatmap on red-ripe (H). (b) Differentially expressed gene number on red-ripe (H). (c) Venn analysis of differentially expressed genes among the different tissues on red-ripe (H). (d) Differentially expressed gene heatmap on green-ripe (L). (e) Differentially expressed gene number on green-ripe (L). (f) Venn analysis of differentially expressed genes among the different tissues on green-ripe (L).
-
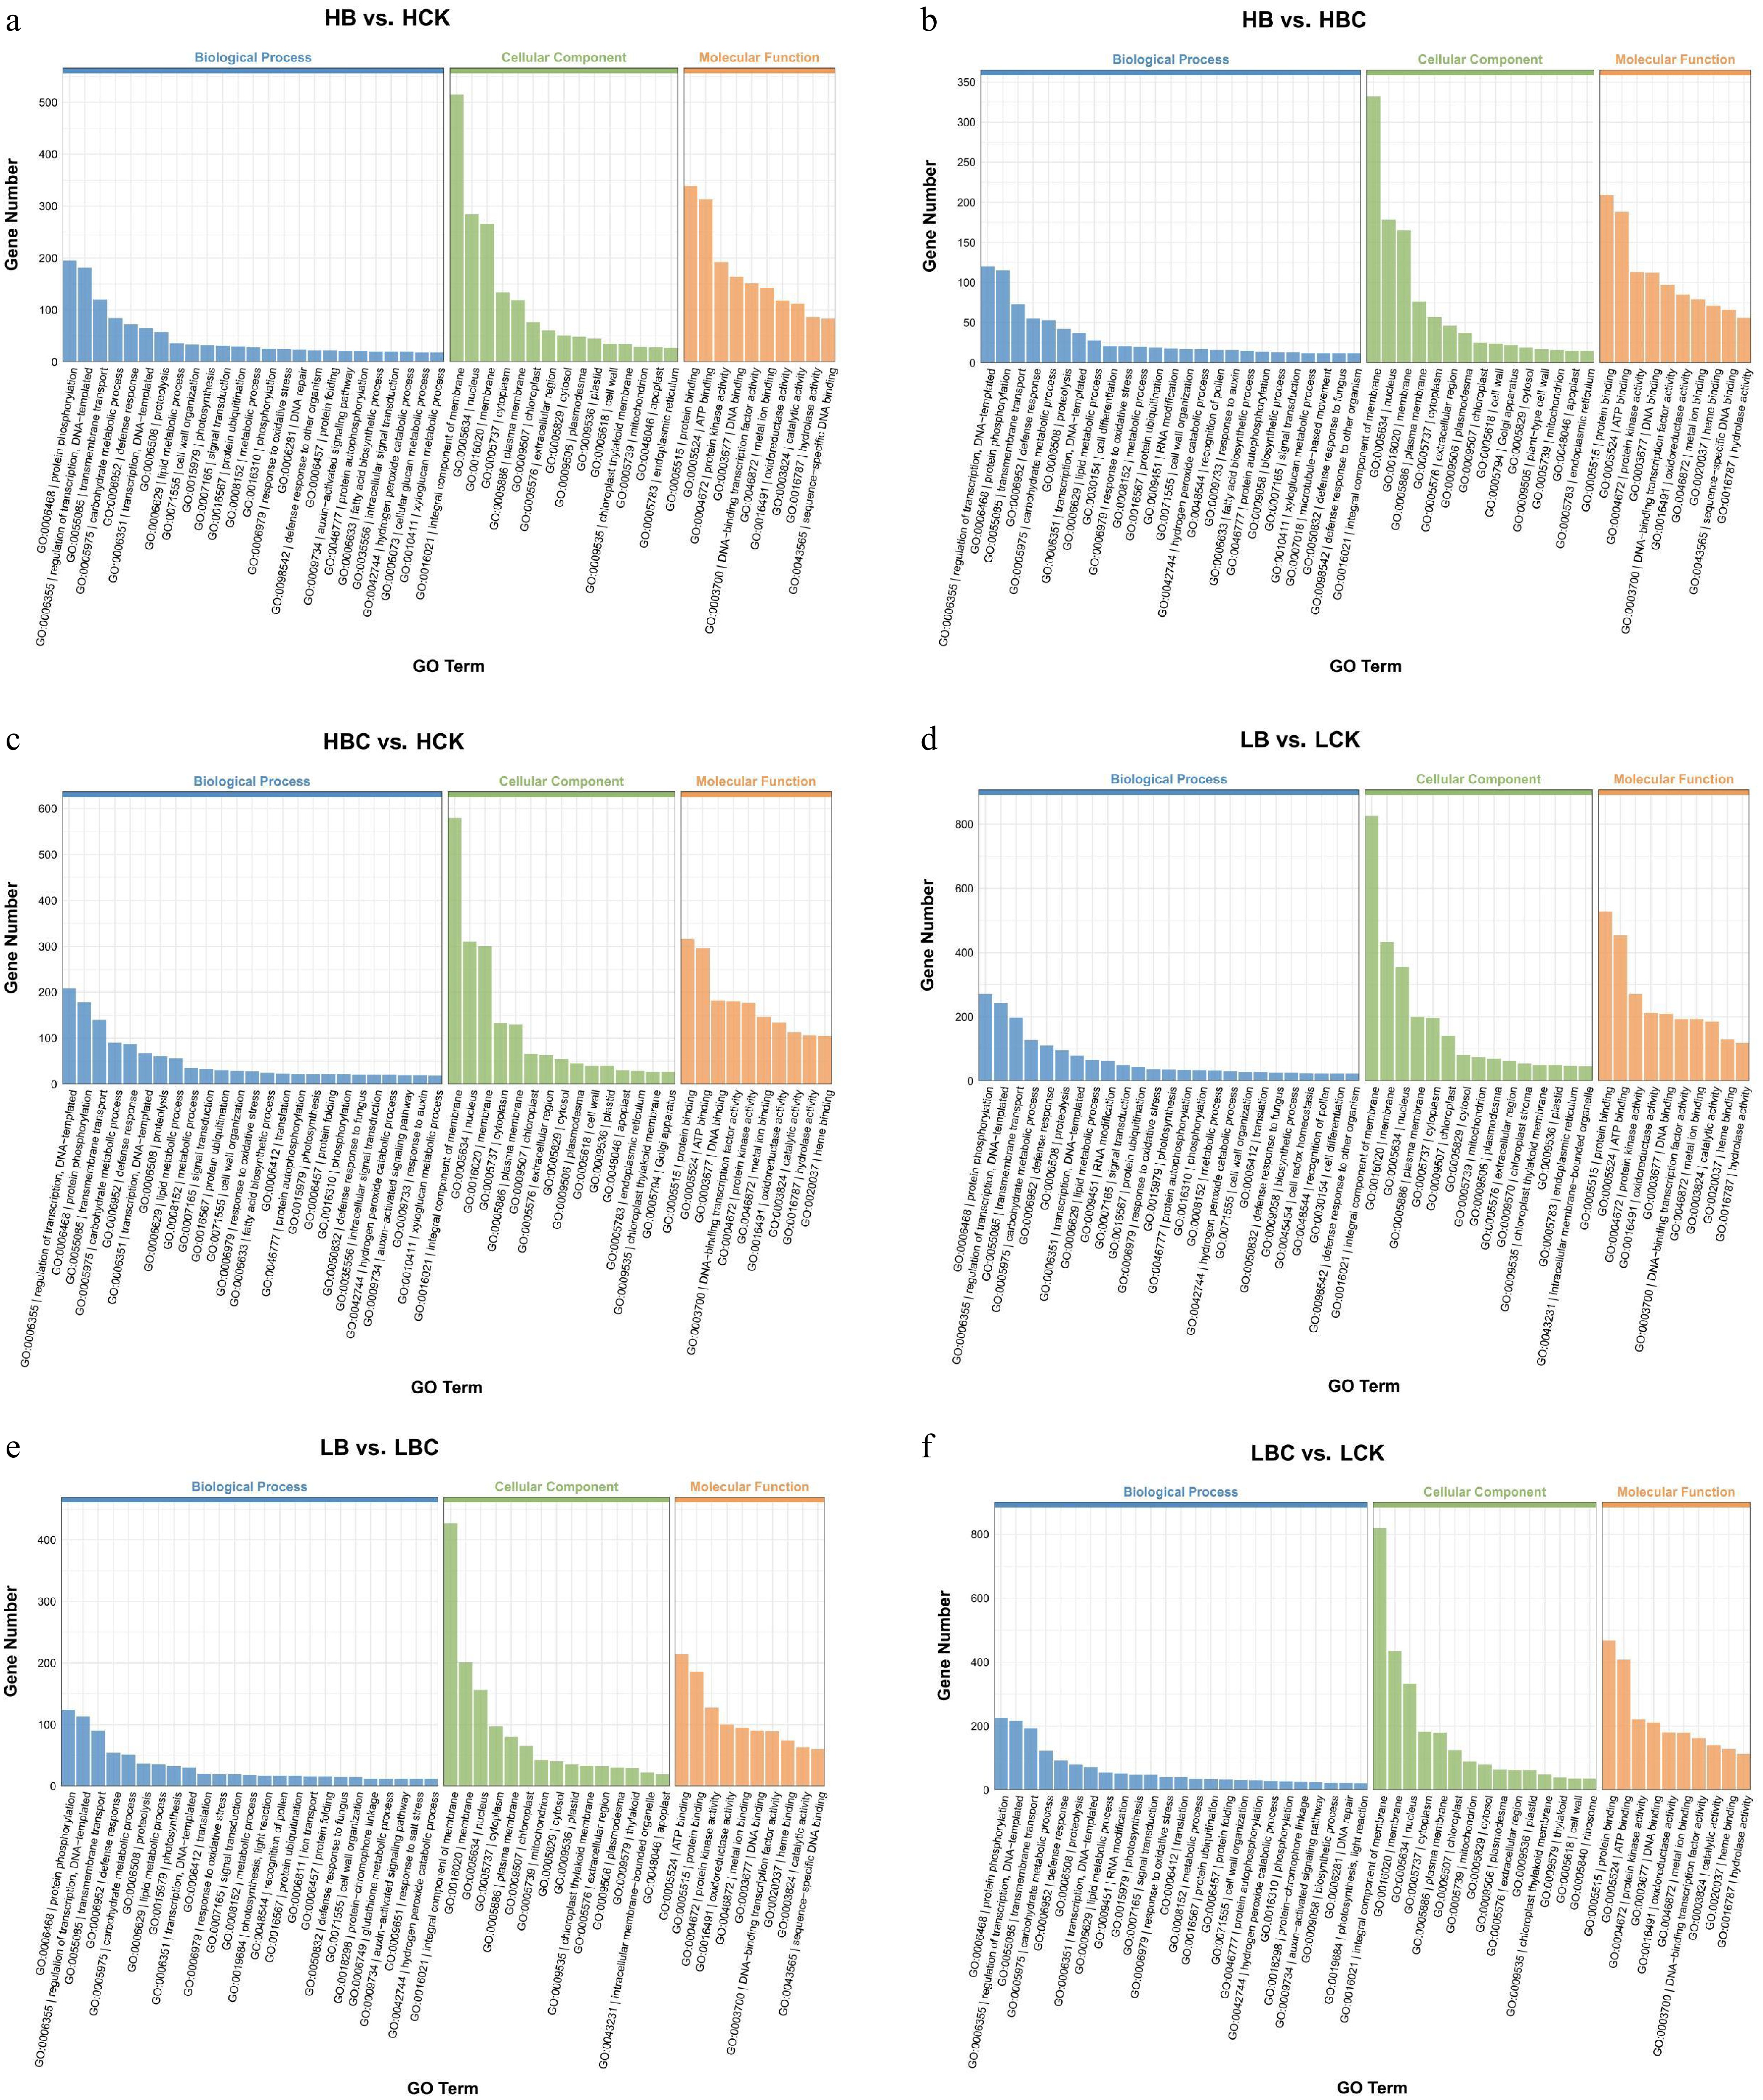
Figure 4.
GO annotation of DEGs between sample replicates within each tissue of tomato fruit. (a) HB vs. HCK, (b) HB vs. HBC, (c) HBC vs. HCK, (d) LB vs. LCK, (e) LB vs. LBC, (f) LBC vs. LCK.
-
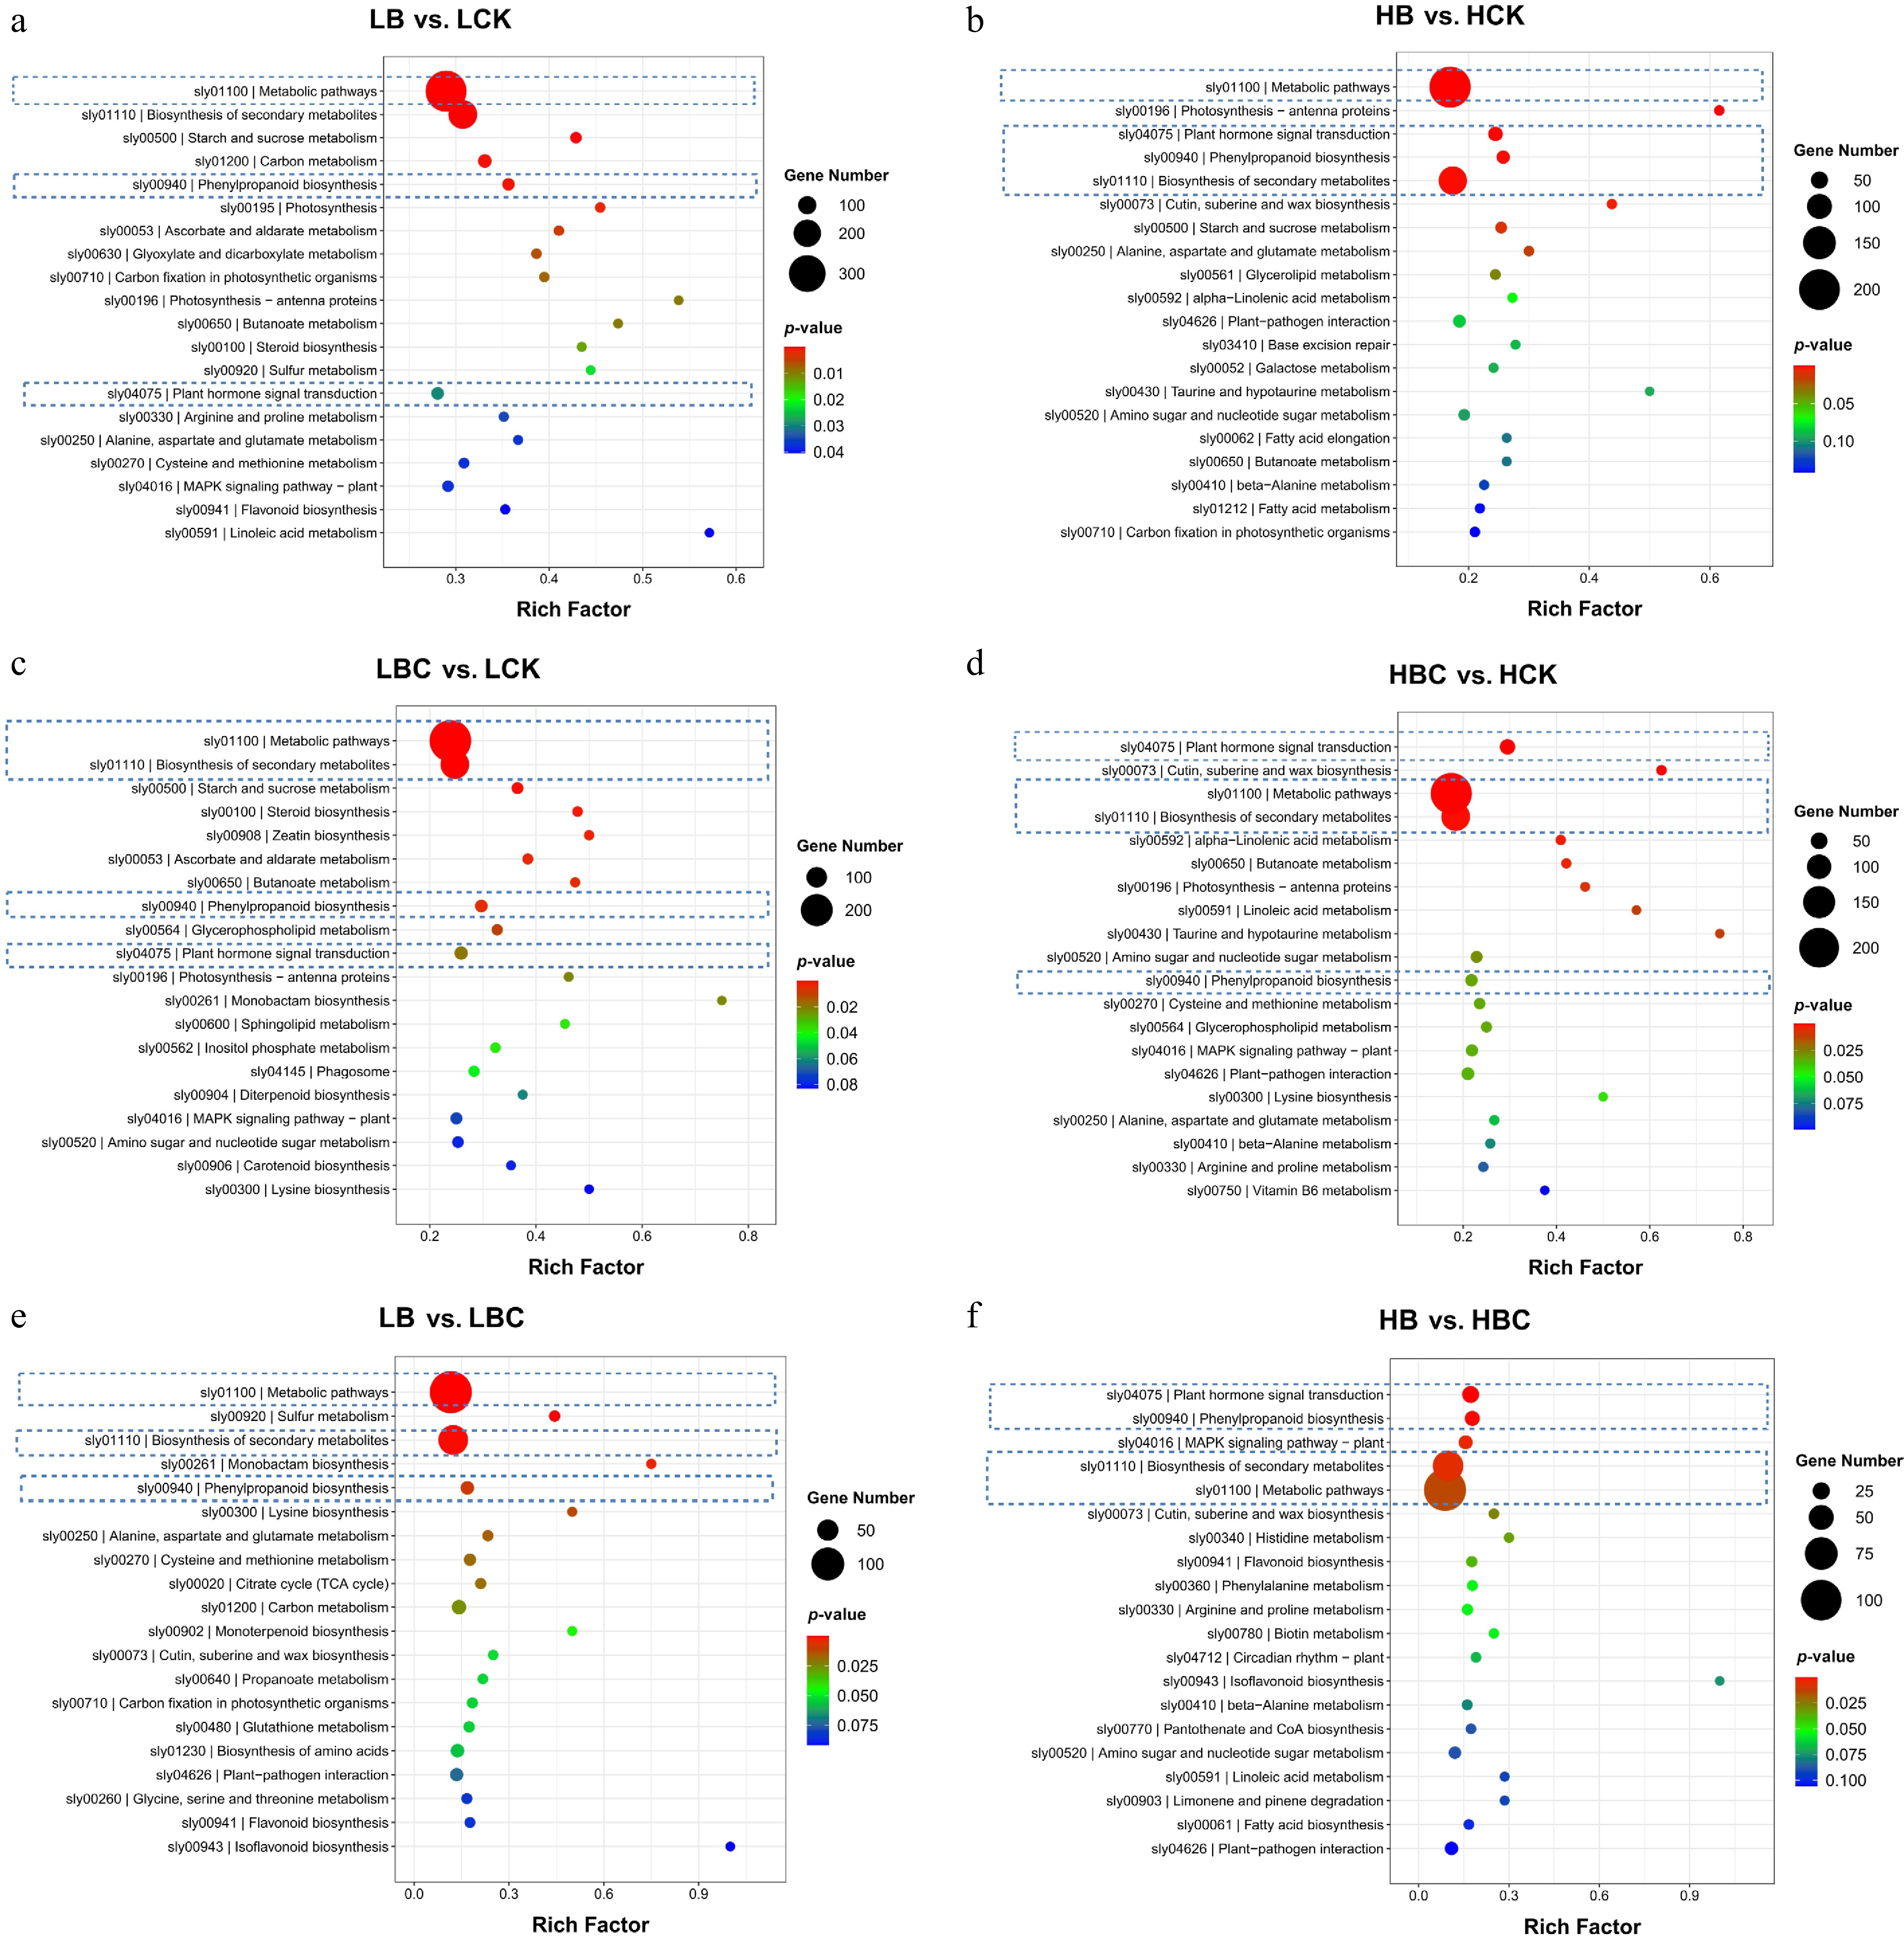
Figure 5.
KEGG enrichment analysis of DEGs between sample replicates within each tissue of tomato fruit. (a) LB vs. LCK, (b) HB vs. HCK, (c) LBC vs. LCK, (d) HBC vs. HCK, (e) LB vs. LBC, (f) HB vs. HBC.
-
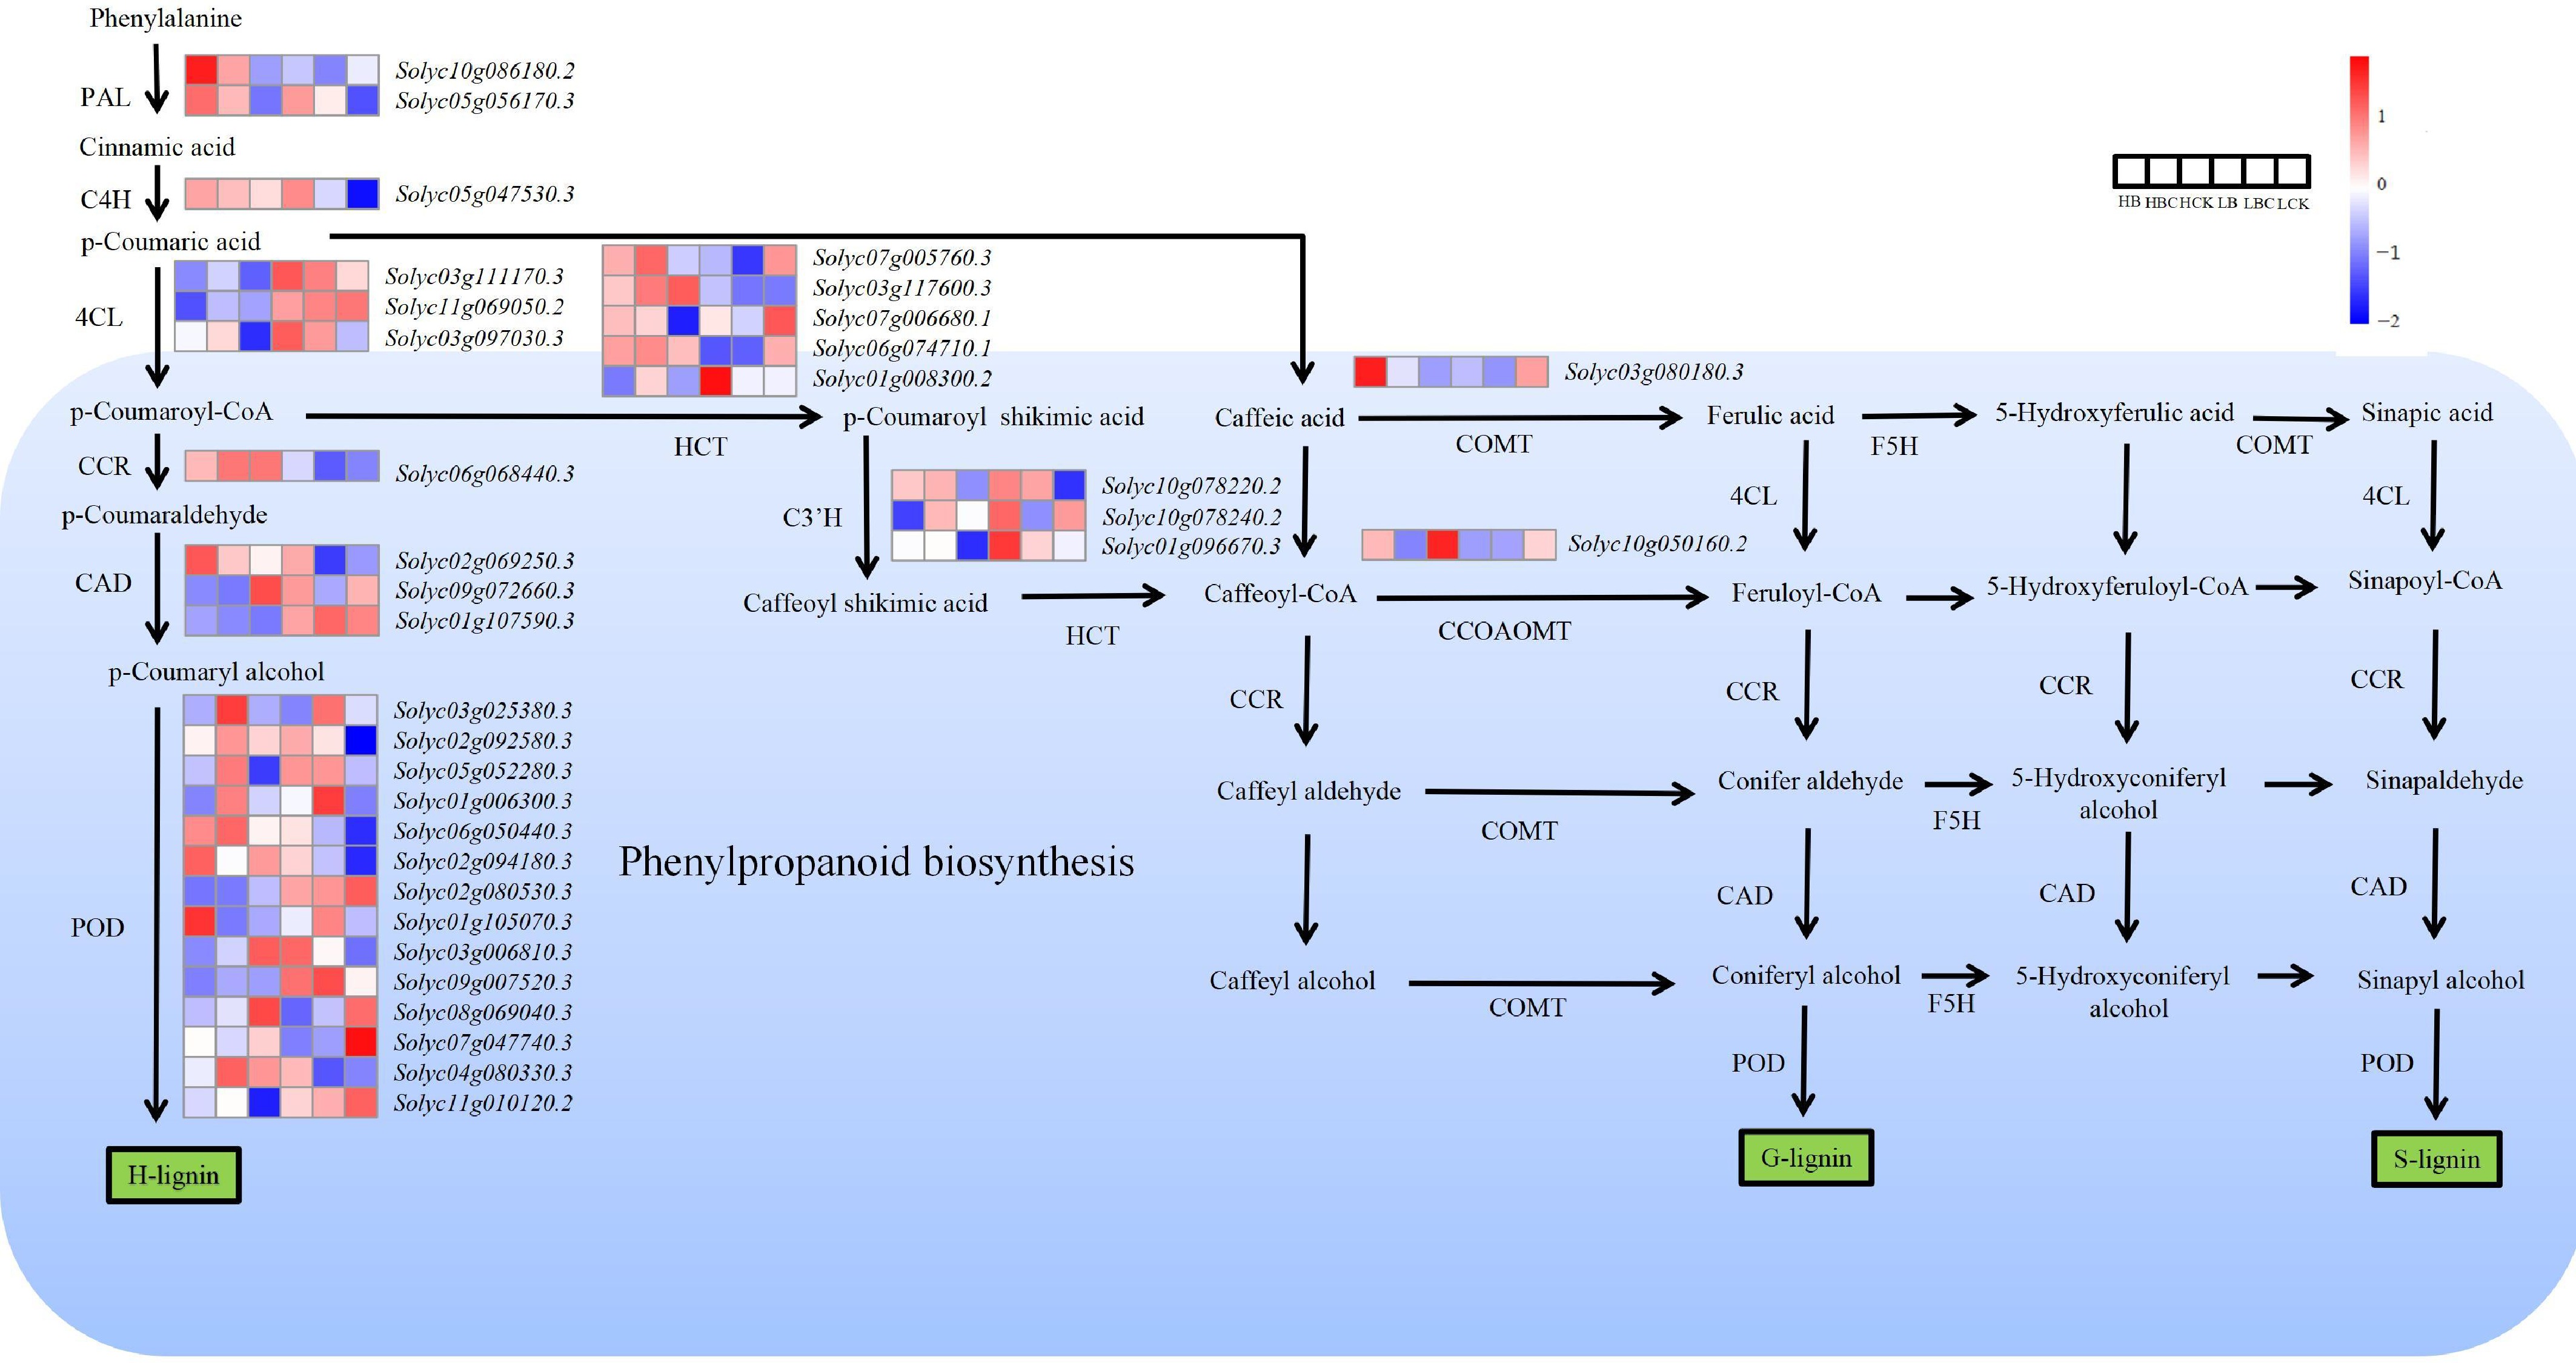
Figure 6.
Schematic illustration depicting the pathway analysis of DEGs associated with phenylalanine metabolism between sample replicates within each tissue of tomato fruit. The heatmap shows log2(FC), with red indicating higher expression and blue indicating lower expression, as indicated in the scale bar on the right. PAL, phenylalanine ammonialyase; C4H, cinnamate 4-hydroxylase; 4CL, 4-coumaroyl CoA ligase; CCR, cinnamoyl-CoA reductase; HCT, shikimate O-hydroxycinnamoyltransferase; CAD, cinnamyl-alcohol dehydrogenase; CCoAOMT, caffeoyl-CoAO-methyltransferase; C3H, 5-O-(4-coumaroyl)-d-quinate3-monooxygenase; POD, peroxidase; COMT, caffeicacid3-O-methyltransferase.
-
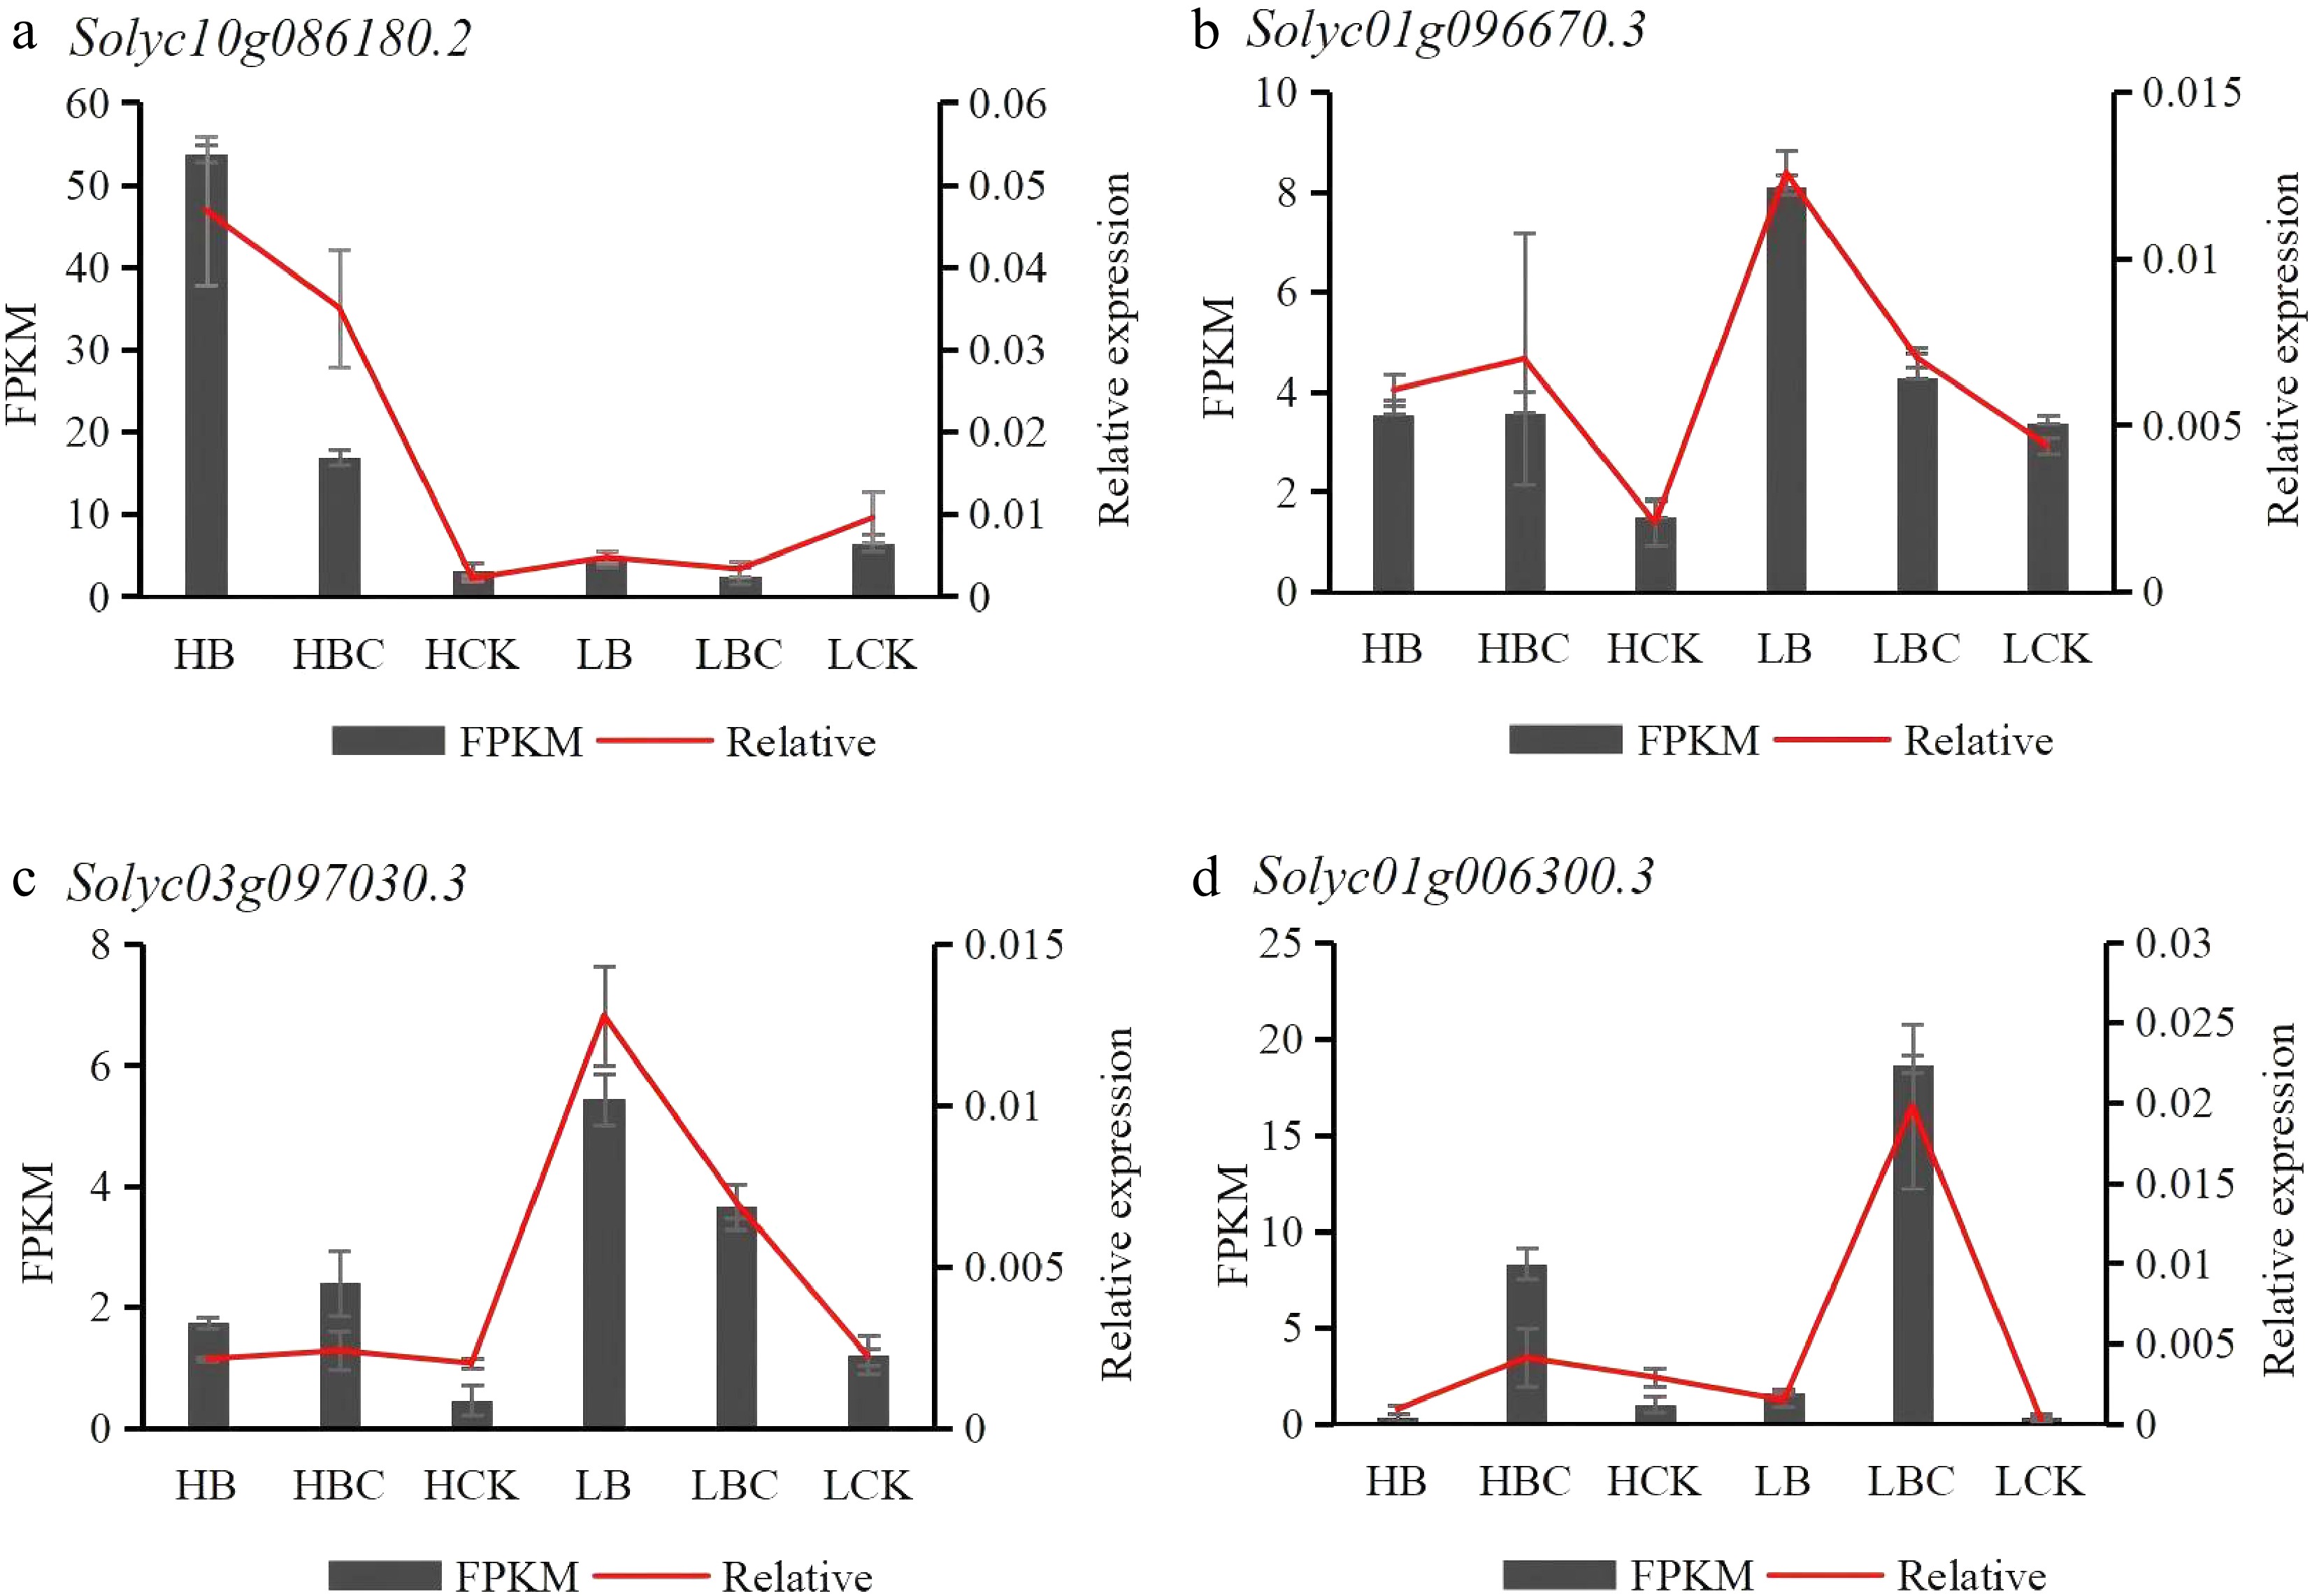
Figure 7.
RNA-seq results illustrating gene expression levels based on FPKM values and qRT-PCR measurements for the four selected DEGs. The red line chart displays the variations in qRT-PCR results across the groups, while the black bar chart depicts differences in RNA-seq data represented by FPKM values.
-
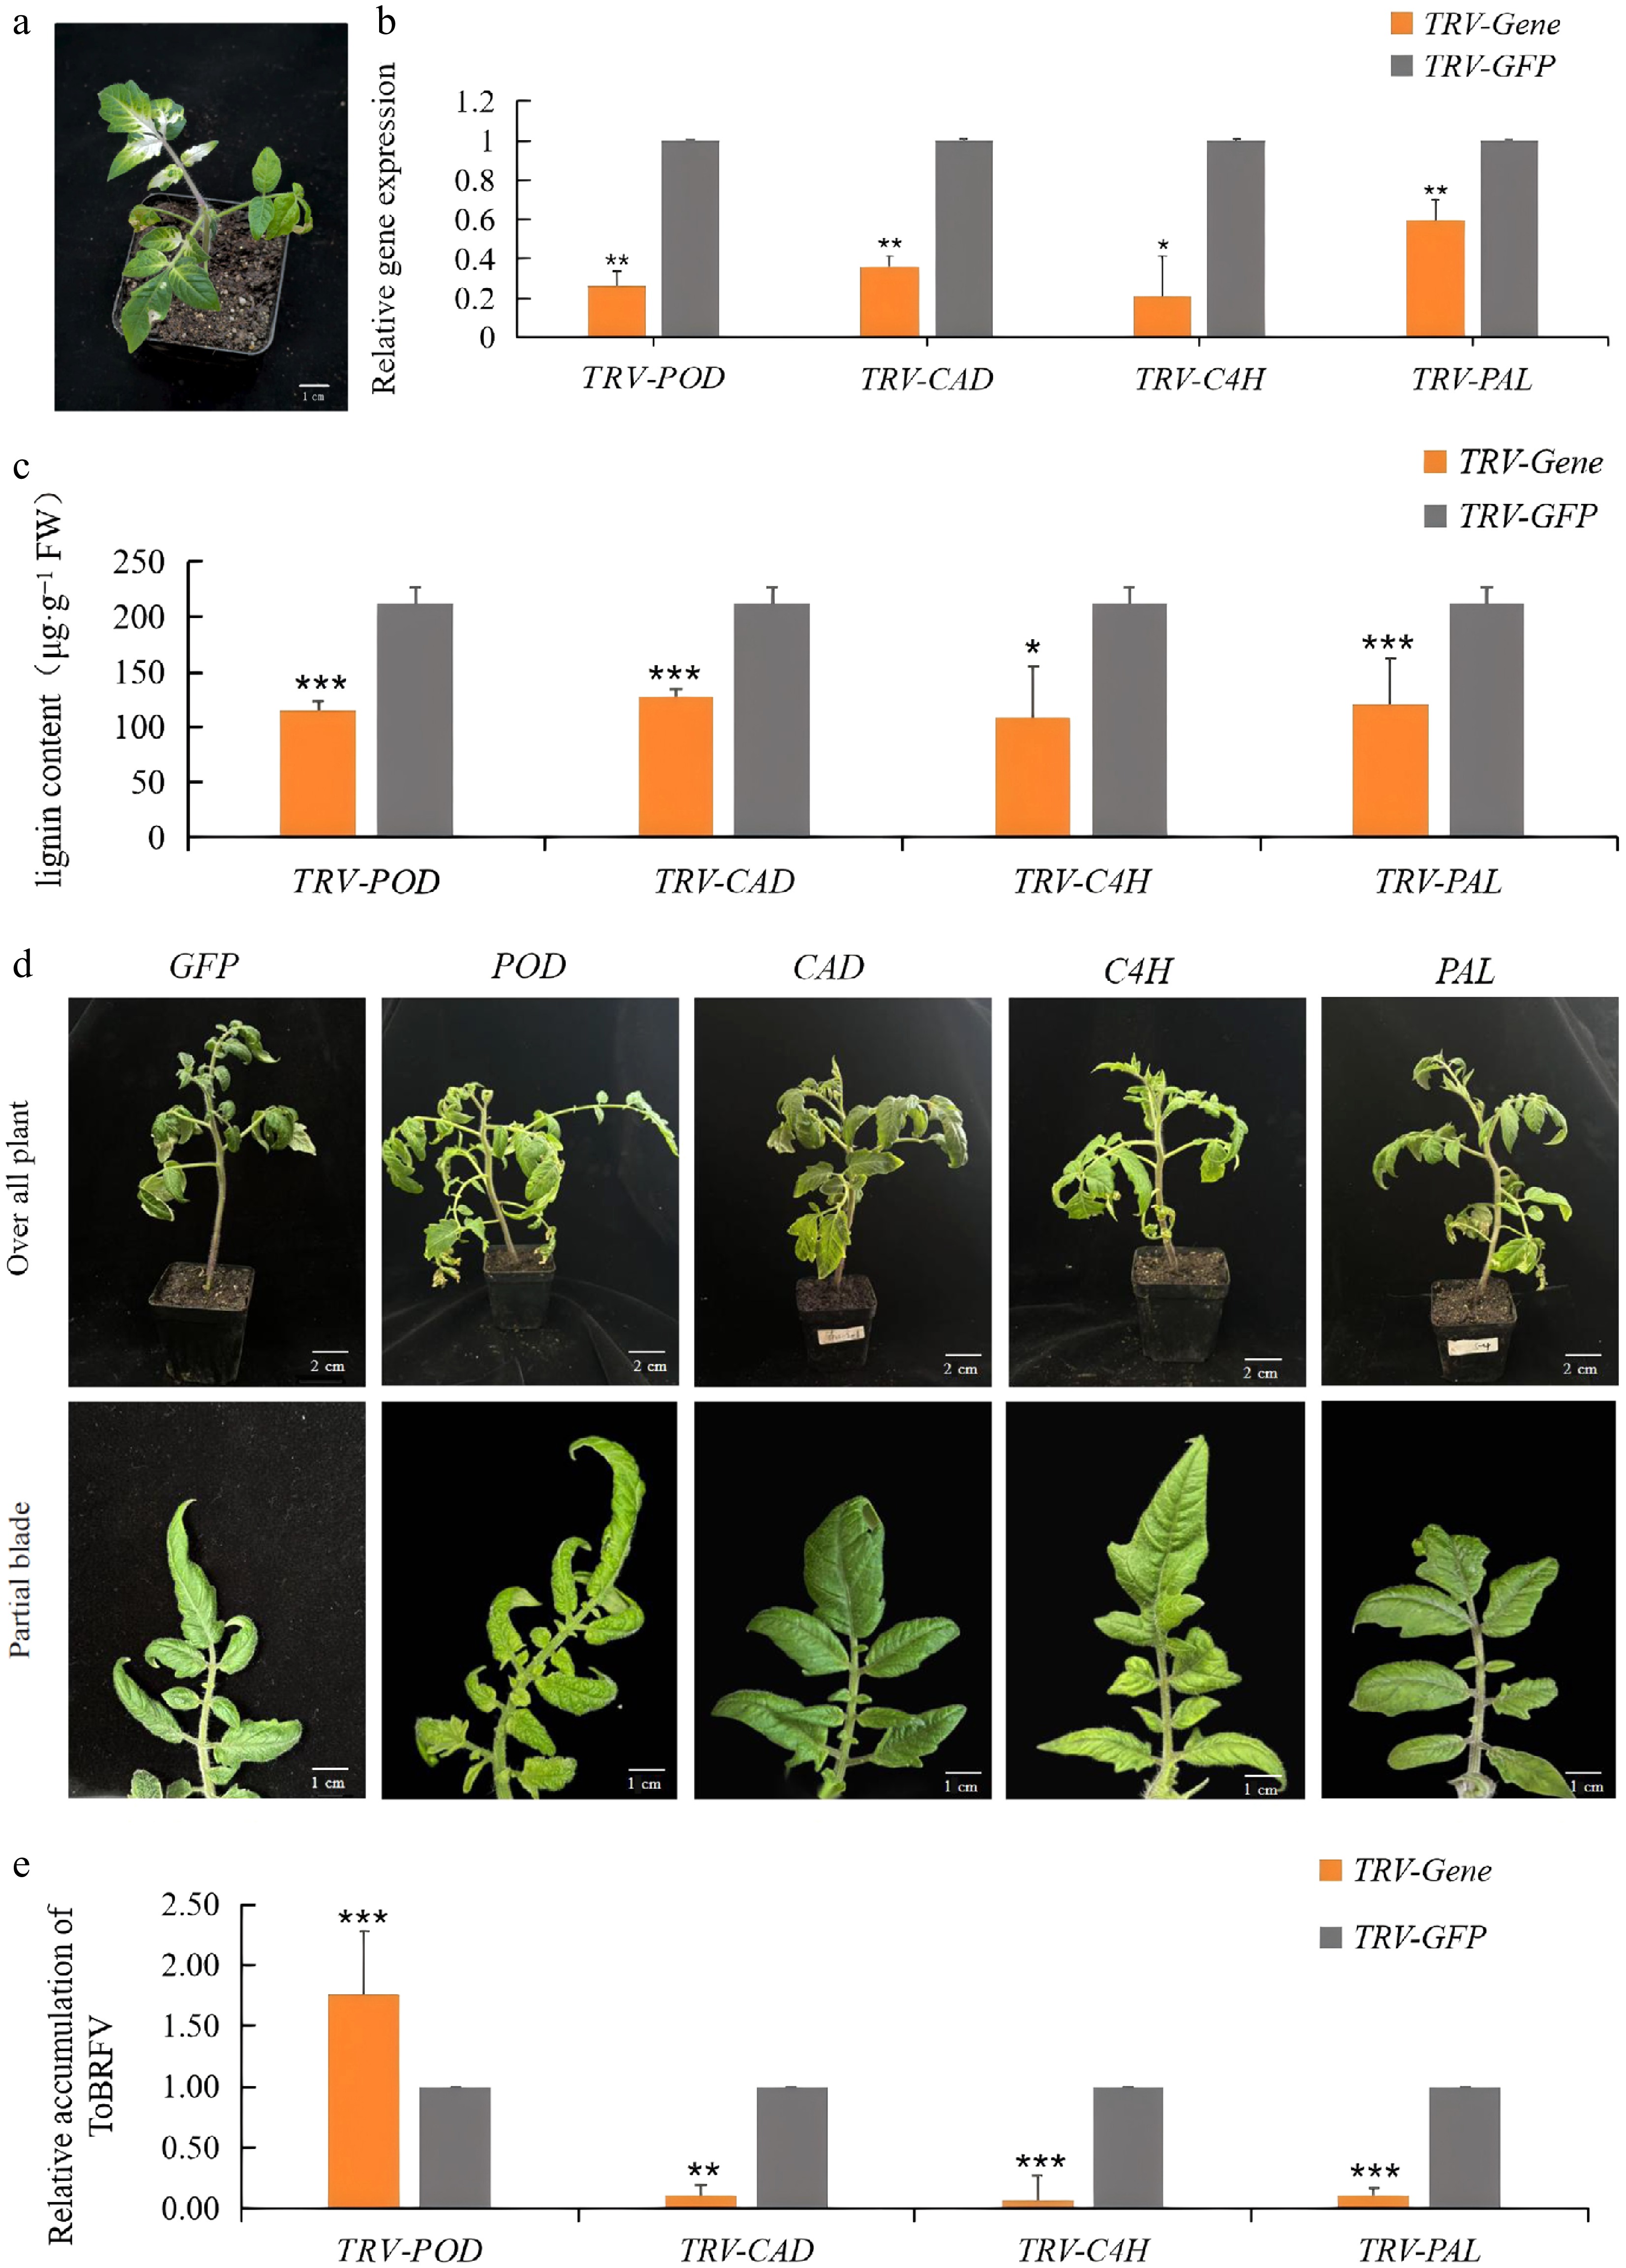
Figure 8.
Infection status of ToBRFV following downregulation of candidate genes. (a) Symptoms of plants after silencing of PDS gene. (b) Expression of candidate genes in CK and gene silenced plants. (c) Lignin content in CK and different gene-silenced plants. (d) Changes in phenotypes of CK and silenced plants after inoculation with ToBRFV for 14 d. (e) RT-qPCR analysis of ToBRFV genomic RNA in CK and gene-silenced plants at 14 dpi. Each value indicates the mean ± standard deviation of three biological replicates. *, **, and *** indicate significant differences between CK and silenced plants with p < 0.05, p < 0.01, p < 0.001, respectively, as determined by t-test.
-
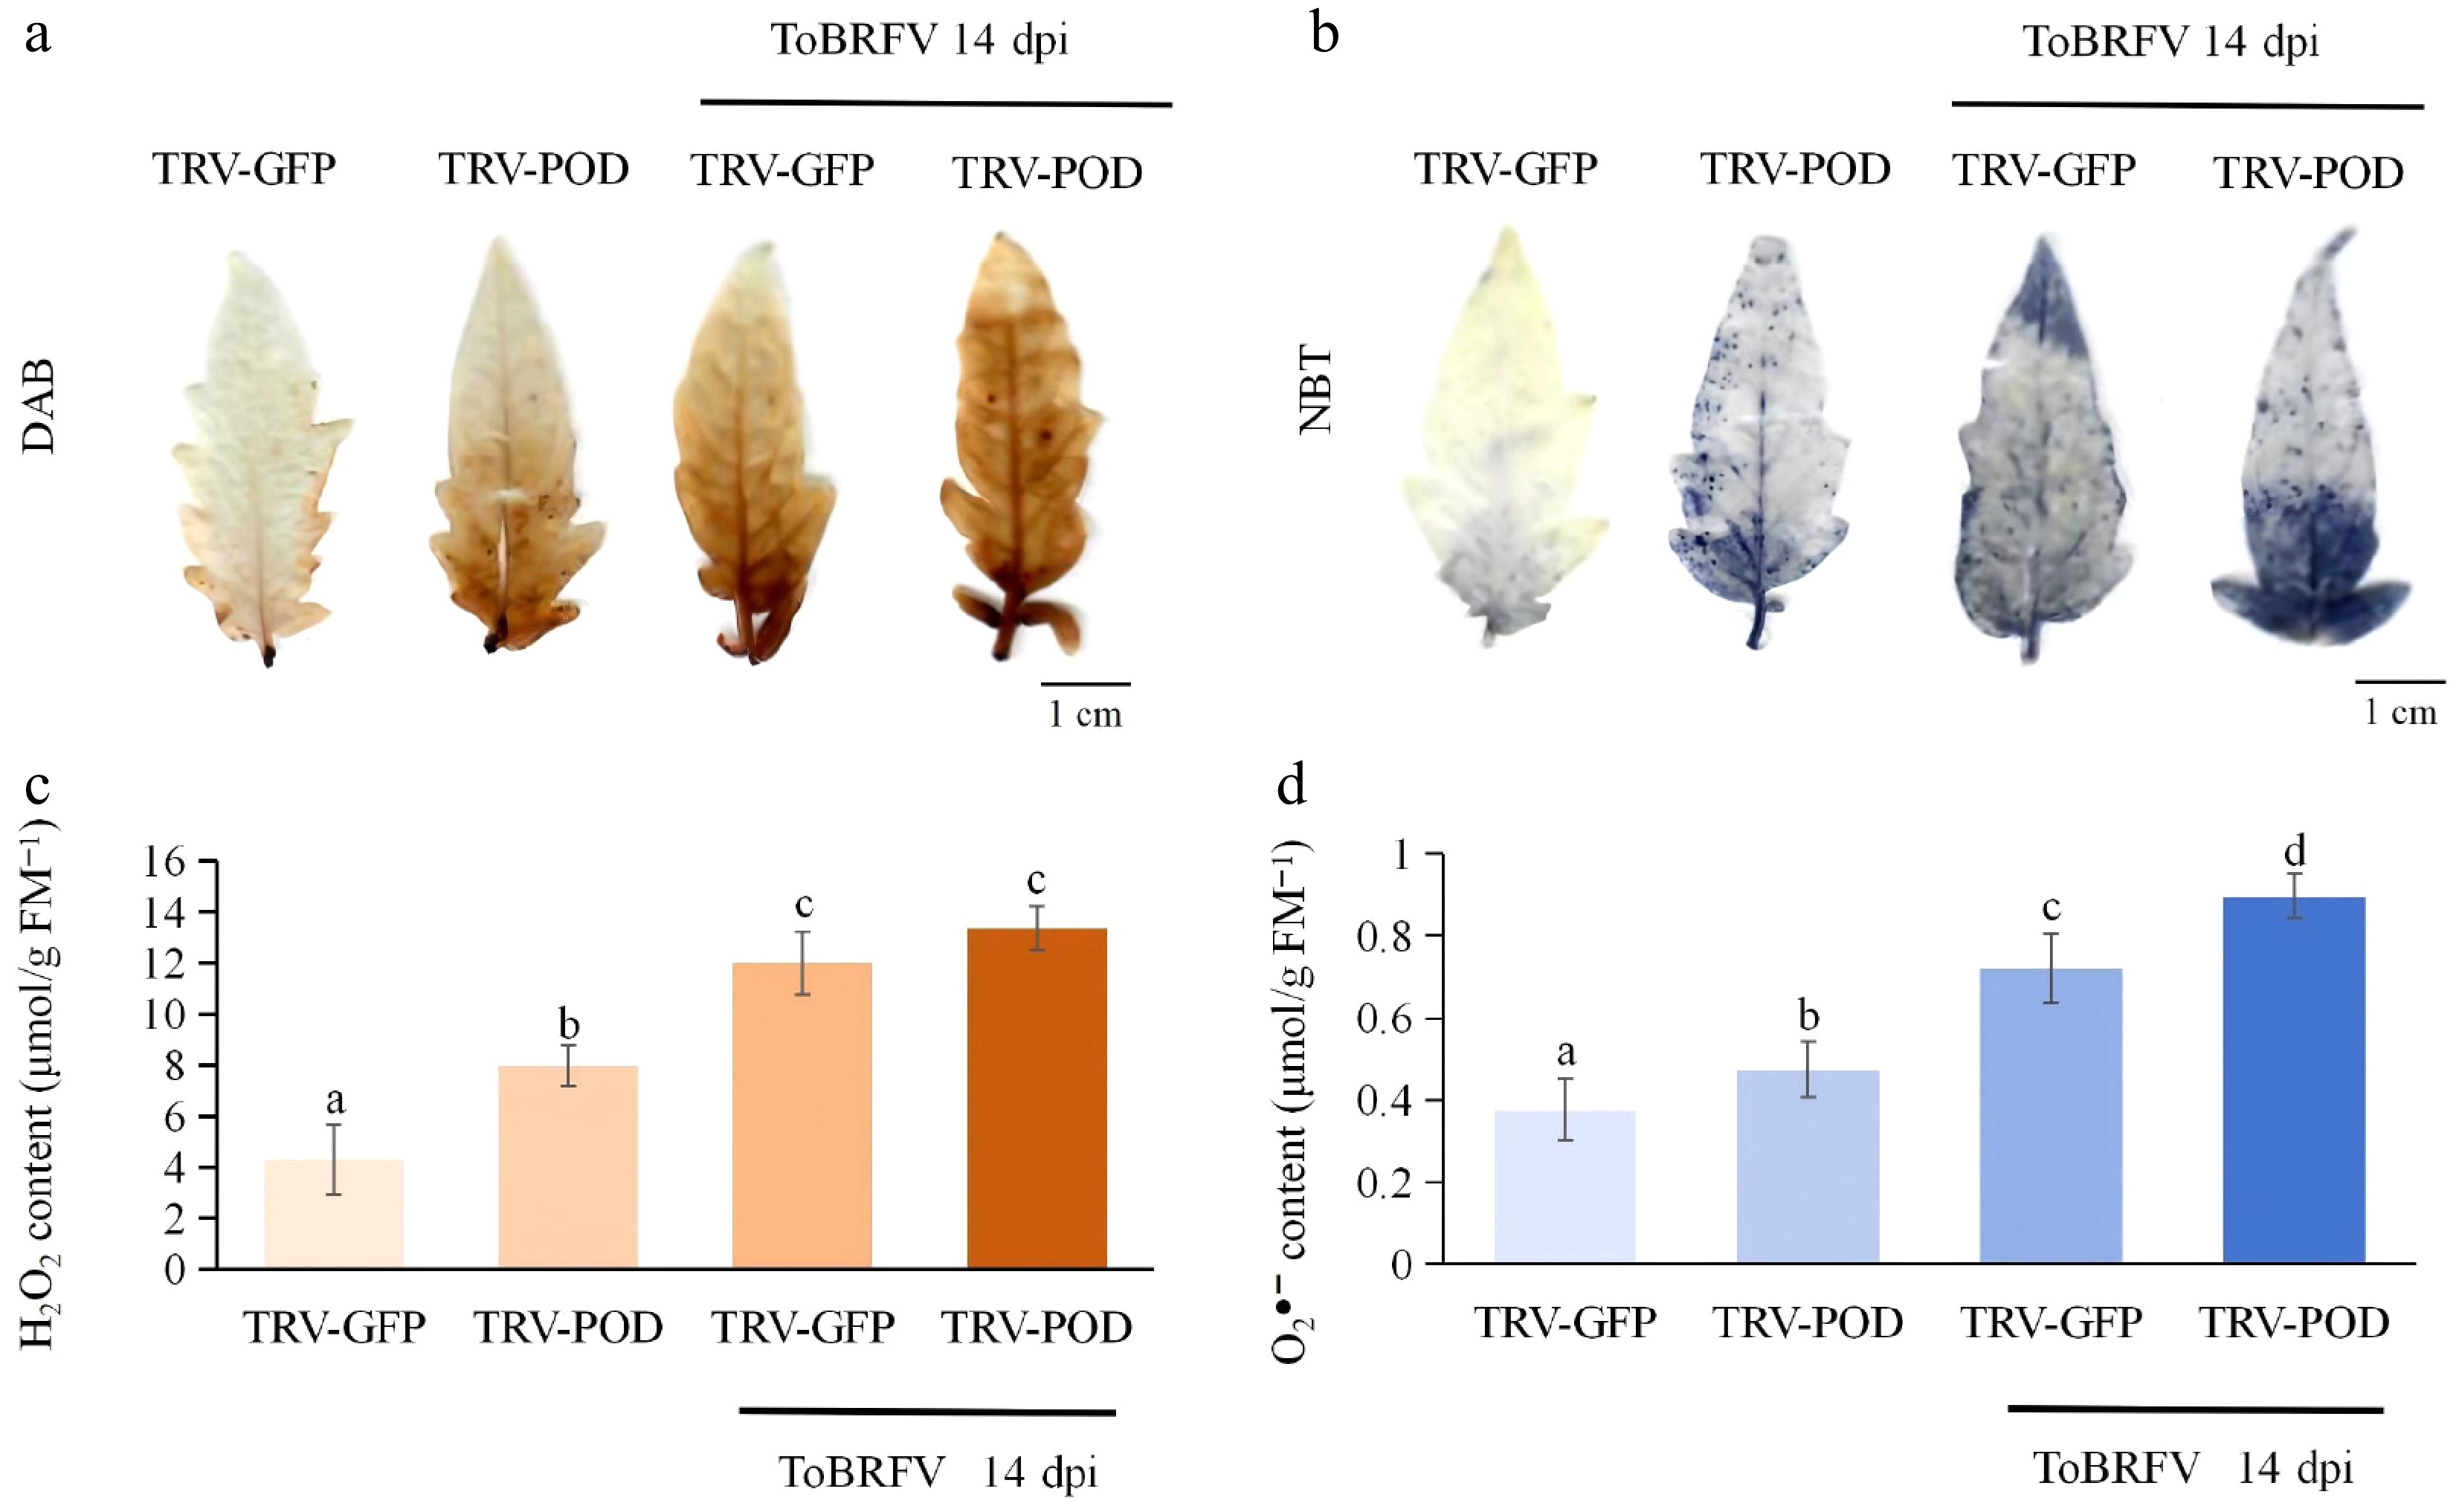
Figure 9.
ROS accumulation in TRV-POD tomato plants pre- and post-ToBRFV infection (14 dpi). (a) Visualization of H2O2 via diaminobenzidine (DAB) staining. (b) Visualization of O2•− via nitroblue tetrazolium (NBT) staining. (c) Quantification of H2O2 content. (d) Quantification of O2•− content. Data is presented as mean ± standard deviation (n = 3 biological replicates), and significant differences were determined by one-way ANOVA followed by multiple comparison tests.
Figures
(9)
Tables
(0)