-
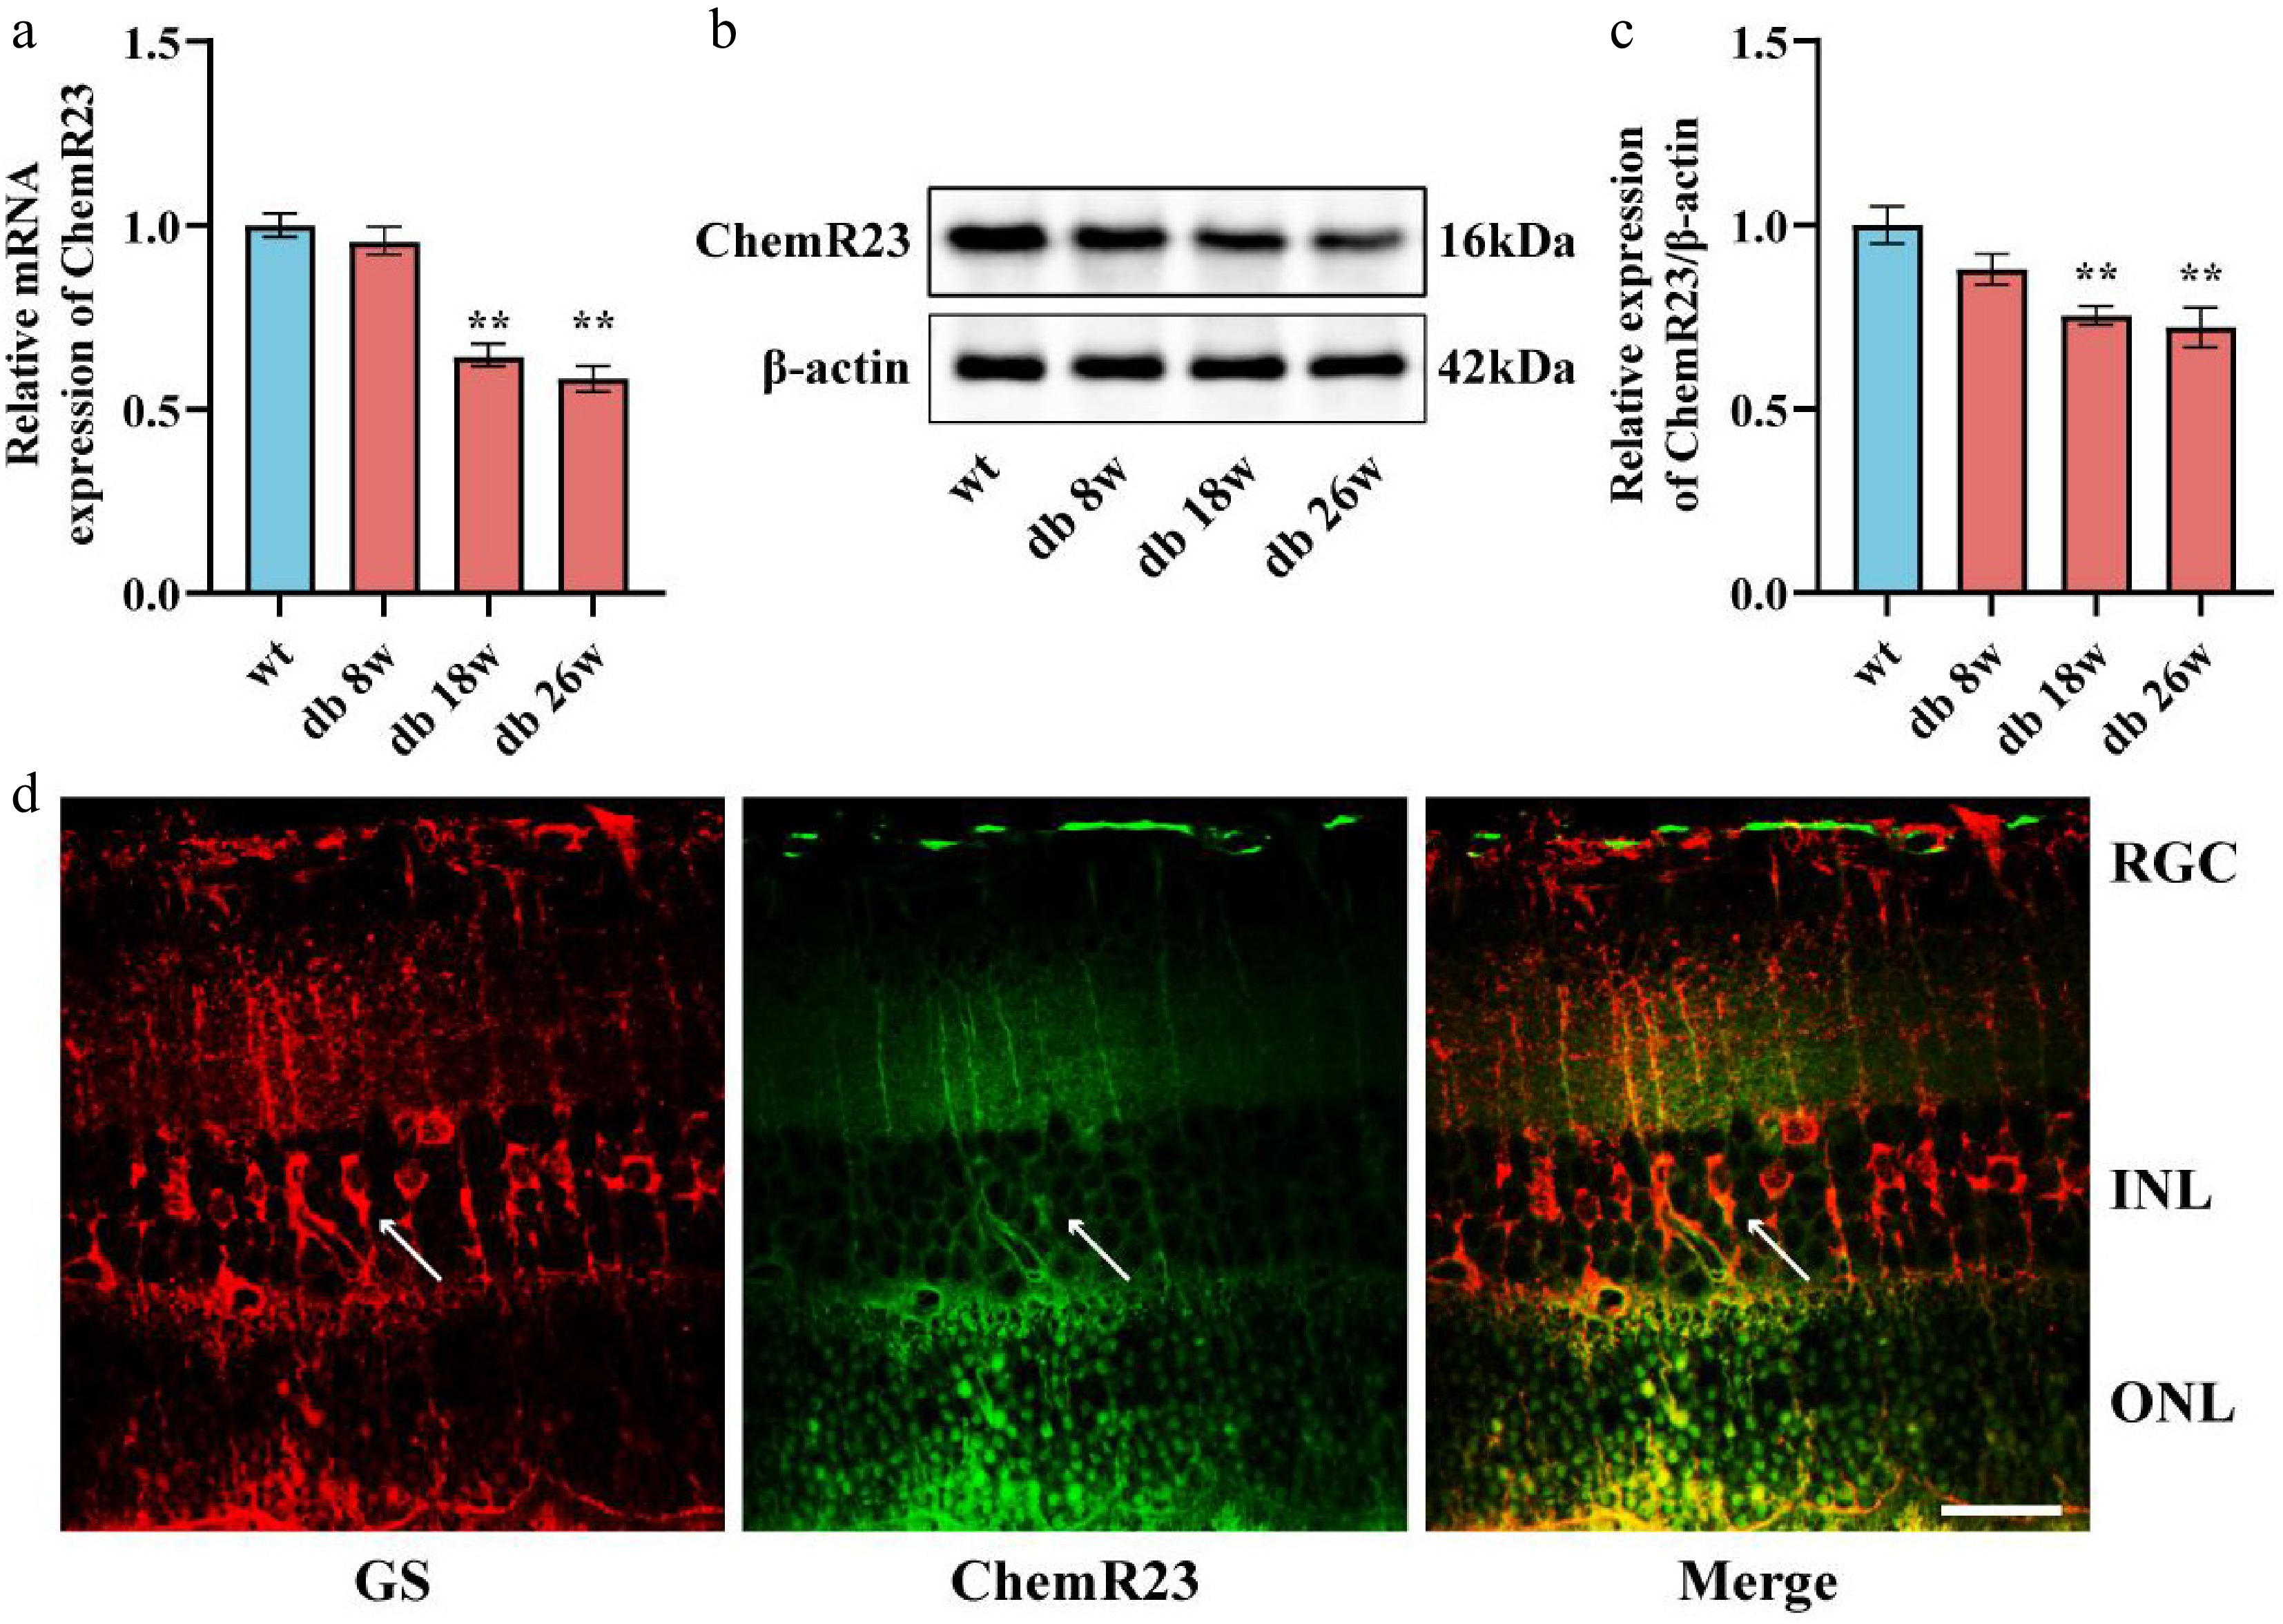
Figure 1.
Expression pattern of ChemR23. (a) qRT-PCR analysis of ChemR23 in the retina of db/db mice aged 8, 18, and 26 weeks. For each group, n = 5. (b, c) Representative Western blot bands and semiquantitative analysis of ChemR23 in the retinas of db/db mice aged 8, 18, and 26 weeks. For each group, n = 3. Data are expressed as the average value ± SEM. ** p < 0.01 vs WT. (d) Combined immunofluorescence images of the representative ChemR23 and GS in the retina of db/db mice aged 18 weeks. The white arrows indicate the coexpression of GS and ChemR23. Scale: 50 μm. For each group, n = 3.
-
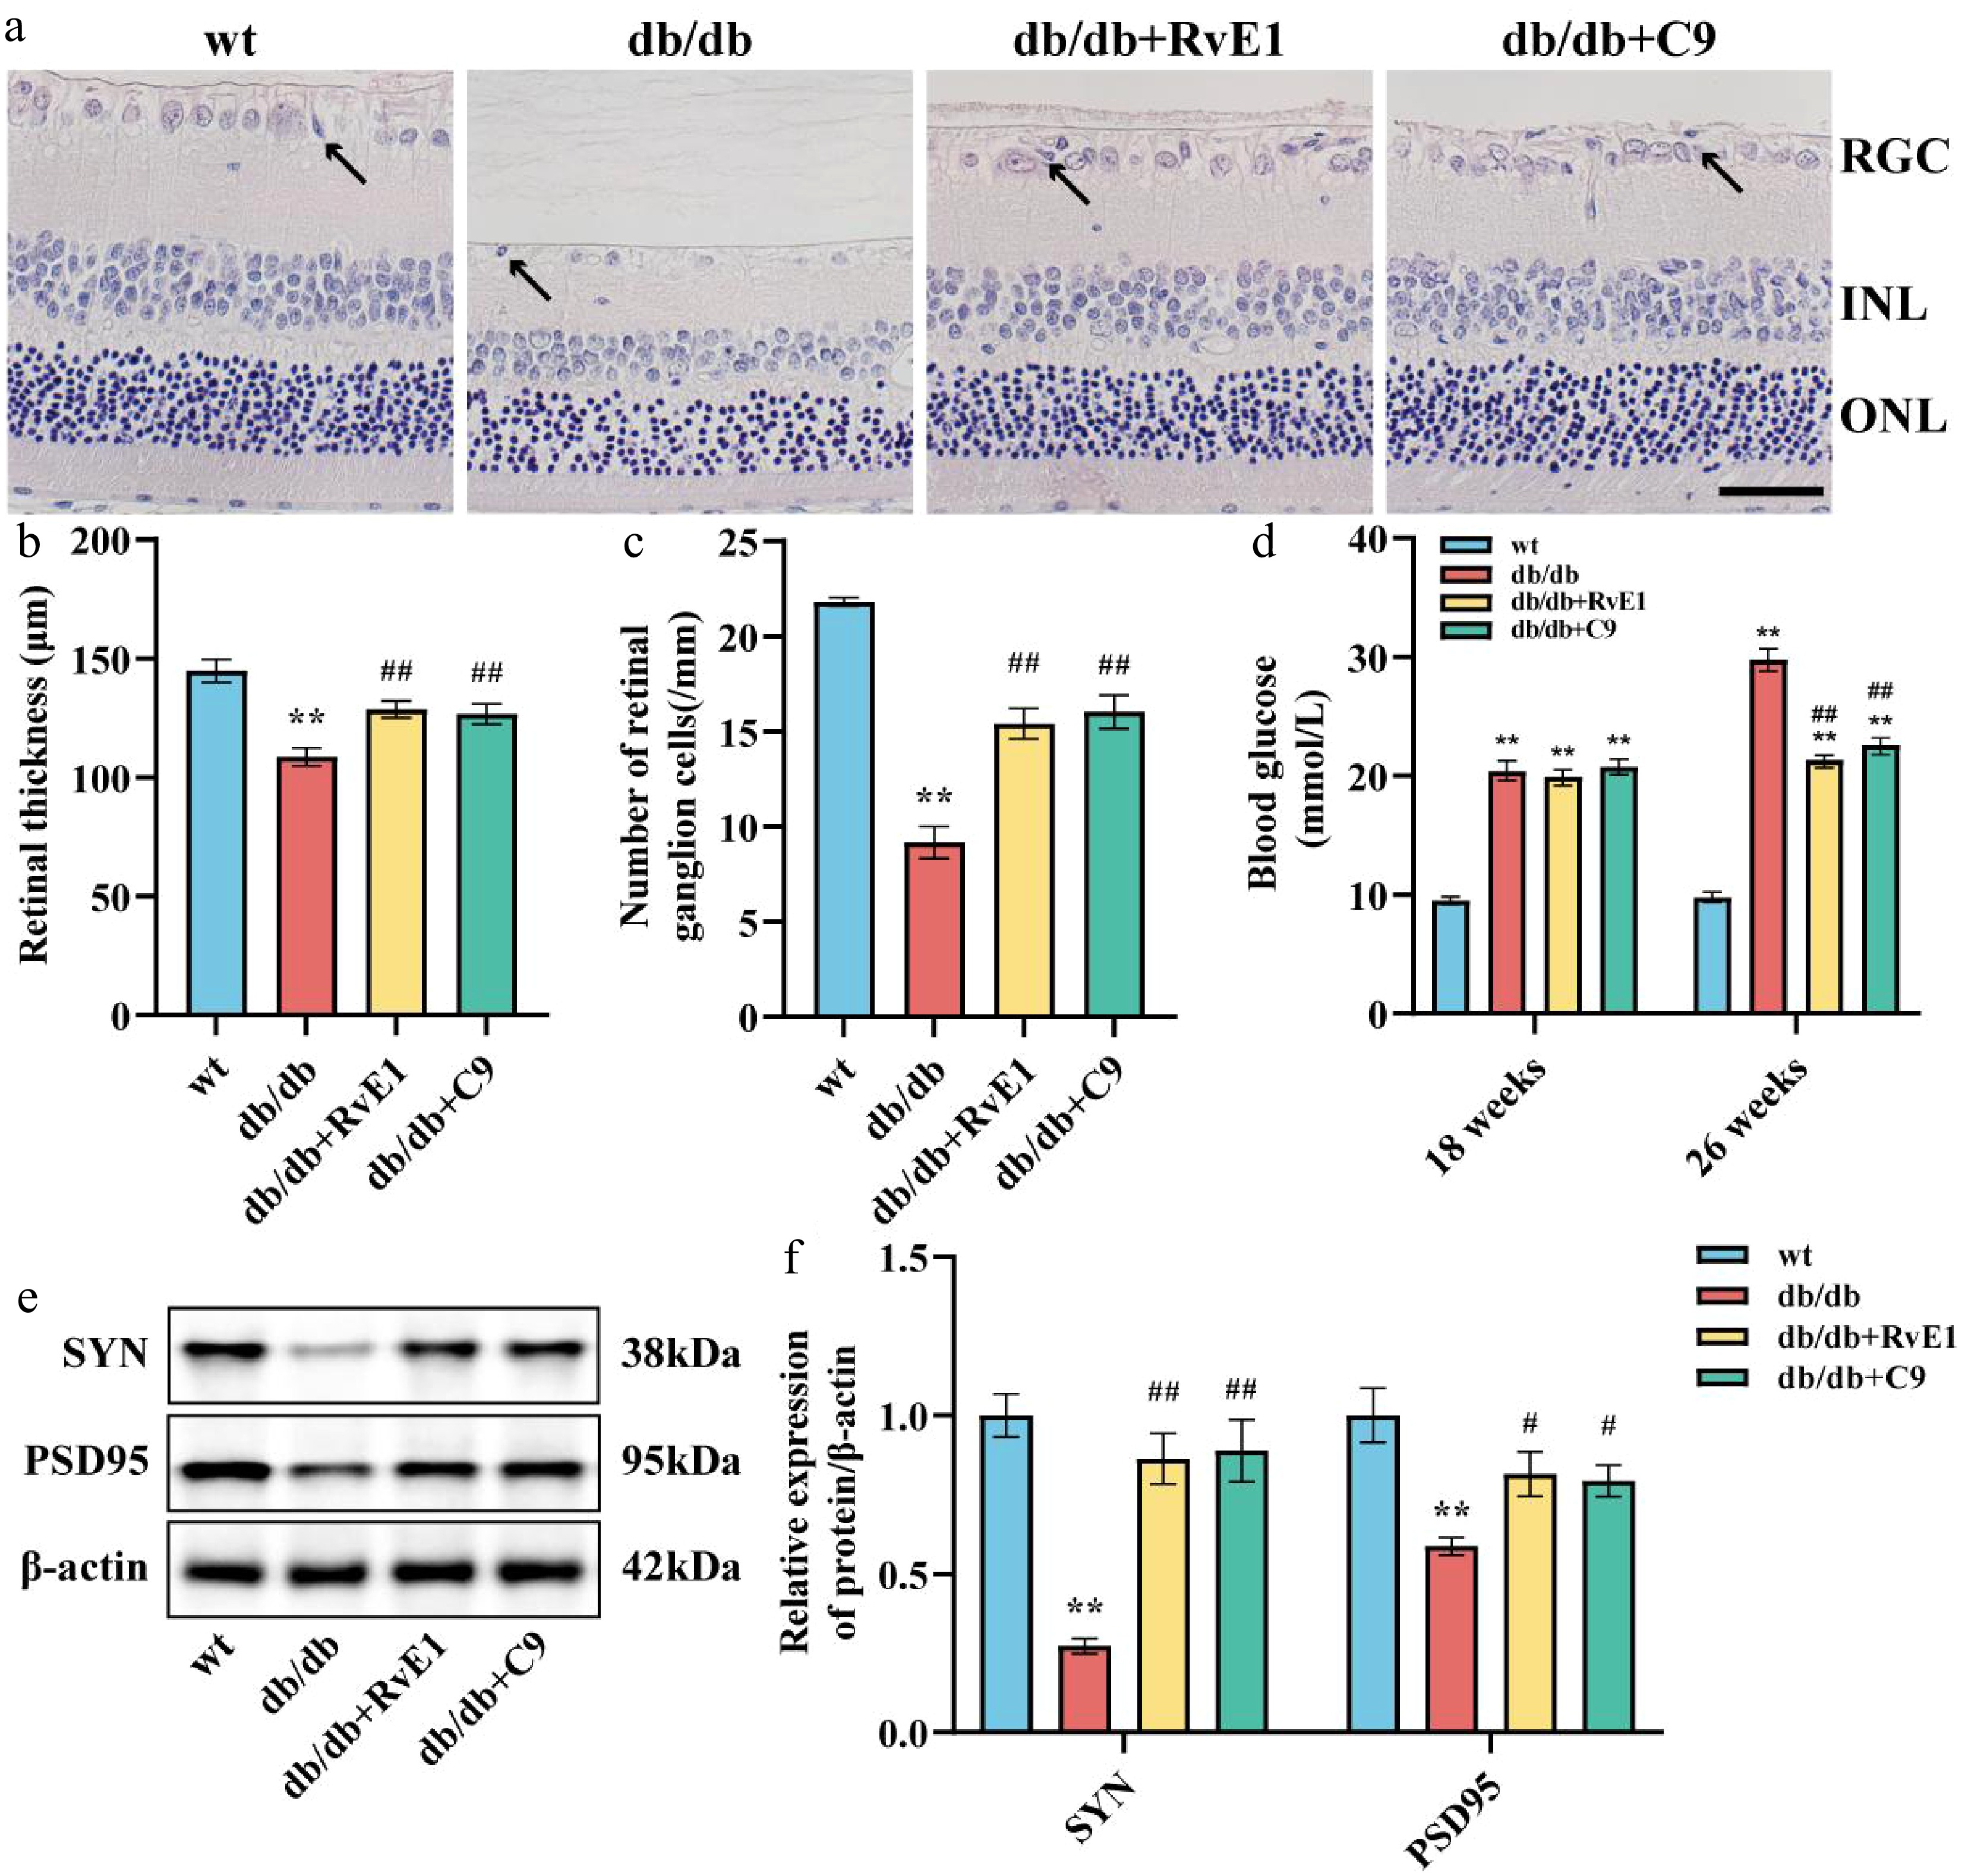
Figure 2.
ChemR23 activation by RvE1 or C9 attenuated damage to RGCs. (a) Representative H&E staining of the retina in db/db mice aged 18 weeks after intraperitoneal injection treatment with RvE1 or C9 for 8 weeks. Black arrows indicate necrotic RGCs. Scale: 50 μm. For each group, n = 5. (b) and (e) Semiquantitative analysis of retinal thickness and the number of RGCs. (c) Comparison of fasting blood glucose in each group of mice. (d) Comparison of body weight in each group of mice. (f) SYN and PSD95 are representative Western blot bands. For each group, n = 4. (g) Semiquantitative analysis of SYN, and PSD95. For each group, n = 4. Data are expressed as the average value ± SEM. ** p < 0.01 vs WT. # p < 0.05, ## p < 0.01 vs db/db.
-
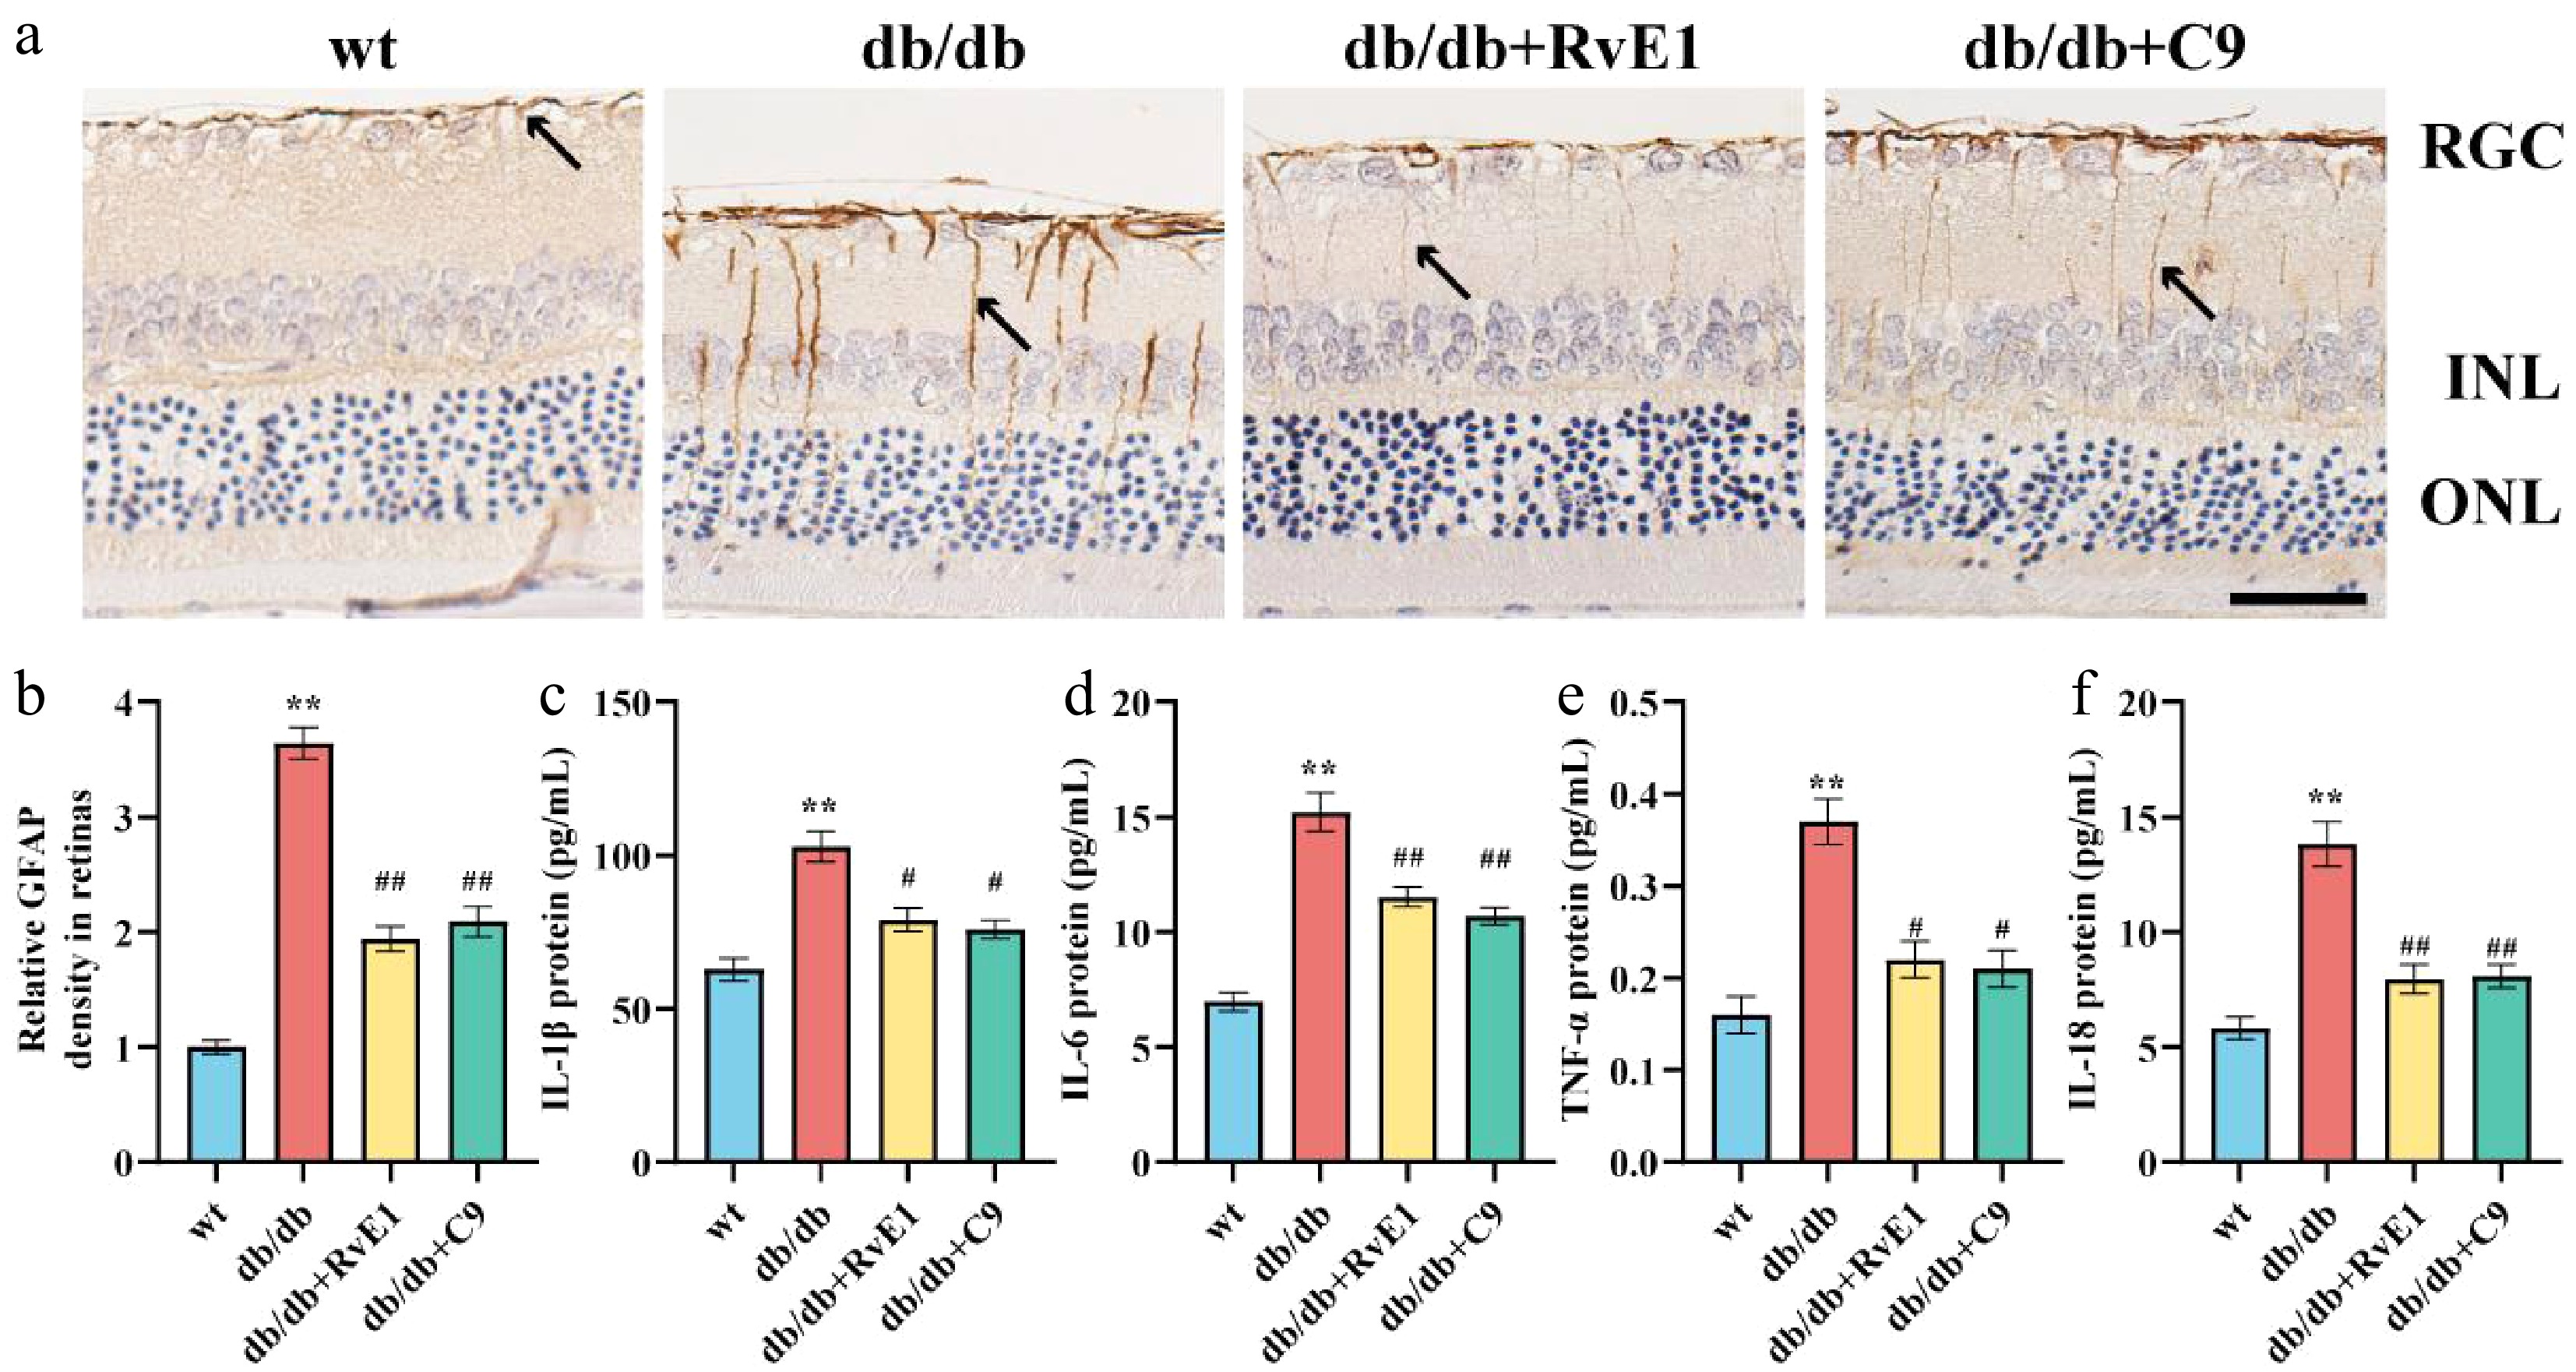
Figure 3.
ChemR23 activation by RvE1 or C9 mitigated inflammatory responses and Müller cell activation. (a) Representative immunohistochemical staining of retinal GFAP in db/db mice aged 18 weeks after intraperitoneal injection treatment with RvE1 or C9 for 8 weeks. The black arrow indicates the positive expression of GFAP. Scale: 50 μm. For each group, n = 5. (b) Quantitative analysis of the relative density of retinal GFAP. For each group, n = 5. Data are expressed as the average value ± SEM. ** p < 0.01 vs WT. ## p < 0.01 vs db/db. (c–f) The protein levels of IL-1β, IL-6, IL-18, and TNF-α in the retina of db/db mice aged 18 weeks treated with RvE1 or C9 via intraperitoneal injection for 8 weeks determined by ELISA. For each group, n = 5. Data are expressed as the average value ± SEM. ** p < 0.01 vs WT. # p < 0.05, ## p < 0.01, vs db/db.
-
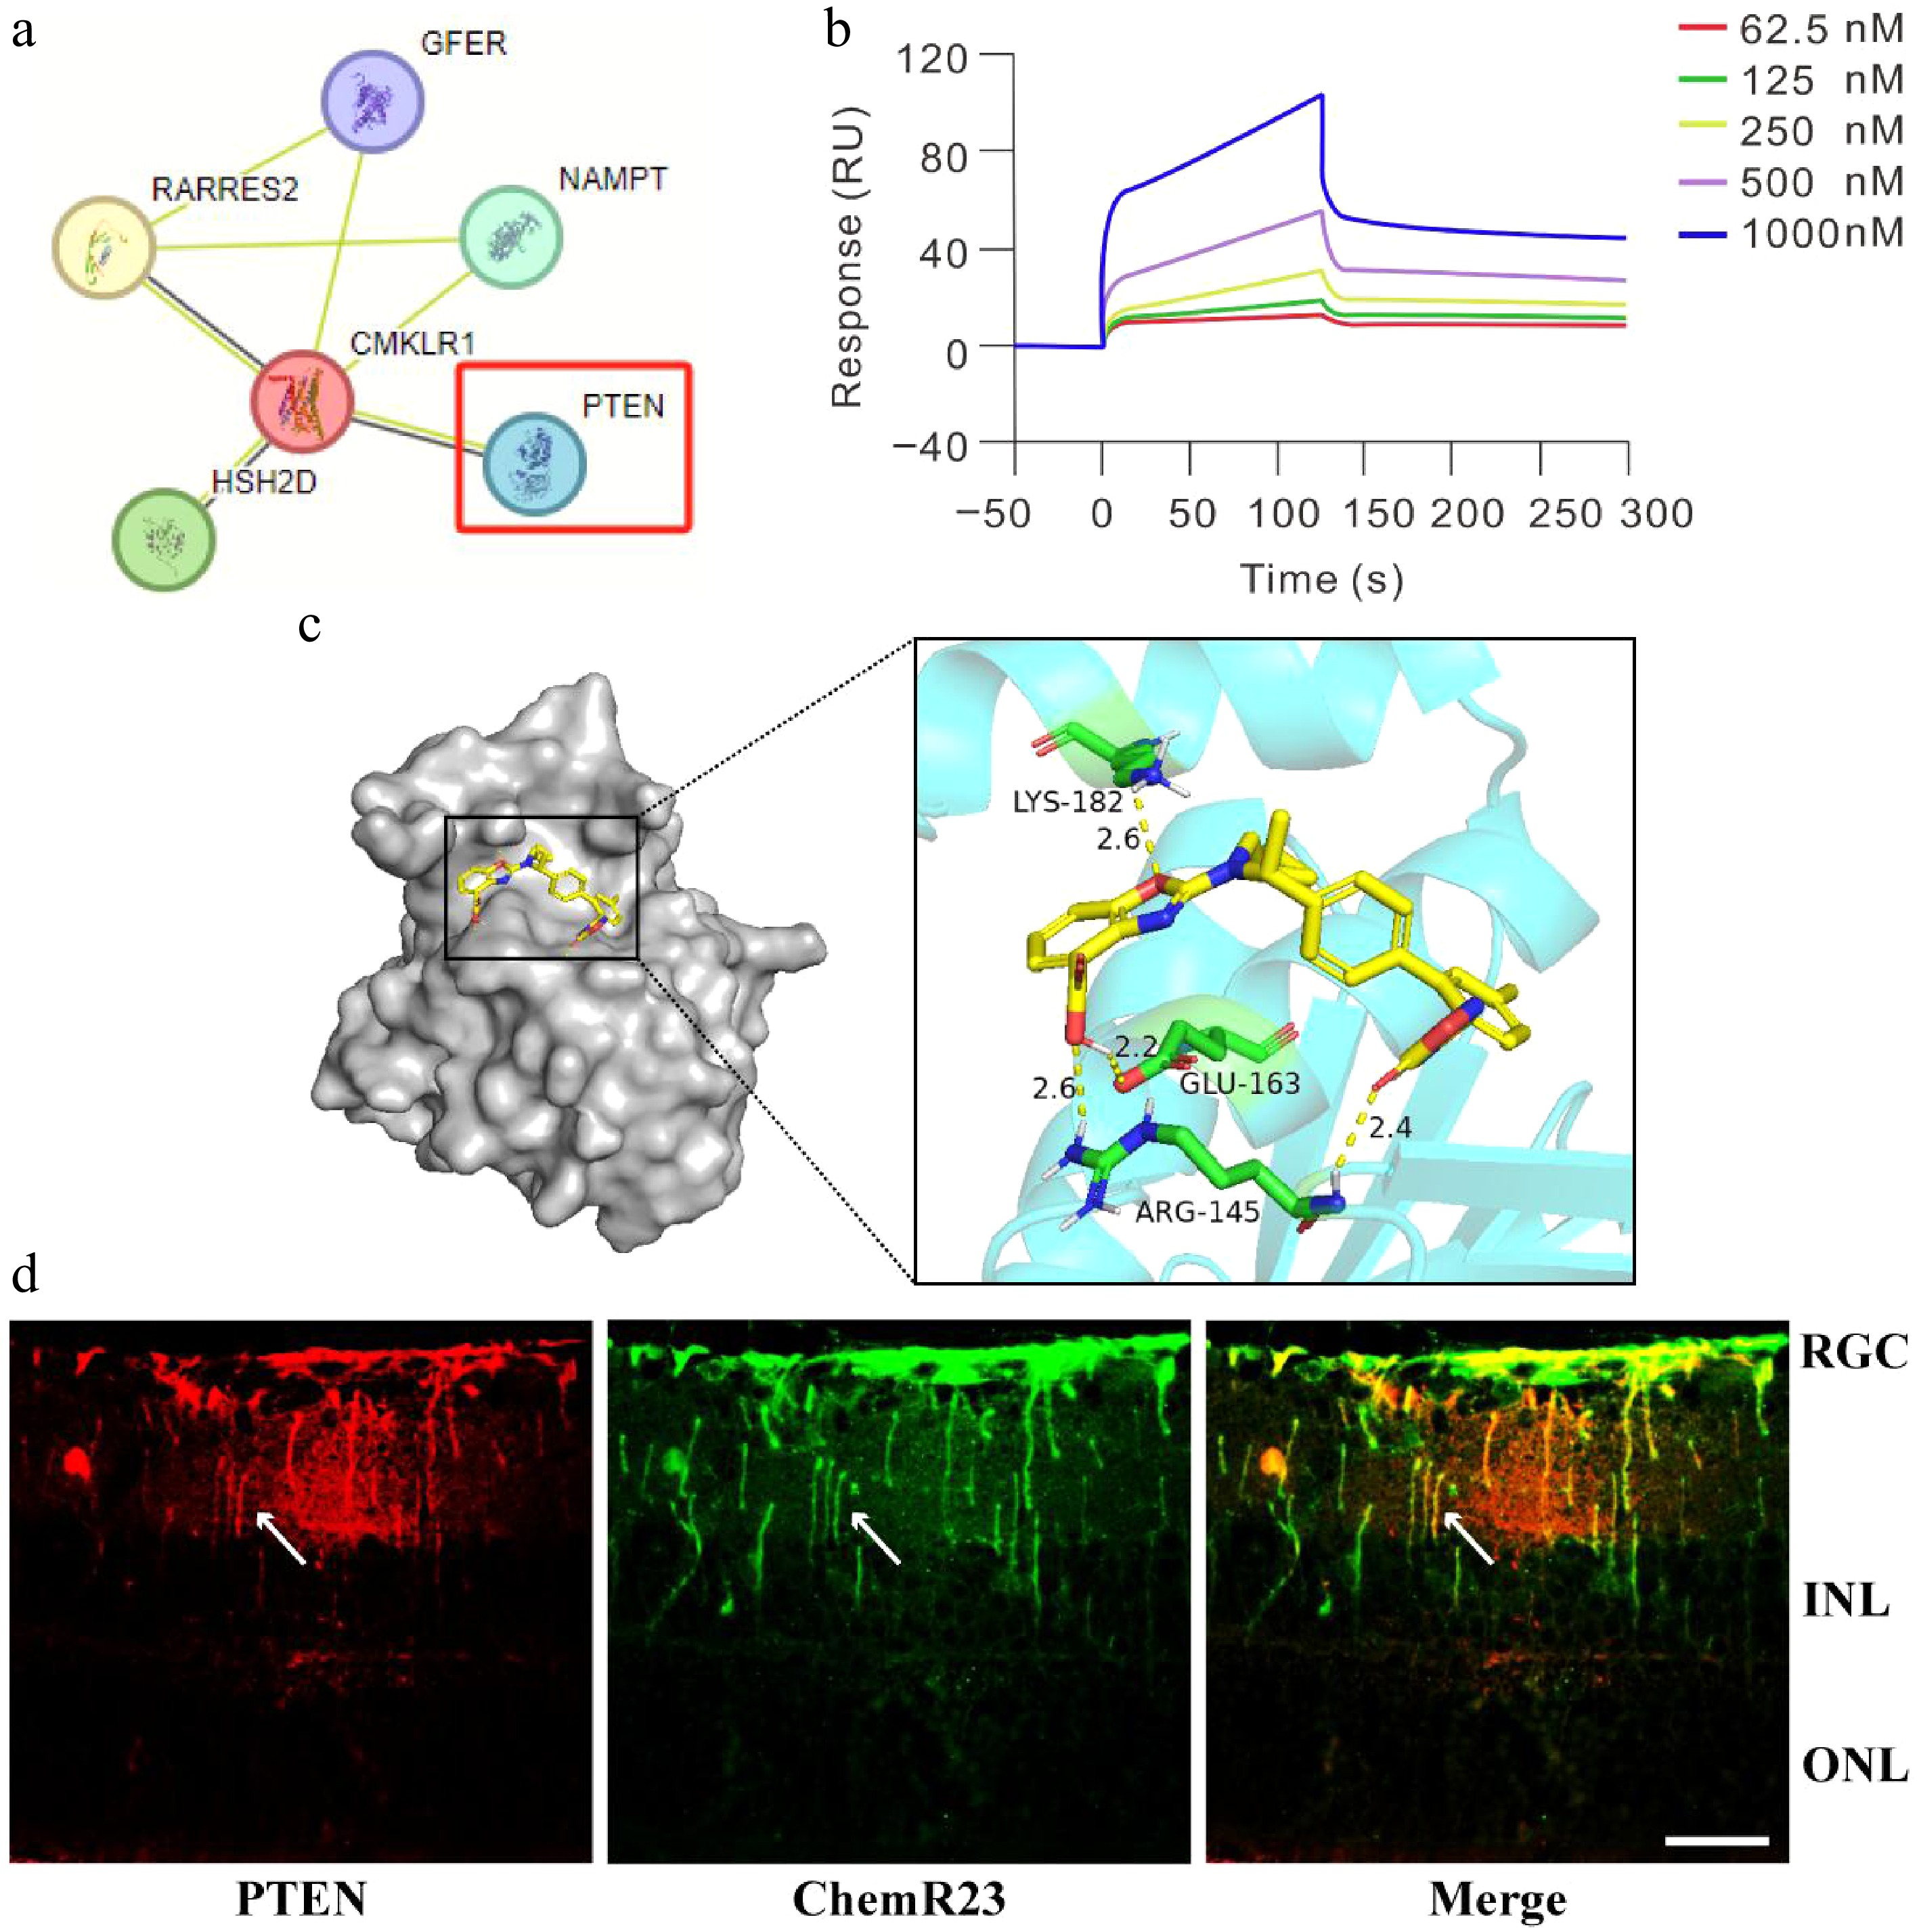
Figure 4.
ChemR23 interacts with PTEN in the retinas of diabetic mice. (a) The PPI network of ChemR23 and PTEN. (b) SPR analysis of the binding of ChemR23 and PTEN. PTEN is fixed on the CM5 BIAcore chip and interacts with ChemR23 at the specified concentration. (c) Diagram of the molecular docking model. The cyan molecules represent ChemR23, the yellow molecules represent PTEN, and the green molecules represent the amino acids that combine PTEN with ChemR23, namely lysine-182, glutamate-163 and arginine-145. (d) Immunofluorescence colocalization of ChemR23 and PTEN in the retina of db/db mice aged 18 weeks. The white arrows indicate the coexpression of PTEN and ChemR23. Scale: 50 μm. For each group, n = 3.
-
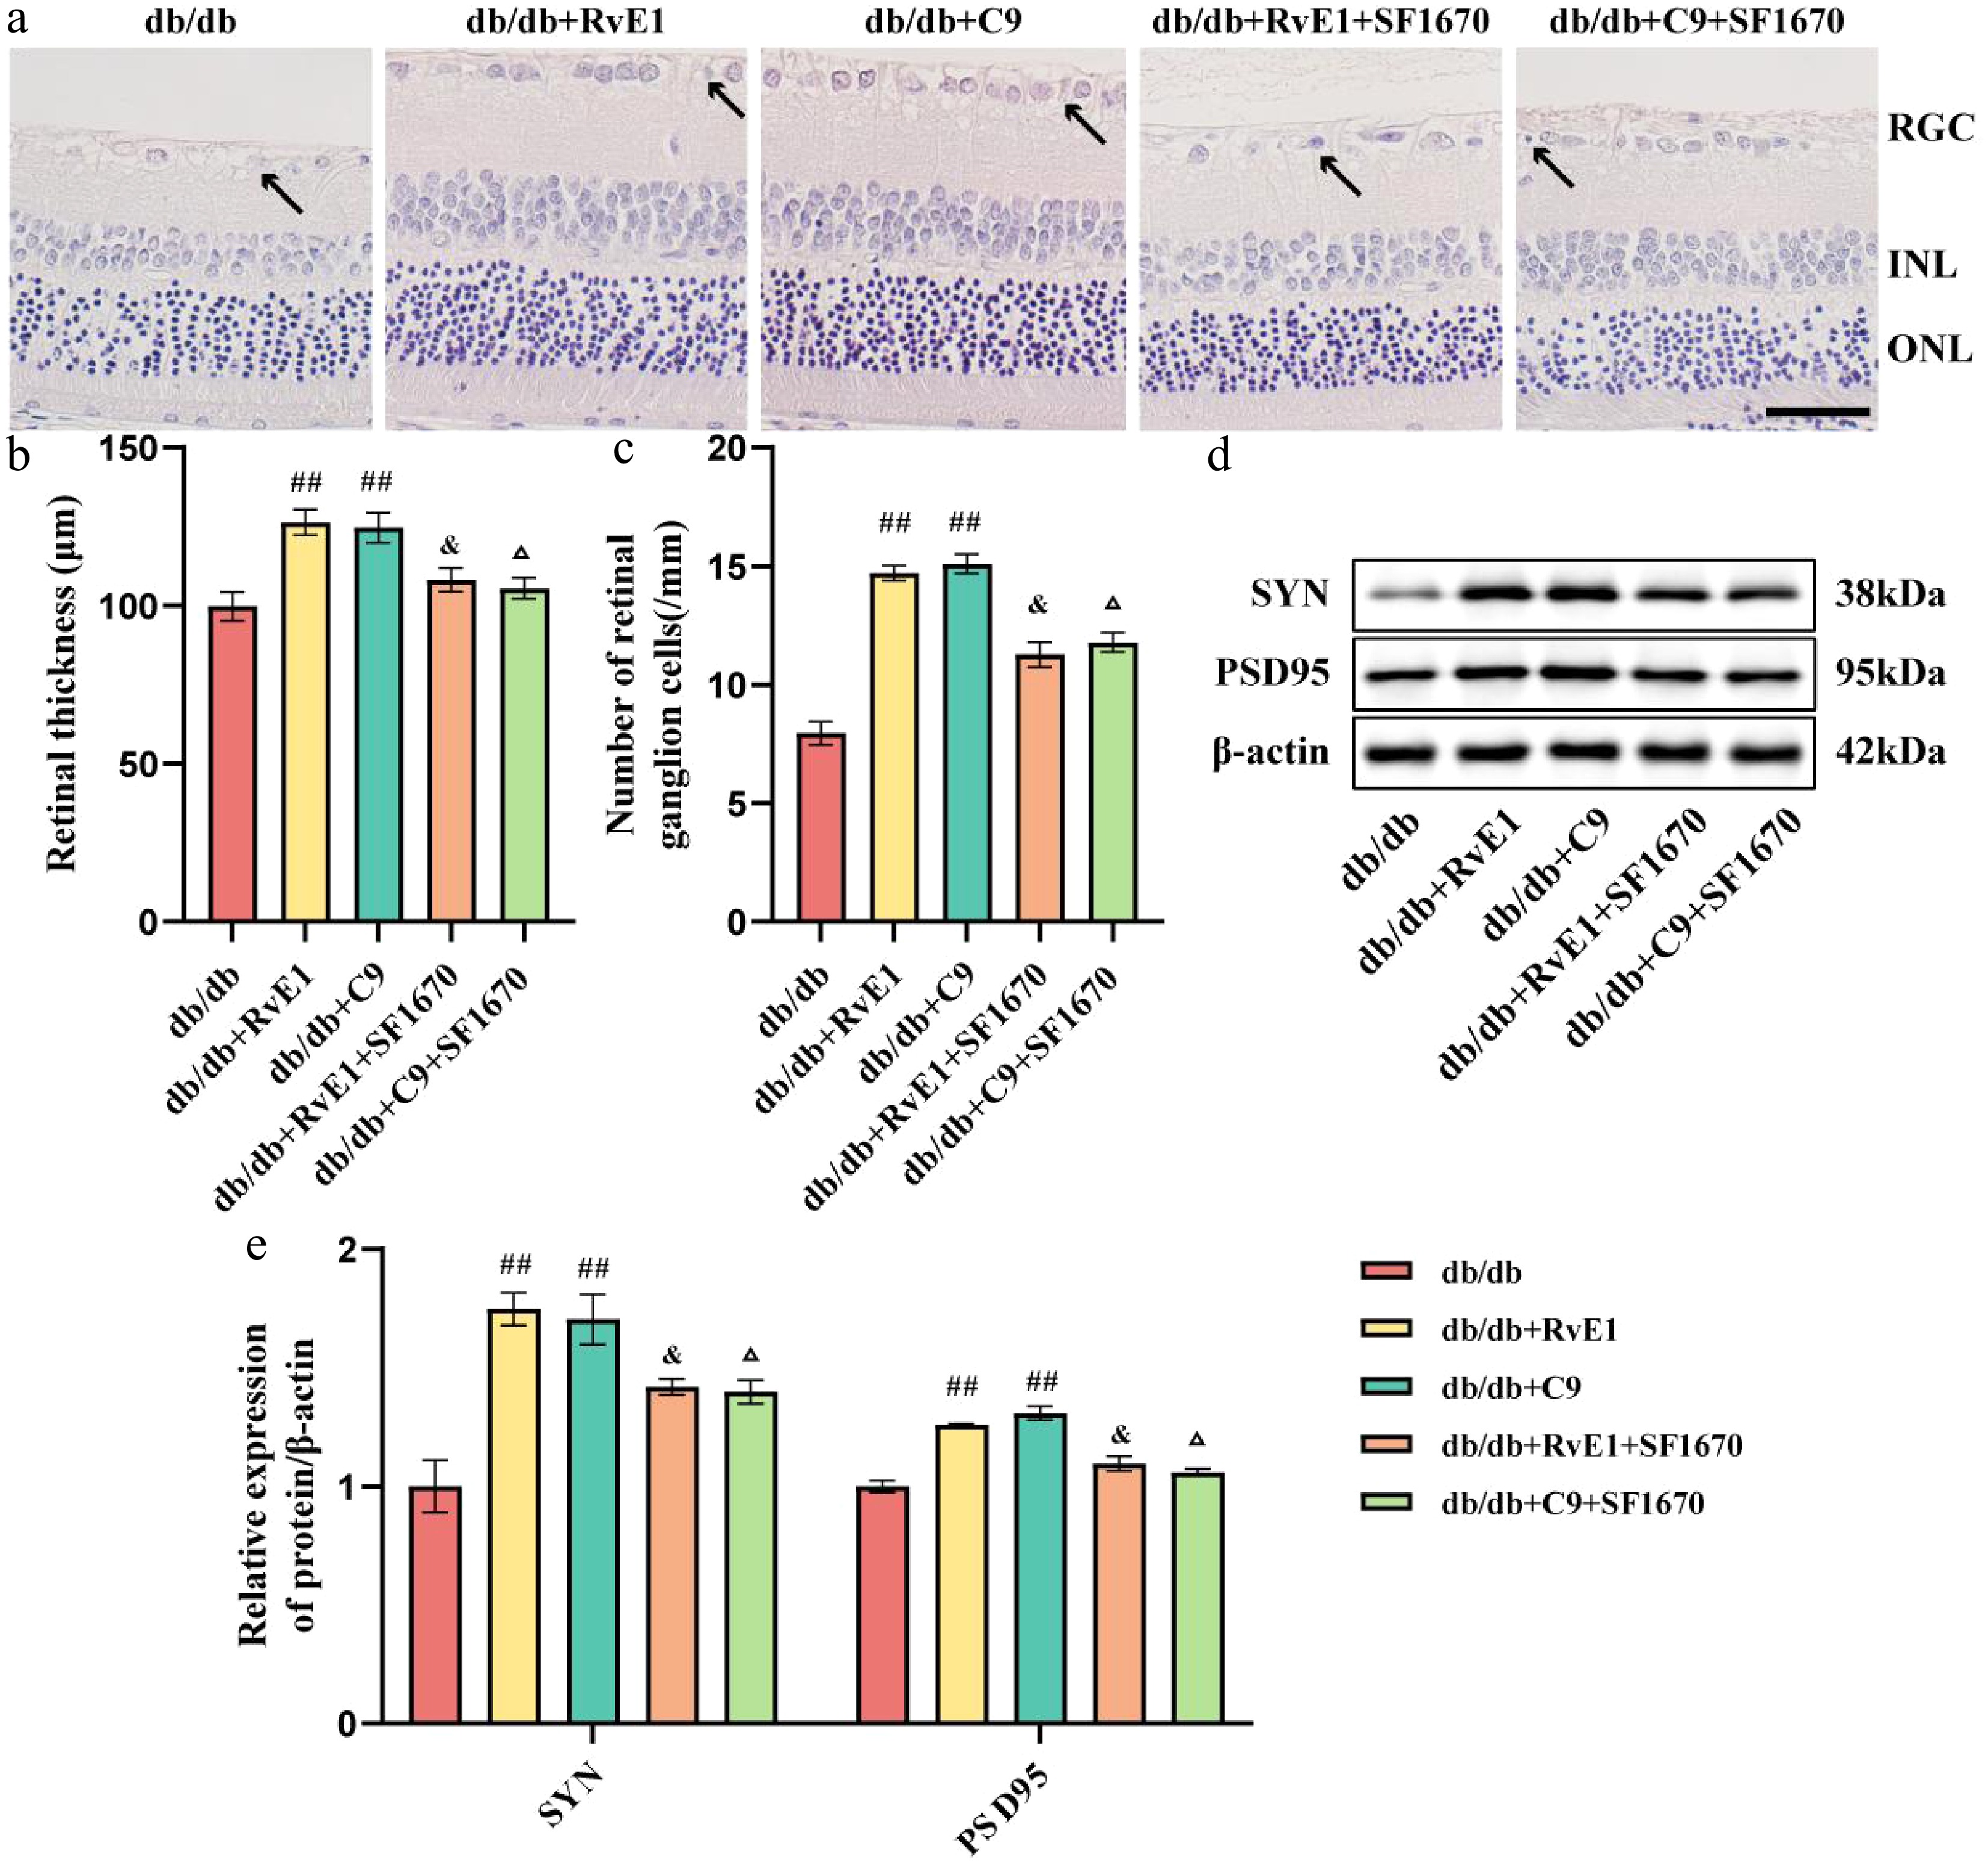
Figure 5.
ChemR23 activation depend on its interaction with PTEN to reduce damage to RGCs. (a) Representative H&E staining of the retina of db/db mice aged 18 weeks after intraperitoneal injection treatment with RvE1 or C9 and SF1670 (selective inhibitors of PTEN) for 8 weeks. Black arrows indicate necrotic RGCs. Scale: 50 μm. For each group, n = 5. (b, c) Semiquantitative analysis of retinal thickness and the number of RGCs. For each group, n = 5. Data are expressed as the average value ± SEM. ## p < 0.01 vs db/db. & p < 0.05 vs db/db + RvE1. Δ p < 0.05 vs db/db + C9. (d, e) Representative Western blot bands and semiquantitative analysis of SYN and PSD95. For each group, n = 4. Data are expressed as the average value ± SEM. ## p < 0.01 vs db/db. & p < 0.05 vs db/db + RvE1. Δ p < 0.05 vs db/db + C9.
-
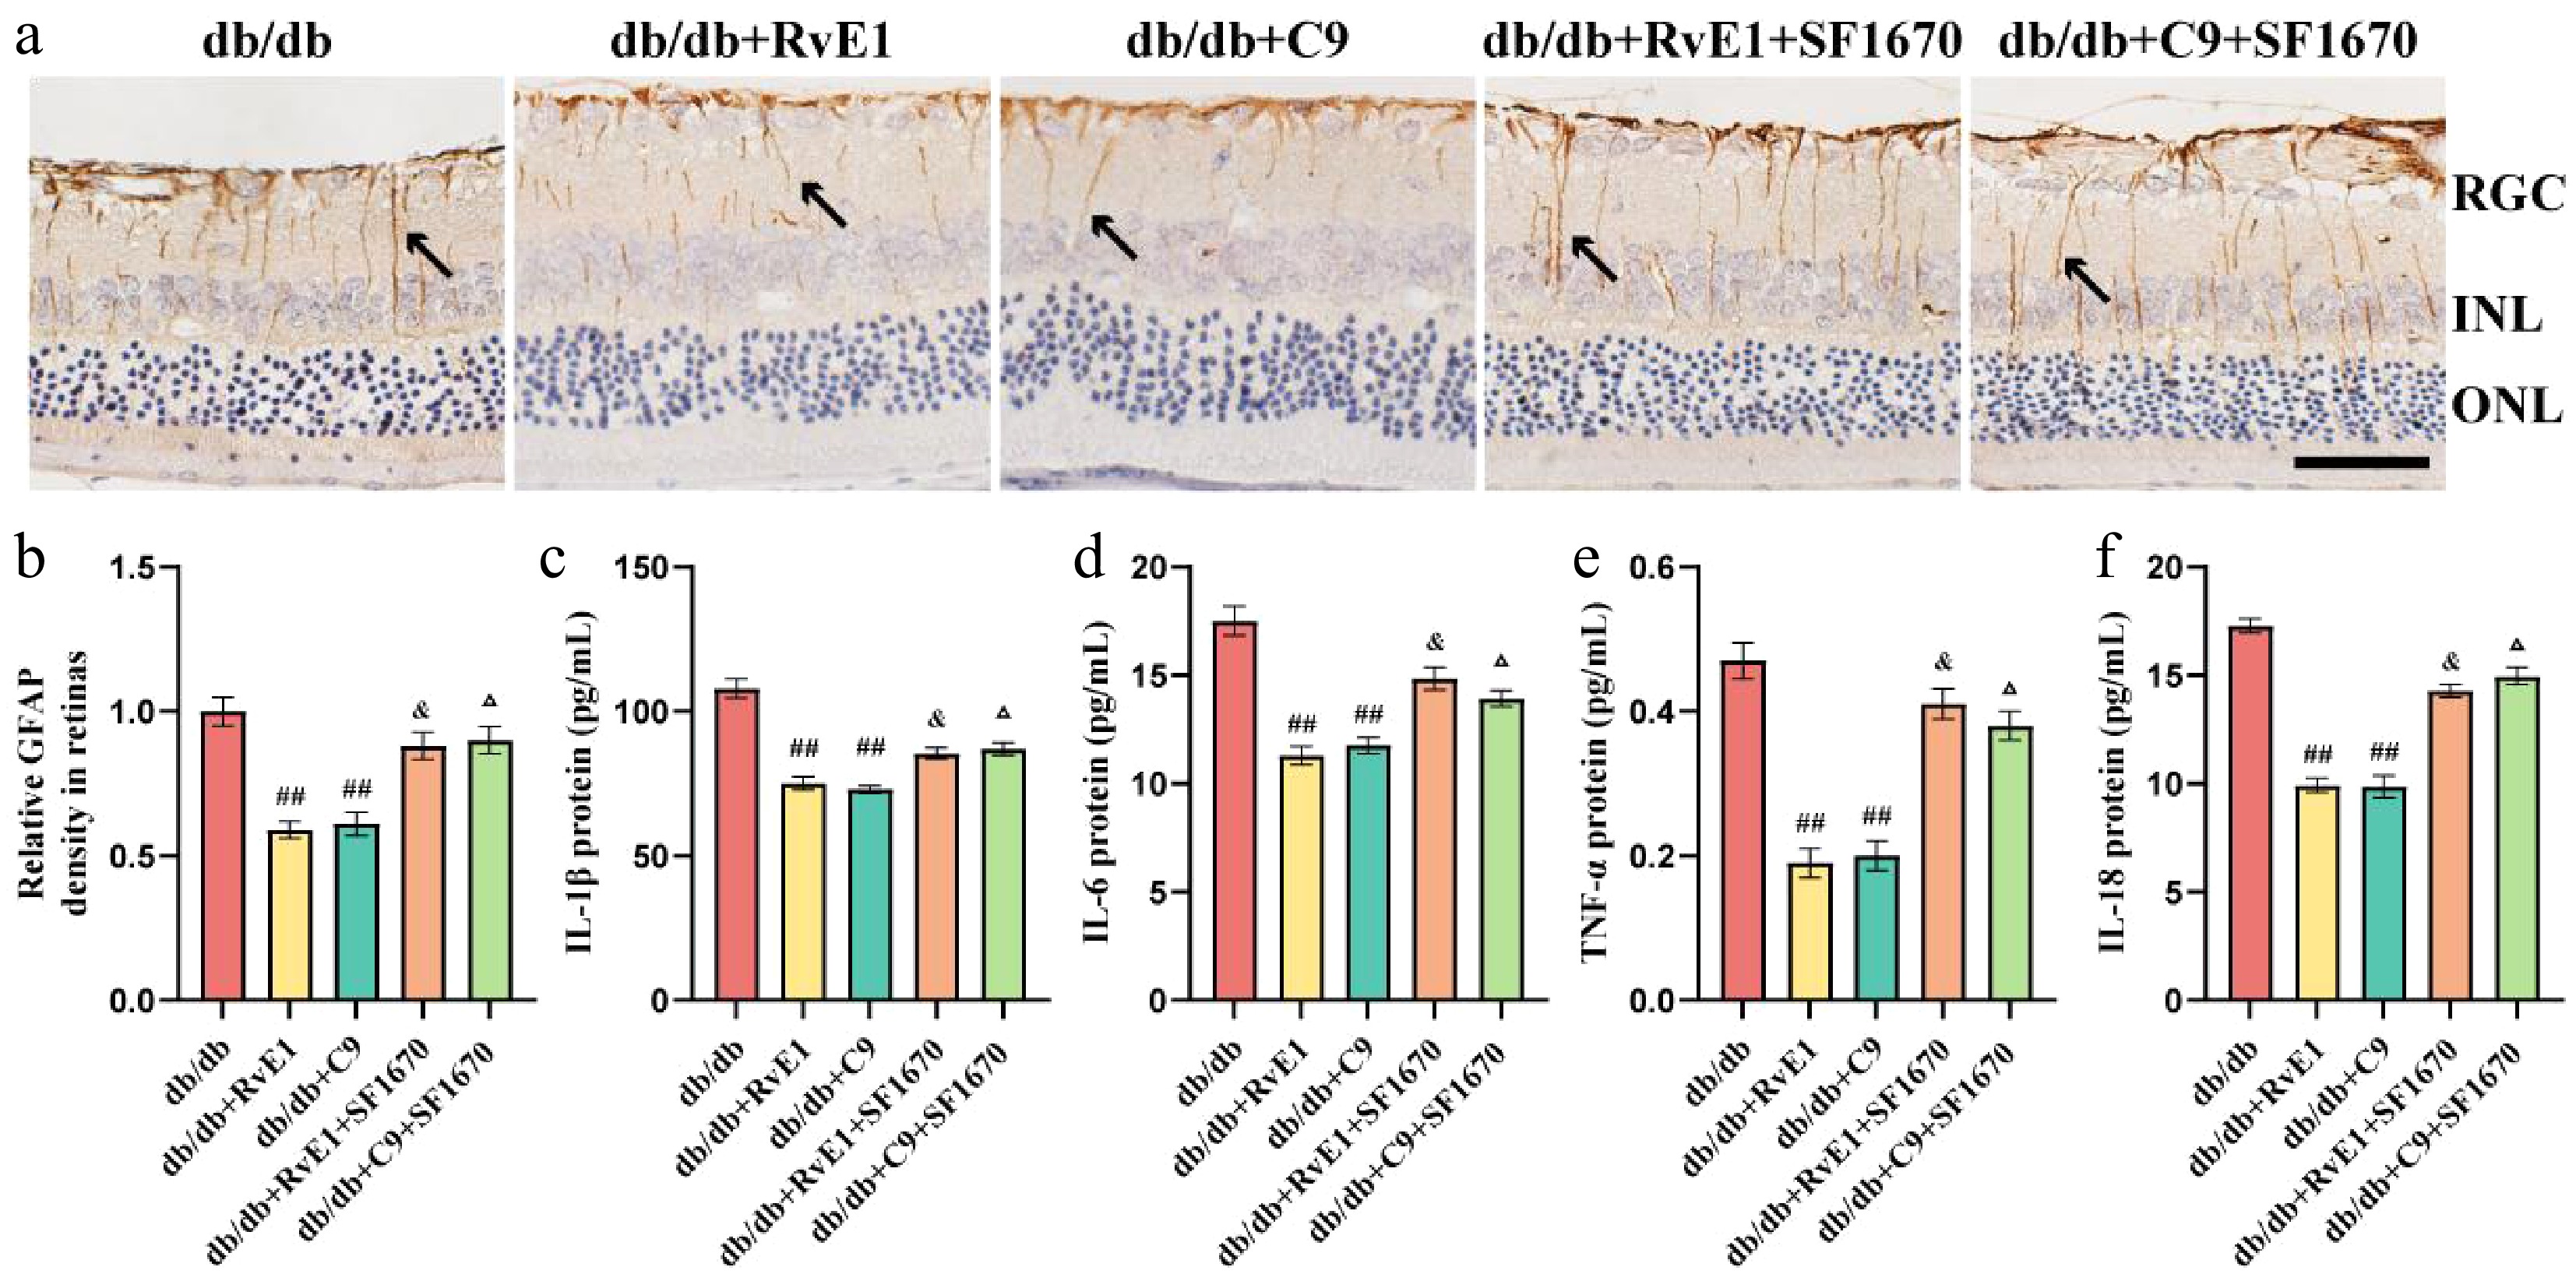
Figure 6.
ChemR23 activation may depend on its interaction with PTEN to attenuate inflammatory responses and Müller cell activation. (a) Representative immunohistochemical staining of retinal GFAP in db/db mice aged 18 weeks after intraperitoneal injection treatment with RvE1 or C9 and SF1670 for 8 weeks. The black arrow indicates positive expression of GFAP. Scale: 50 μm. For each group, n = 5. (b) Quantitative analysis of the relative density of retinal GFAP. For each group, n = 5. Data are expressed as the average value ± SEM. ## p < 0.01 vs db/db. & p < 0.05 vs db/db + RvE1. Δ p < 0.05 vs db/db + C9. (c–f) The protein levels of IL-1β, IL-6, IL-18, and TNF-α in the retina of db/db mice aged 18 weeks after intraperitoneal injection treatment with RvE1 or C9 and SF1670 for 8 weeks were detected by ELISA. For each group, n = 5. Data are expressed as the average value ± SEM. ## p < 0.01 vs db/db. & p < 0.05 vs db/db + RvE1. Δ p < 0.05 vs db/db + C9.
-
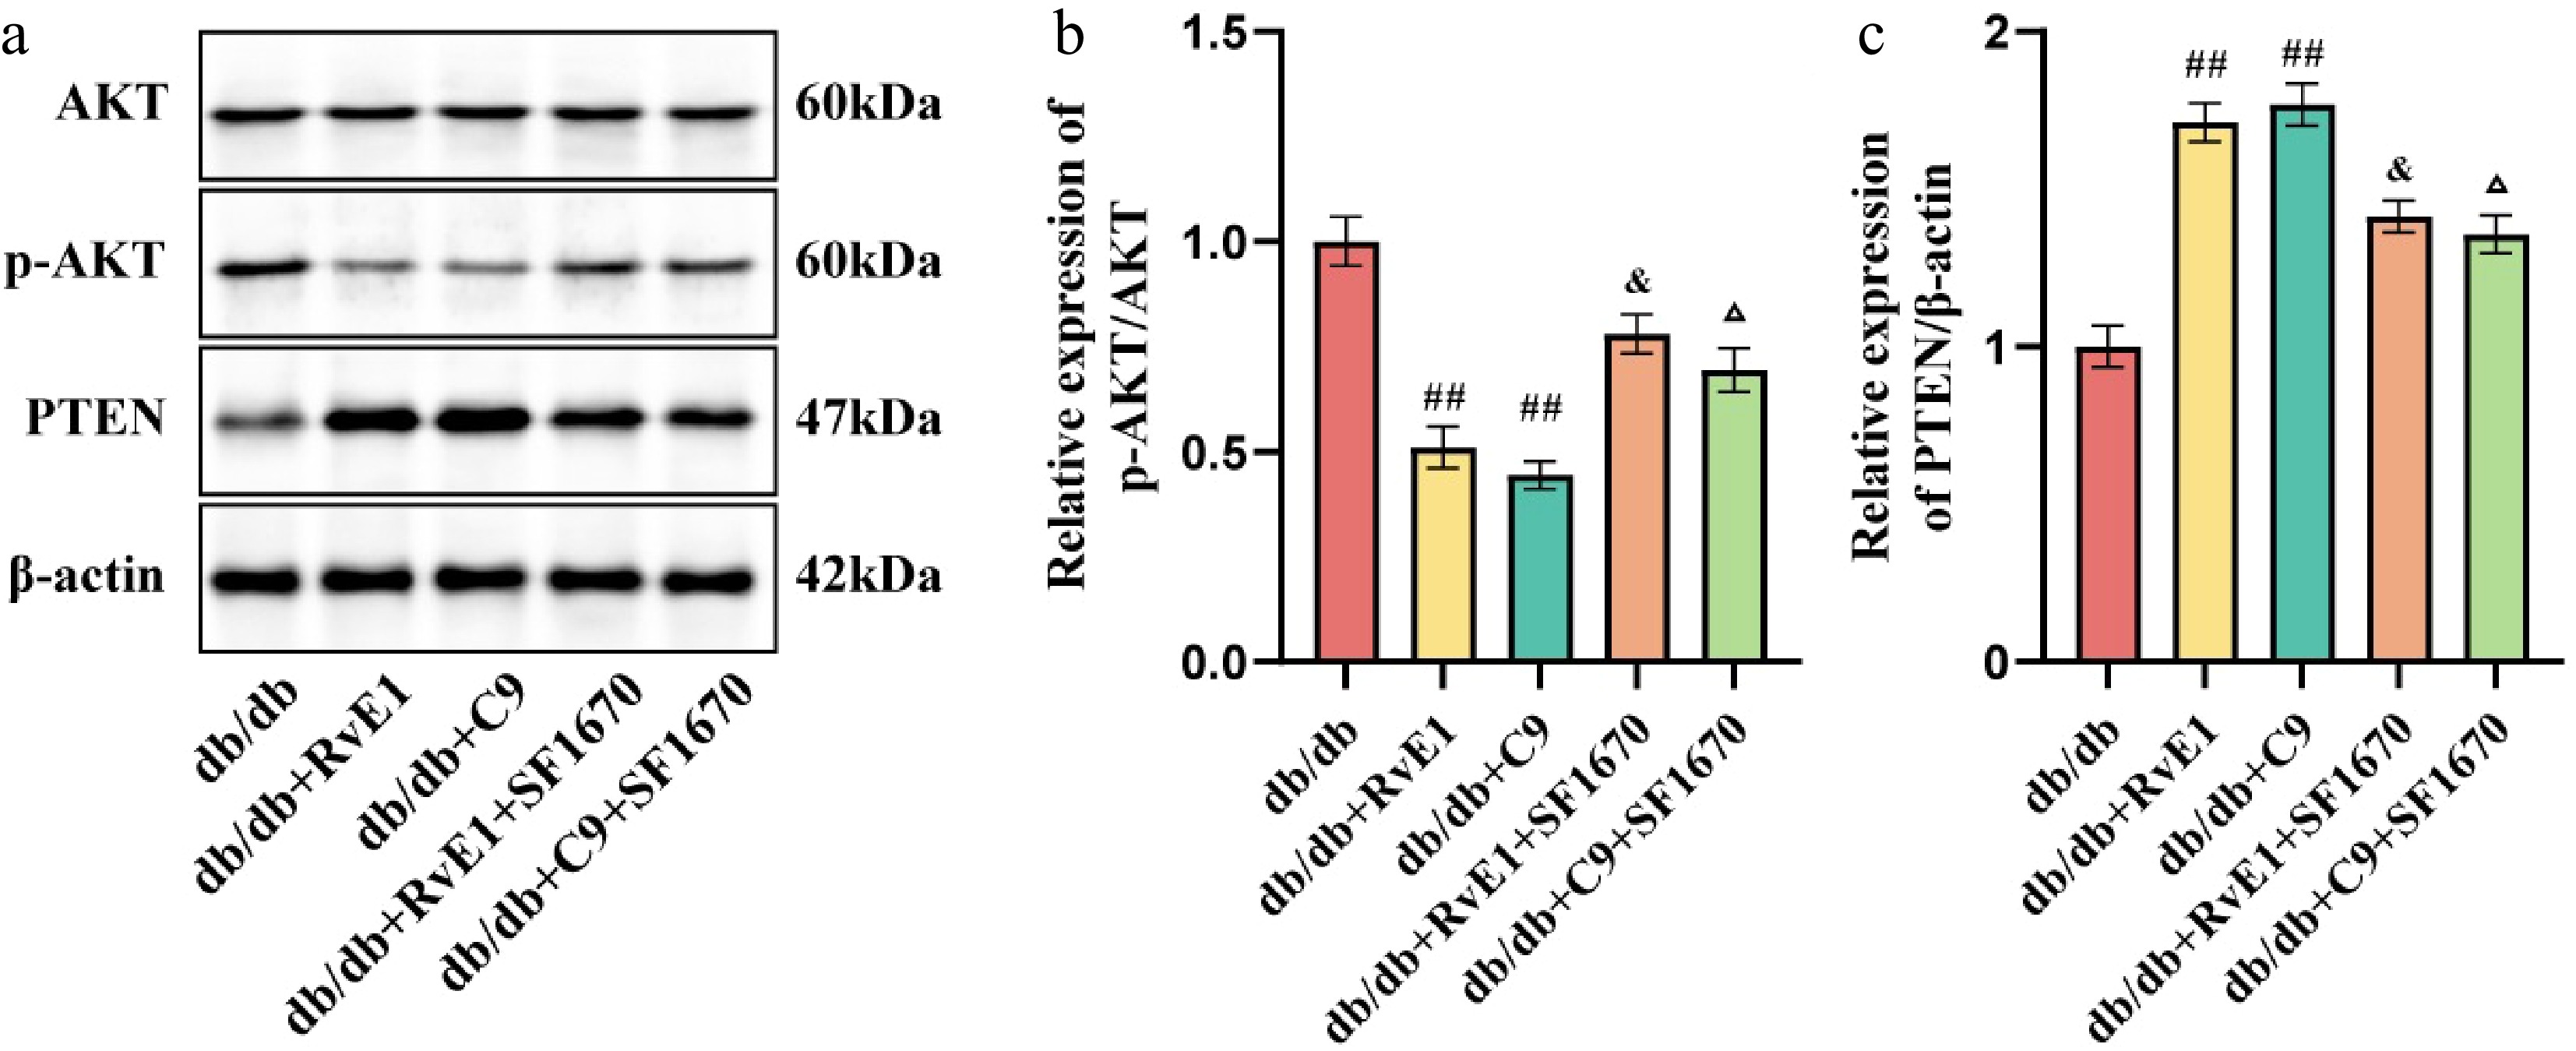
Figure 7.
ChemR23 rescues DR by activating AKT after interacting with PTEN. (a) Representative WB bands of p-AKT/AKT and PTEN/β-actin in the retina of db/db mice aged 18 weeks after intraperitoneal injection treatment with RvE1 or C9 and SF1670 for 8 weeks. (b, c) Semiquantitative analysis of p-AKT/AKT and PTEN/β-actin in the retina of db/db mice after treatment with RvE1 or C9 and SF1670. For each group, n = 4. Data are expressed as the average value ± SEM. ## p < 0.01vs db/db. & p < 0.05 vs db/db + RvE1. Δ p < 0.05 vs db/db + C9.
Figures
(7)
Tables
(0)