-
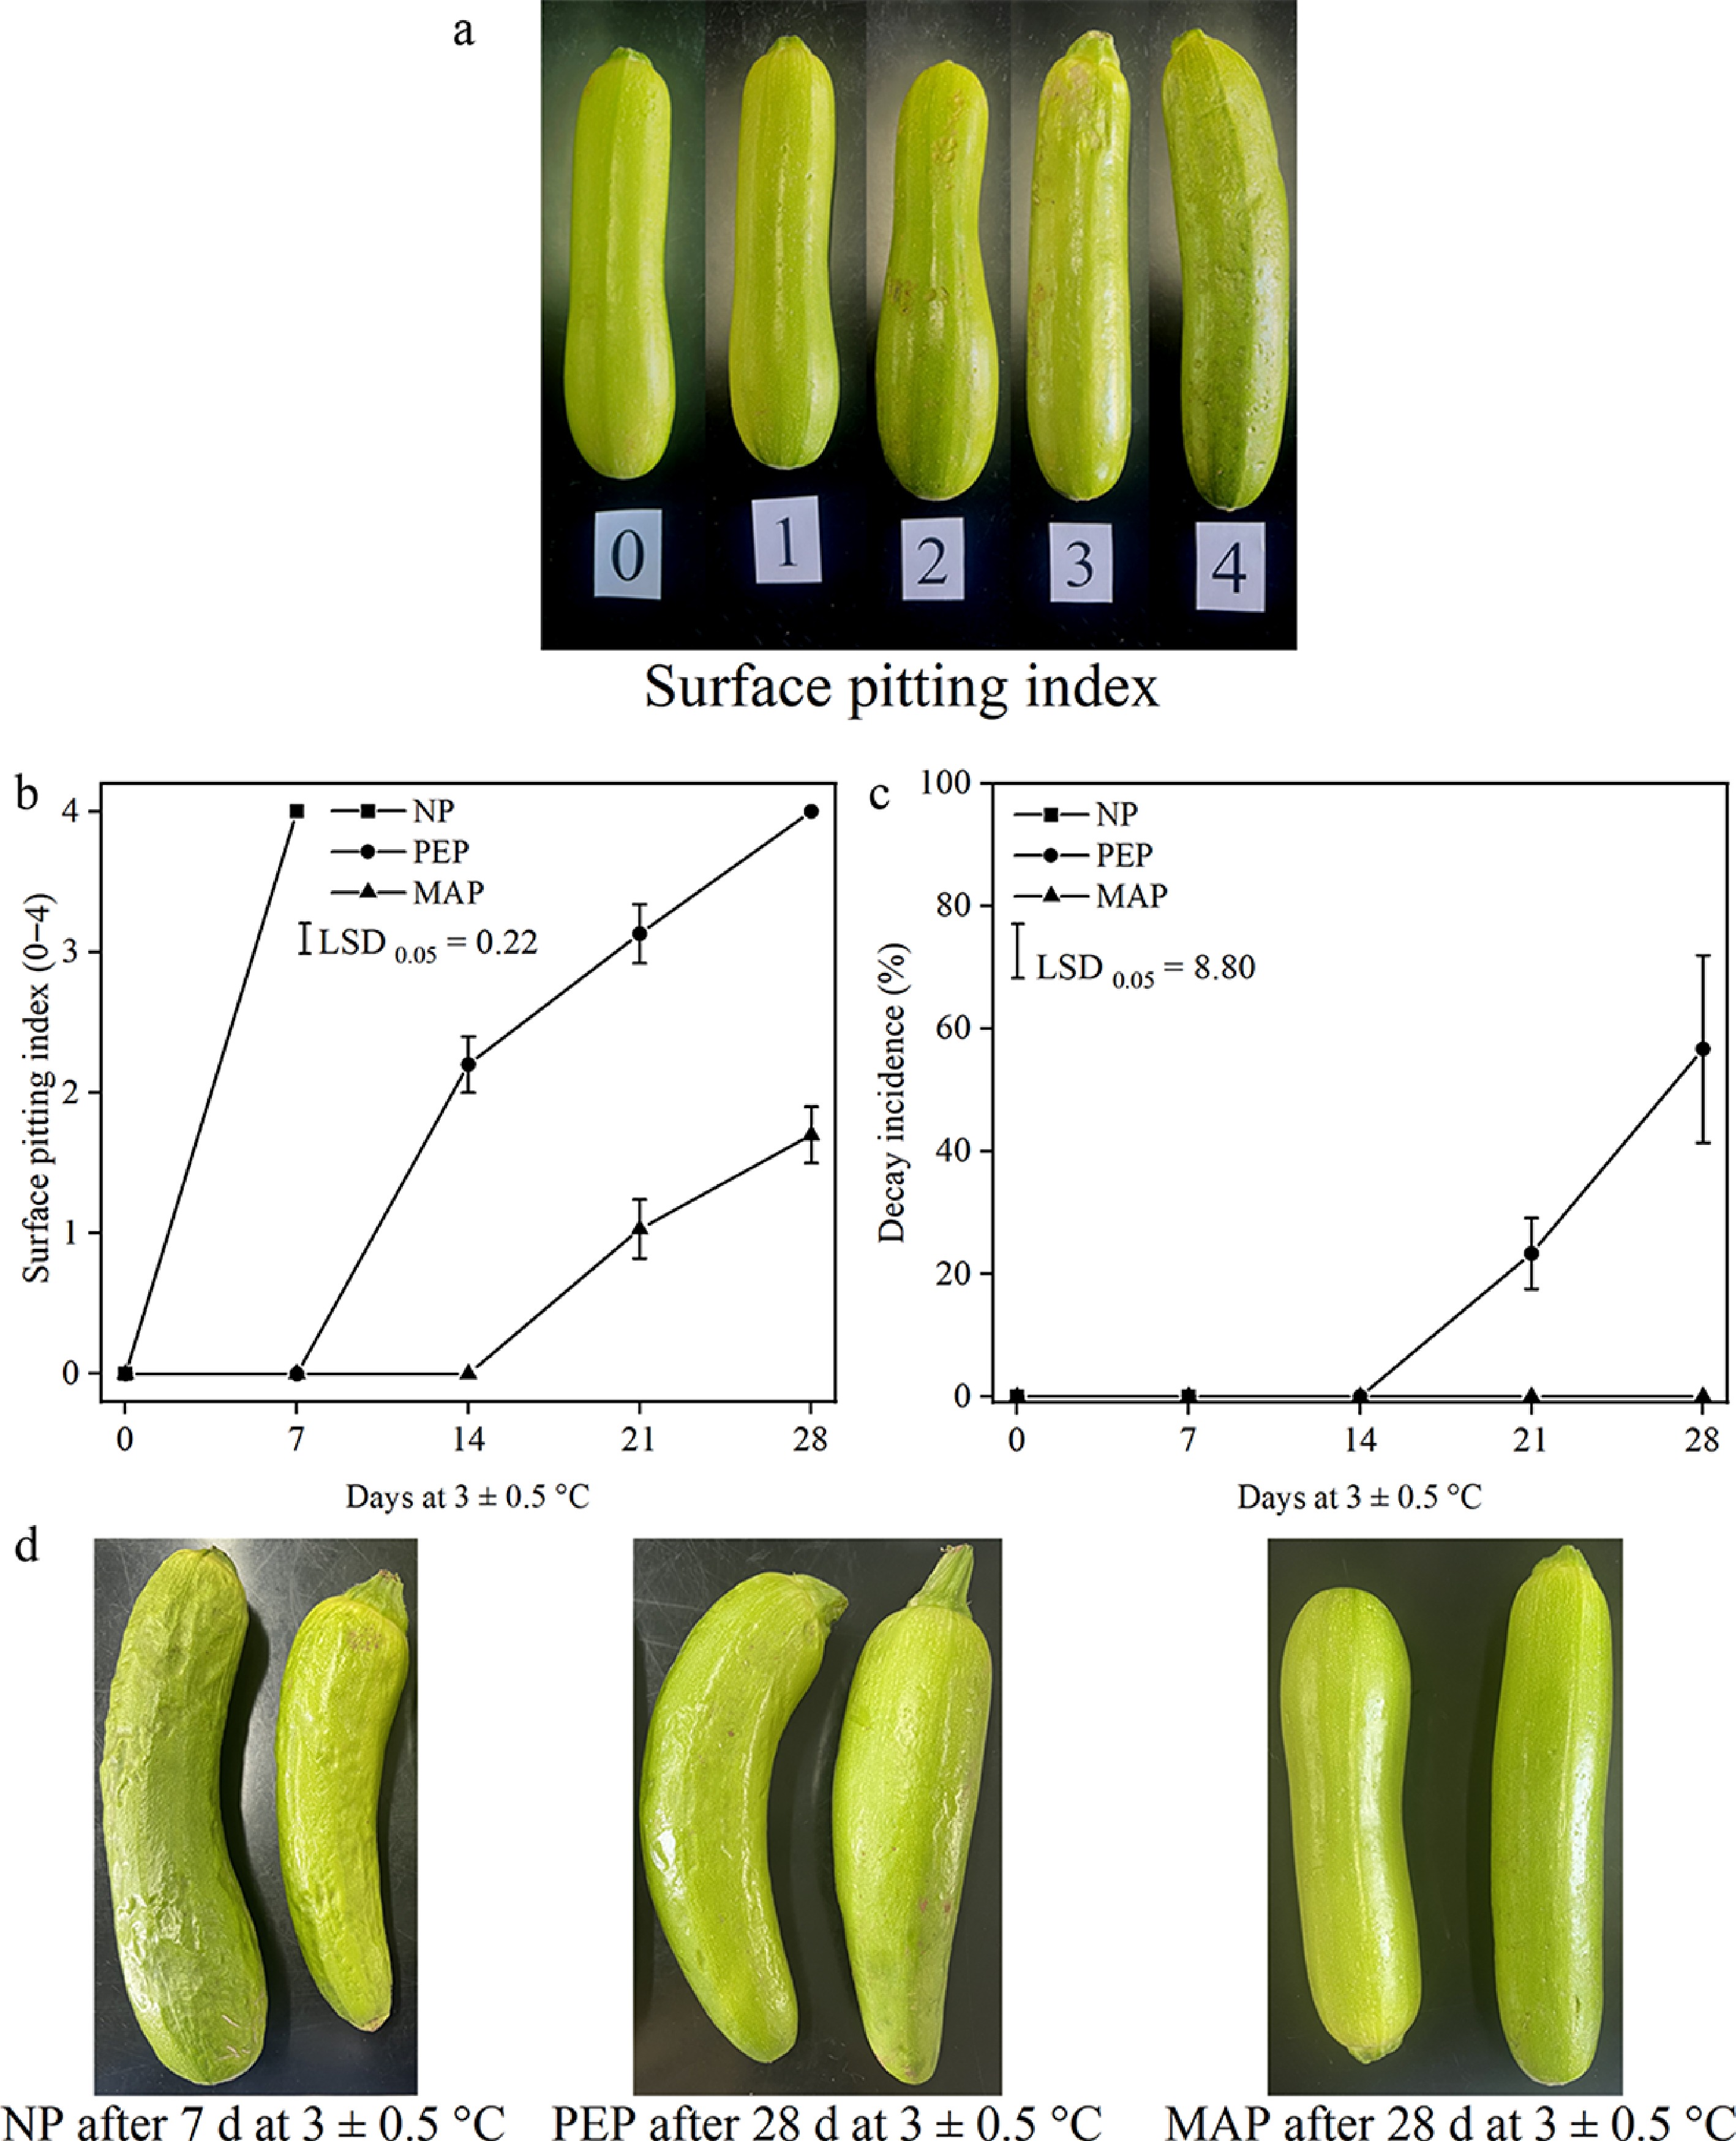
Figure 1.
(a) Zucchini fruit depicting a range in severity of chilling injury (CI)-induced surface pitting (SP). (b) SP index, and (c) decay incidence of the no packaging (NP)-, polyethylene packaging (PEP)-, and modified atmosphere packaging (MAP)-treated zucchini fruit after 7, 14, 21, and 28 d of storage at 3 ± 0.5 °C. Values are presented as the mean ± standard deviation (SD). (d) The zucchini fruit treated with NP, PEP, and MAP after 7, 28, and 28 d of storage at 3 ± 0.5 °C, respectively.
-
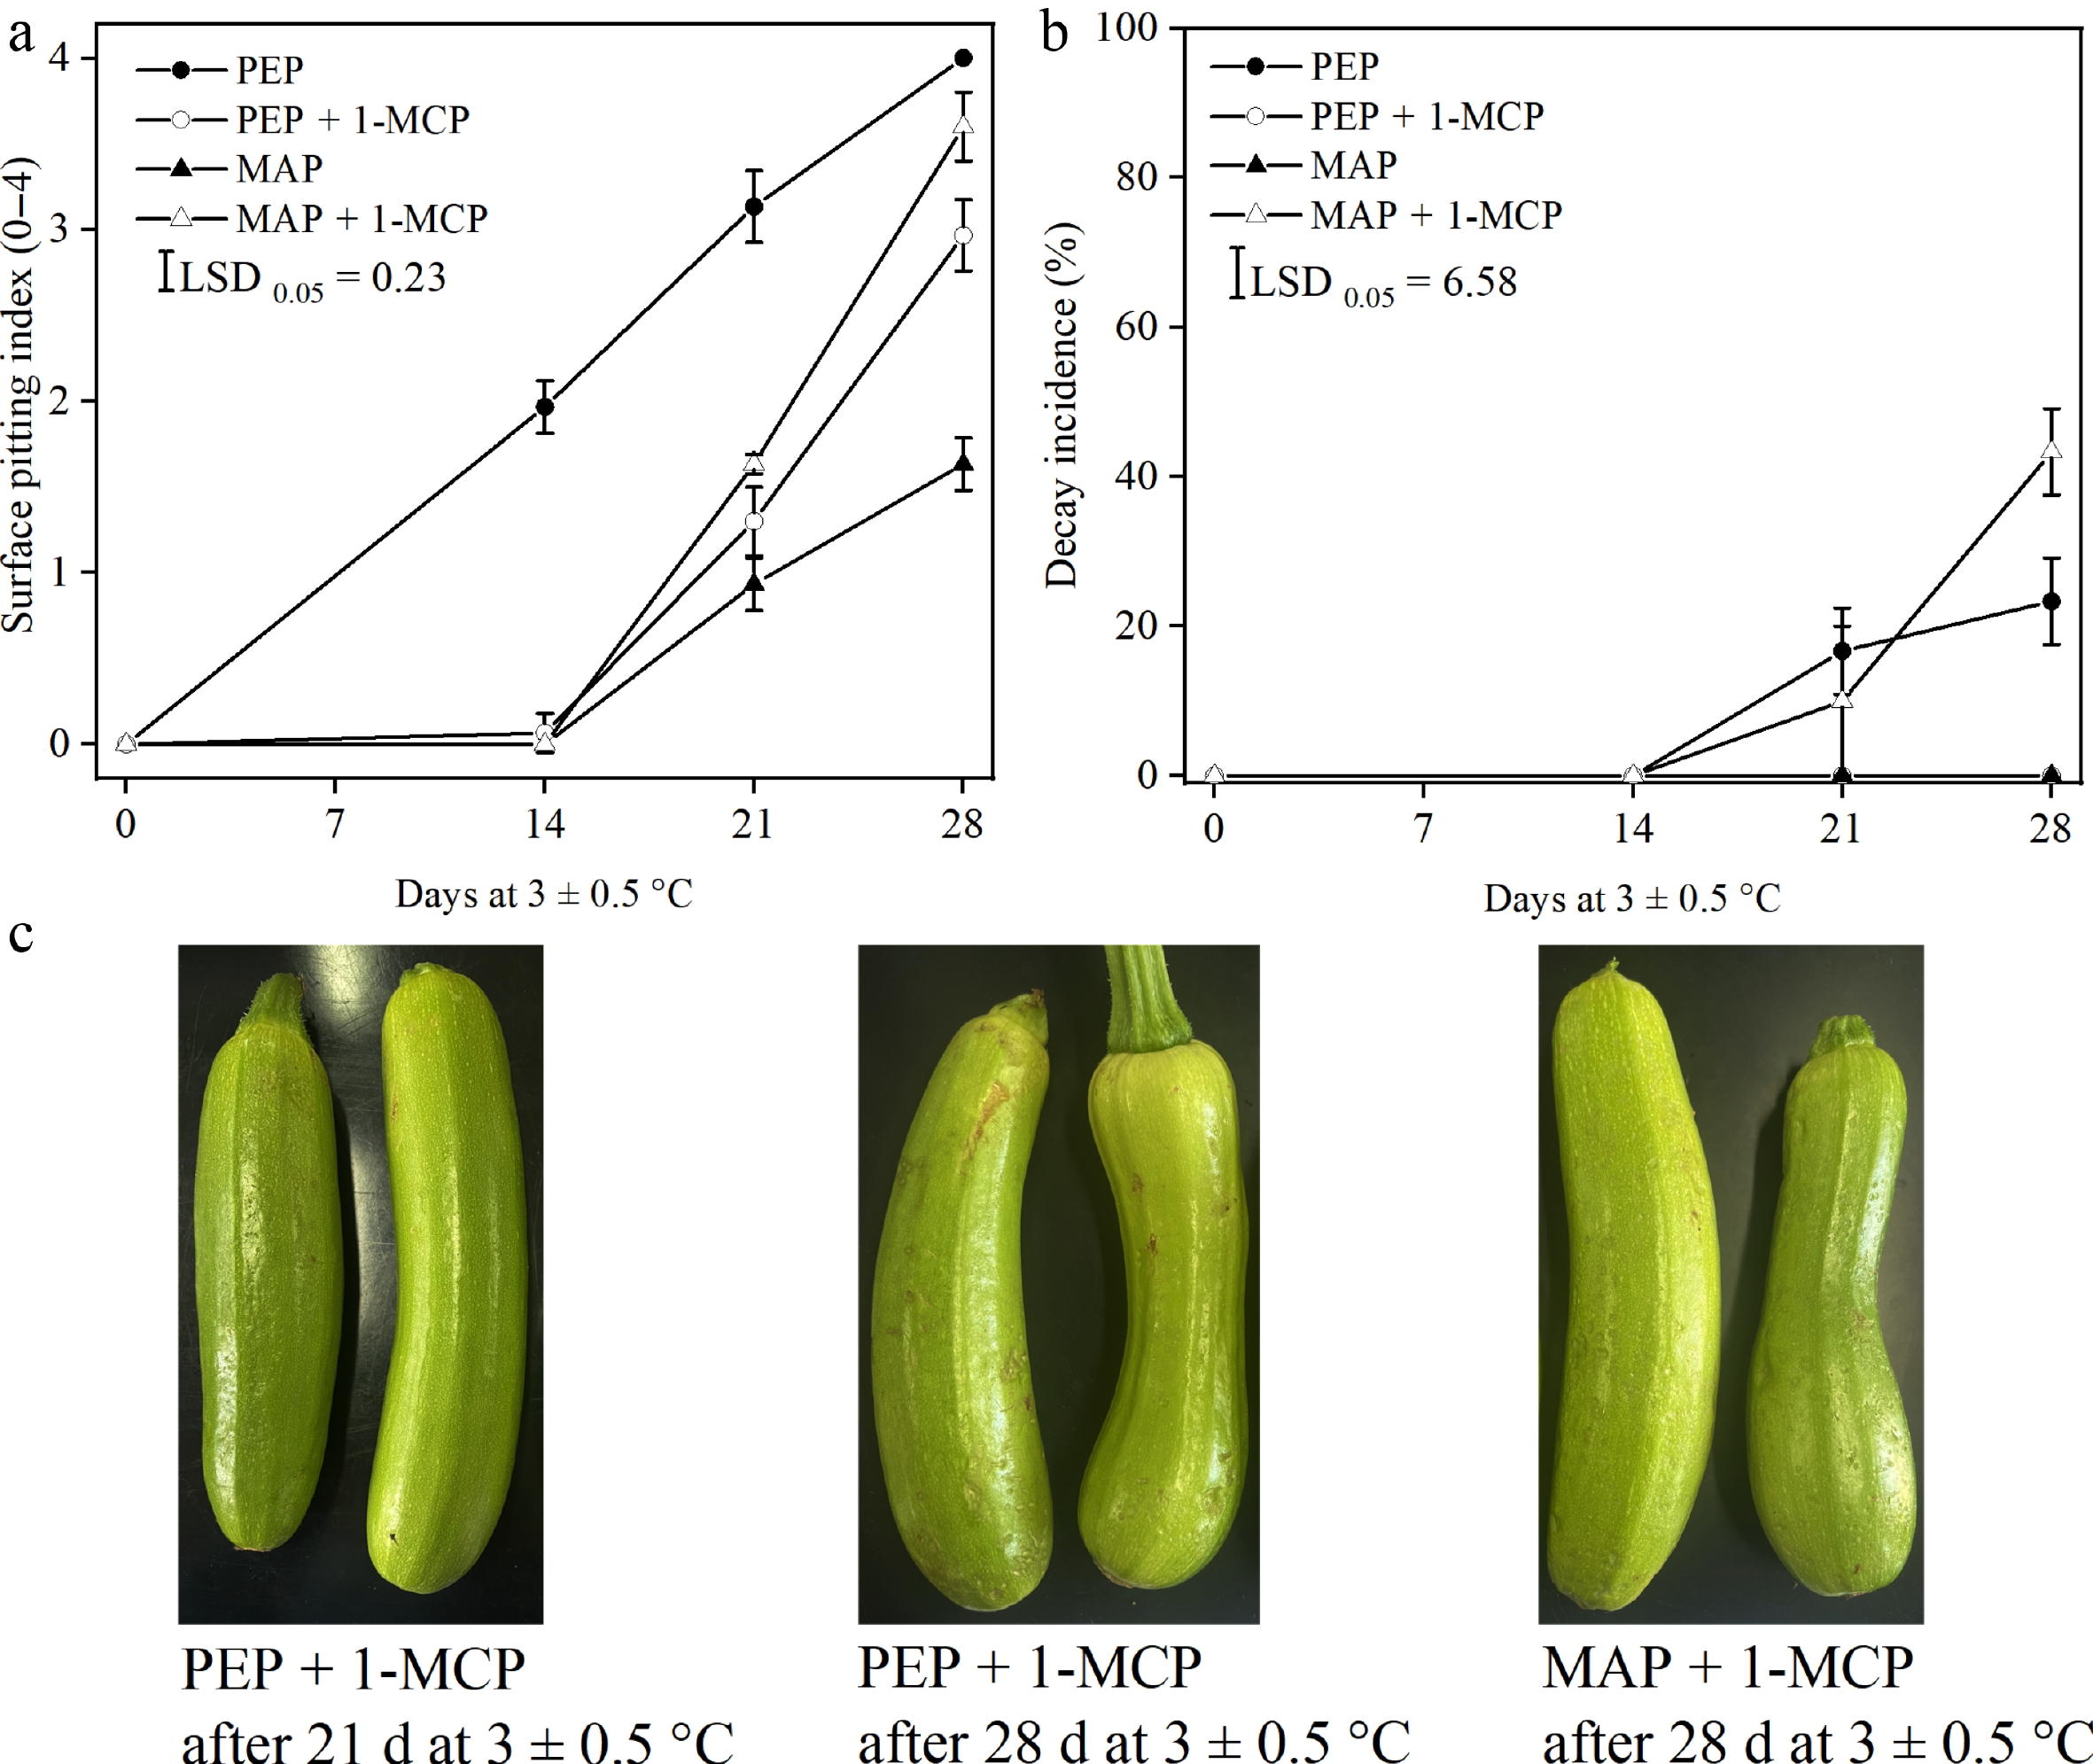
Figure 2.
(a) Surface pitting (SP) index, and (b) decay incidence of the polyethylene packaging (PEP)-, PEP + 1-methylcyclopropene (1-MCP)-, modified atmosphere packaging (MAP)-, and MAP + 1-MCP-treated zucchini fruit after 14, 21, and 28 d of storage at 3 ± 0.5 °C. Values are presented as the mean ± SD. (c) The zucchini fruit treated with PEP + 1-MCP, PEP + 1-MCP, and MAP + 1-MCP after 21, 28, and 28 d of storage at 3 ± 0.5 °C, respectively.
-
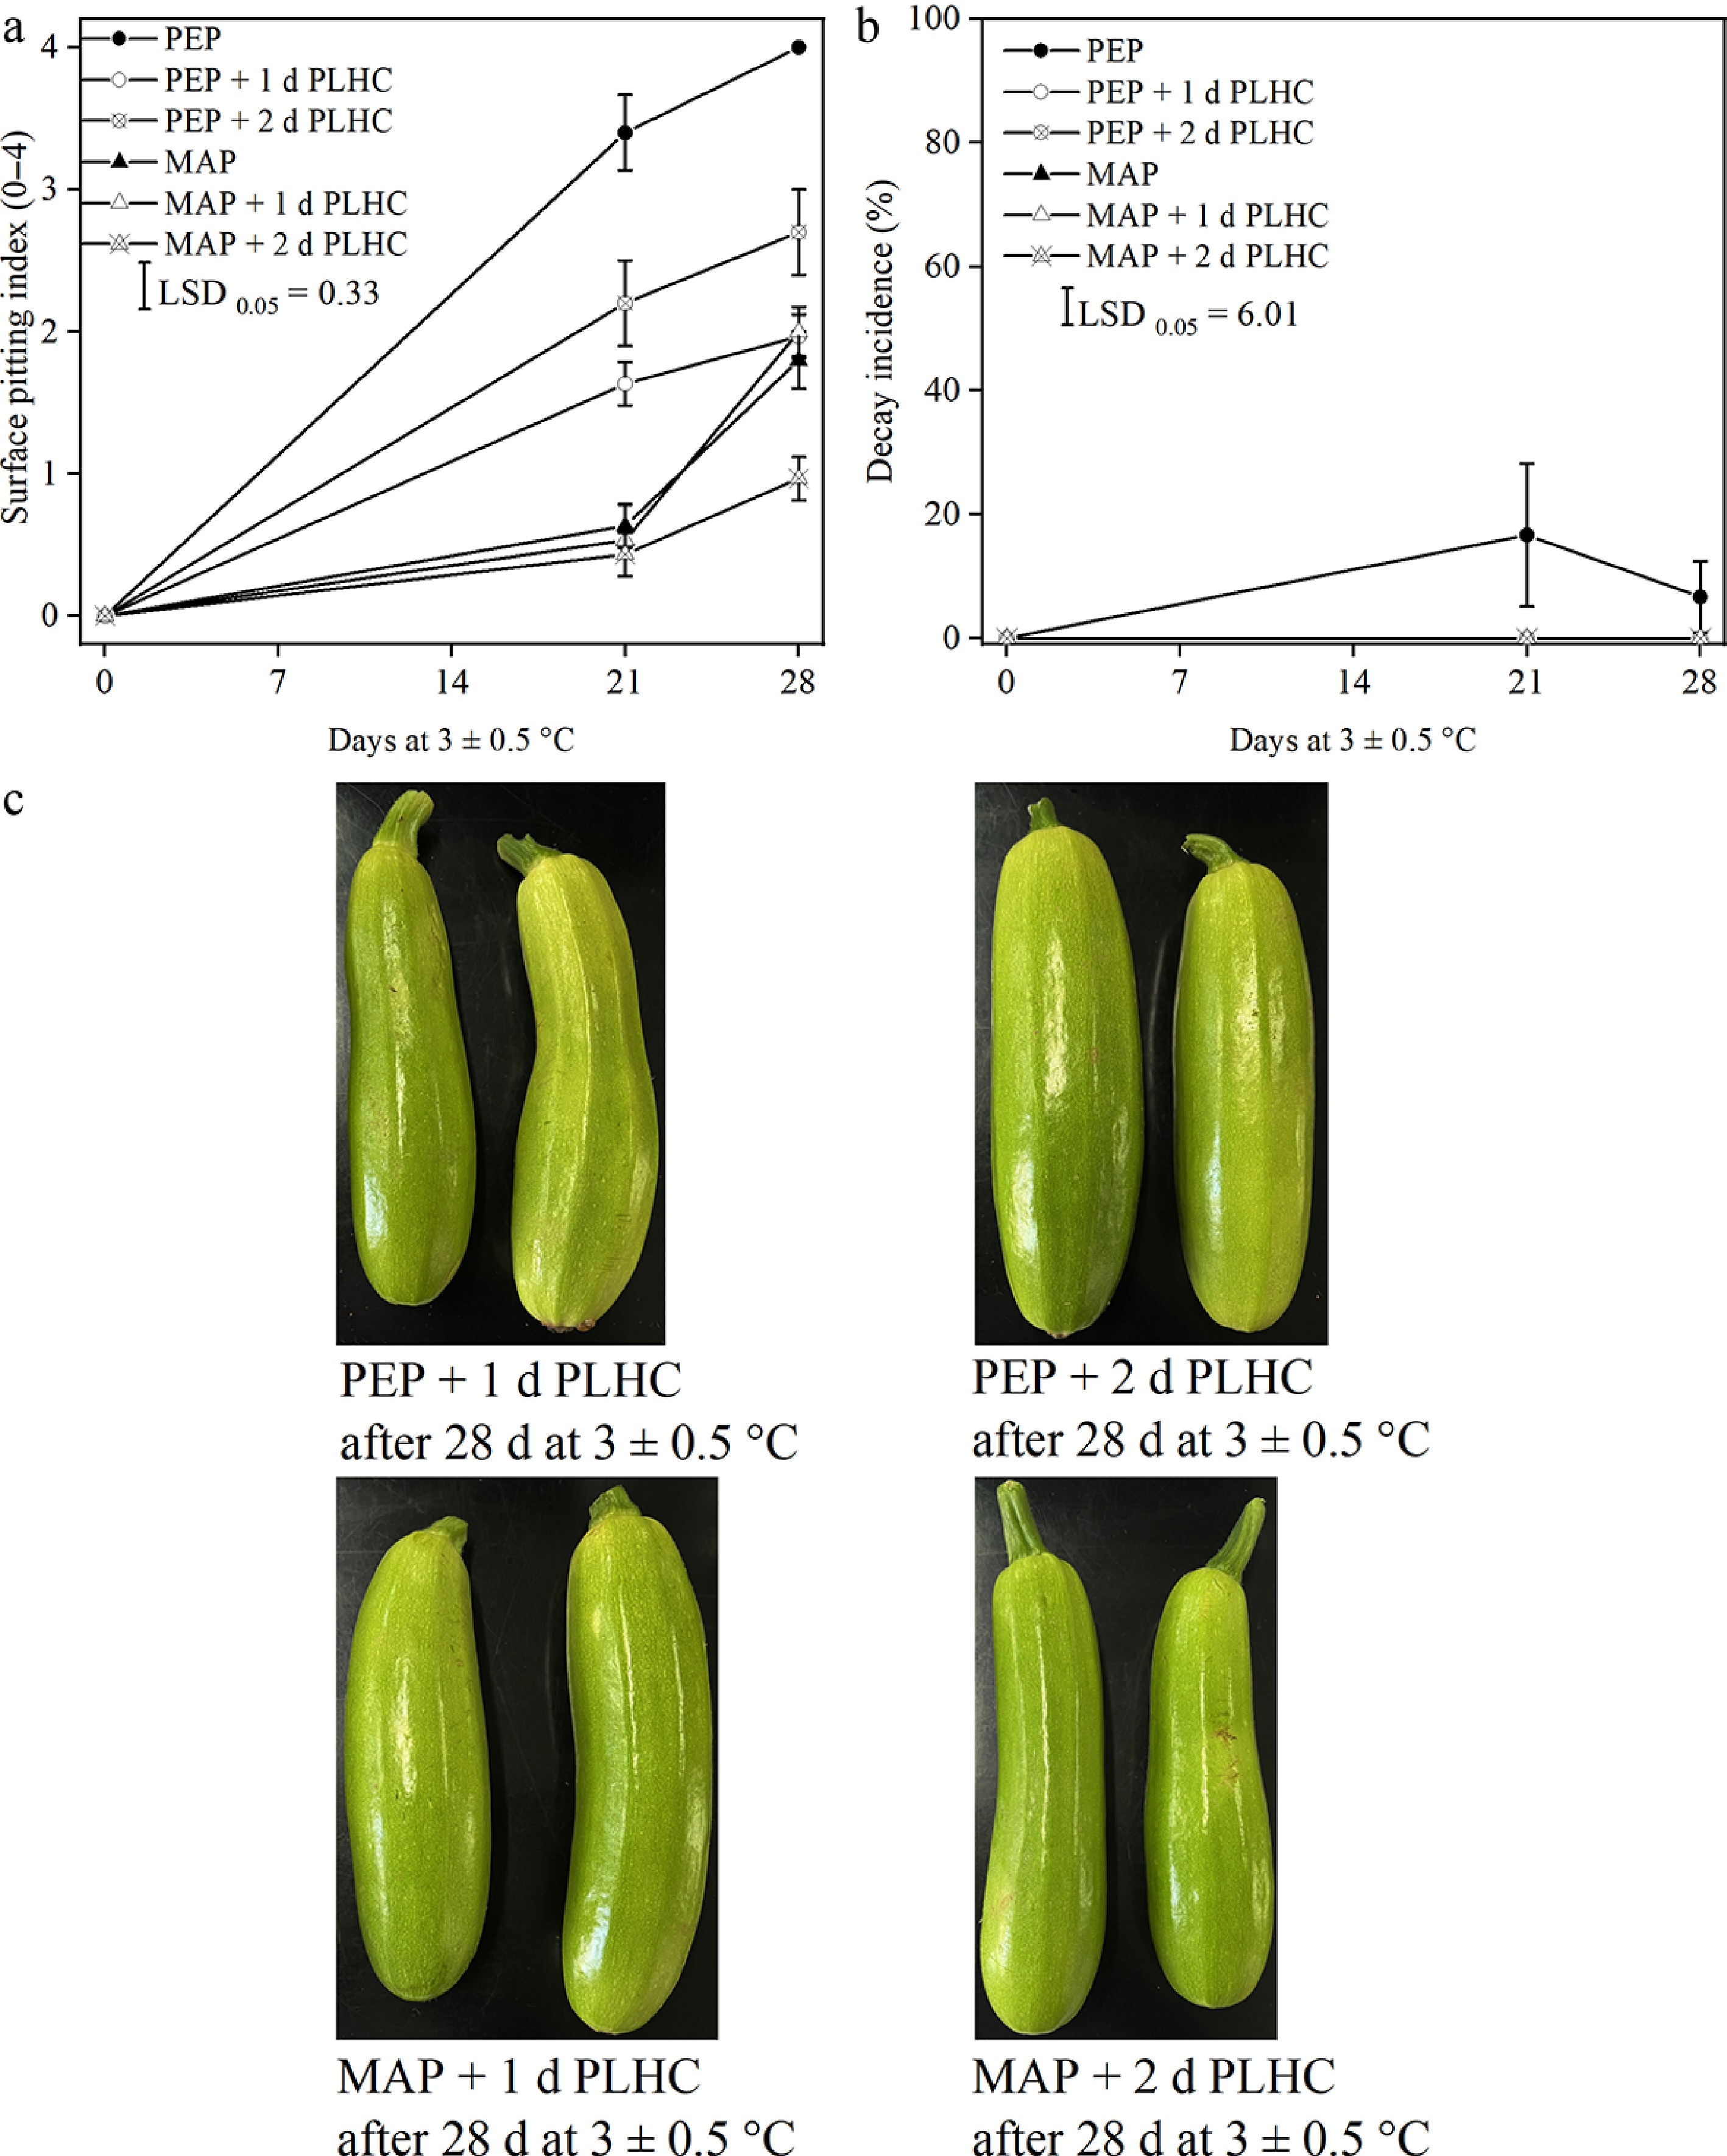
Figure 3.
(a) Surface pitting (SP) index, and (b) decay incidence of the polyethylene packaging (PEP)- and modified atmosphere packaging (MAP)-treated zucchini fruit with 1 and 2 d pre-storage low humidity conditioning (PLHC) after 21 and 28 d of storage at 3 ± 0.5 °C. Values are presented as the mean ± SD. (c) The zucchini fruit treated with PEP + 1 d PLHC, PEP + 2 d PLHC, MAP + 1 d PLHC, and MAP + 2 d PLHC after 28 d of storage at 3 ± 0.5 °C.
-
Treatment Storage time
(d)O2 concentration
(%)CO2 concentration
(%)FF
(N)Hug angle
(h)Skin lightness
(L*)WL
(%)At harvest 0 − − 44.23 ± 1.42 a 122.34 ± 0.49 abc 54.57 ± 4.75 b − NP 7 18.60 ± 0.00 a 0.00 ± 0.00 d 44.37 ± 2.26 a 122.07 ± 1.59 abc 50.20 ± 4.13 bcd 3.92 ± 0.51 c PEP 7 18.60 ± 0.00 a 0.00 ± 0.00 d 46.37 ± 3.88 a 123.81 ± 0.45 a 48.53 ± 2.15 cd 0.76 ± 0.08 e MAP 7 11.93 ± 0.35 b 4.40 ± 0.22 c 43.93 ± 2.59 a 123.53 ± 1.38 ab 51.68 ± 3.45 bcd 0.70 ± 0.05 e PEP 14 18.60 ± 0.00 a 0.00 ± 0.00 d 46.40 ± 1.35 a 122.90 ± 0.12 abc 42.24 ± 2.50 e 2.24 ± 0.23 d MAP 14 8.53 ± 0.25 c 6.46 ± 0.34 a 44.40 ± 1.01 a 123.82 ± 0.63 a 48.39 ± 2.31 cd 1.09 ± 0.12 e PEP 21 18.60 ± 0.00 a 0.00 ± 0.00 d 37.67 ± 2.20 b 121.09 ± 1.91 cd 52.01 ± 3.56 bcd 5.28 ± 0.36 b MAP 21 8.43 ± 0.45 c 6.34 ± 0.42 a 44.13 ± 4.39 a 123.38 ± 1.85 ab 47.45 ± 0.49 d 1.34 ± 0.11 e PEP 28 18.60 ± 0.00 a 0.00 ± 0.00 d 32.03 ± 1.97 c 119.52 ± 1.51 d 62.83 ± 2.51 a 7.54 ± 0.88 a MAP 28 7.57 ± 0.28 d 5.56 ± 0.25 b 44.33 ± 1.31 a 121.66 ± 0.95 bc 53.51 ± 1.93 bc 2.06 ± 0.08 d T *** *** ** * ns *** ST *** *** *** *** *** *** T × ST *** *** *** ns *** *** Values are presented as means of three replicates ± SD. Different lowercase letters indicated significant differences among means using Fisher's protected least significant difference (LSD) test at p < 0.05. T, treatment; ST, storage time; ns, no significant effect; * significant effect at the 0.05 level; ** significant effect at the 0.01 level; *** significant effect at the 0.001 level. Table 1.
Effects of no packaging (NP), polyethylene packaging (PEP), and modified atmosphere packaging (MAP) on gas components (O2 and CO2 concentrations) in bags and quality attributes (fruit firmness [FF], hug angle, skin lightness, and weight loss [WL]) of zucchini fruit at harvest and after storage at 3 ± 0.5 °C (Experiment 1).
-
Treatment Storage time
(d)MDA
(μmol kg−1)O2·−
(mg kg−1)H2O2
(mg kg−1)POD
(U kg−1)CAT
(U kg−1)AsA
(mg kg−1)GSH
(mg kg−1)At harvest 0 3.72 ± 0.15 e 0.85 ± 0.11 ef 8.69 ± 0.40 f 54.60 ± 2.40 ef 11.73 ± 1.40 bcd 152.57 ± 6.99 a 10.50 ± 0.70 a NP 7 32.93 ± 1.18 a 2.39 ± 0.14 a 16.28 ± 1.58 a 24.73 ± 2.69 g 13.07 ± 1.51 ab 36.77 ± 3.89 f 2.57 ± 0.74 f PEP 7 4.71 ± 0.49 e 0.72 ± 0.03 f 10.52 ± 0.50 d 64.27 ± 1.33 de 6.93 ± 1.17 e 133.00 ± 3.08 b 9.17 ± 0.31 b MAP 7 3.82 ± 0.32 e 0.87 ± 0.08 ef 9.06 ± 0.34 ef 47.27 ± 2.53 f 5.00 ± 0.87 f 149.07 ± 3.50 a 10.40 ± 0.44 a PEP 14 7.12 ± 0.44 d 1.18 ± 0.14 d 11.80 ± 0.76 c 166.47 ± 9.22 a 13.87 ± 0.70 a 109.83 ± 6.31 c 8.00 ± 0.66 c MAP 14 6.50 ± 0.56 d 0.94 ± 0.05 e 10.25 ± 0.28 de 109.93 ± 11.42 c 10.07 ± 0.99 d 133.93 ± 4.41 b 9.47 ± 0.25 b PEP 21 10.55 ± 0.83 c 1.58 ± 0.09 c 13.01 ± 0.44 b 119.97 ± 5.60 c 10.17 ± 1.47 cd 86.27 ± 3.42 d 6.50 ± 0.53 d MAP 21 7.02 ± 0.17 d 1.12 ± 0.07 d 10.59 ± 0.57 d 118.70 ± 8.75 c 12.00 ± 1.44 abc 126.80 ± 3.42 b 8.80 ± 0.40 bc PEP 28 14.84 ± 1.27 b 1.80 ± 0.08 b 16.20 ± 0.70 a 71.67 ± 8.30 d 6.27 ± 0.31 ef 78.13 ± 3.71 e 4.80 ± 0.26 e MAP 28 7.68 ± 1.01 d 1.14 ± 0.09 d 11.83 ± 0.57 bc 137.47 ± 5.75 b 7.23 ± 0.40 e 113.77 ± 2.18 c 6.73 ± 0.47 d T *** *** *** *** *** *** *** ST *** *** *** *** *** *** *** T × ST *** *** ** *** *** *** ns Values are presented as means of three replicates ± SD. Different lowercase letters indicated significant differences among means using Fisher's protected LSD test at p < 0.05. T, treatment; ST, storage time. ns, no significant effect; * significant effect at the 0.05 level; ** significant effect at the 0.01 level; *** significant effect at the 0.001 level. Table 2.
Effects of no packaging (NP), polyethylene packaging (PEP), and modified atmosphere packaging (MAP) on malondialdehyde (MDA) content, reactive oxygen species (superoxide anion [O2·−] and hydrogen peroxide [H2O2]), antioxidant enzymes (peroxidase [POD] and catalase [CAT]), and antioxidants (ascorbic acid [AsA] and glutathione [GSH]) of zucchini fruit at harvest and after storage at 3 ± 0.5 °C(Experiment 1).
-
Treatment Storage time
(d)O2 concentration
(%)CO2 concentration
(%)FF
(N)Hug angle
(h)Skin lightness
(L*)WL
(%)At harvest 0 − − 49.27 ± 3.73 a 123.14 ± 0.36 ab 51.63 ± 3.58 bc − PEP 14 18.60 ± 0.00 a 0.00 ± 0.00 f 46.83 ± 0.61 abc 120.84 ± 1.51 cd 49.83 ± 1.57 c 1.93 ± 0.18 e PEP + 1-MCP 14 18.60 ± 0.00 a 0.00 ± 0.00 f 47.93 ± 2.78 ab 122.39 ± 1.20 abcd 49.88 ± 2.17 c 0.85 ± 0.07 h MAP 14 8.97 ± 0.27 c 5.77 ± 0.24 e 43.87 ± 3.07 bcde 123.62 ± 0.49 a 51.75 ± 3.64 bc 0.79 ± 0.10 h MAP + 1-MCP 14 7.65 ± 0.14 d 6.12 ± 0.13 cd 41.80 ± 3.12 de 121.16 ± 1.48 bcd 51.79 ± 2.54 bc 0.76 ± 0.06 h PEP 21 18.60 ± 0.00 a 0.00 ± 0.00 f 46.27 ± 5.42 abcd 118.32 ± 0.77 ef 55.90 ± 3.00 b 3.95 ± 0.16 b PEP + 1-MCP 21 18.60 ± 0.00 a 0.00 ± 0.00 f 49.80 ± 2.41 a 121.44 ± 2.18 abcd 50.07 ± 2.35 c 1.46 ± 0.11 fg MAP 21 9.01 ± 0.18 bc 5.98 ± 0.21 d 43.97 ± 1.68 bcde 123.04 ± 1.11 abc 51.27 ± 2.53 bc 1.23 ± 0.14 g MAP + 1-MCP 21 6.57 ± 0.36 e 8.30 ± 0.14 b 34.00 ± 0.87 f 120.52 ± 1.04 de 53.38 ± 1.86 bc 1.59 ± 0.09 f PEP 28 18.60 ± 0.00 a 0.00 ± 0.00 f 41.60 ± 2.19 e 117.09 ± 2.24 f 61.47 ± 2.20 a 6.34 ± 0.35 a PEP + 1-MCP 28 18.60 ± 0.00 a 0.00 ± 0.00 f 42.70 ± 0.10 cde 120.72 ± 1.36 d 50.00 ± 4.07 c 2.42 ± 0.23 c MAP 28 9.28 ± 0.13 b 6.20 ± 0.13 c 43.67 ± 1.70 bcde 123.31 ± 1.51 ab 51.95 ± 5.14 bc 2.01 ± 0.10 de MAP + 1-MCP 28 4.49 ± 0.18 f 9.50 ± 0.12 a 27.67 ± 3.34 g 120.36 ± 0.92 de 54.15 ± 0.98 bc 2.26 ± 0.11 cd T *** *** *** *** ** *** ST *** *** *** * * *** T × ST *** *** ** ns * *** Values are presented as means of three replicates ± SD. Different lowercase letters indicated significant differences among means using Fisher's protected LSD test at p < 0.05. T, treatment; ST, storage time. ns, no significant effect; * significant effect at the 0.05 level; ** significant effect at the 0.01 level; *** significant effect at the 0.001 level. Table 3.
Effect of postharvest 1-methylcyclopropene (1-MCP) on gas components (O2 and CO2 concentrations) in bags and quality attributes (fruit firmness [FF], hug angle, skin lightness, and weight loss [WL]) of the polyethylene packaging (PEP)- and modified atmosphere packaging (MAP)-treated zucchini fruit at harvest and after storage at 3 ± 0.5 °C (Experiment 2).
-
Treatment Storage time
(d)MDA
(μmol kg−1)O2·−
(mg kg−1)H2O2
(mg kg−1)POD
(U kg−1)CAT
(U kg−1)AsA
(mg kg−1)GSH
(mg kg−1)At harvest 0 4.04 ± 0.14 h 0.82 ± 0.04 g 7.95 ± 0.14 g 58.37 ± 1.92 e 12.17 ± 1.31 c 165.30 ± 6.19 a 11.37 ± 0.57 a PEP 14 8.02 ± 0.17 d 1.04 ± 0.07 de 10.00 ± 0.37 de 160.83 ± 3.42 a 14.17 ± 0.77 a 117.60 ± 2.35 d 8.40 ± 0.17 d PEP + 1-MCP 14 5.53 ± 0.40 fg 0.90 ± 0.03 f 8.88 ± 0.16 f 115.57 ± 11.22 c 12.72 ± 0.94 bc 151.13 ± 4.80 b 9.67 ± 0.29 bc MAP 14 5.35 ± 0.42 g 0.83 ± 0.05 fg 8.84 ± 0.26 f 117.03 ± 3.87 c 10.84 ± 0.99 d 154.90 ± 3.77 b 9.90 ± 0.36 b MAP + 1-MCP 14 6.55 ± 0.29 ef 1.00 ± 0.05 e 9.02 ± 0.14 f 134.03 ± 9.91 b 14.37 ± 1.03 a 150.93 ± 7.41 b 9.73 ± 0.25 b PEP 21 11.38 ± 0.59 b 1.42 ± 0.03 b 12.20 ± 0.44 c 132.17 ± 2.84 b 9.39 ± 0.36 e 90.73 ± 1.71 f 7.00 ± 0.20 e PEP + 1-MCP 21 6.74 ± 0.35 e 1.09 ± 0.06 d 9.40 ± 0.56 ef 165.93 ± 19.04 a 11.90 ± 0.18 cd 139.73 ± 5.50 c 8.10 ± 0.36 d MAP 21 5.92 ± 0.37 efg 1.07 ± 0.03 de 9.04 ± 0.27 f 123.57 ± 5.94 bc 13.74 ± 0.60 ab 152.70 ± 3.40 b 9.17 ± 0.35 c MAP + 1-MCP 21 8.40 ± 0.47 d 1.26 ± 0.06 c 11.84 ± 0.49 c 132.30 ± 9.36 b 9.04 ± 0.18 e 109.50 ± 6.94 e 8.30 ± 0.26 d PEP 28 17.60 ± 0.73 a 1.68 ± 0.04 a 15.16 ± 0.56 a 83.43 ± 4.72 d 5.29 ± 0.30 fg 80.47 ± 1.85 g 5.50 ± 0.20 g PEP + 1-MCP 28 7.55 ± 0.46 b 1.23 ± 0.06 c 12.01 ± 0.81 c 85.67 ± 3.87 d 6.43 ± 0.58 f 114.23 ± 5.75 de 6.43 ± 0.40 f MAP 28 6.77 ± 0.33 e 1.03 ± 0.05 de 10.27 ± 0.25 d 154.43 ± 7.24 a 8.54 ± 0.53 e 133.87 ± 1.71 c 7.03 ± 0.15 e MAP + 1-MCP 28 9.70 ± 1.51 c 1.60 ± 0.03 a 13.83 ± 0.63 b 48.07 ± 8.33 e 4.74 ± 0.35 g 86.17 ± 3.97 fg 5.20 ± 0.30 g T *** *** *** *** *** *** *** ST *** *** *** *** *** *** *** T × ST *** *** *** *** *** *** *** Values are presented as means of three replicates ± SD. Different lowercase letters indicated significant differences among means using Fisher's protected LSD test at p < 0.05. T, treatment; ST, storage time. ns, no significant effect; * significant effect at the 0.05 level; ** significant effect at the 0.01 level; *** significant effect at the 0.001 level. Table 4.
Effect of postharvest 1-methylcyclopropene (1-MCP) on malondialdehyde (MDA) content, reactive oxygen species (superoxide anion [O2·−] and hydrogen peroxide [H2O2]), and antioxidant enzymes (peroxidase [POD] and catalase [CAT]), and antioxidants (ascorbic acid [AsA] and glutathione [GSH]) of polyethylene packaging (PEP)- and modified atmosphere packaging (MAP)-treated zucchini fruit at harvest and after storage at 3 ± 0.5 °C (Experiment 2).
-
Treatment Storage time
(d)O2 concentration
(%)CO2 concentration
(%)FF
(N)Hug angle
(h)Skin lightness
(L*)WL
(%)At harvest 0 − − 49.03 ± 5.72 a 122.97 ± 0.77 a 48.71 ± 2.54 e − PEP 21 18.60 ± 0.00 a 0.00 ± 0.00 f 32.80 ± 2.45 ef 120.15 ± 0.91 c 55.69 ± 1.89 c 3.87 ± 0.24 b PEP + 1 d PLHC 21 18.60 ± 0.00 a 0.00 ± 0.00 f 43.00 ± 3.29 b 122.12 ± 1.10 ab 53.45 ± 0.83 cd 1.52 ± 0.13 f PEP + 2 d PLHC 21 18.60 ± 0.00 a 0.00 ± 0.00 f 39.80 ± 3.39 bcd 119.73 ± 1.22 c 56.26 ± 1.69 bc 1.84 ± 0.10 e MAP 21 11.87 ± 0.21 c 4.76 ± 0.10 b 37.37 ± 2.06 cde 122.85 ± 0.44 a 55.88 ± 2.61 c 1.13 ± 0.06 g MAP + 1 d PLHC 21 11.80 ± 0.20 c 4.21 ± 0.14 d 42.97 ± 4.76 b 122.86 ± 2.28 a 56.31 ± 1.96 bc 1.11 ± 0.09 gh MAP + 2 d PLHC 21 13.27 ± 0.25 b 3.20 ± 0.17 e 42.87 ± 2.35 b 122.50 ± 0.51 a 48.53 ± 1.71 e 0.87 ± 0.08 h PEP 28 18.60 ± 0.00 a 0.00 ± 0.00 f 32.03 ± 1.63 f 118.55 ± 0.99 c 61.88 ± 1.49 a 6.07 ± 0.24 a PEP + 1 d PLHC 28 18.60 ± 0.00 a 0.00 ± 0.00 f 41.77 ± 1.15 bcd 122.70 ± 0.27 a 59.41 ± 0.98 ab 2.05 ± 0.19 de PEP + 2 d PLHC 28 18.60 ± 0.00 a 0.00 ± 0.00 f 37.00 ± 1.41 de 120.35 ± 1.95 bc 61.24 ± 1.55 a 3.09 ± 0.14 c MAP 28 9.63 ± 0.15 e 5.94 ± 0.12 a 37.27 ± 2.73 cde 122.65 ± 0.98 a 54.94 ± 1.40 c 2.19 ± 0.13 d MAP + 1 d PLHC 28 9.53 ± 0.14 e 5.99 ± 0.22 a 38.67 ± 2.20 bcd 119.92 ± 0.70 c 56.39 ± 1.30 bc 2.05 ± 0.06 de MAP + 2 d PLHC 28 11.23 ± 0.22 d 4.47 ± 0.11 c 42.10 ± 3.30 bc 122.64 ± 1.10 a 51.00 ± 3.28 de 1.12 ± 0.13 g T *** *** *** *** *** *** ST *** *** ns ns *** *** T × ST *** *** ns ns ** *** Values are presented as means of three replicates ± SD. Different lowercase letters indicated significant differences among means using Fisher's protected LSD test at p < 0.05. T, treatment; ST, storage time. ns, no significant effect; * significant effect at the 0.05 level; ** significant effect at the 0.01 level; *** significant effect at the 0.001 level. Table 5.
Effects of 1 and 2 d pre-storage low humidity conditioning (PLHC) on gas components (O2 and CO2 concentrations) in bags and quality attributes (fruit firmness [FF], hug angle, skin lightness, and weight loss [WL]) of polyethylene packaging (PEP)- and modified atmosphere packaging (MAP)-treated zucchini fruit at harvest and after storage at 3 ± 0.5 °C (Experiment 3).
-
Treatment Storage time
(d)MDA
(μmol kg−1)O2·−
(mg kg−1)H2O2
(mg kg−1)POD
(U kg−1)CAT
(U kg−1)AsA
(mg kg−1)GSH
(mg kg−1)At harvest 0 4.14 ± 0.19 i 0.98 ± 0.04 h 9.88 ± 0.38 i 47.00 ± 1.67 g 9.03 ± 0.67 d 134.97 ± 4.06 a 8.27 ± 0.31 a PEP 21 12.14 ± 0.75 b 1.65 ± 0.07 b 15.44 ± 0.45 b 79.40 ± 6.58 d 8.77 ± 0.21 d 65.70 ± 3.06 h 4.23 ± 0.25 e PEP + 1 d PLHC 21 8.22 ± 0.44 fg 1.29 ± 0.01 de 12.56 ± 0.20 fg 69.87 ± 1.89 ef 11.93 ± 0.40 b 117.60 ± 2.95 bc 6.20 ± 0.20 c PEP + 2 d PLHC 21 9.97 ± 0.84 de 1.44 ± 0.06 c 13.85 ± 0.29 cd 95.47 ± 2.27 c 9.00 ± 0.50 d 86.32 ± 2.28 f 4.67 ± 0.42 e MAP 21 8.07 ± 0.80 g 1.23 ± 0.05 ef 12.20 ± 0.29 gh 74.87 ± 4.03 de 10.23 ± 0.75 c 111.60 ± 2.59 c 6.60 ± 0.20 bc MAP + 1 d PLHC 21 9.26 ± 0.43 ef 1.21 ± 0.05 f 13.33 ± 0.39 de 116.73 ± 4.96 b 10.47 ± 0.42 c 102.10 ± 2.26 d 6.63 ± 0.23 bc MAP + 2 d PLHC 21 5.70 ± 0.51 h 1.12 ± 0.03 g 10.18 ± 0.35 i 80.33 ± 6.18 d 12.83 ± 0.35 a 122.13 ± 4.74 b 7.90 ± 0.10 a PEP 28 14.99 ± 0.32 a 1.88 ± 0.08 a 18.65 ± 0.39 a 62.40 ± 3.68 f 4.63 ± 0.38 g 54.43 ± 3.26 i 2.20 ± 0.30 g PEP + 1 d PLHC 28 9.08 ± 0.25 efg 1.31 ± 0.04 d 12.92 ± 0.47 ef 98.27 ± 3.46 c 7.33 ± 0.42 e 93.23 ± 3.13 e 5.23 ± 0.32 d PEP + 2 d PLHC 28 11.66 ± 1.34 bc 1.48 ± 0.04 c 15.95 ± 0.30 b 73.77 ± 3.66 de 5.00 ± 0.20 fg 74.57 ± 3.46 g 2.97 ± 0.21 f MAP 28 8.64 ± 0.37 fg 1.23 ± 0.03 ef 13.09 ± 0.28 ef 119.20 ± 4.23 b 5.70 ± 0.20 f 99.50 ± 0.66 de 4.53 ± 0.32 e MAP + 1 d PLHC 28 8.87 ± 0.58 cd 1.33 ± 0.03 d 14.42 ± 0.41 c 79.27 ± 8.54 d 5.67 ± 0.23 f 99.87 ± 4.20 de 4.33 ± 0.29 e MAP + 2 d PLHC 28 6.09 ± 0.23 h 1.16 ± 0.05 fg 11.77 ± 0.30 h 142.97 ± 10.84 a 8.93 ± 0.45 d 112.13 ± 9.73 c 6.97 ± 0.15 b T *** *** *** *** *** *** *** ST *** *** *** *** *** *** *** T × ST * ** *** *** ns ** *** Values are presented as means of three replicates ± SD. Different lowercase letters indicated significant differences among means using Fisher's protected LSD test at p < 0.05. T, treatment; ST, storage time. ns, no significant effect; * significant effect at the 0.05 level; ** significant effect at the 0.01 level; *** significant effect at the 0.001 level. Table 6.
Effects of 1 and 2 d pre-storage low humidity conditioning (PLHC) on malondialdehyde (MDA) content, reactive oxygen species (superoxide anion [O2·−] and hydrogen peroxide [H2O2]), antioxidant enzymes (peroxidase [POD] and catalase [CAT]), and antioxidants (ascorbic acid [AsA] and glutathione [GSH]) of polyethylene packaging (PEP)- and modified atmosphere packaging (MAP)-treated zucchini fruit at harvest, and after storage at 3 ± 0.5 °C (Experiment 3).
Figures
(3)
Tables
(6)