-
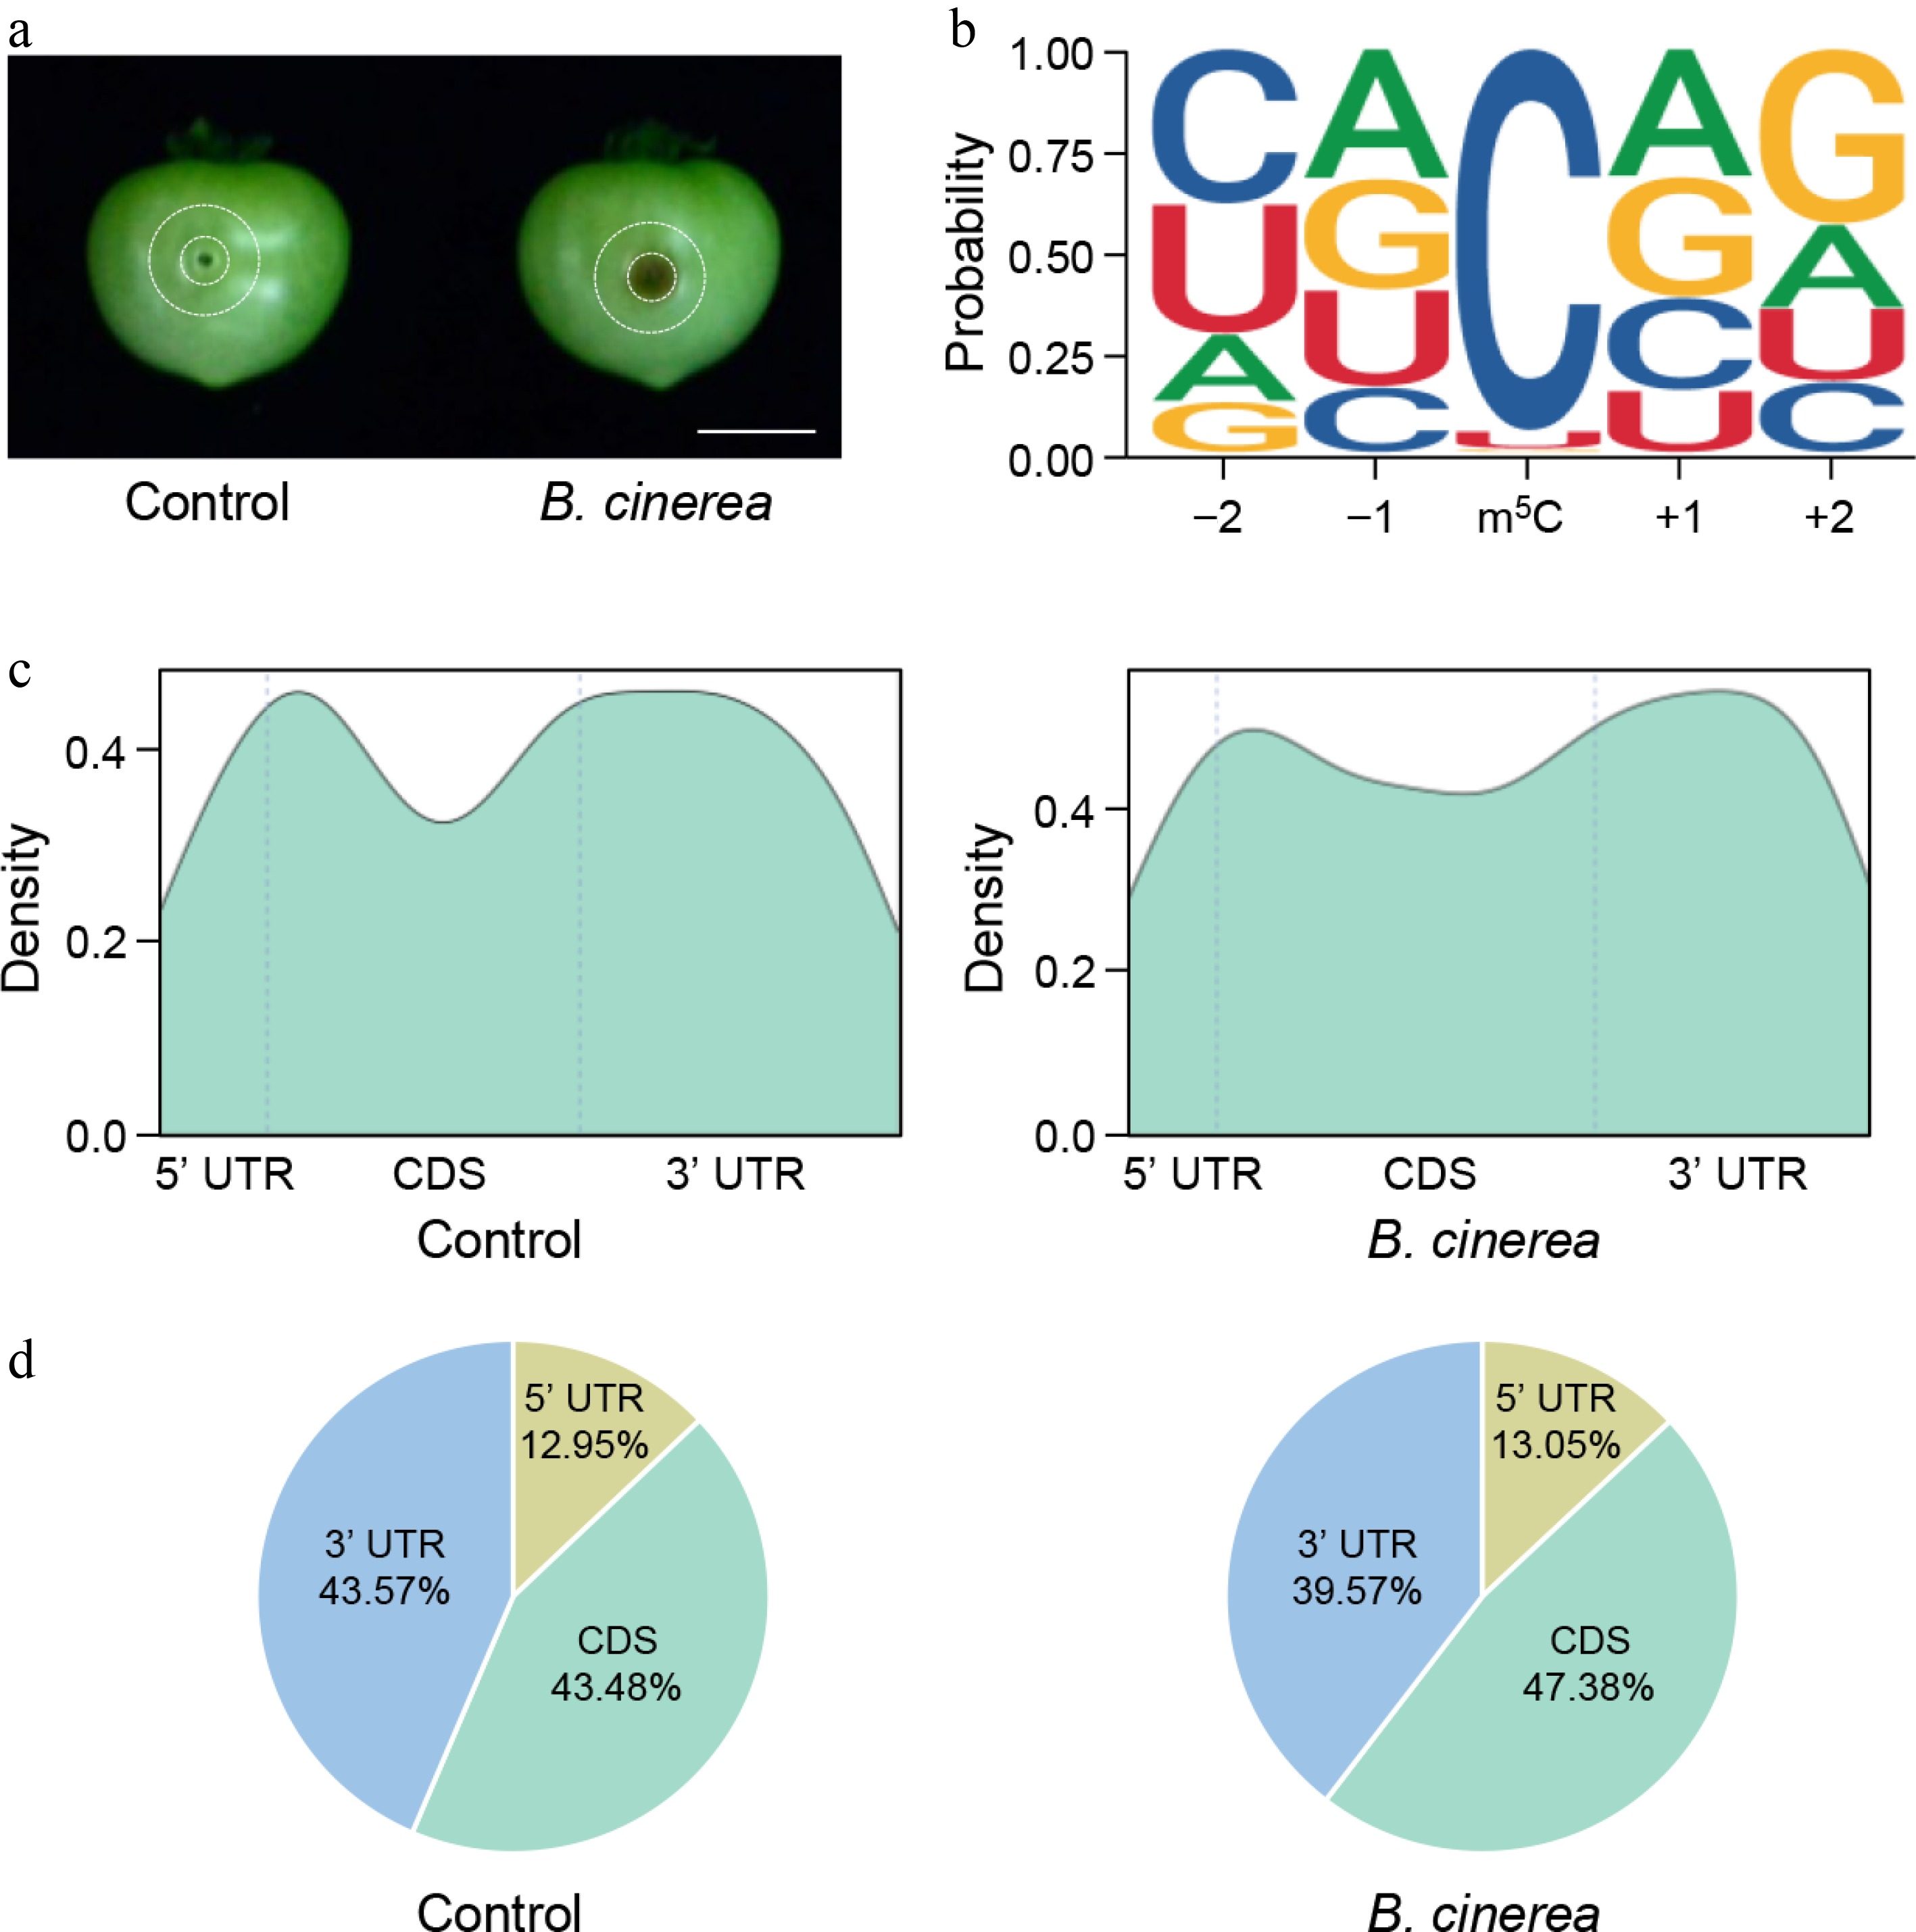
Figure 1.
m5C methylome profiles of tomato fruits under Botrytis cinerea infection. (a) Representative photographs of mock-inoculated and B. cinerea-infected tomato fruits at 48 h postinoculation. Micro-Tom fruits at the mature green stage were inoculated with B. cinerea, and pericarp tissues between the two indicated circles were collected as experimental materials. Scale bar = 1 cm. (b) Sequence motif identified around m5C sites using MEME software. All m5C sites with a fraction score > 0.7 were used for motif prediction analysis. (c) Metagenomic profiles of m5C site distributions in the 5' untranslated region (5' UTR), coding sequence (CDS), and 3' UTR region. (d) Pie charts showing the proportion of m5C sites in the 5' UTR, CDS, and 3' UTR.
-
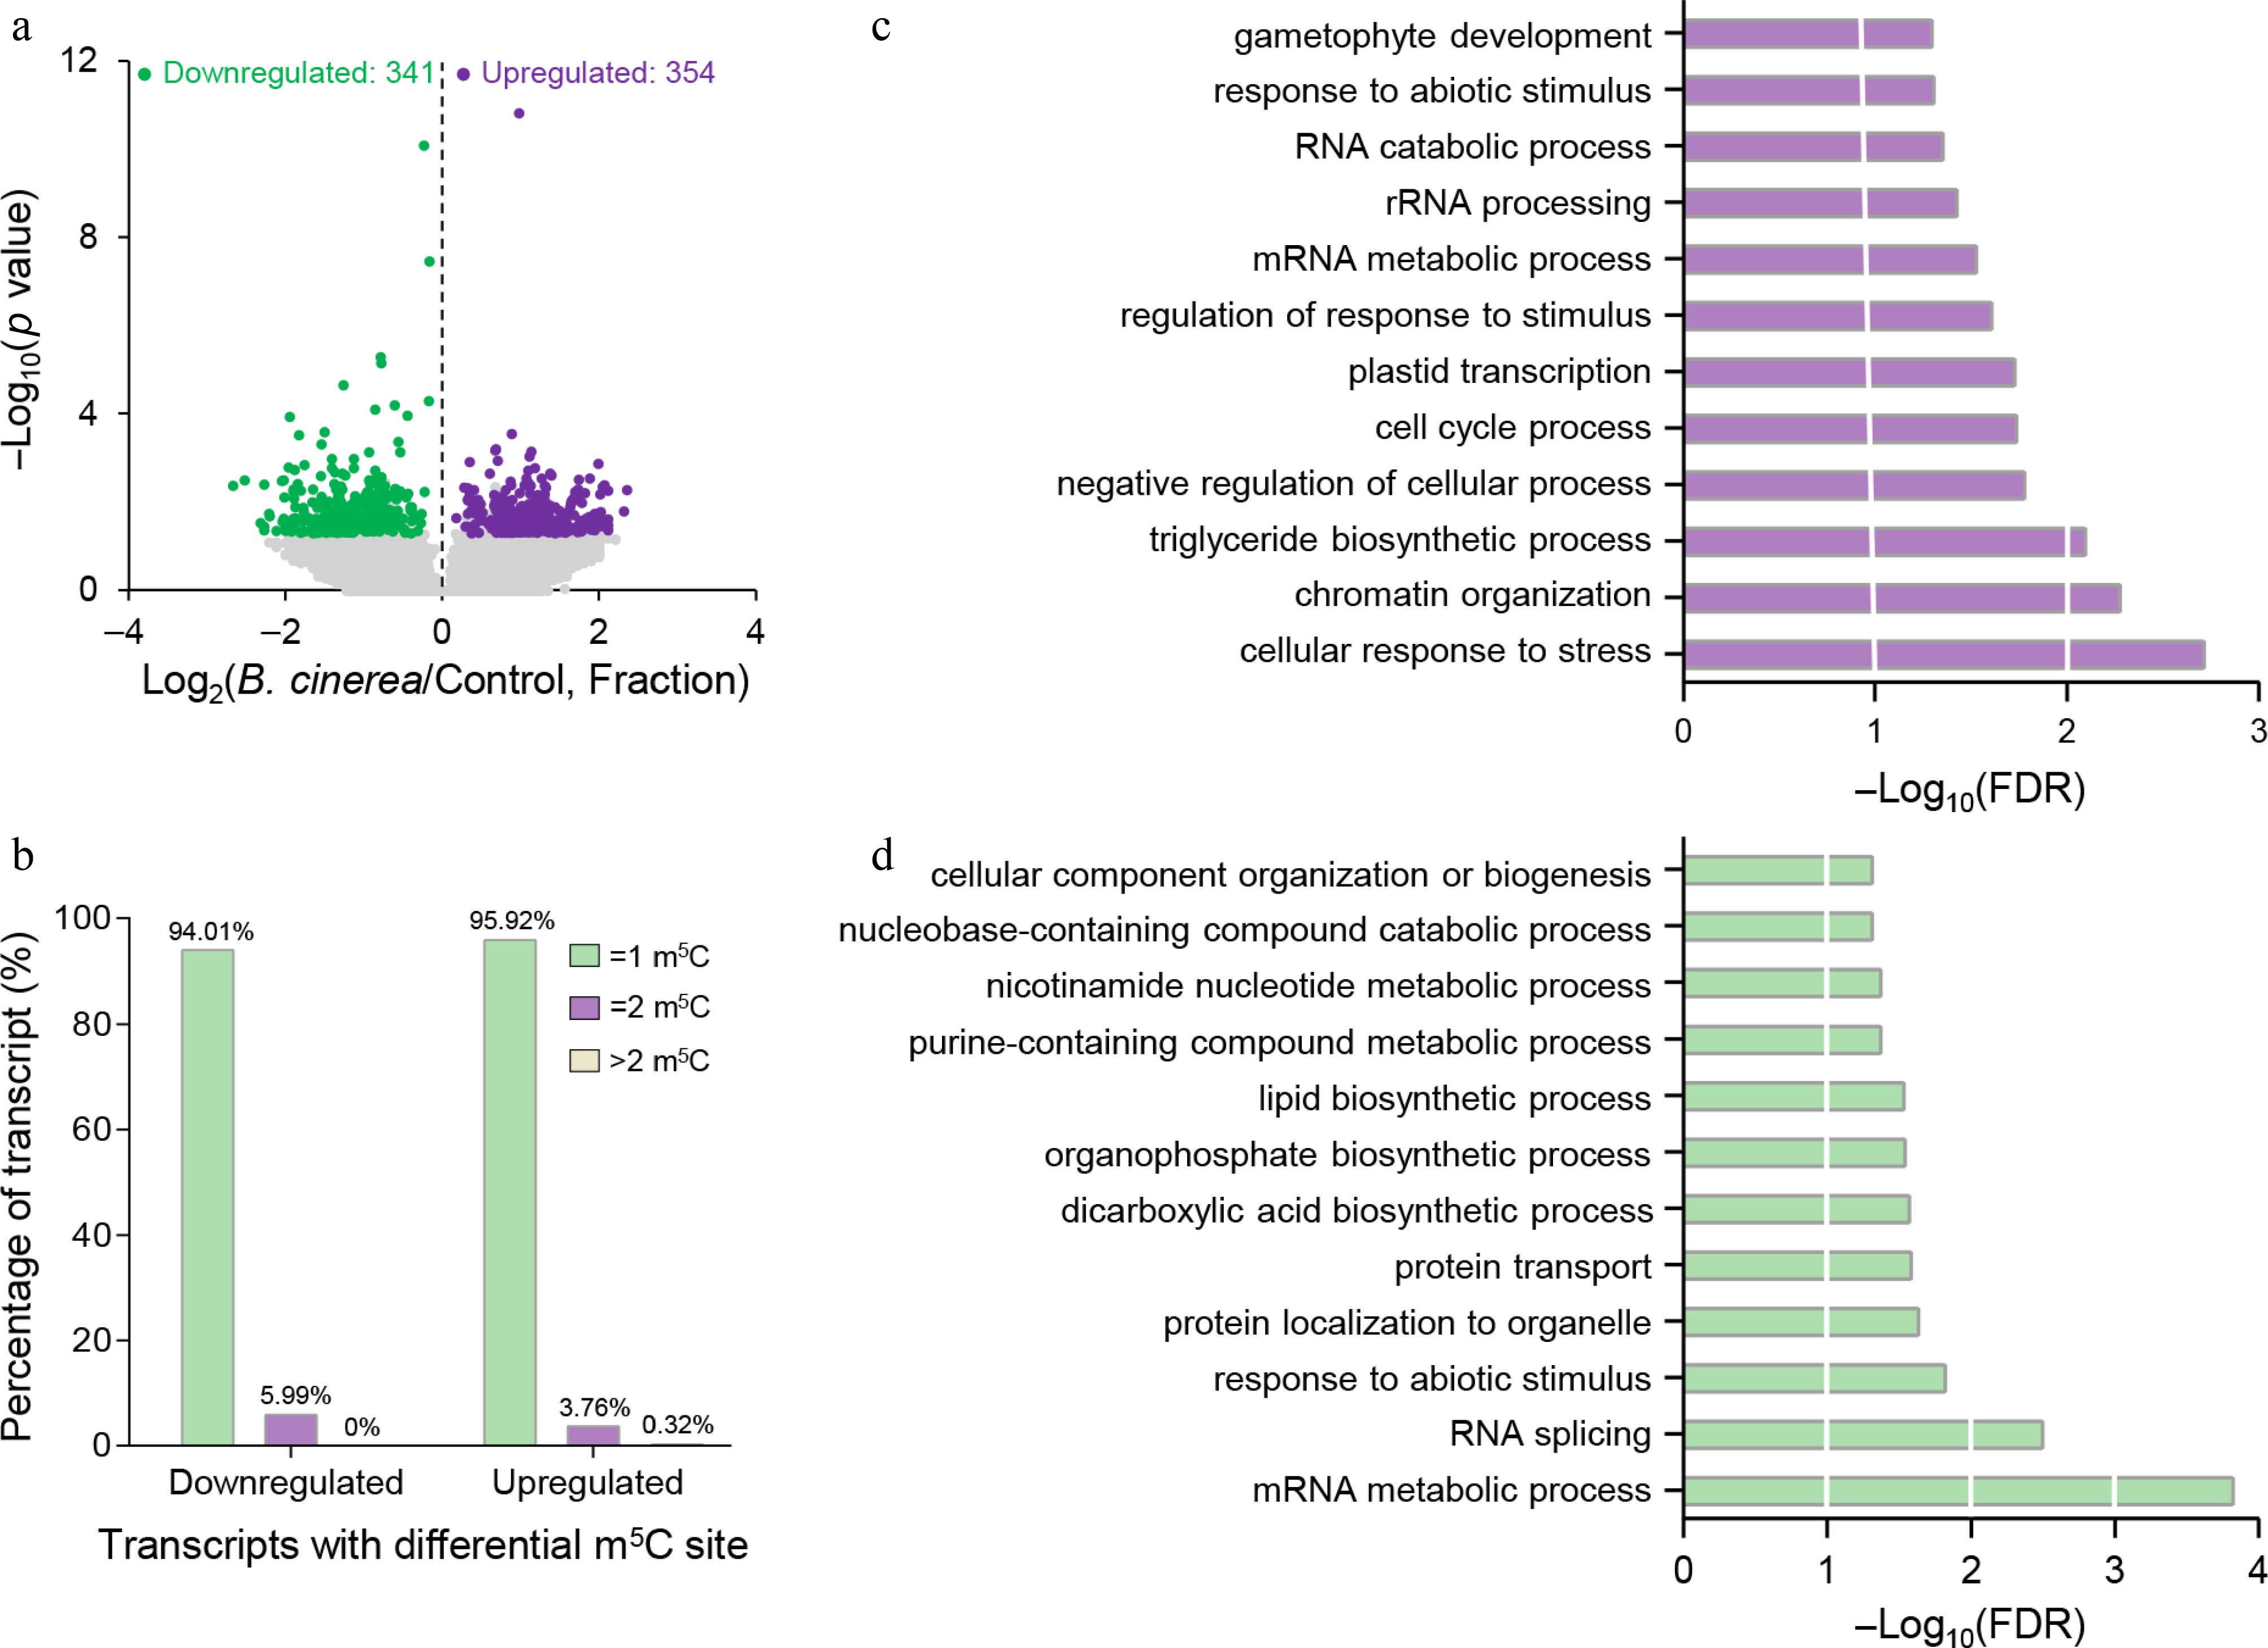
Figure 2.
Identification of differential m5C sites in B. cinerea-infected tomato fruits. (a) Volcano plot showing significantly unregulated (purple) and downregulated (green) m5C sites in B. cinerea-infected tomato fruits compared with the control group. (b) Proportions of the differential m5C-modified transcripts containing different m5C site numbers. (c) Gene Ontology (GO) enrichment analysis of biological processes for gene transcripts harboring significantly upregulated m5C sites. (d) GO enrichment analysis of biological processes for gene transcripts harboring significantly downregulated m5C sites. FDR, false discovery rate.
-
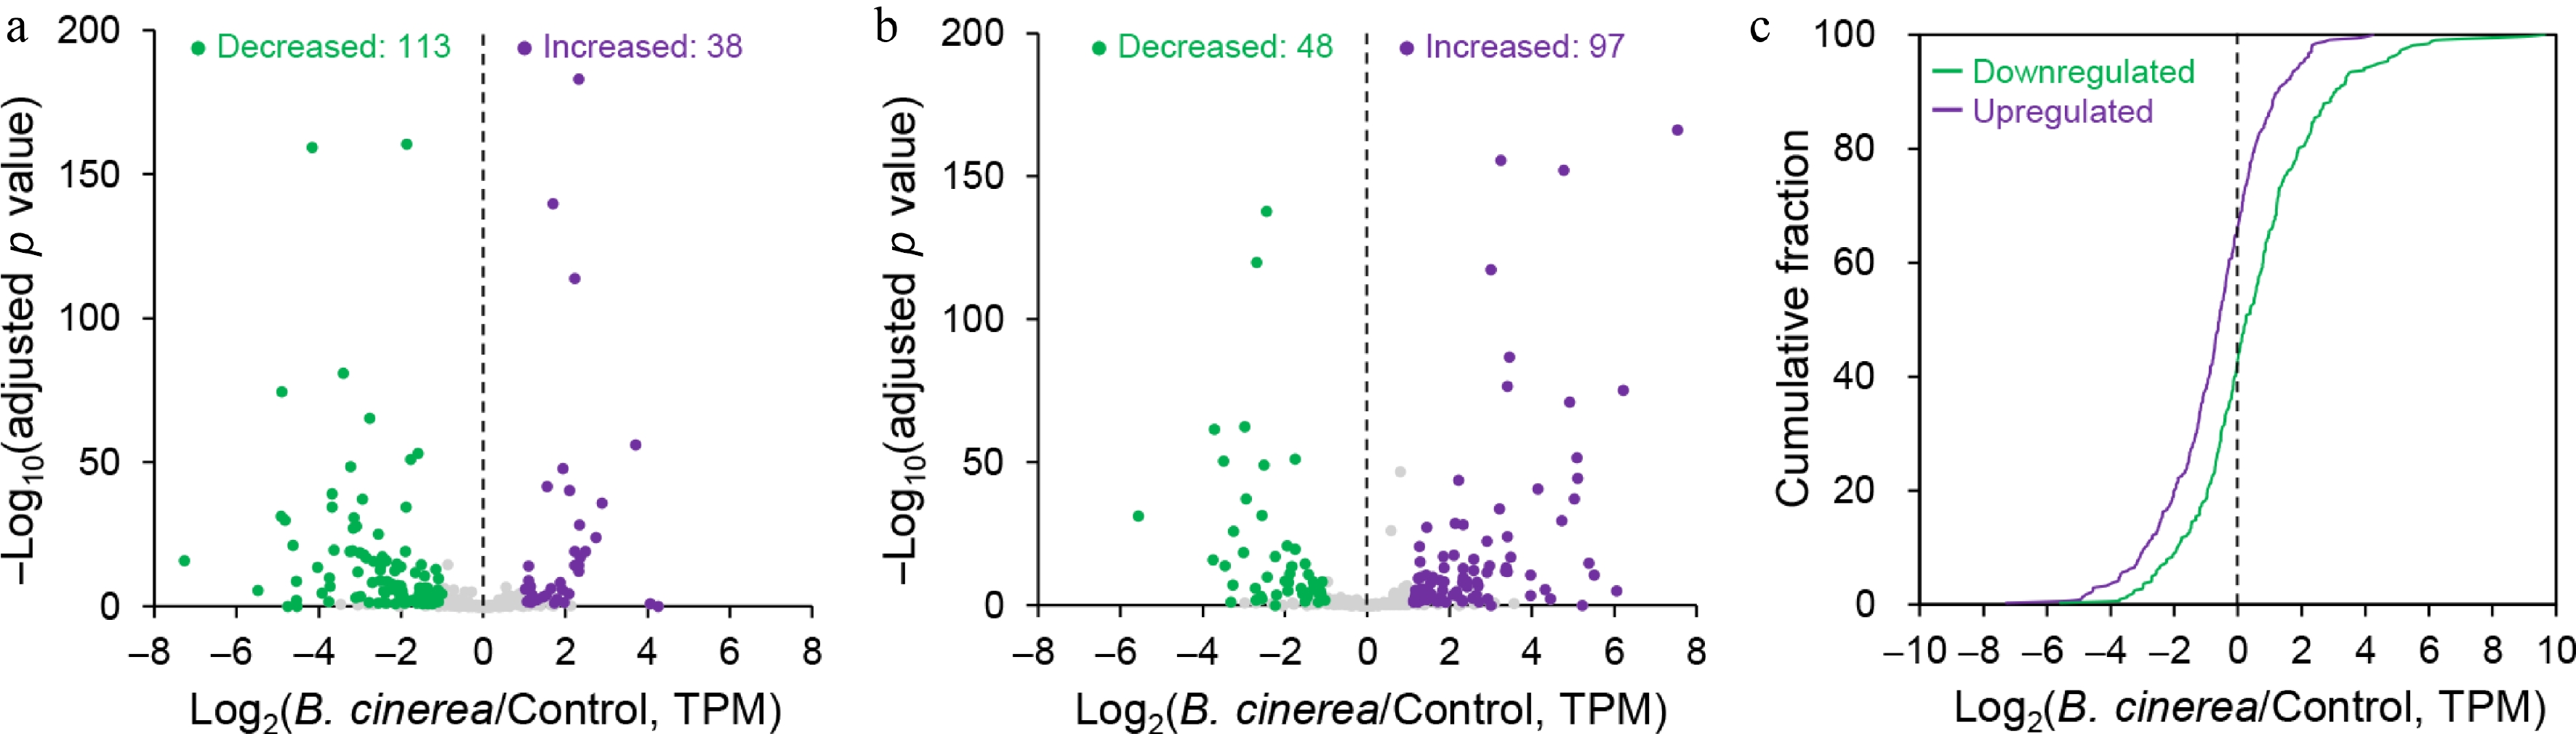
Figure 3.
m5C methylation is globally negatively correlated with transcript abundance. (a) and (b) Volcano plots displaying the expression ratios of transcripts containing upregulated and downregulated m5C sites in B. cinerea-infected tomato fruits compared with the control group, respectively. Transcripts with significantly increased and decreased mRNA levels (log2(fold change) ≥ 1; adjusted p-value < 0.05) in B. cinerea-infected tomato fruits are highlighted in purple and green, respectively. (c) Cumulative distribution of gene expression changes in transcripts harboring upregulated and downregulated m5C sites in B. cinerea-infected tomato fruits.
-
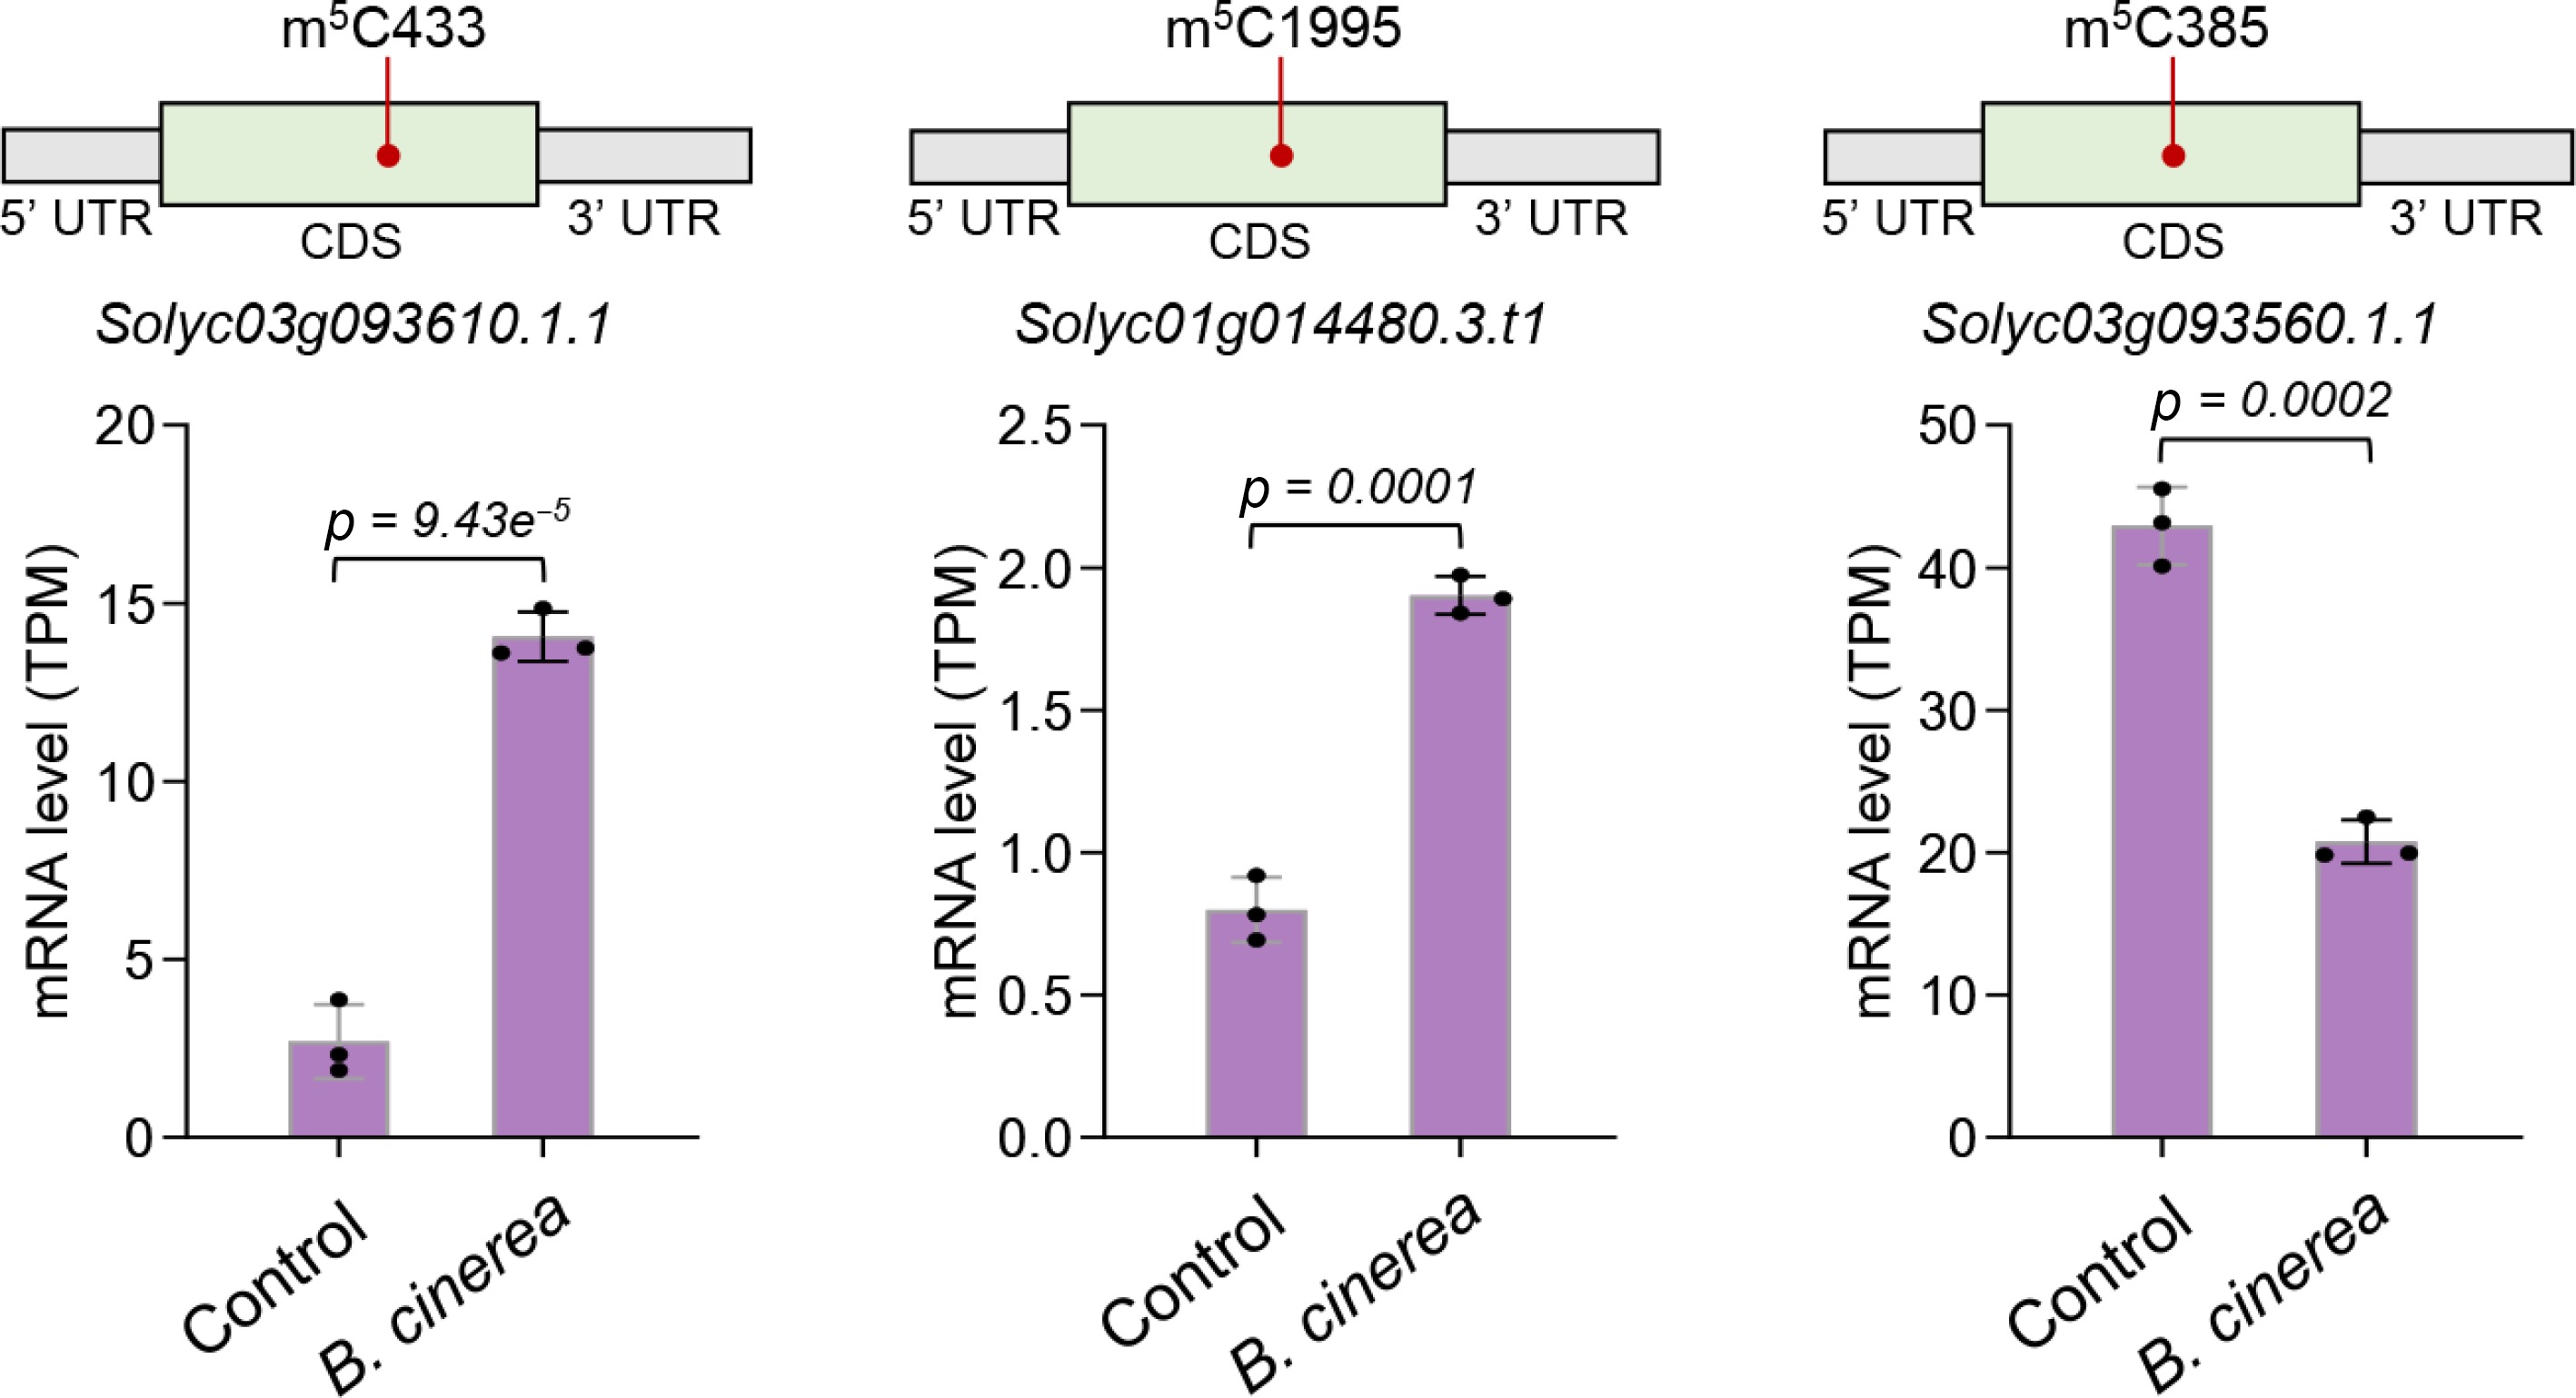
Figure 4.
Ethylene signaling pathway genes exhibited differential m5C methylation and expression abundance under B. cinerea infection. The transcript levels of three ethylene signaling pathway genes, including two ethylene response factor genes (Solyc03g093610 and Solyc01g014480) and one ethylene insensitive 3-like DNA-binding domain-containing protein gene (Solyc03g093560) were determined by RNA-seq analysis. Error bars represent the standard deviation of three independent experiments. Significance analysis was performed using Student's t-test, with p-values indicated. For each gene transcript, the position of differential m5C site is shown.
-
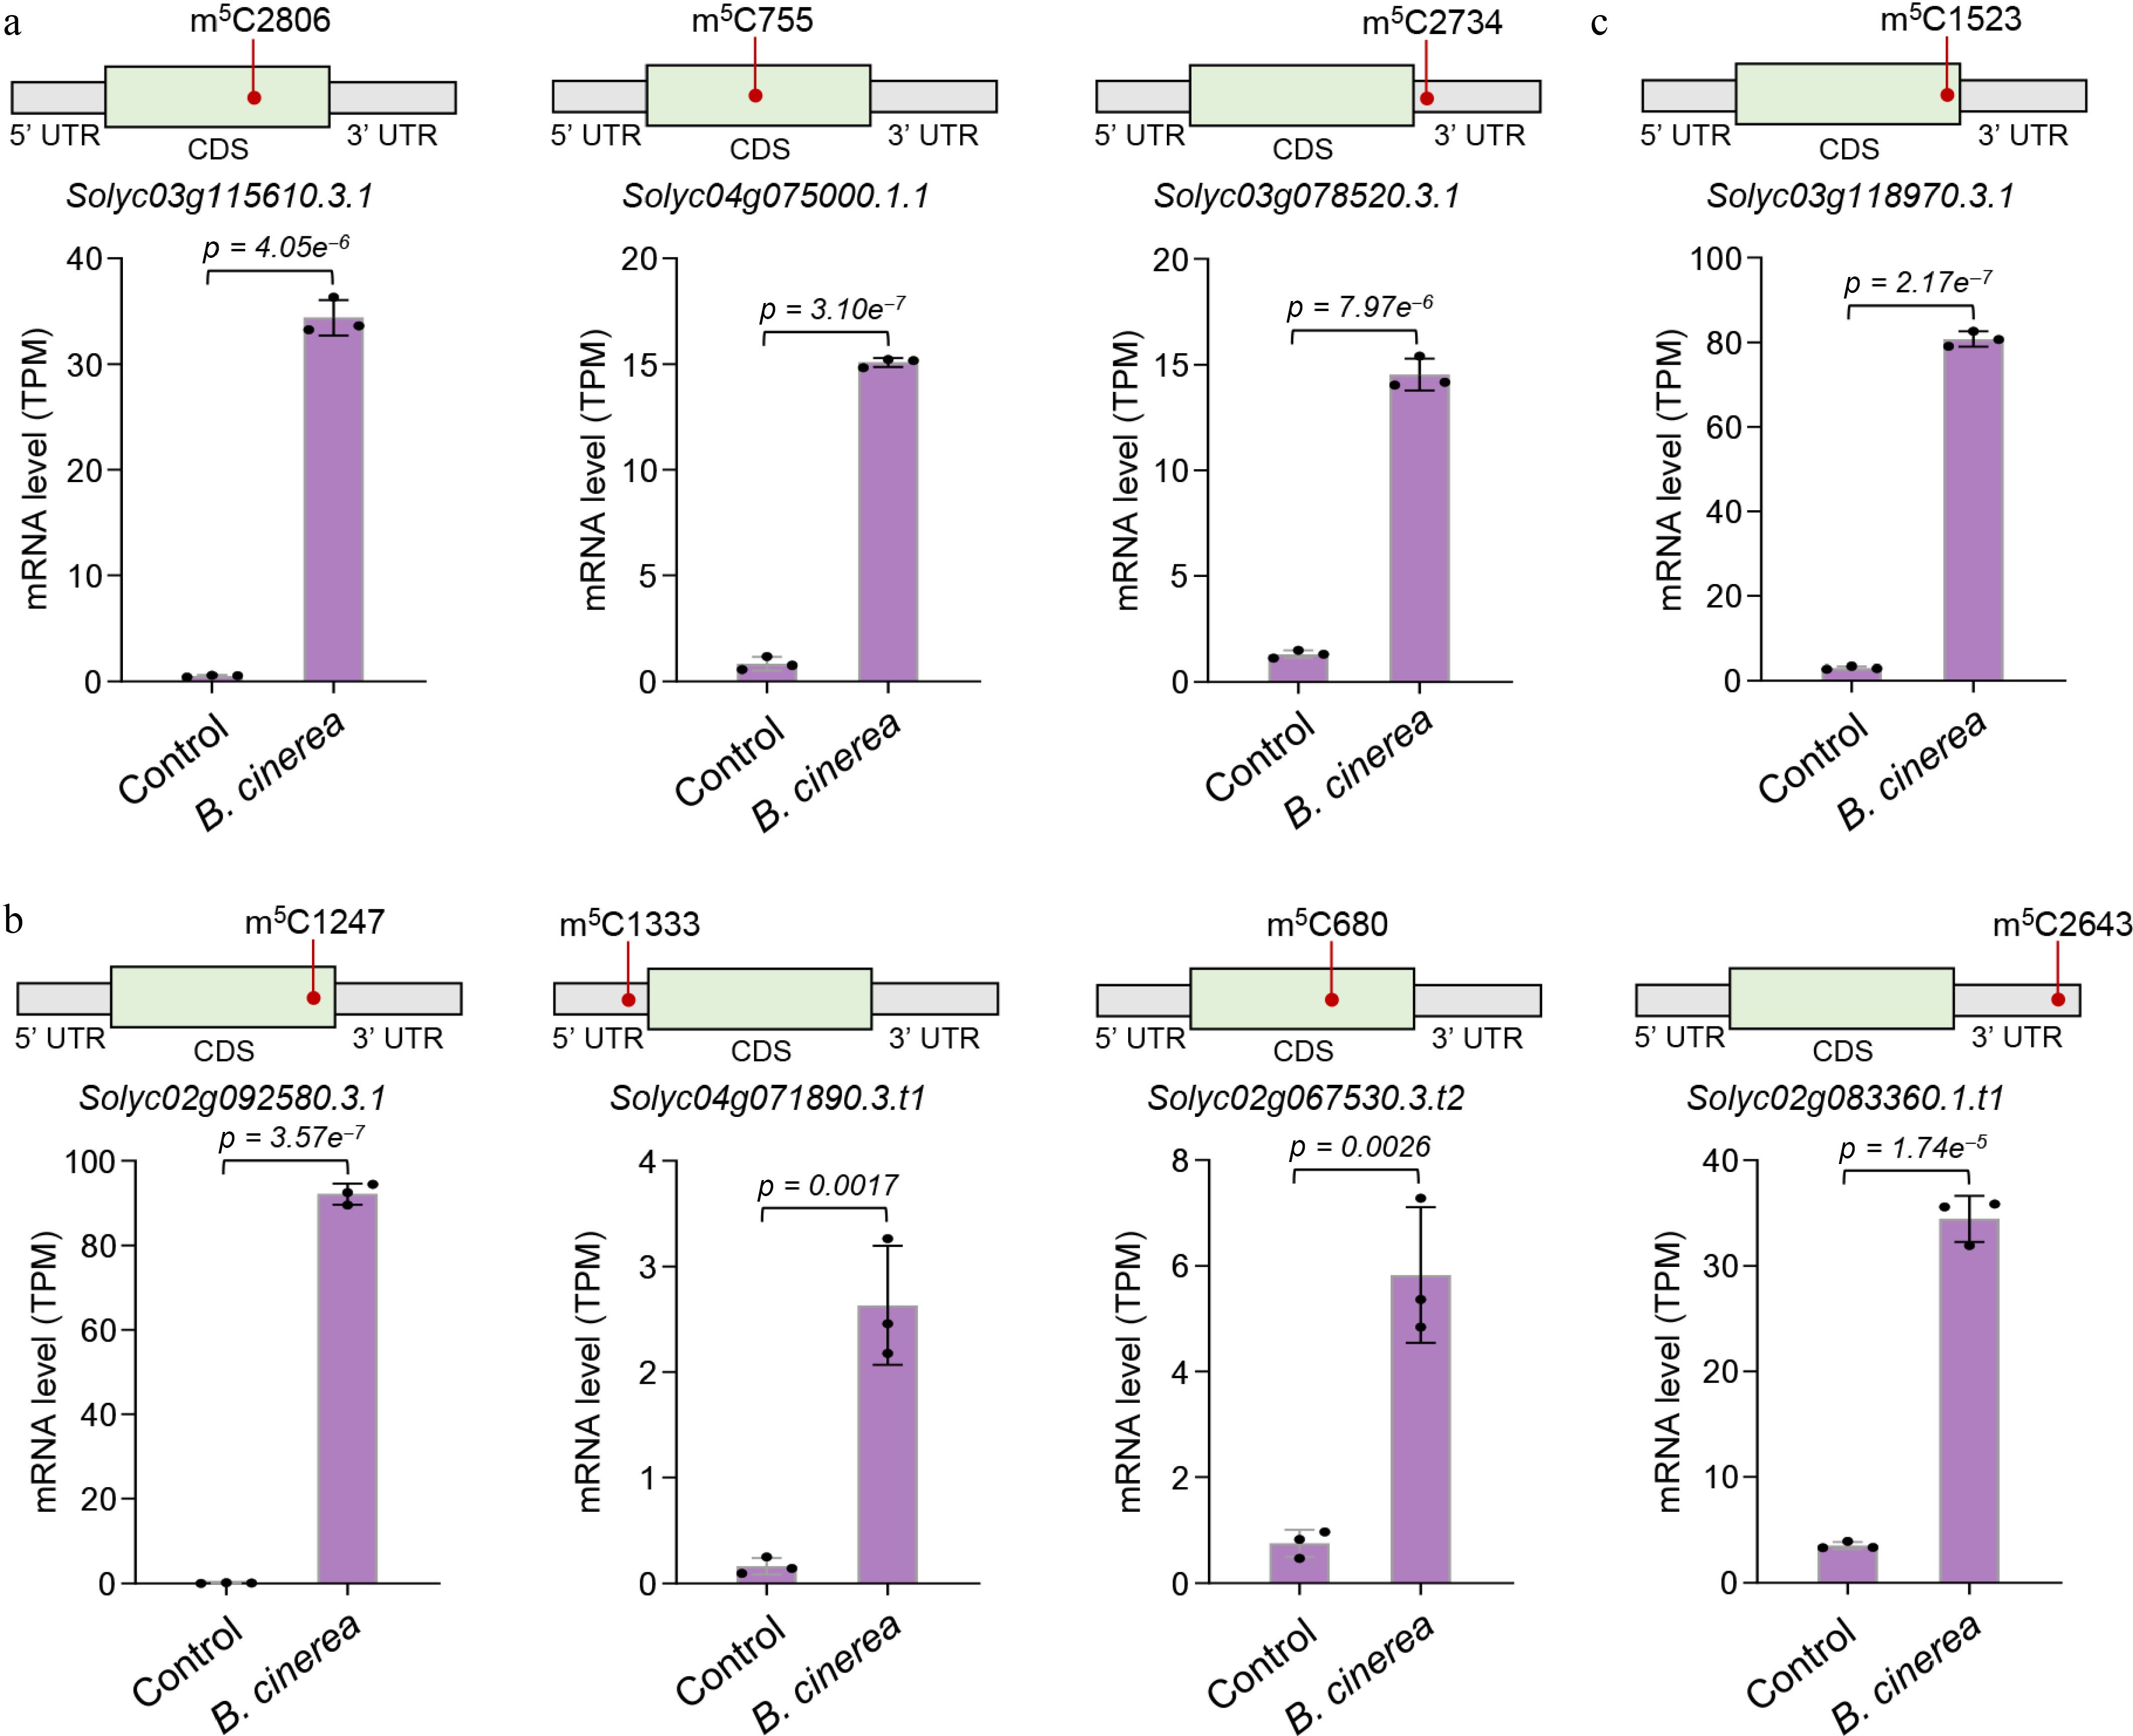
Figure 5.
Defense-related genes exhibited downregulated m5C modification and increased expression abundance under B. cinerea infection. (a) Changes in the transcript levels of three protein kinase genes. (b) Changes in the transcript levels of four redox-related genes. (c) Changes in the transcript levels of one toxin-resistant protein gene. Gene expression levels were determined by RNA-seq analysis. Error bars represent the standard deviation of three independent experiments. Significance analysis was performed using Student's t-test, with p-values indicated. For each gene transcript, the position of downregulated m5C site is shown.
-
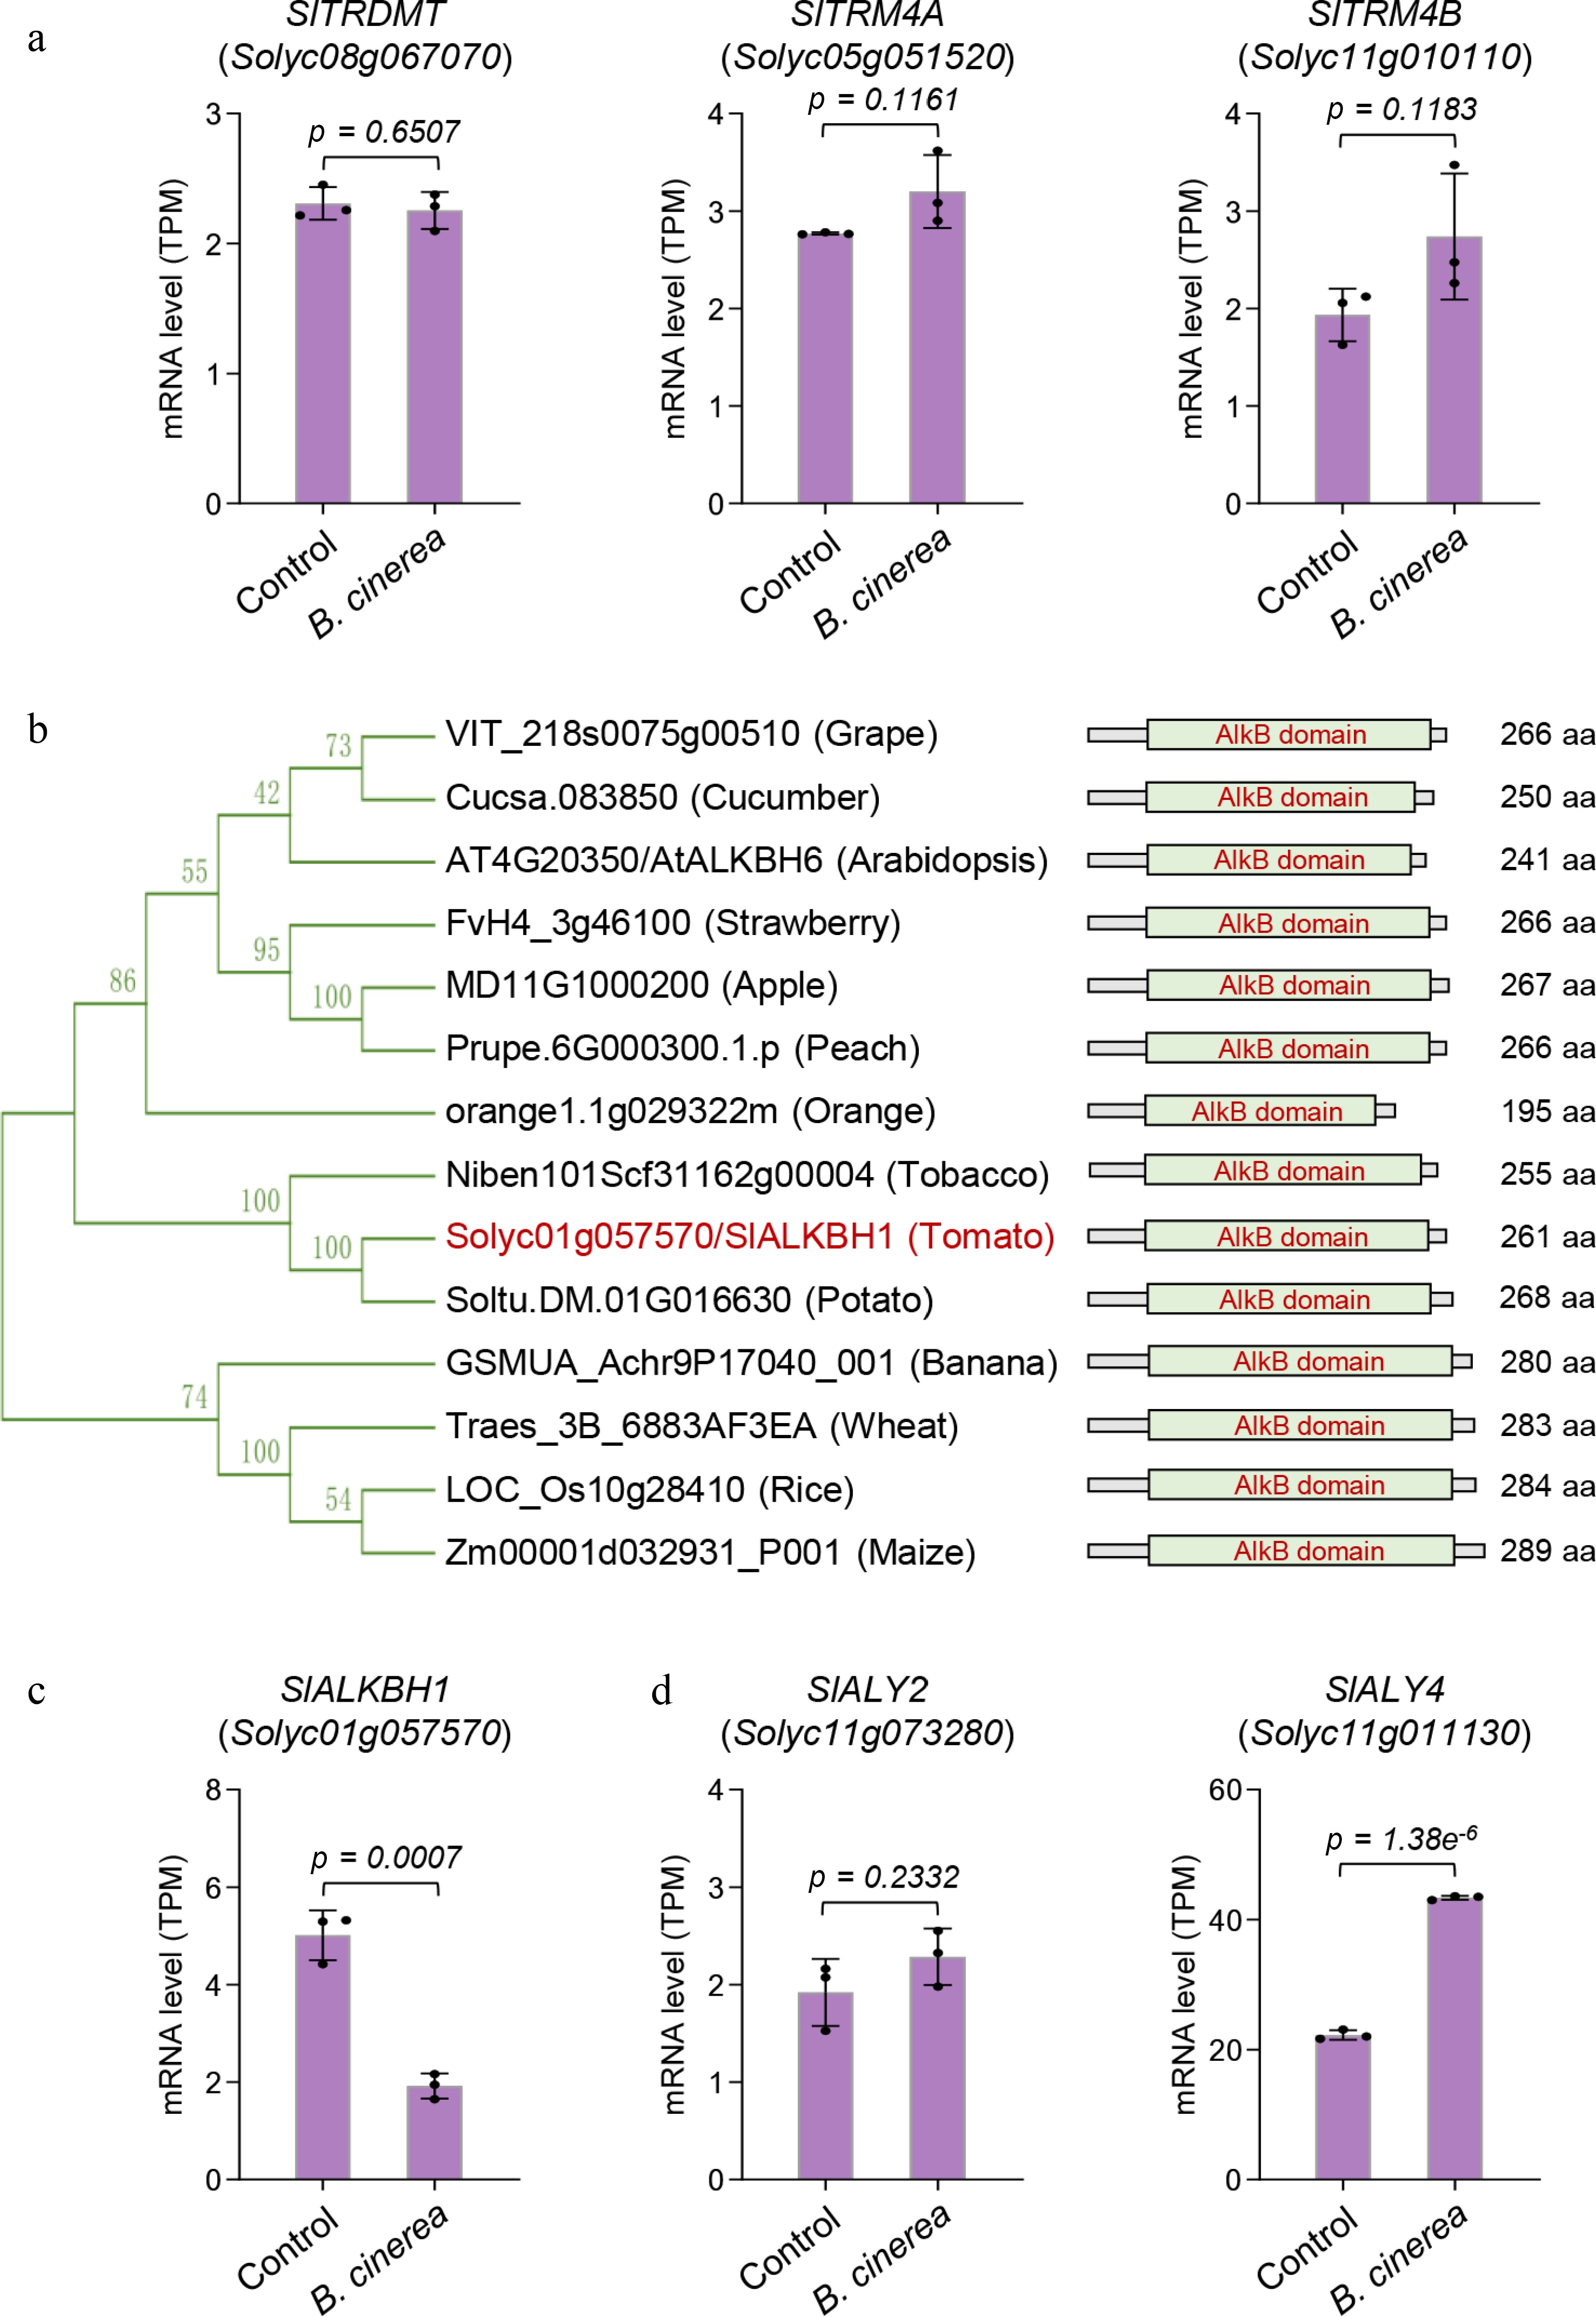
Figure 6.
Changes in the transcript levels of putative tomato m5C methyltransferase, demethylase, and reader protein genes. (a) The transcript levels of three putative m5C methyltransferase genes (SlTRDMT, SlTRM4A, and SlTRM4B) did not significantly alter upon B. cinerea infection. (b) Phylogenetic analysis of the putative m5C demethylase gene among various plant species. The phylogenetic tree was generated using MEGA 5.2 software. Bootstrap values from 1,000 replications are shown for each branch. aa, amino acid. (c) The transcript level of the putative m5C demethylase gene SlALKBH1 significantly decreased upon B. cinerea infection. (d) The transcript level of the putative m5C reader protein gene SlALY4, but not that of the SlALY2, significantly increased upon B. cinerea infection. Error bars represent the standard deviation of three independent experiments. Significance analysis was performed using Student's t-test, with p-values indicated.
Figures
(6)
Tables
(0)