-
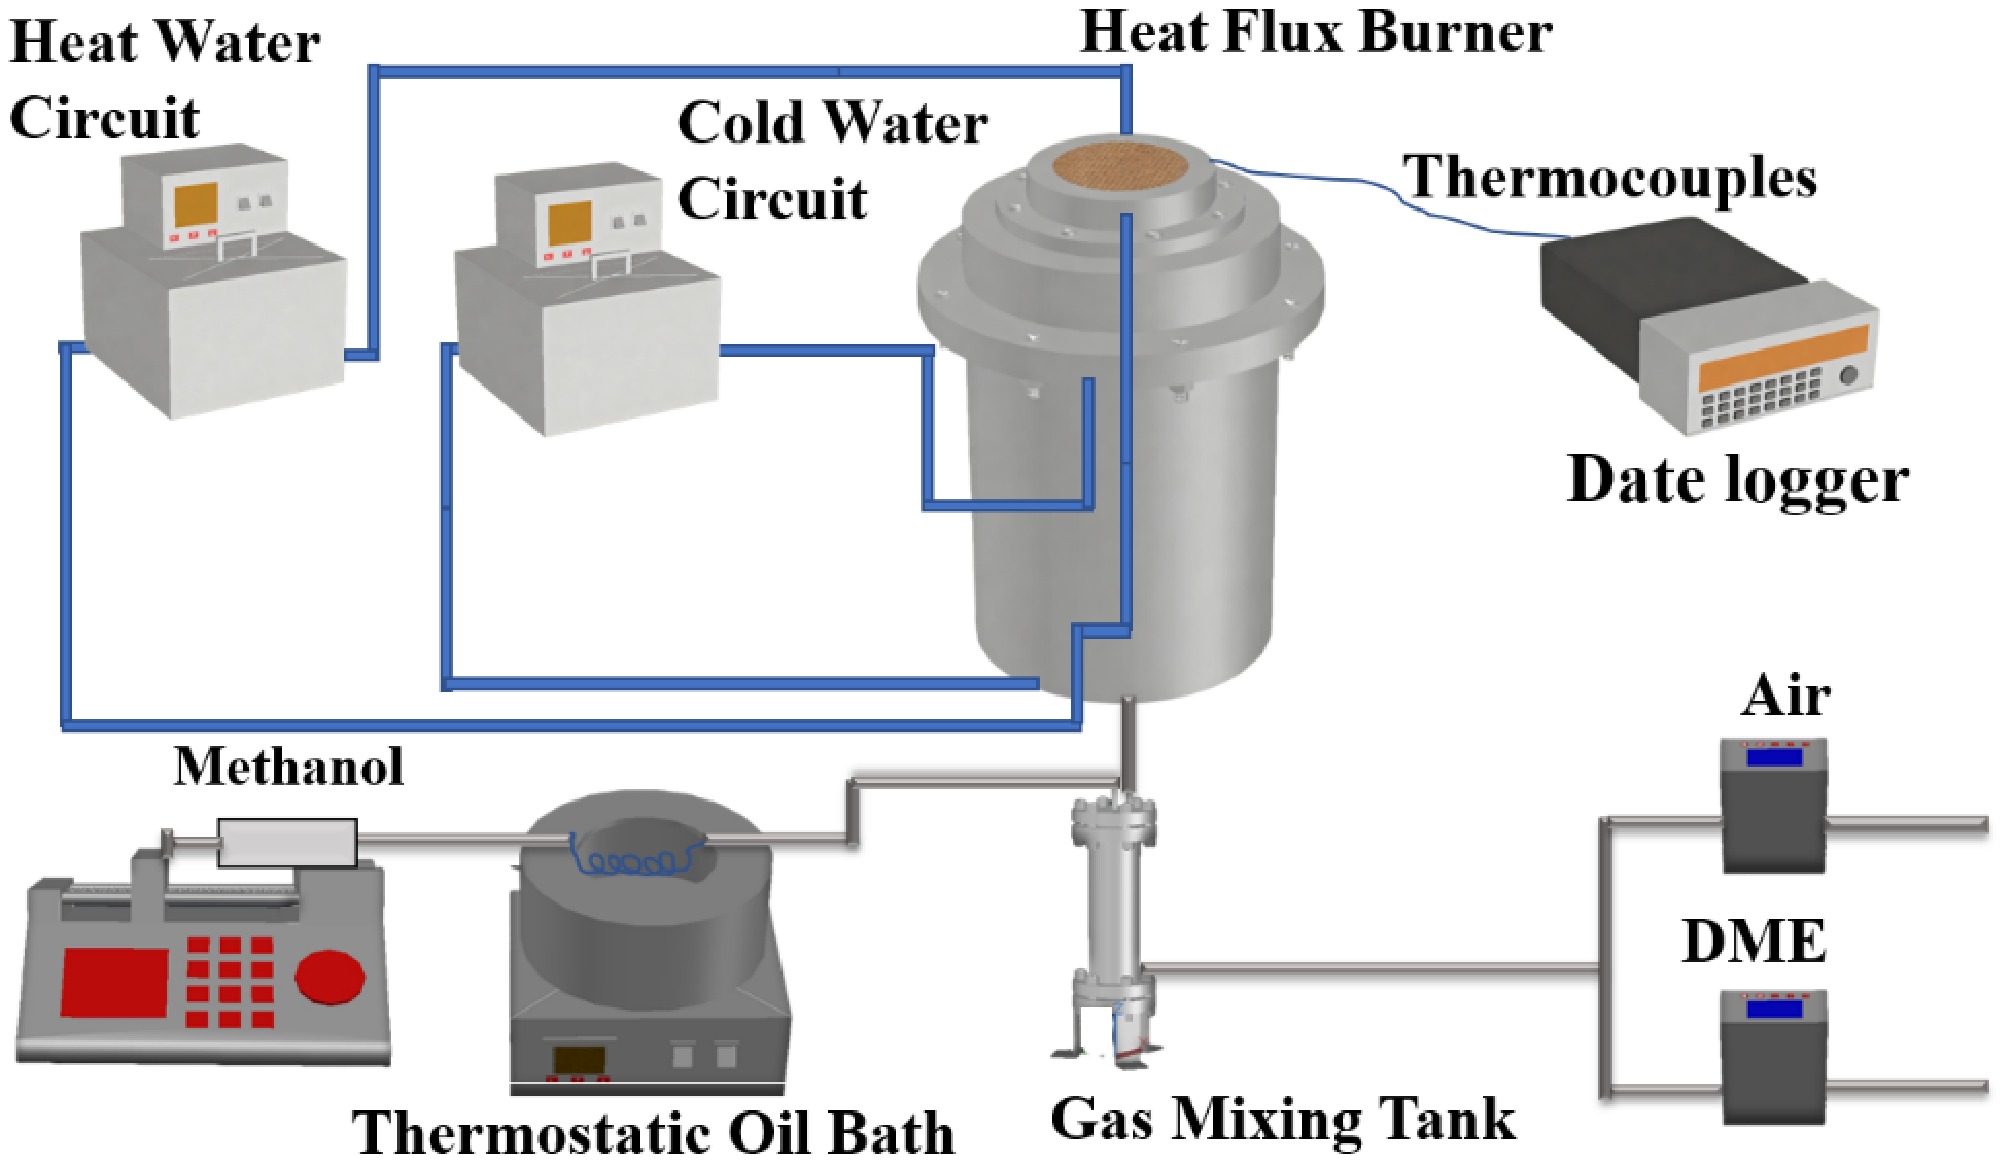
Figure 1.
Experimental setup for laminar burning velocity.
-
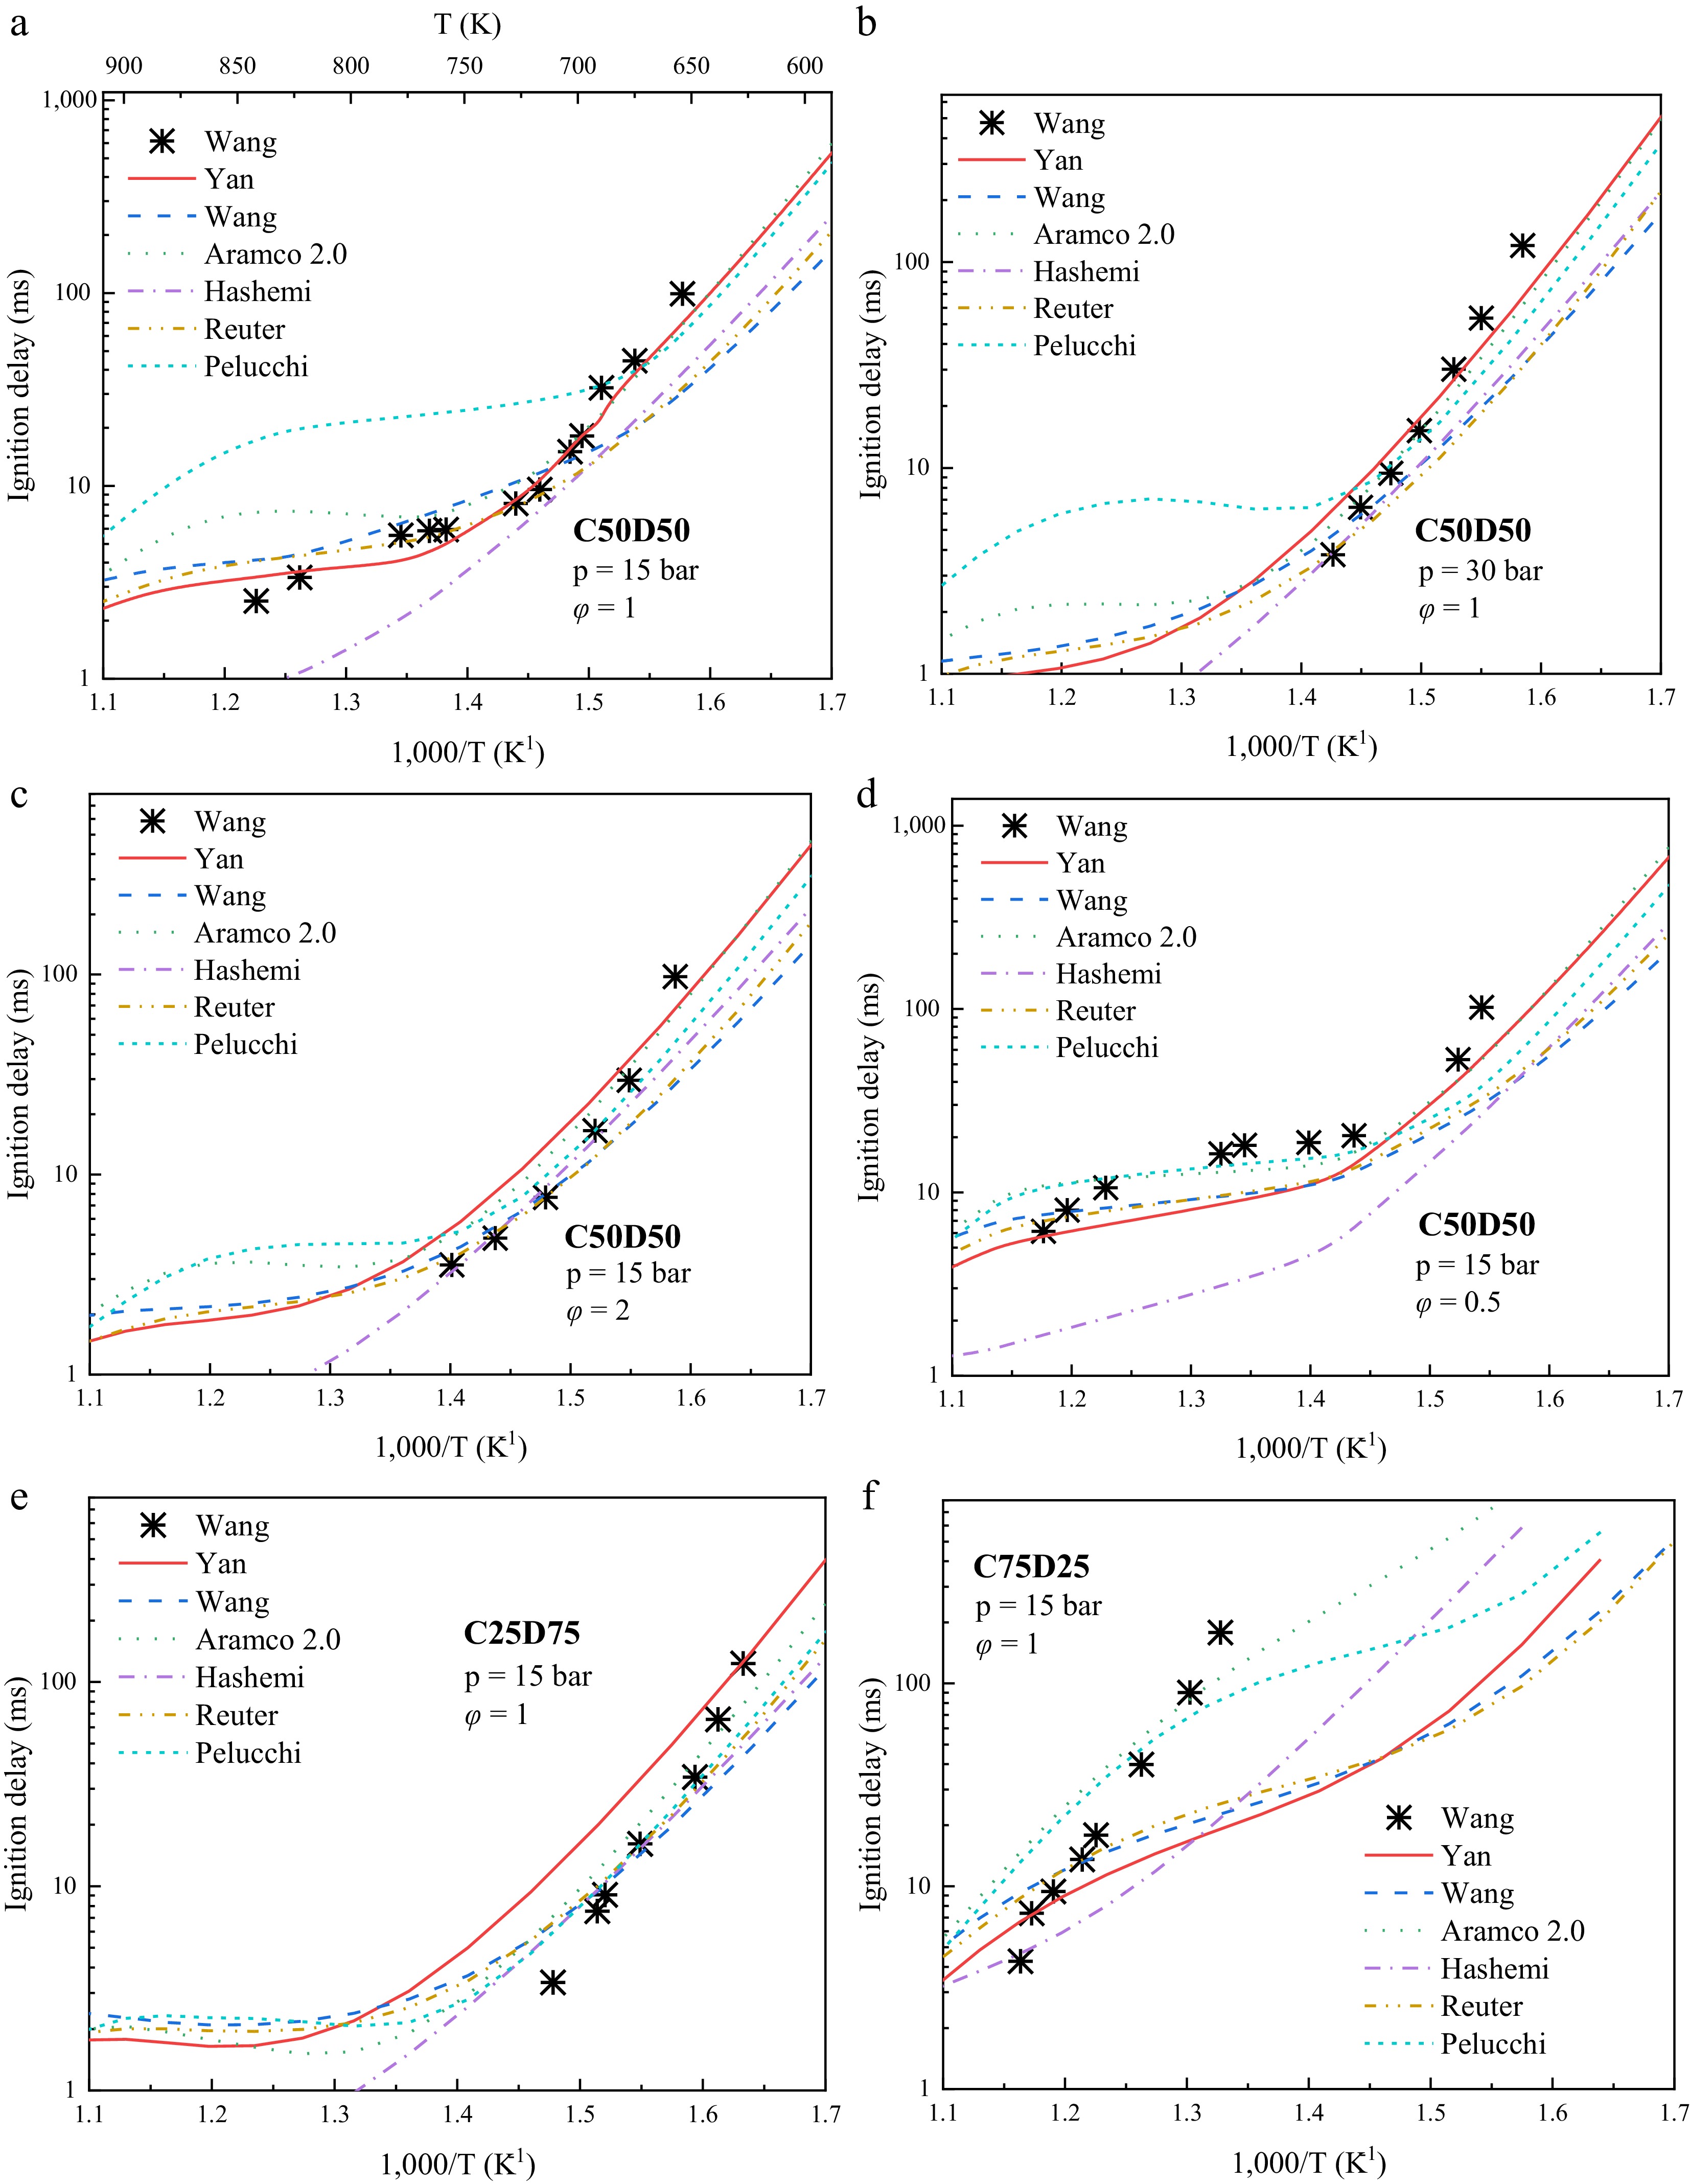
Figure 2.
Variation of IDT for methanol/DME blended fuels with 1000/T: RCM data (symbols) vs simulation results from various mechanisms (lines).
-
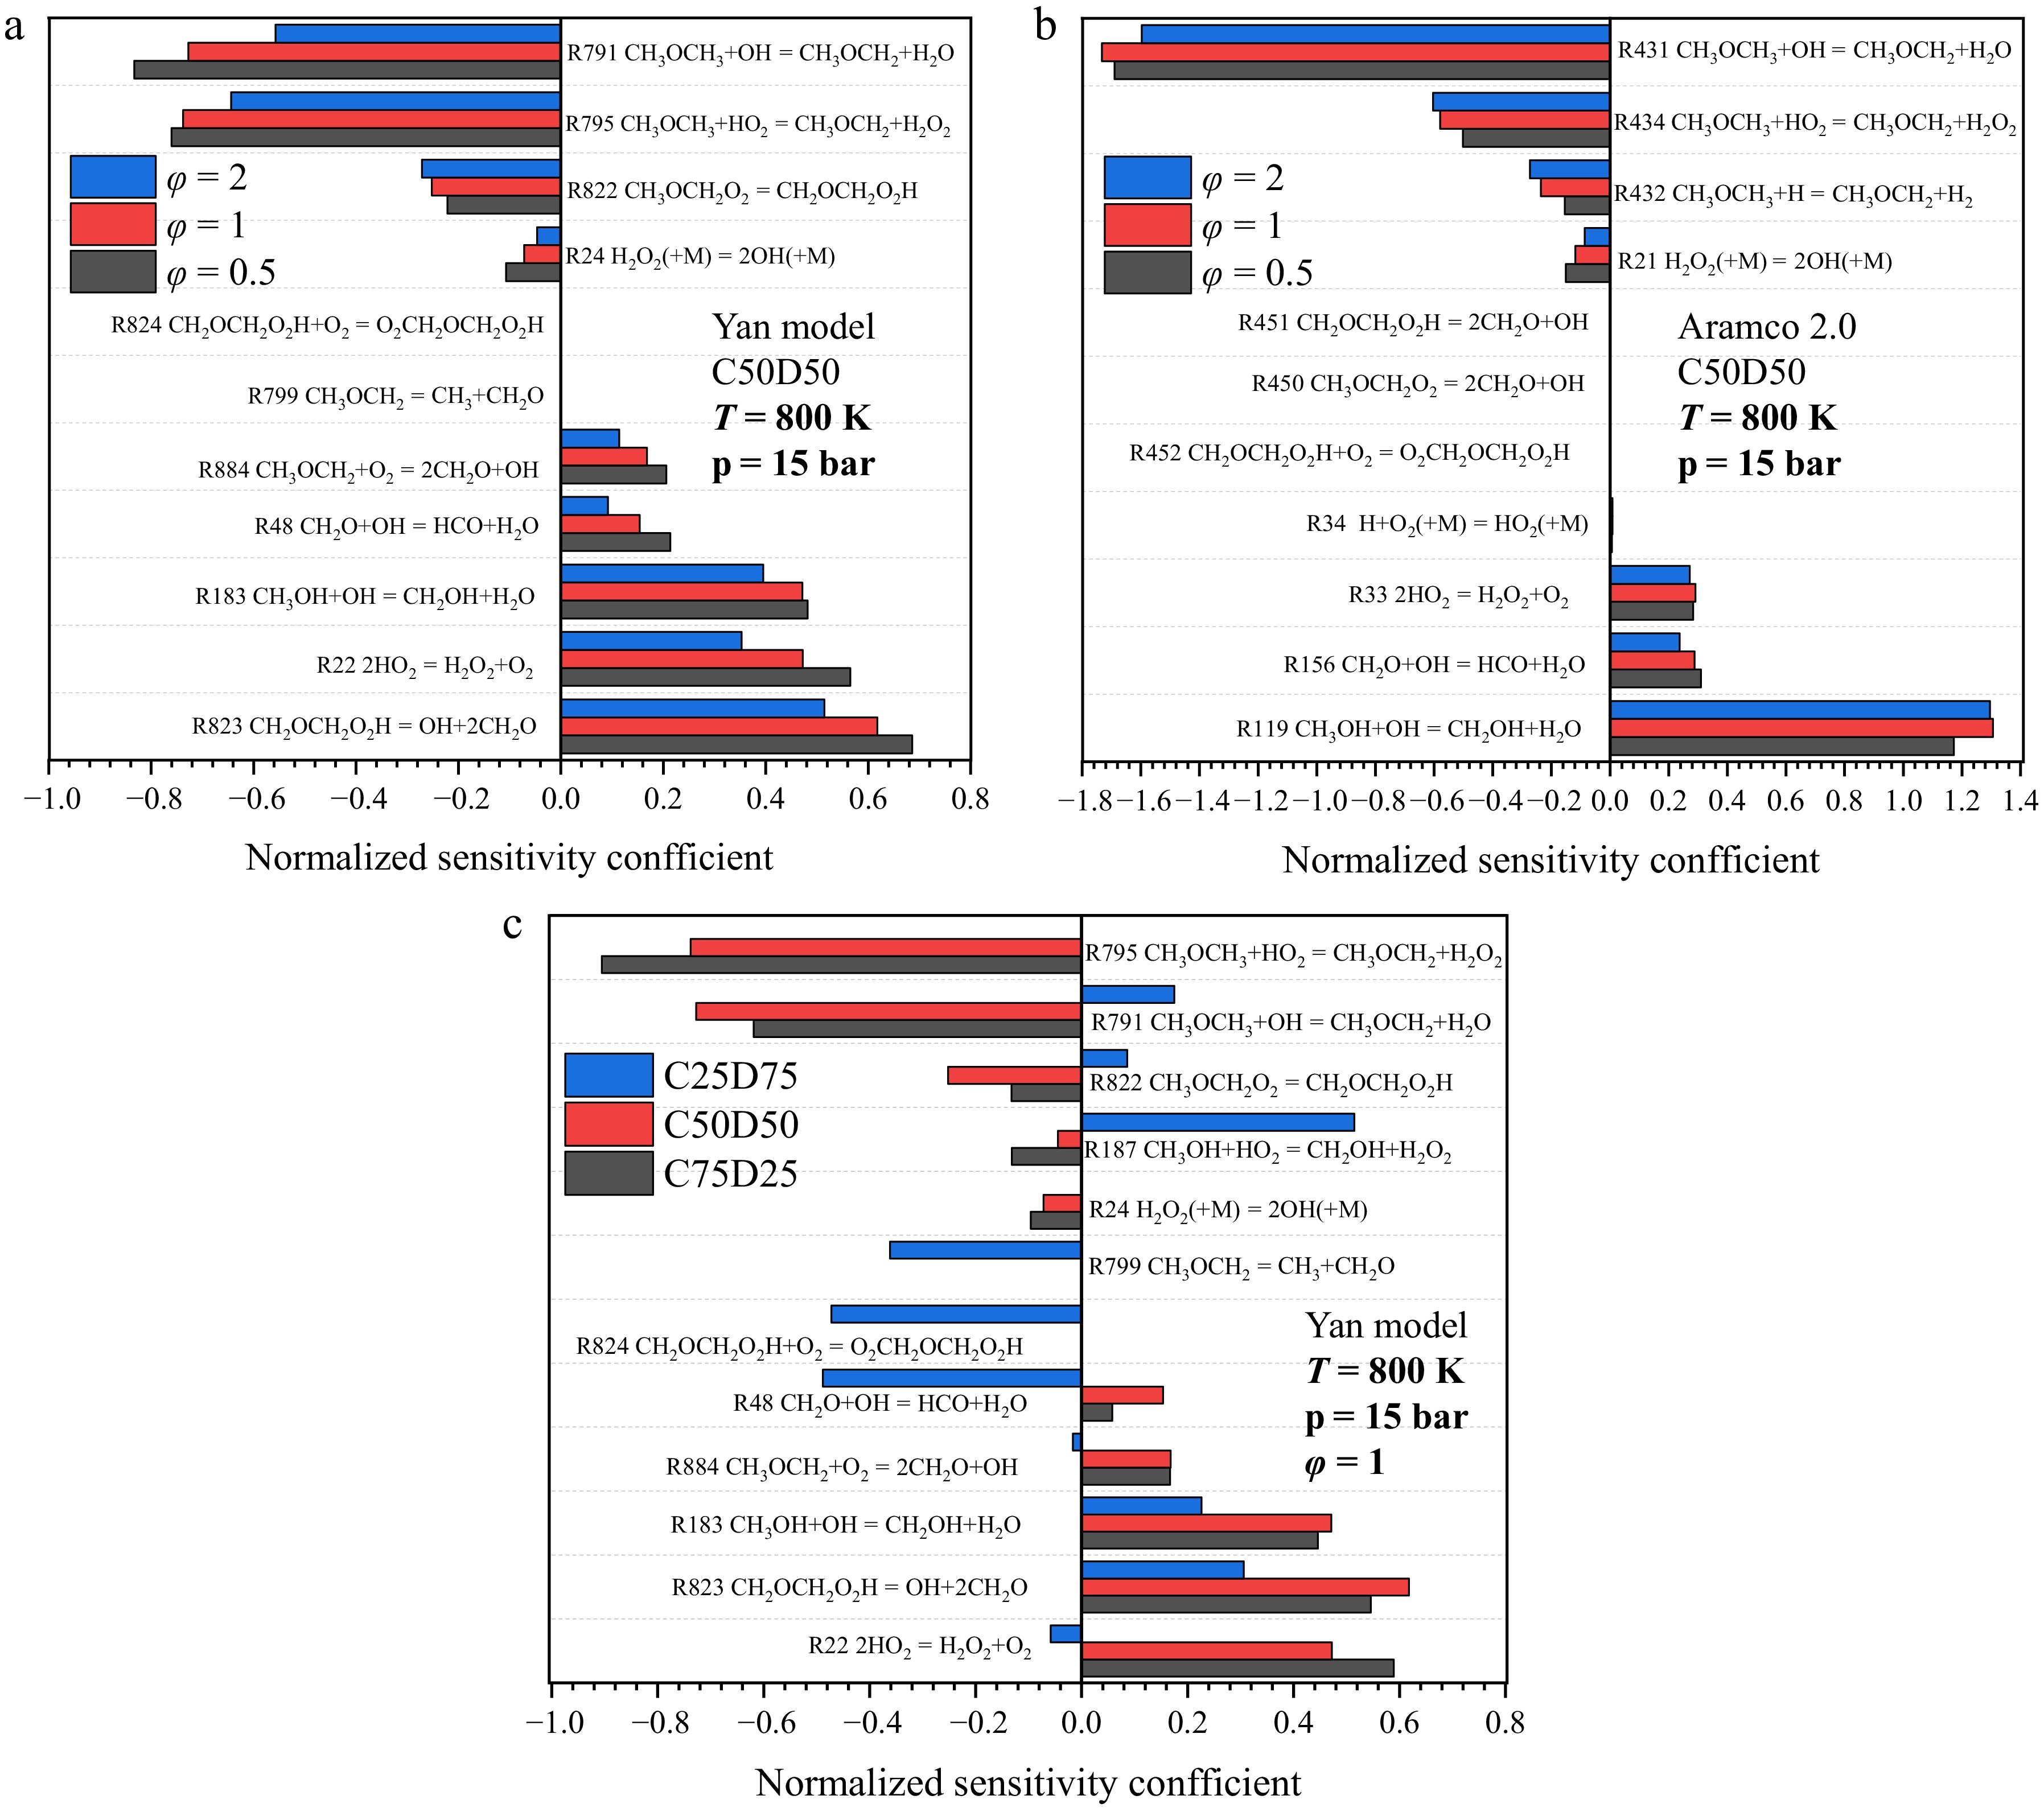
Figure 3.
Sensitivity analyses of the (a) Yan model, and (b) Wang model under different equivalence ratios. (c) Sensitivity analysis of the Yan model under different blending ratios.
-
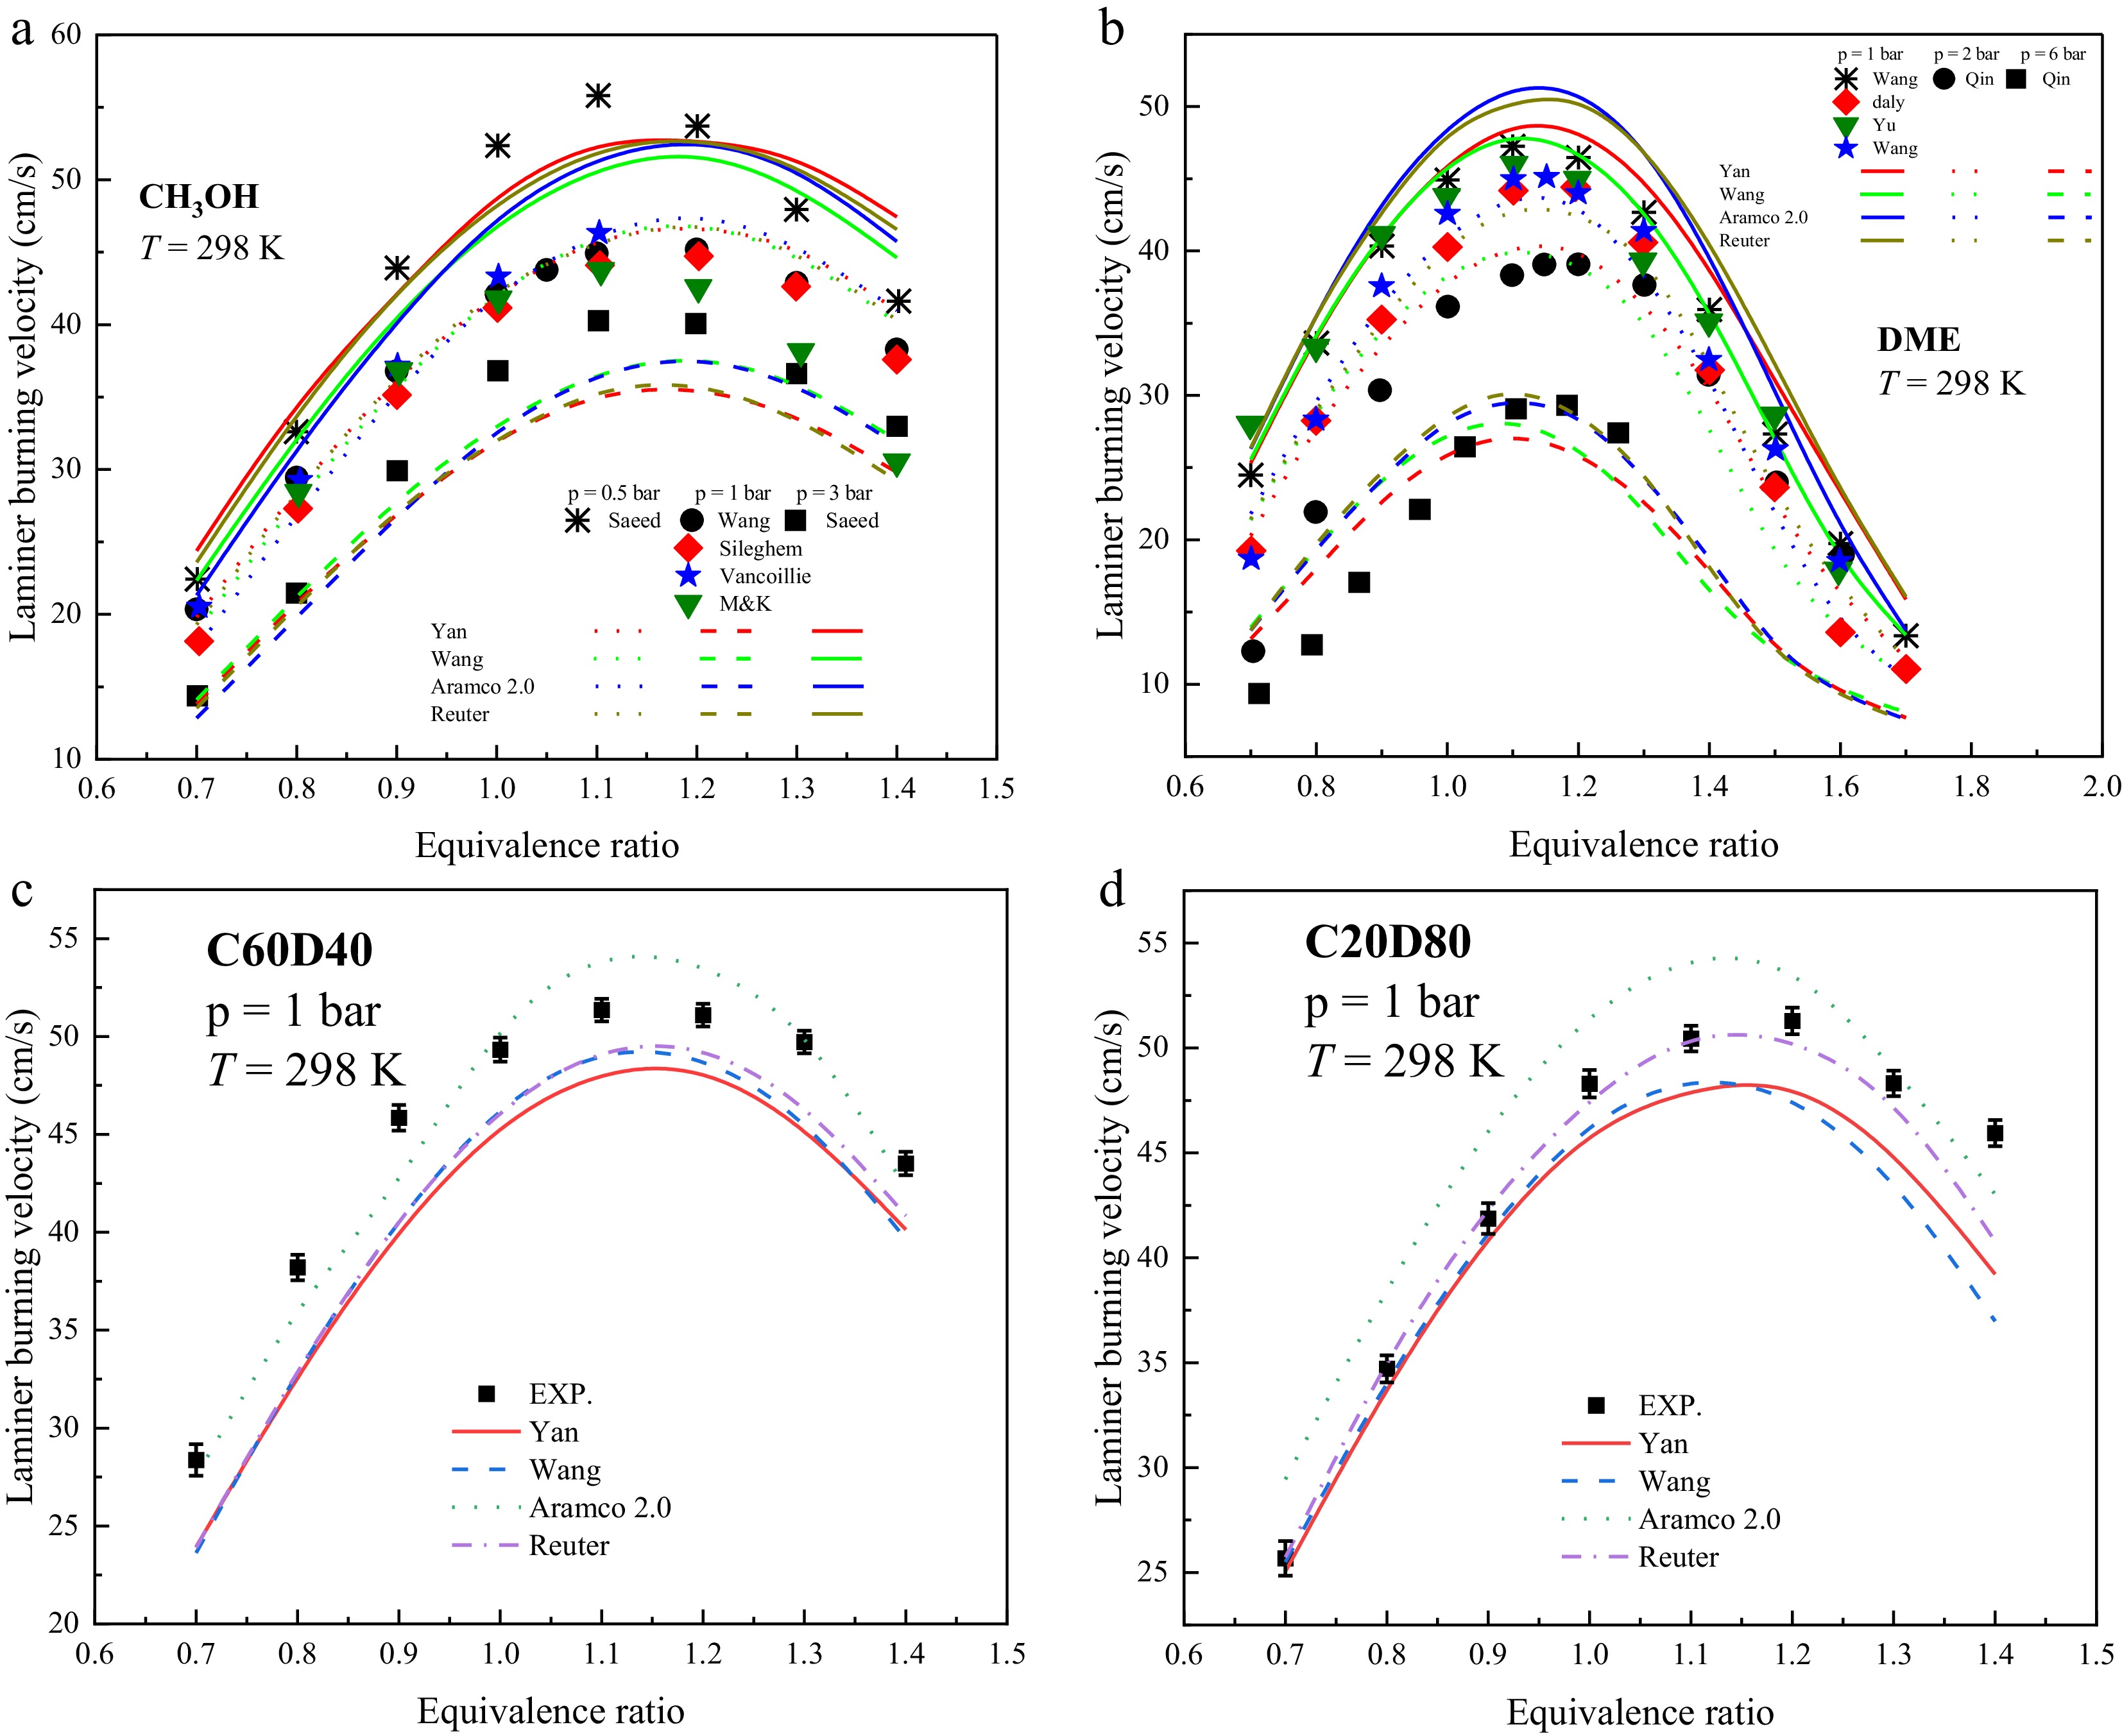
Figure 4.
Variation of LBV of methanol and DME with equivalence ratio: Experimental data (symbols) vs simulation results from various models (lines).
-
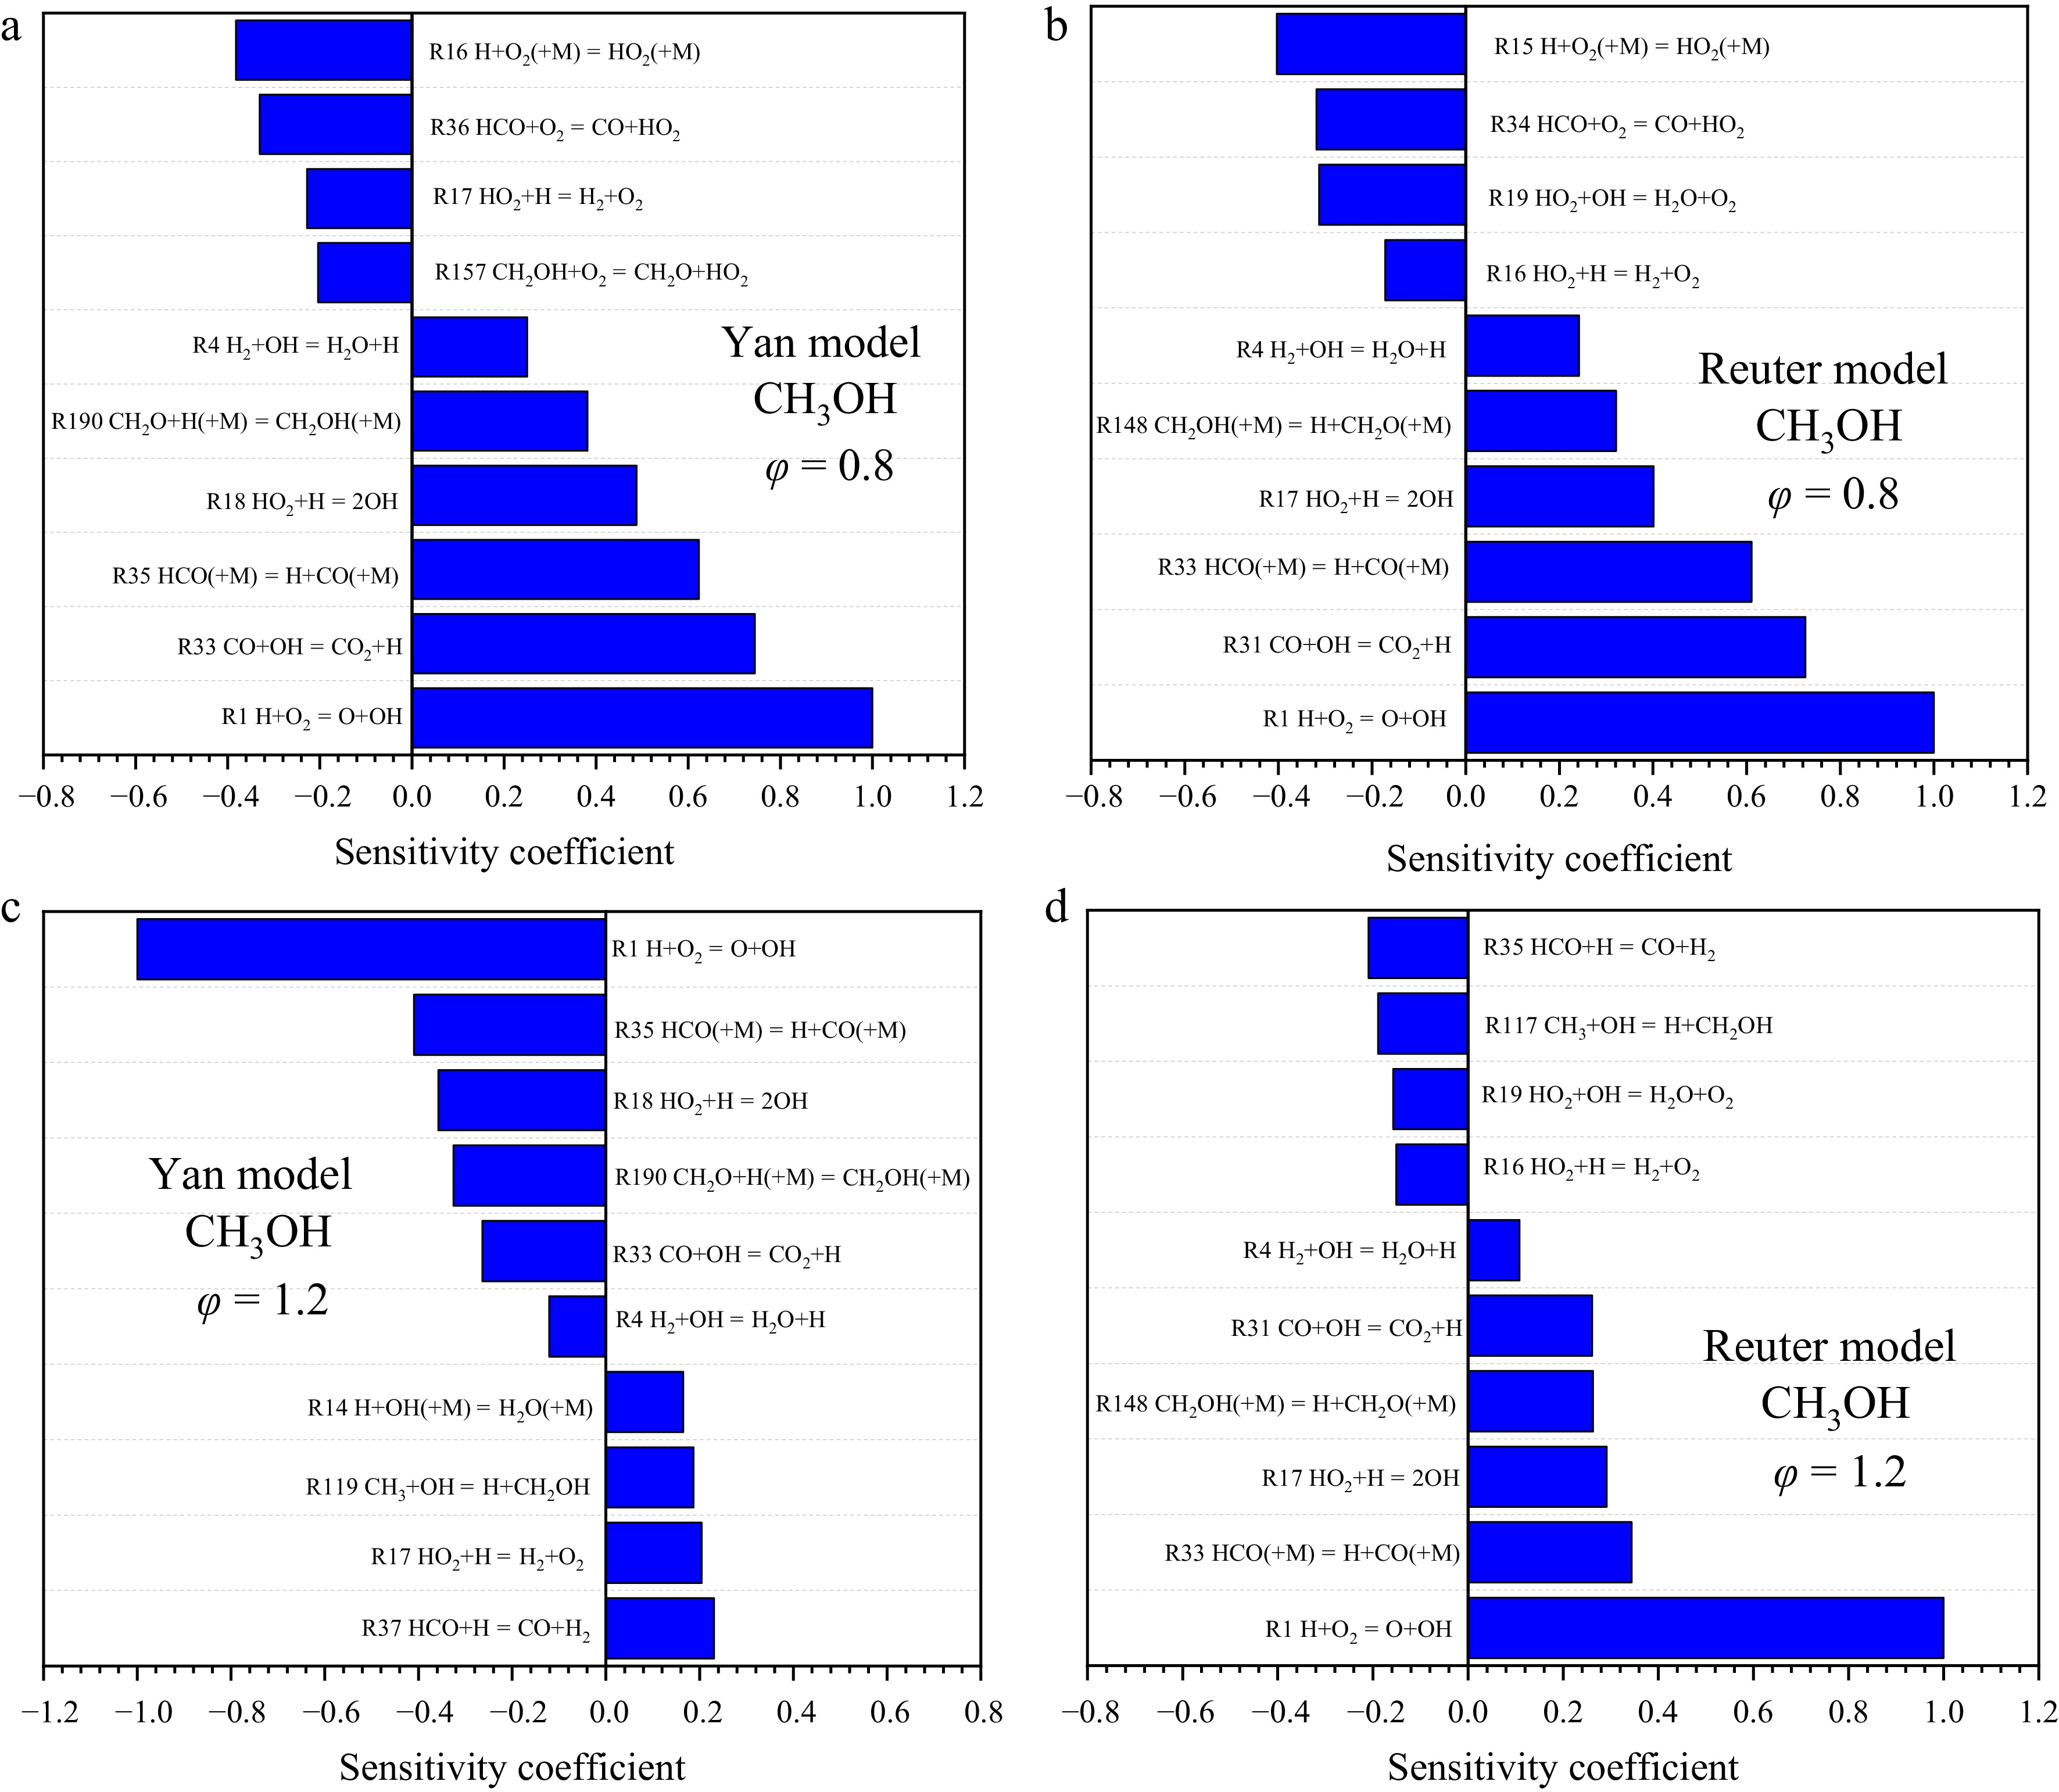
Figure 5.
Sensitivity analysis of the Yan and Reuter models at different equivalence ratios.
-
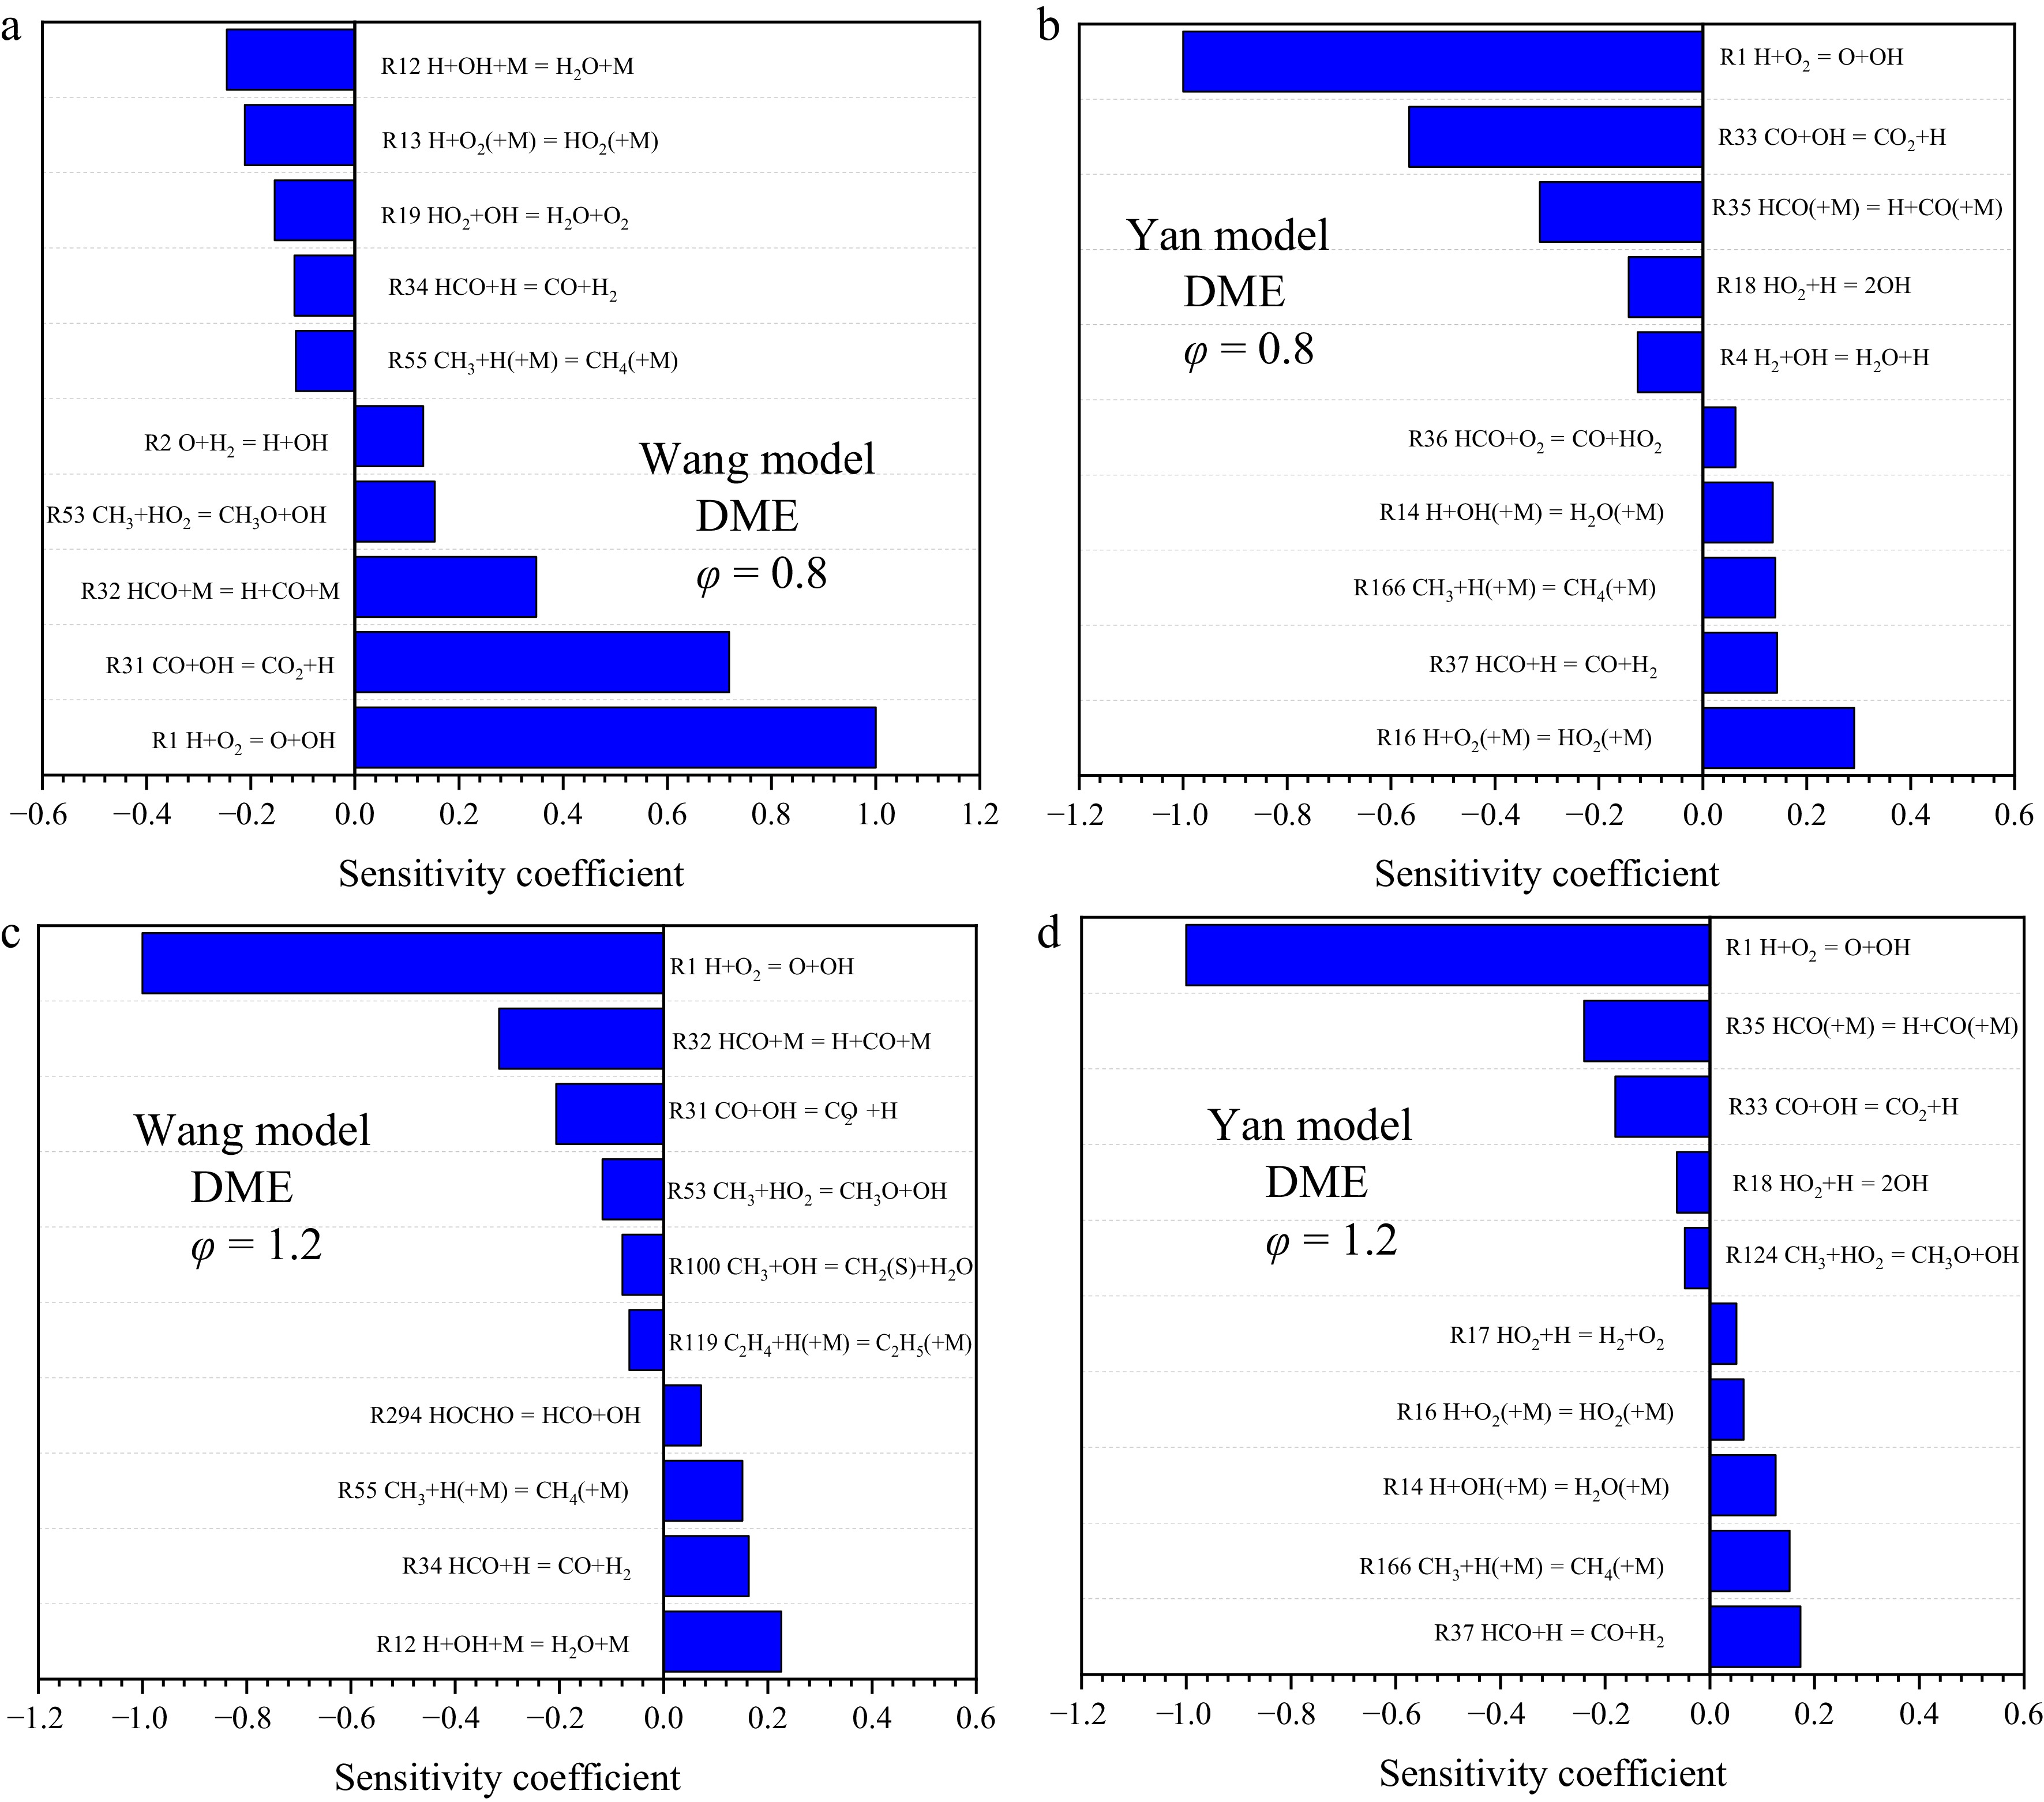
Figure 6.
Sensitivity analysis of the Wang and Yan models at different equivalence ratios.
-
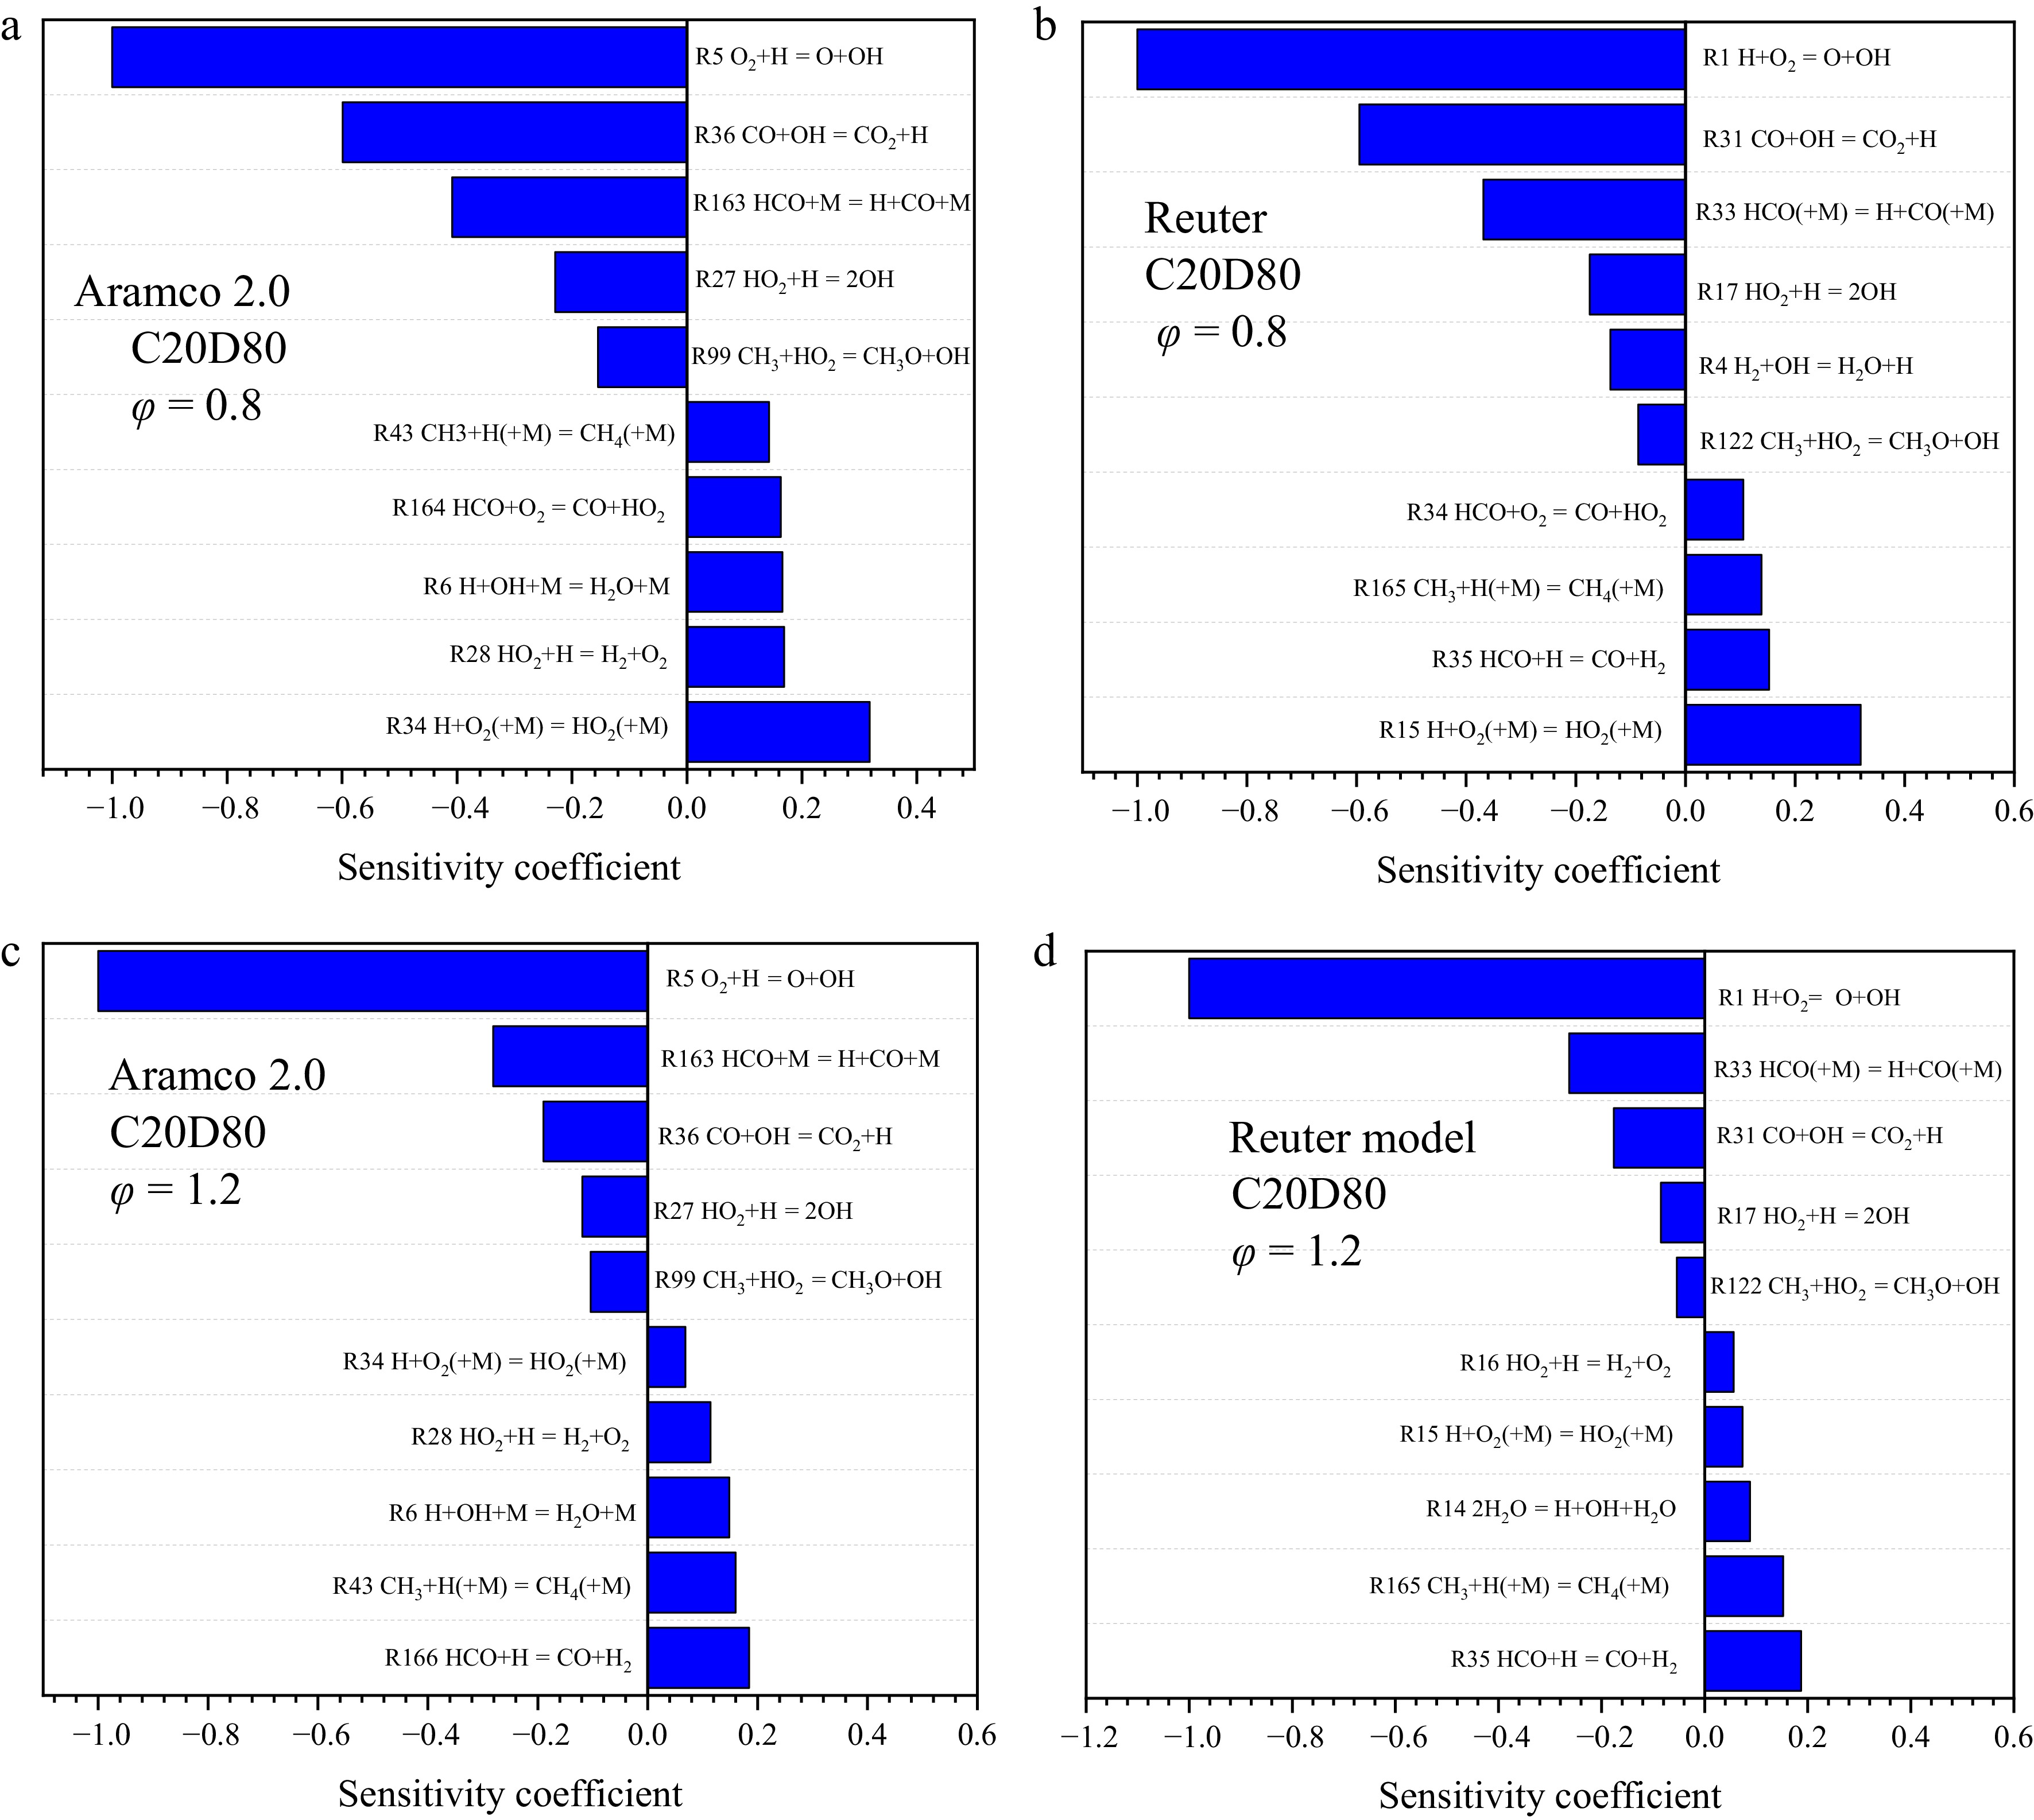
Figure 7.
Sensitivity analysis of the Aramco 2.0 and Reuter models at different equivalence ratios.
-
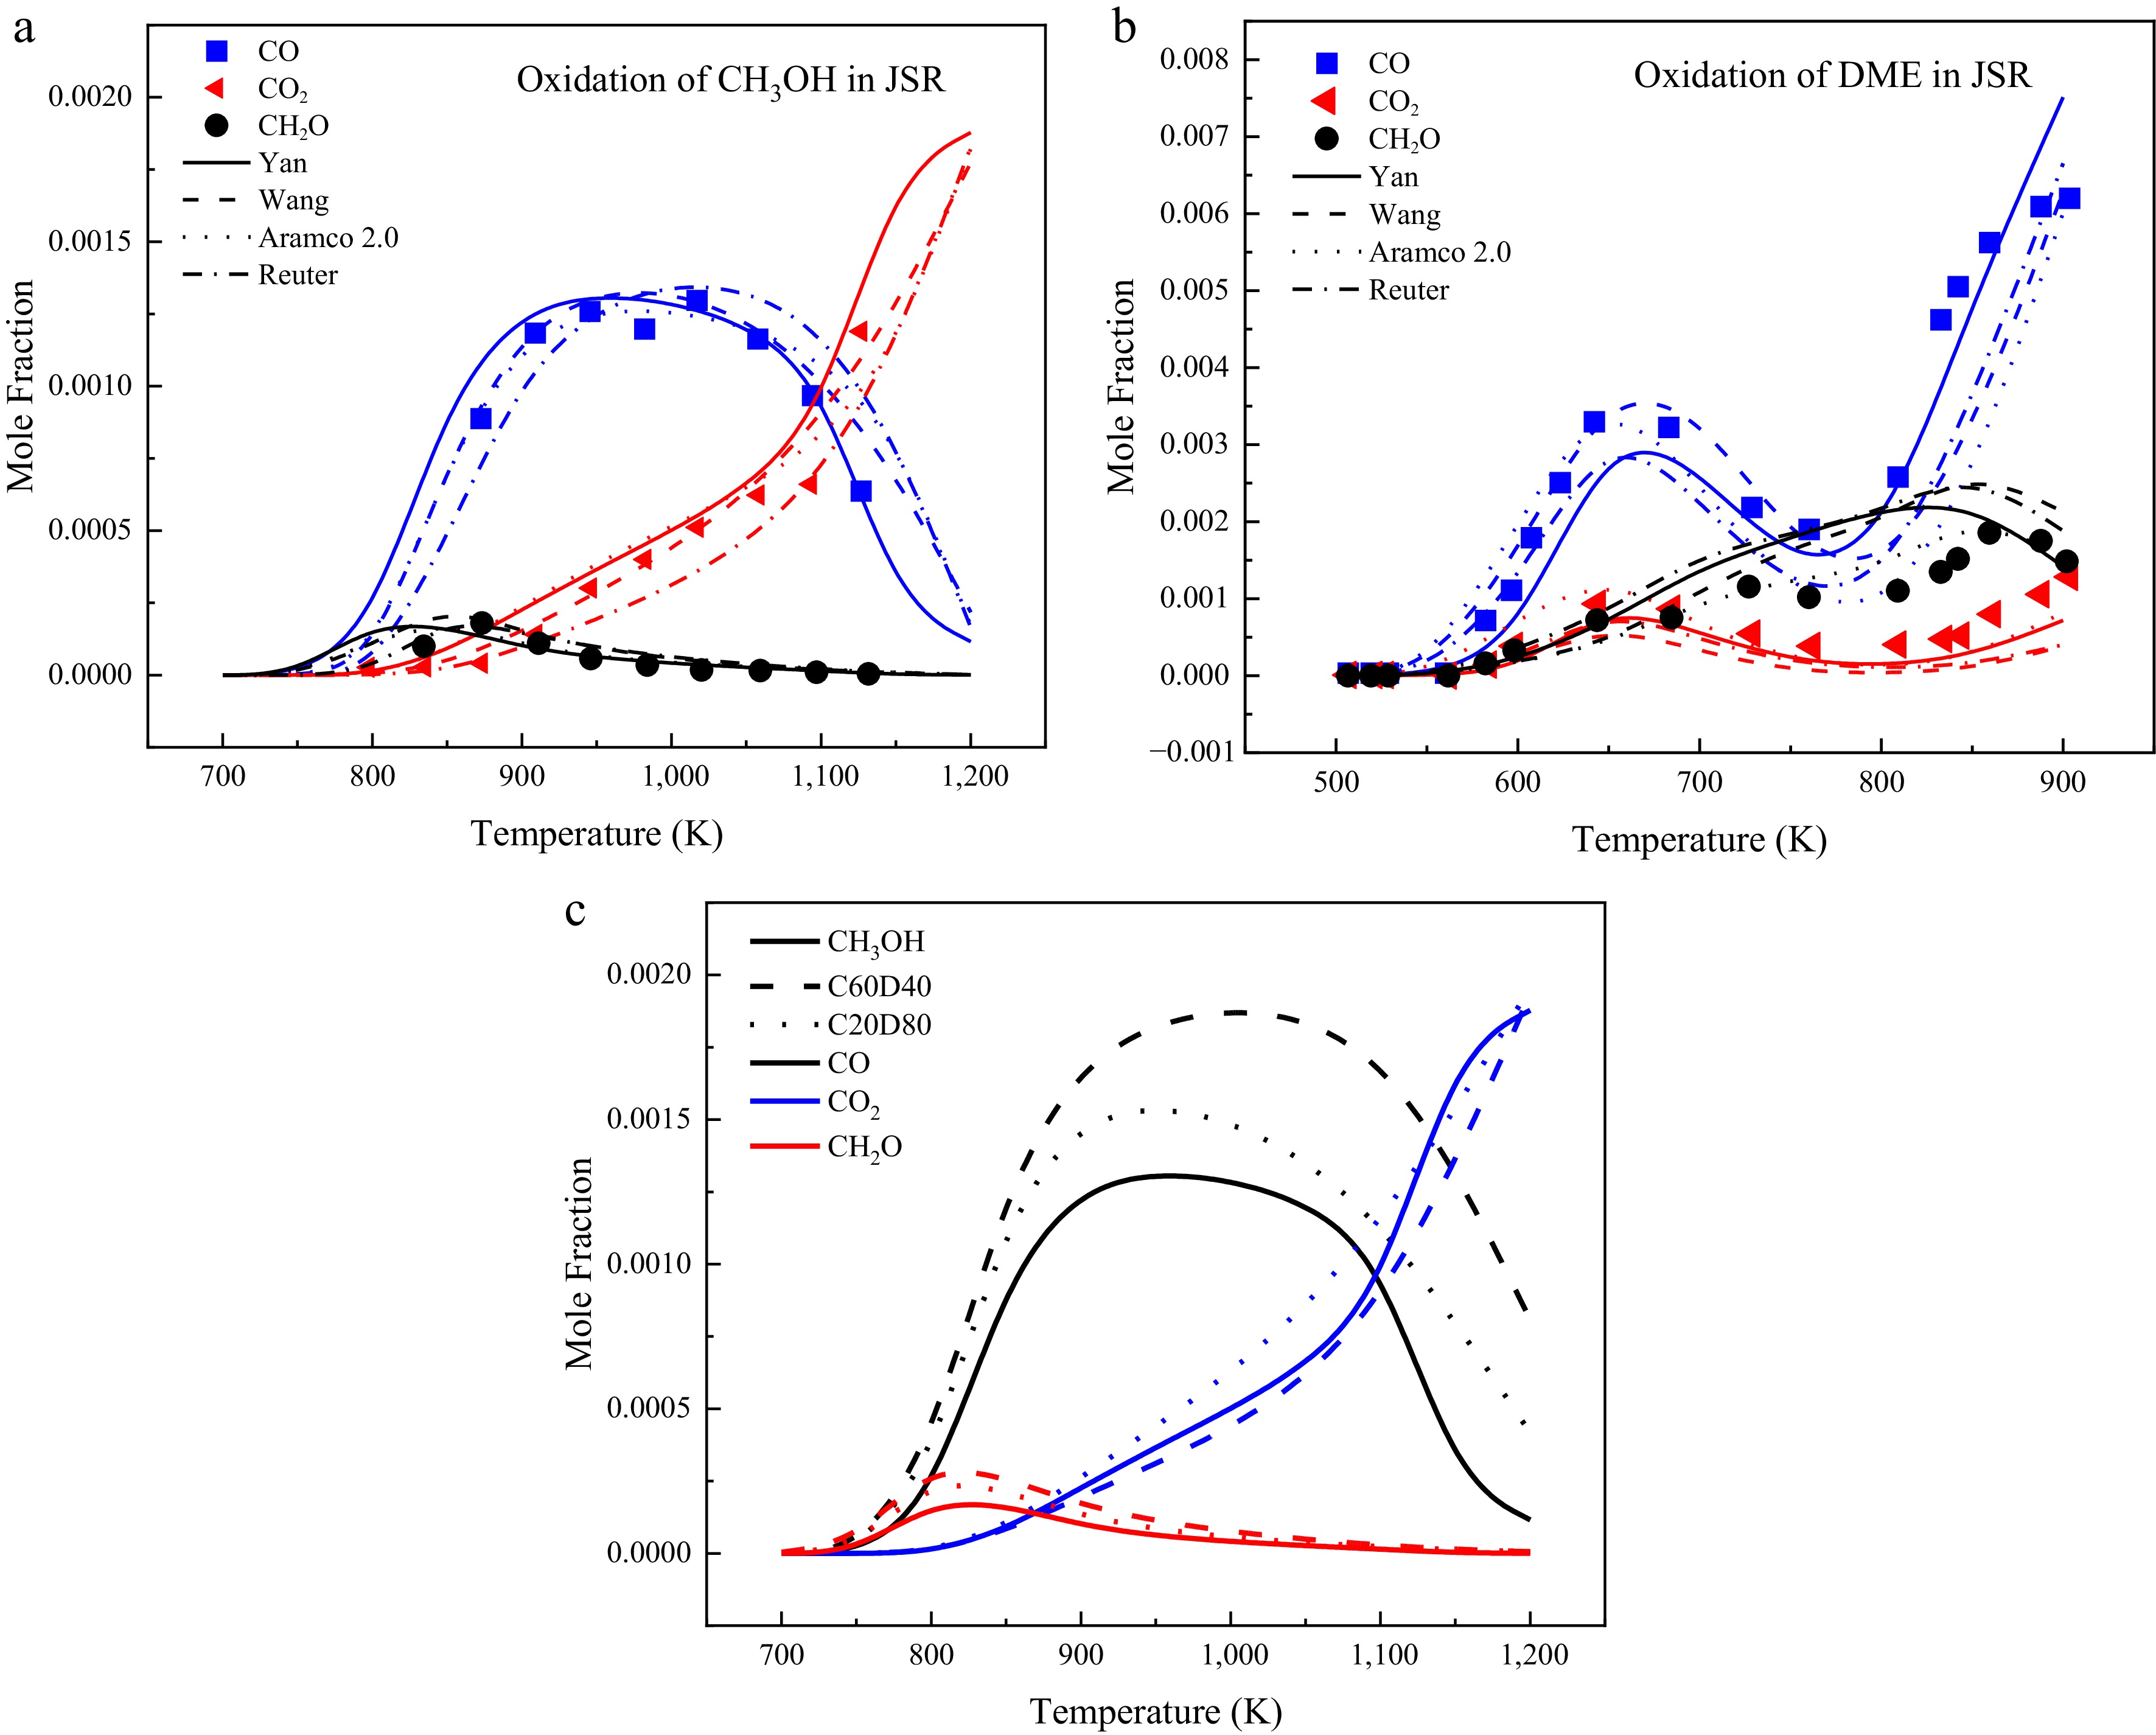
Figure 8.
Key species analysis for methanol/DME oxidation. (a), (b) Temperature dependence of species concentrations: Experimental data (symbols) vs simulation results from various models (lines). (c) Variations in species concentration with temperature under different blending ratios with the Yan mechanism.
-
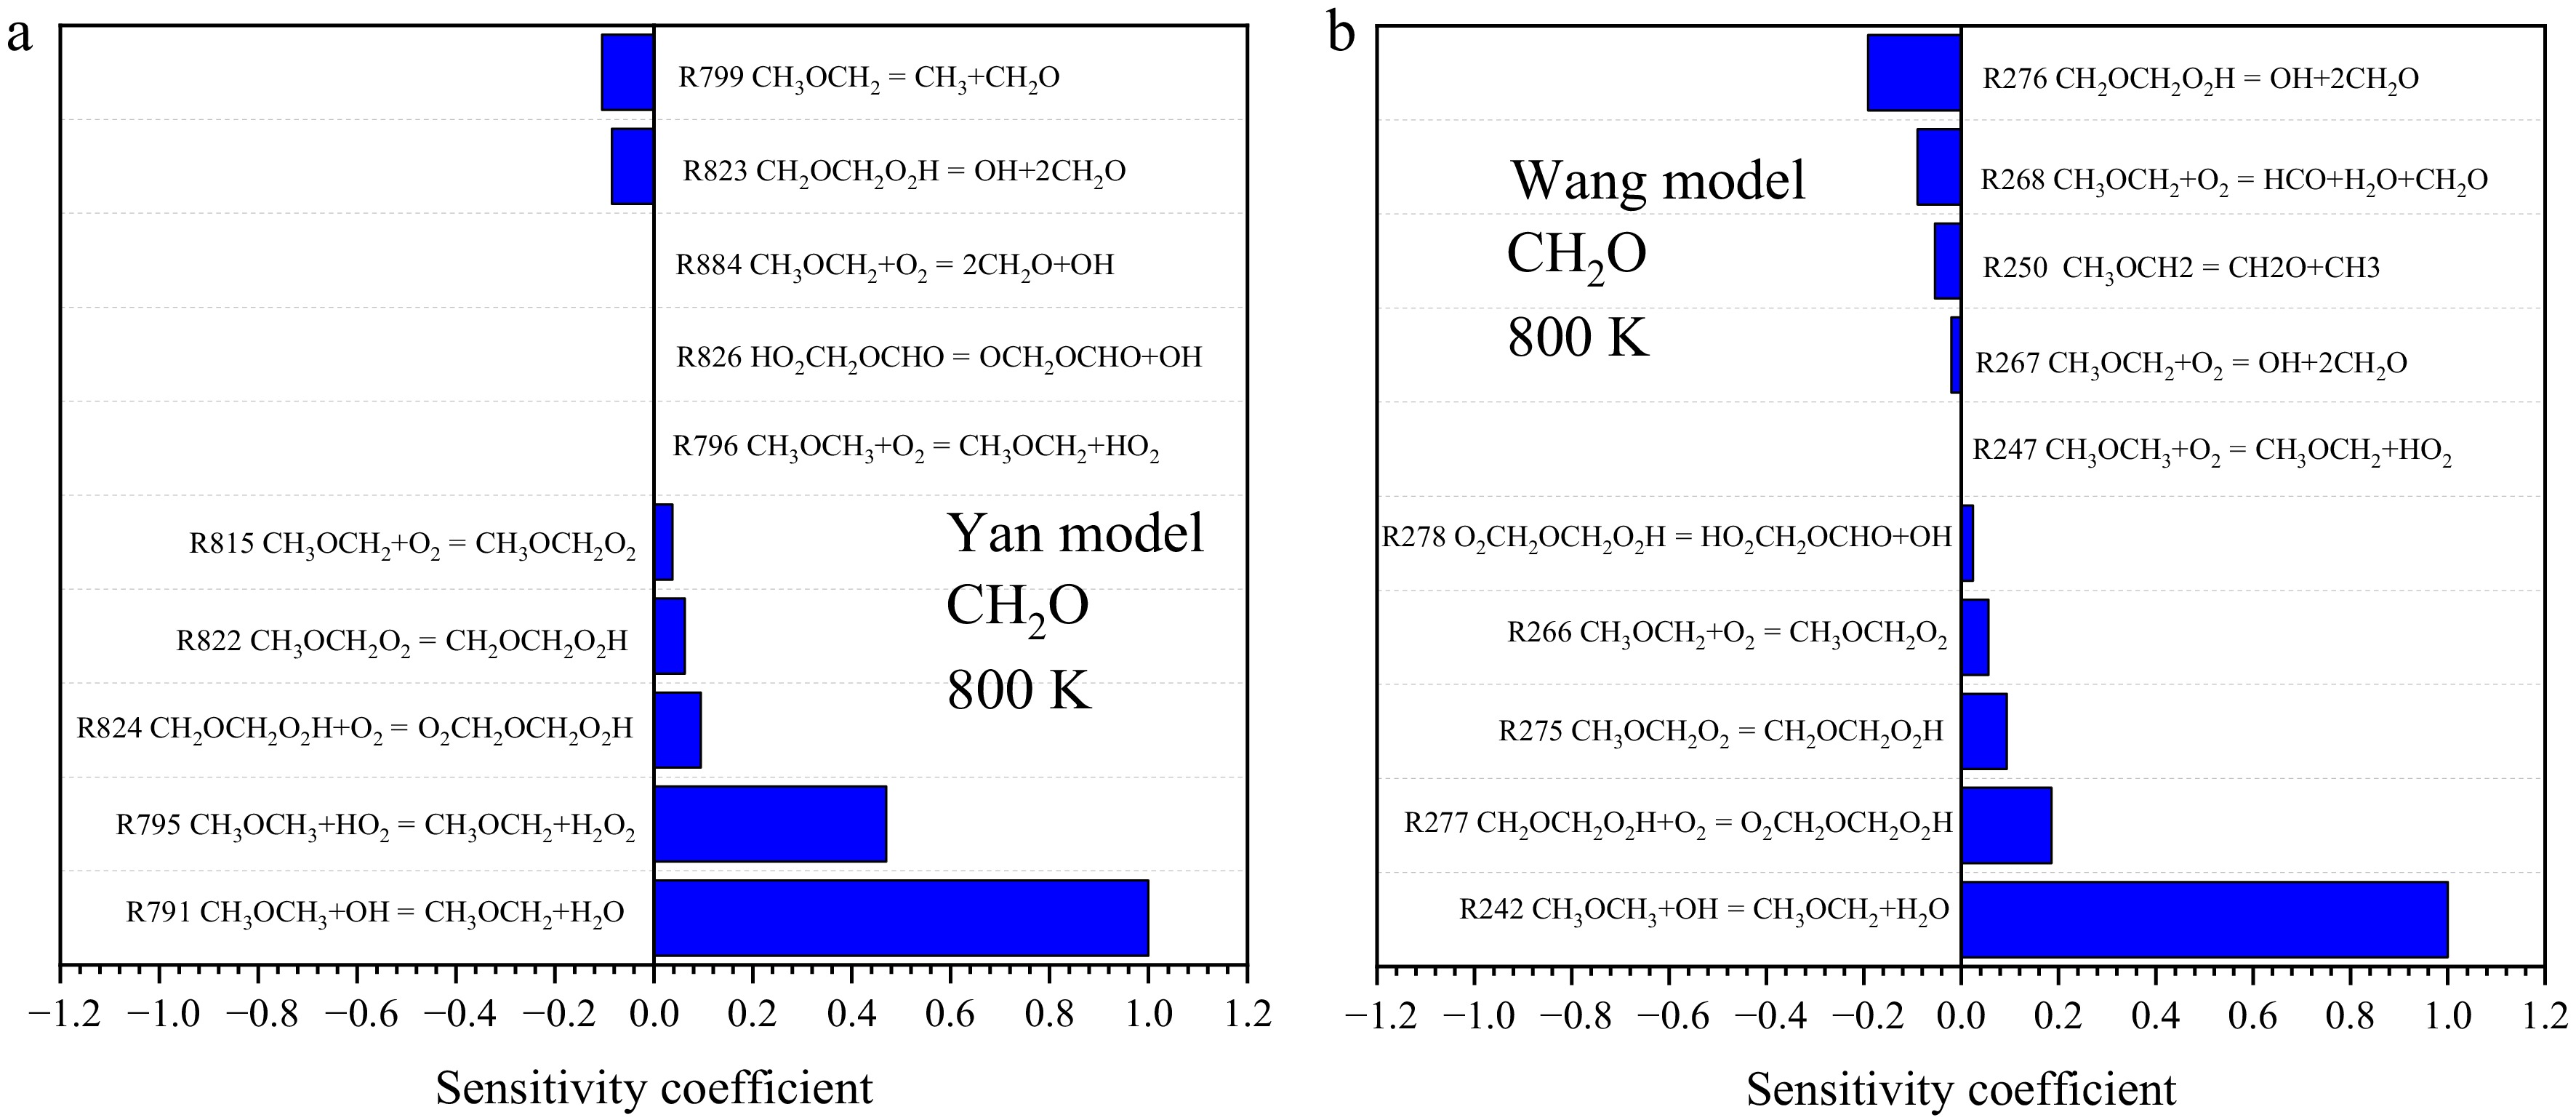
Figure 9.
Sensitivity analysis of different models. (a) Sensitivity analysis of CH2O by Yan model, (b) sensitivity analysis of CH2O by Wang model.
-
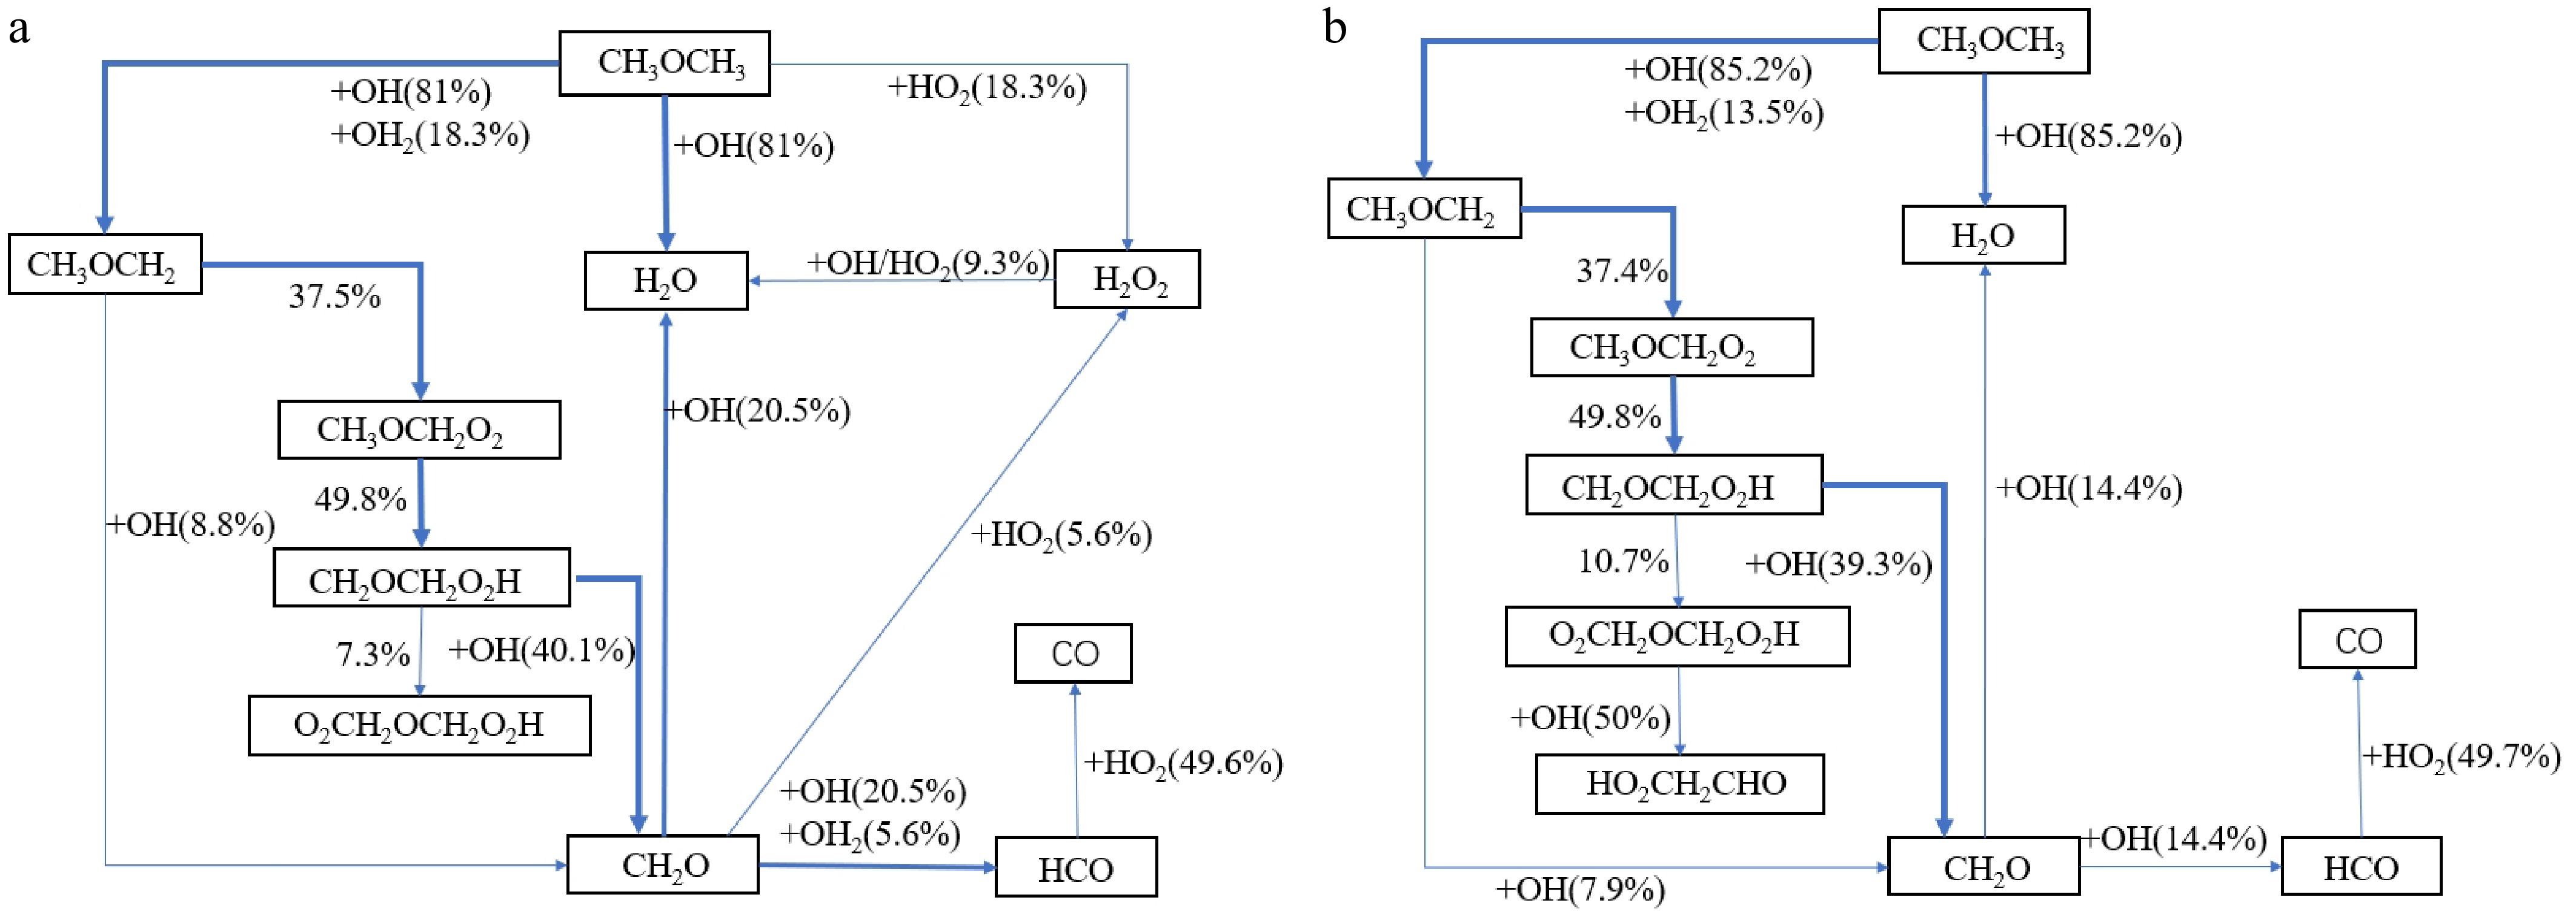
Figure 10.
Reaction pathway analysis of different models. (a) Reaction path analysis of Yan model, (b) reaction path analysis of Wang model.
-
Model Species Reactions Fuel system Methods/objects Conditions Year Ref. Yan 130 894 DME SP-JSR/species T = 400–900 K, p = 10, 100 atm, φ = 0.175–1.72,
t = 0.1–1 s2022 [19] Aramco 2.0 176 2,716 CH4/DME RCM/IDT; ST/IDT T = 600–1,600 K, p = 7–41 bar, φ = 0.3–2.0, CH4, DME, CH4/DME = 80/20, 60/40 2014 [20] Wang 78 301 DME JSR/species; Laminar flow reactor/species T = 400–1,160 K, p = 1–40 atm, φ = 0.6–1.2 2014 [21] Hashemi 102 894 CH4/DME Laminar flow reactor/species; LBV T = 450–900 K, p = 1–100 bar, φ = 0.06–20,
t = 4–22 s, χDME = 1.8%–3.6%, 100%2019 [22] Pelucchi 356 10,171 toluene/n-heptane Theory and modeling/rate constants and model validation; ST, RCM/IDT; JSR/species; Flame speed measurements/LFS T = 300–2,500 K, p = 0.1–1,000 bar, φ = 0.2–5.0 2018 [24] Reuter 130 893 CH4/DME Counterflow burner/flames p = 0.1 MPa, φ = 0.25–1.5,
χDME = 0%–100%2018 [23] Table 1.
Basic information on the model referenced.
-
Fuel/oxidizer Methods Specified initial conditions Date used in the study Year Ref. Methanol/DME/O2/N2 RCM T = 585–910 K, p = 15–30 bar, φ = 0.5–2 IDT 2018 Wang et al.[17] Methanol/DME/air HFM T = 298 K, p = 1 atm, φ = 0.7–1.4 LBV 2025 This study Methanol/air HFM T = 298 K, p = 1 atm, φ = 0.7–1.4 LBV 2021 Wang et al.[34] Methanol/air CVCC T = 298–425 K, p = 0.5–3.5 bar, φ = 0.8–1.6 LBV 2004 Saeed et al.[35] Methanol/air HFM T = 298–358 K, p = 1 bar, φ = 0.7–1.5 LBV 2014 Sileghem et al.[36] Methanol/air HFM T = 298–358 K, p = 1 bar, φ = 0.7–1.5 LBV 2012 Vancoillie et al.[37] Methanol/air CVCC T = 298–700 K, p = 0.4–50 atm, φ = 0.8–1.5 LBV 1982 Metghalchi et al.[38] DME/air HFM T = 298 K, p = 1 atm, φ = 0.7–1.7 LBV 2018 Wang et al.[39] DME/air CVCC T = 298 K, p = 1–10 atm, φ = 0.7–1.6 LBV 2005 Qin et al.[40] DME/air CVCC T = 303–493 K, p = 0.1 MPa, φ = 0.7–1.6 LBV 2015 Yu et al.[41] DME/air CVCC T = 295 K, p = 1 bar, φ = 0.7–1.7 LBV 2001 Daly et al.[42] DME/air Counterflow burner p = 0.1 MPa LBV 2009 Wang et al.[43] Methanol/O2/N2 JSR T = 700–1,200 K, p = 10 atm, φ = 1, t = 0.05 s Concentration of
CH2O, CO, CO22016 Burke et al.[44] DME/O2/N2 JSR T = 500–900 K, p = 10 atm, φ = 0.175, t = 0.12–0.07 s Concentration of
CH2O, CO, CO22022 Yan et al.[19] Table 2.
Experimental data used in the study.
Figures
(10)
Tables
(2)