-
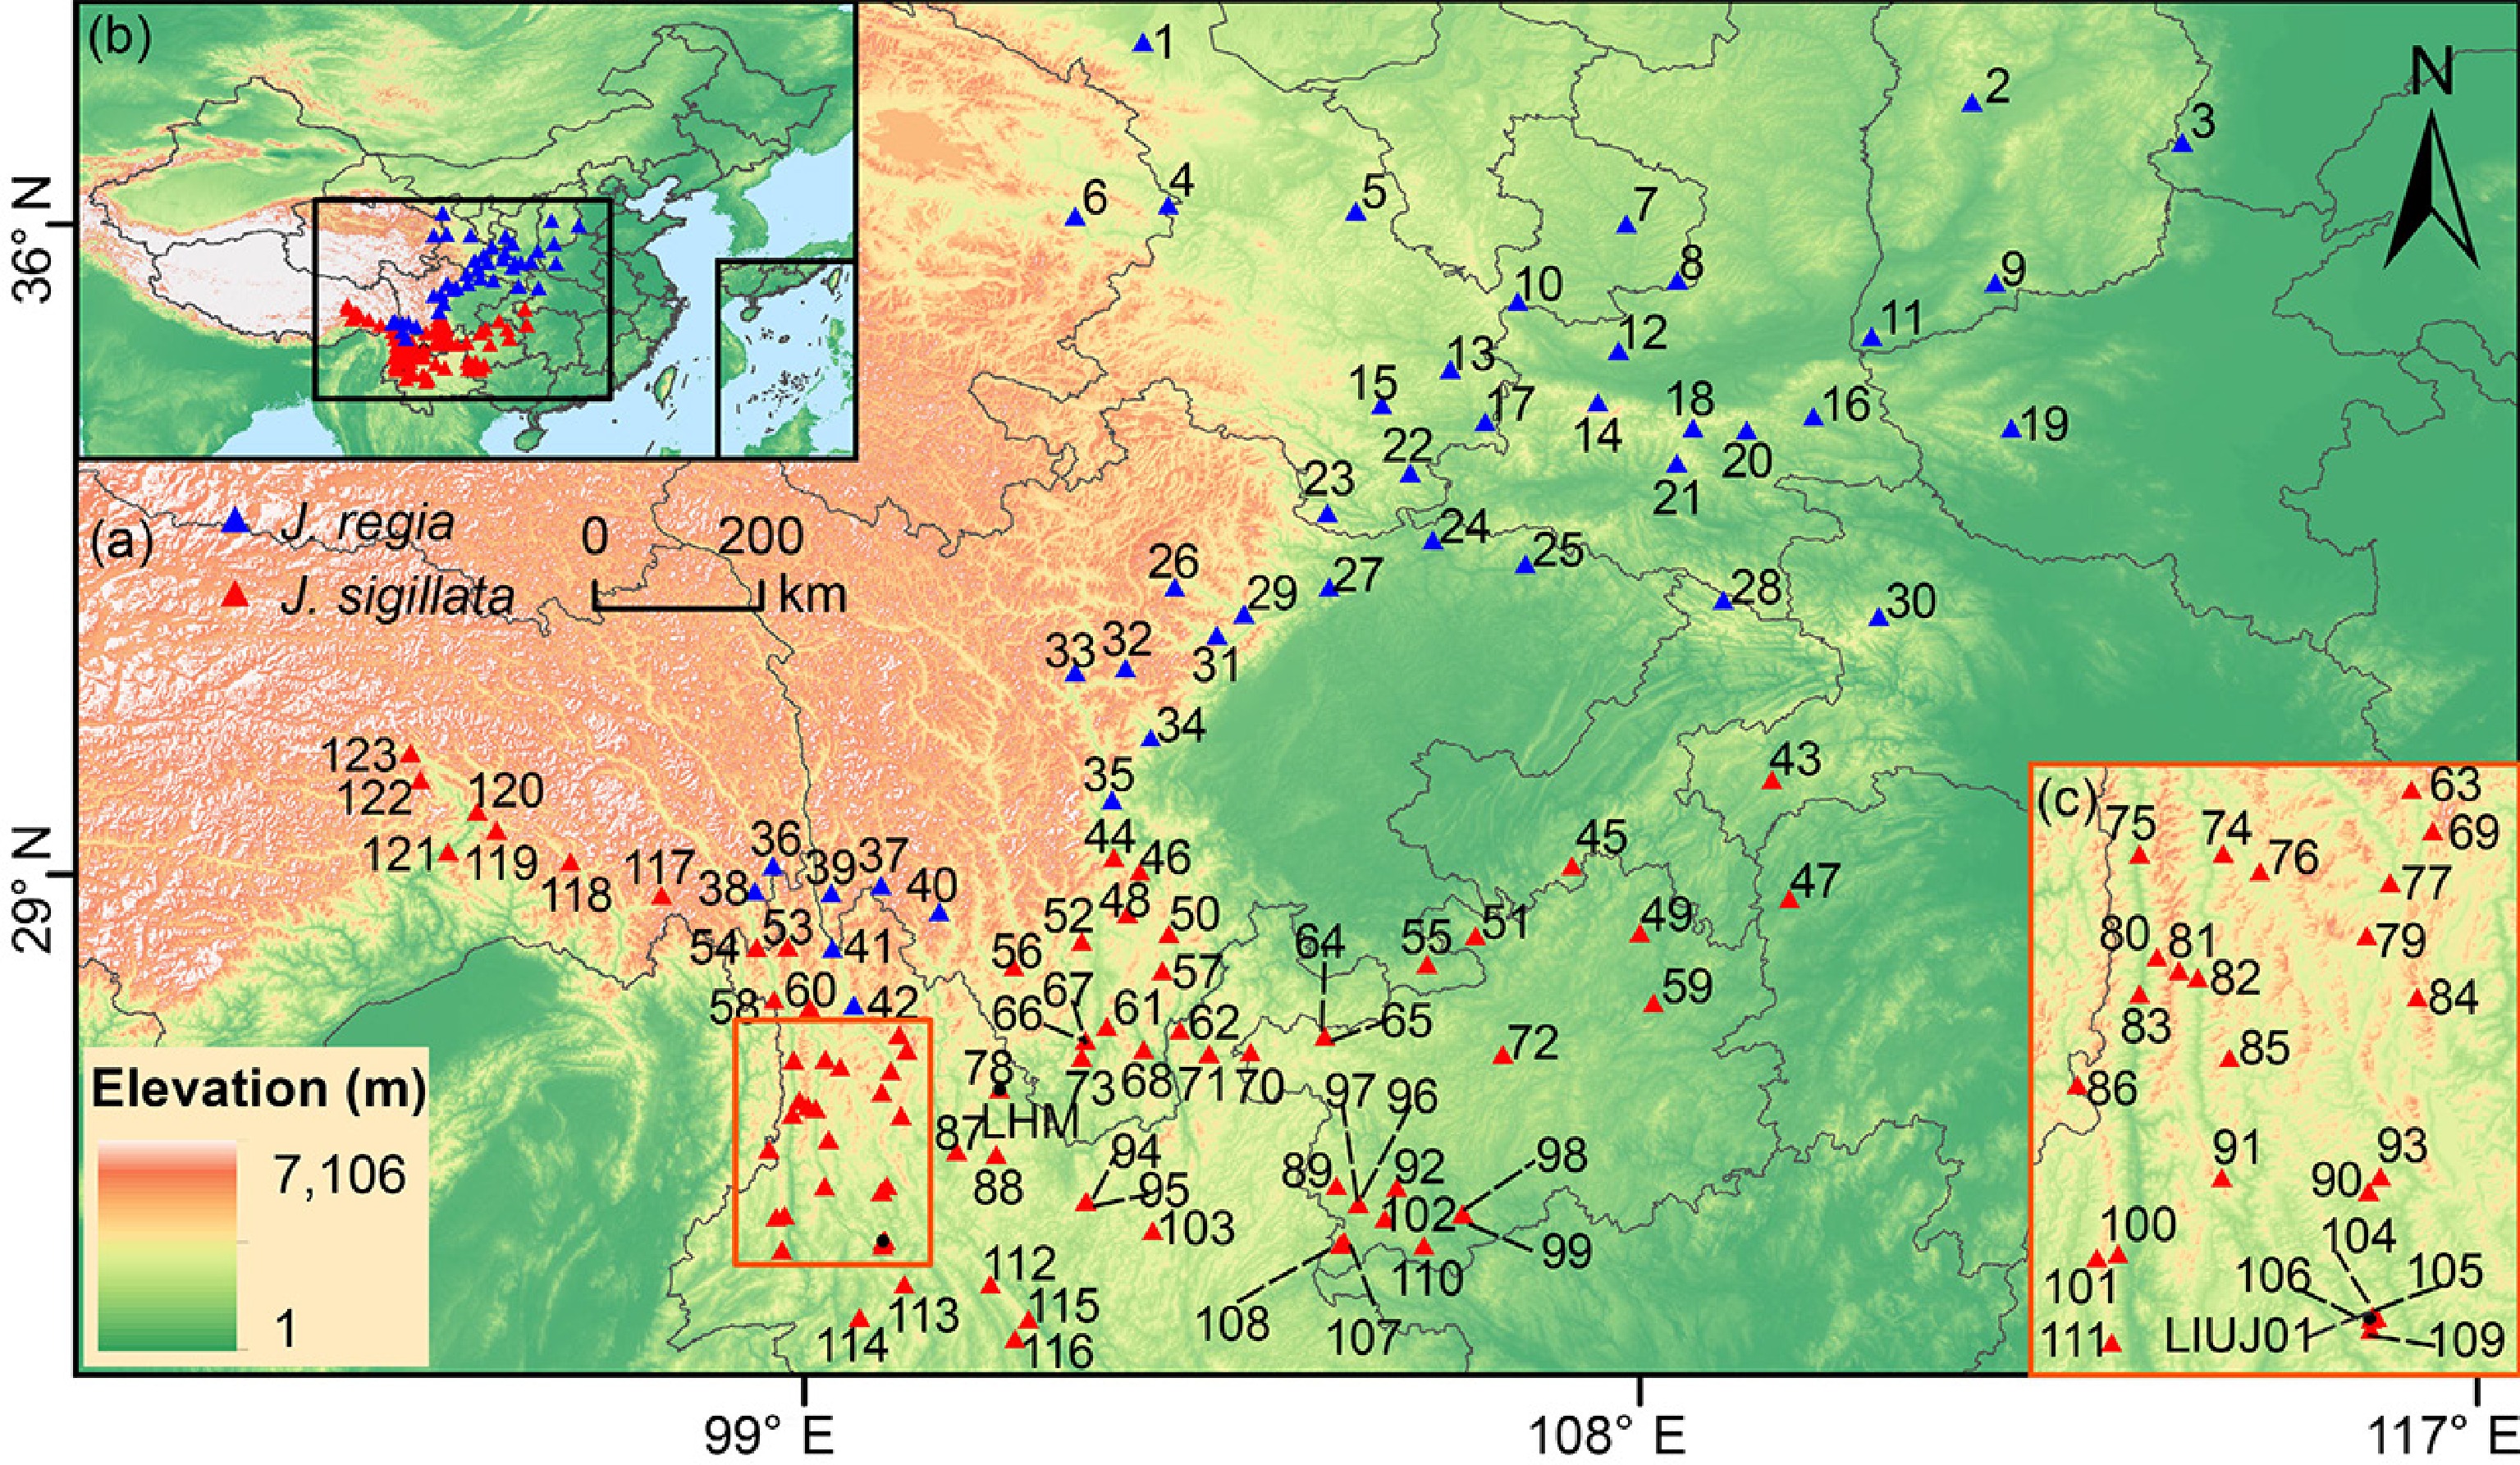
Figure 1.
Geographical distribution of 123 populations studied in this study. (a) Sampling sites of Juglans regia and J. sigillata populations in northern and southwestern China. (b) Geographical location of study region in Asia. (c) Sampling sites of J. sigillata in the Three Parallel Rivers region. The numbers in the map represent populations IDs (Supplementary Table S1). Blue triangles represent J. regia populations; red triangles indicate J. sigillata populations.
-
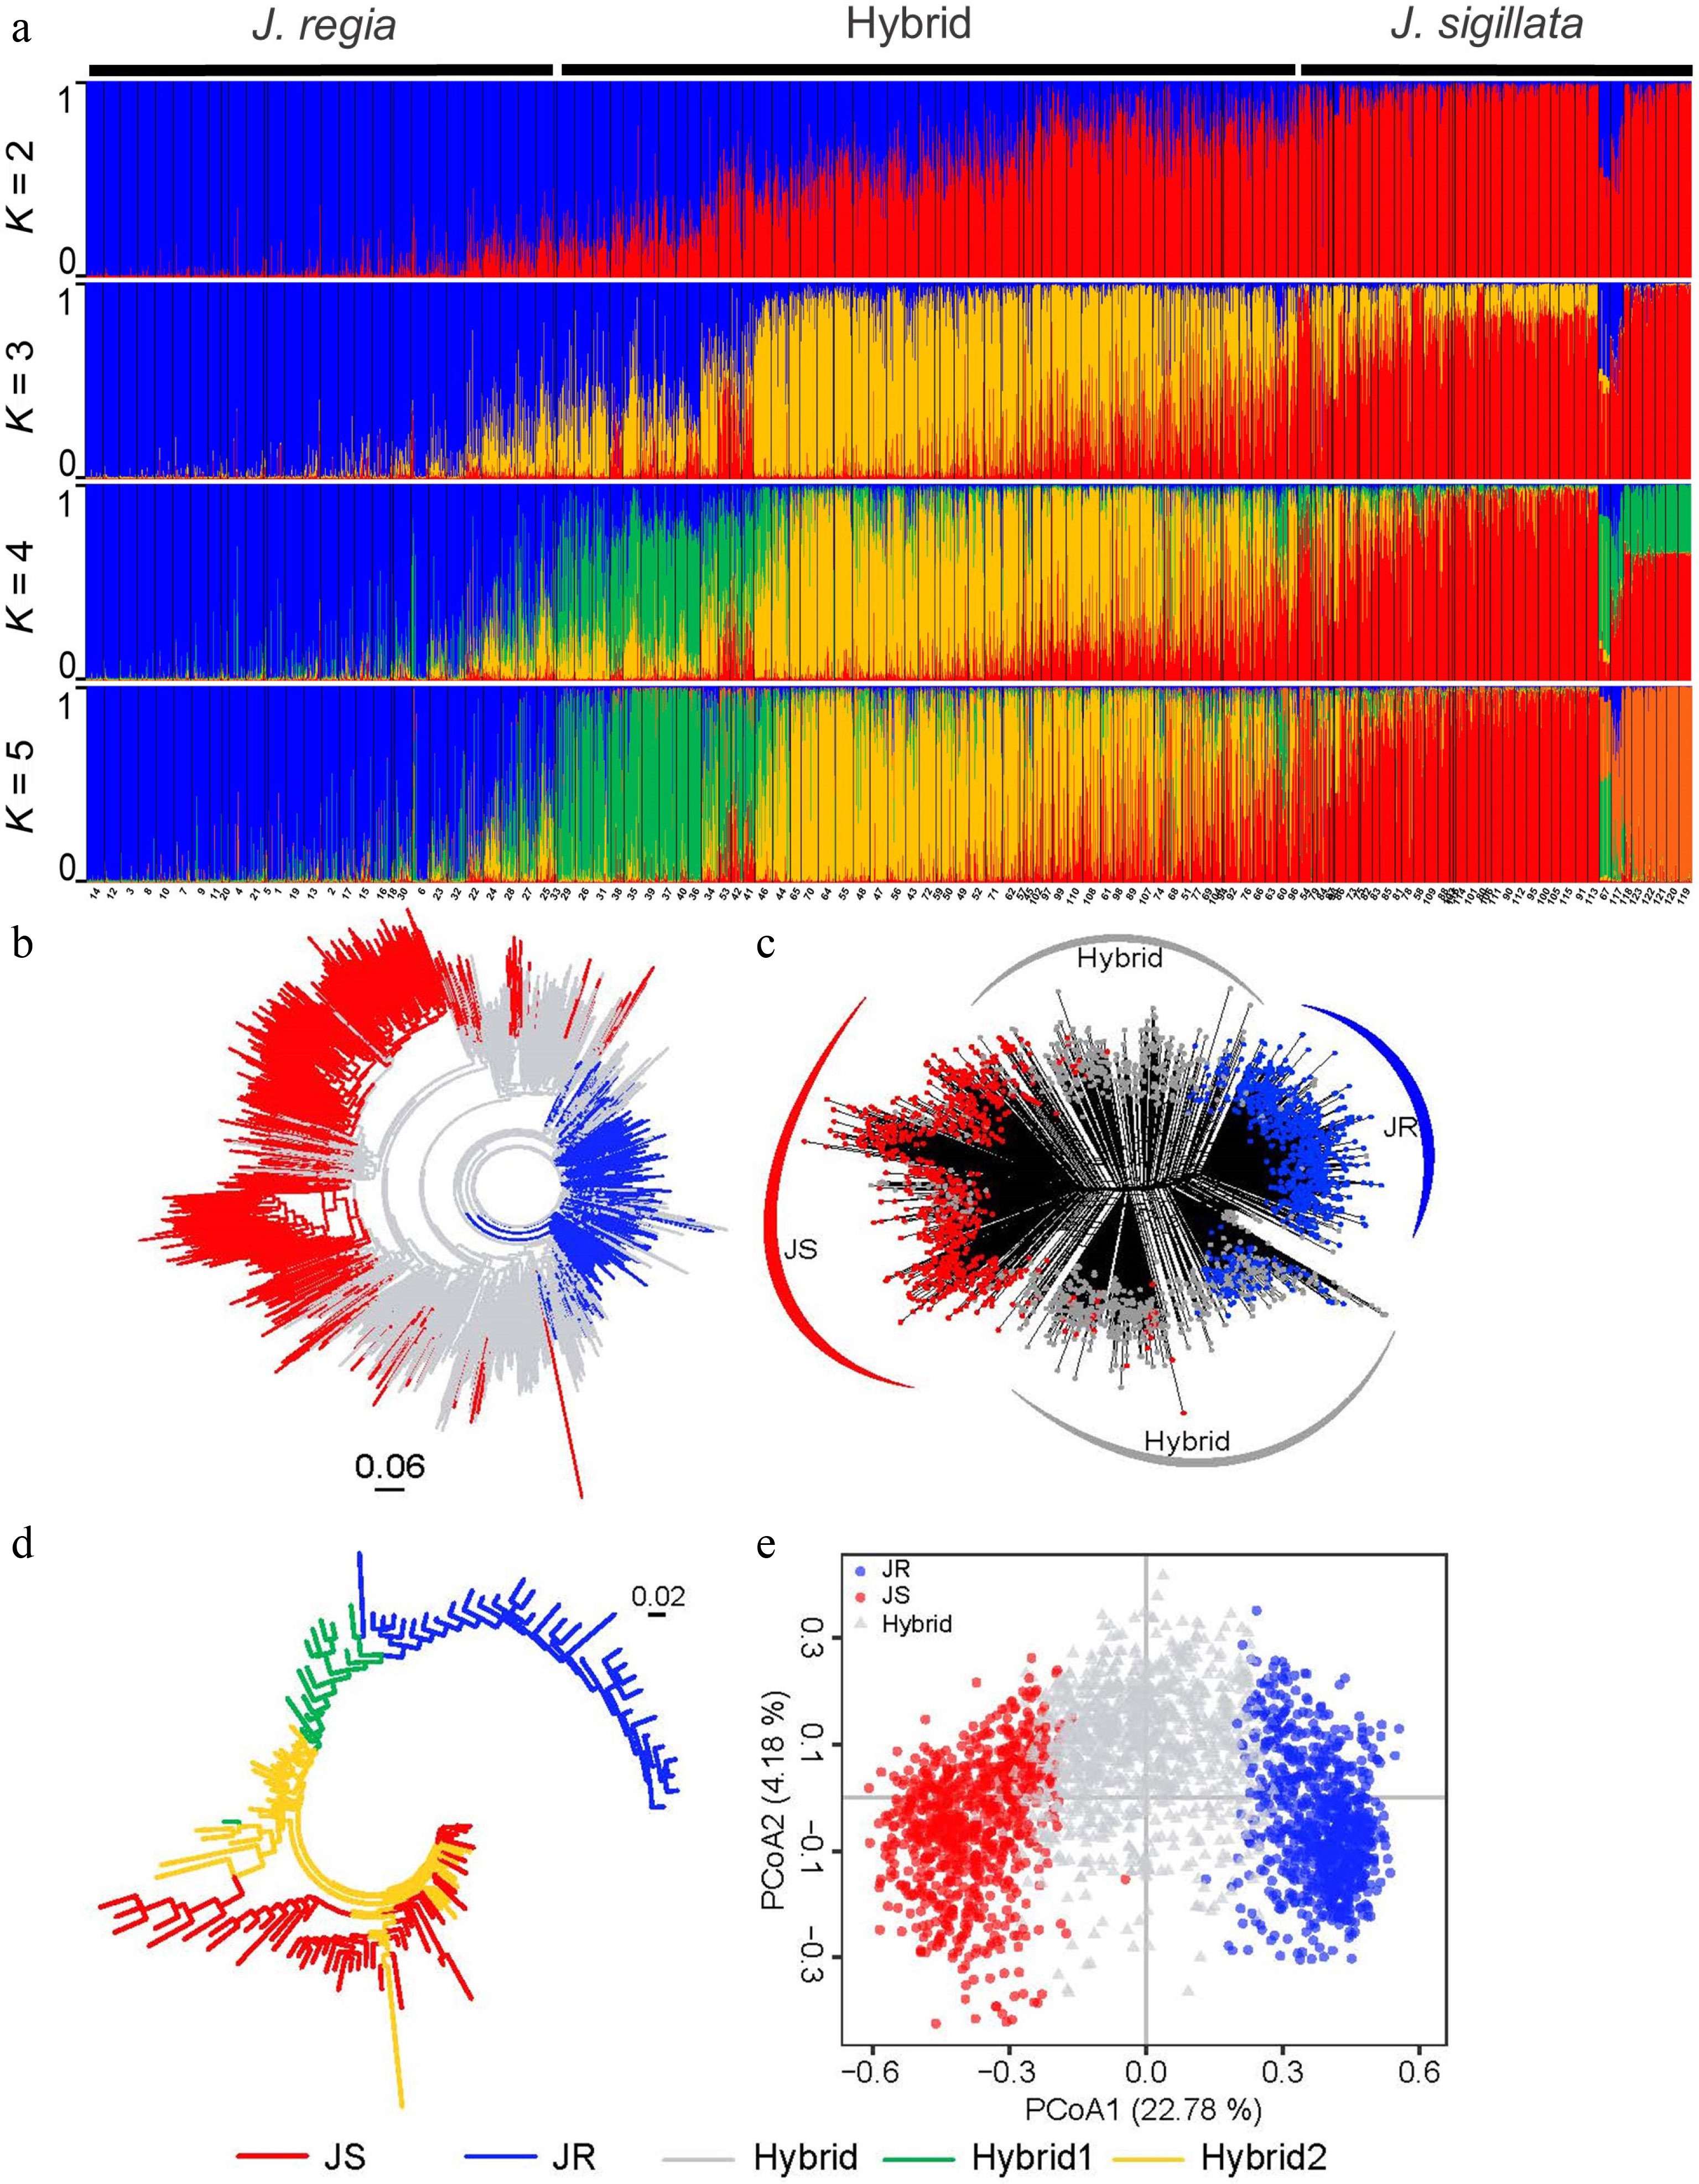
Figure 2.
Population structure of 2,703 walnut individuals (Juglans regia and J. sigillata) based on 31 microsatellite loci. In all five diagrams, various colors indicate distinct genetic groups: blue for JR (J. regia), red for JS (J. sigillata), grey for Hybrid, green for Hybrid1, and yellow for Hybrid2. (a) STRUCTURE results for K = 2 to K = 5. (b) Neighbor-joining tree, and (c) neighbor-net tree of all individuals based on Nei's genetic distance (DA). (d) Neighbor-joining tree for 123 populations based on Nei's genetic distance. (e) Principal coordinates analysis (PCoA) of all individuals based on DA genetic distance.
-
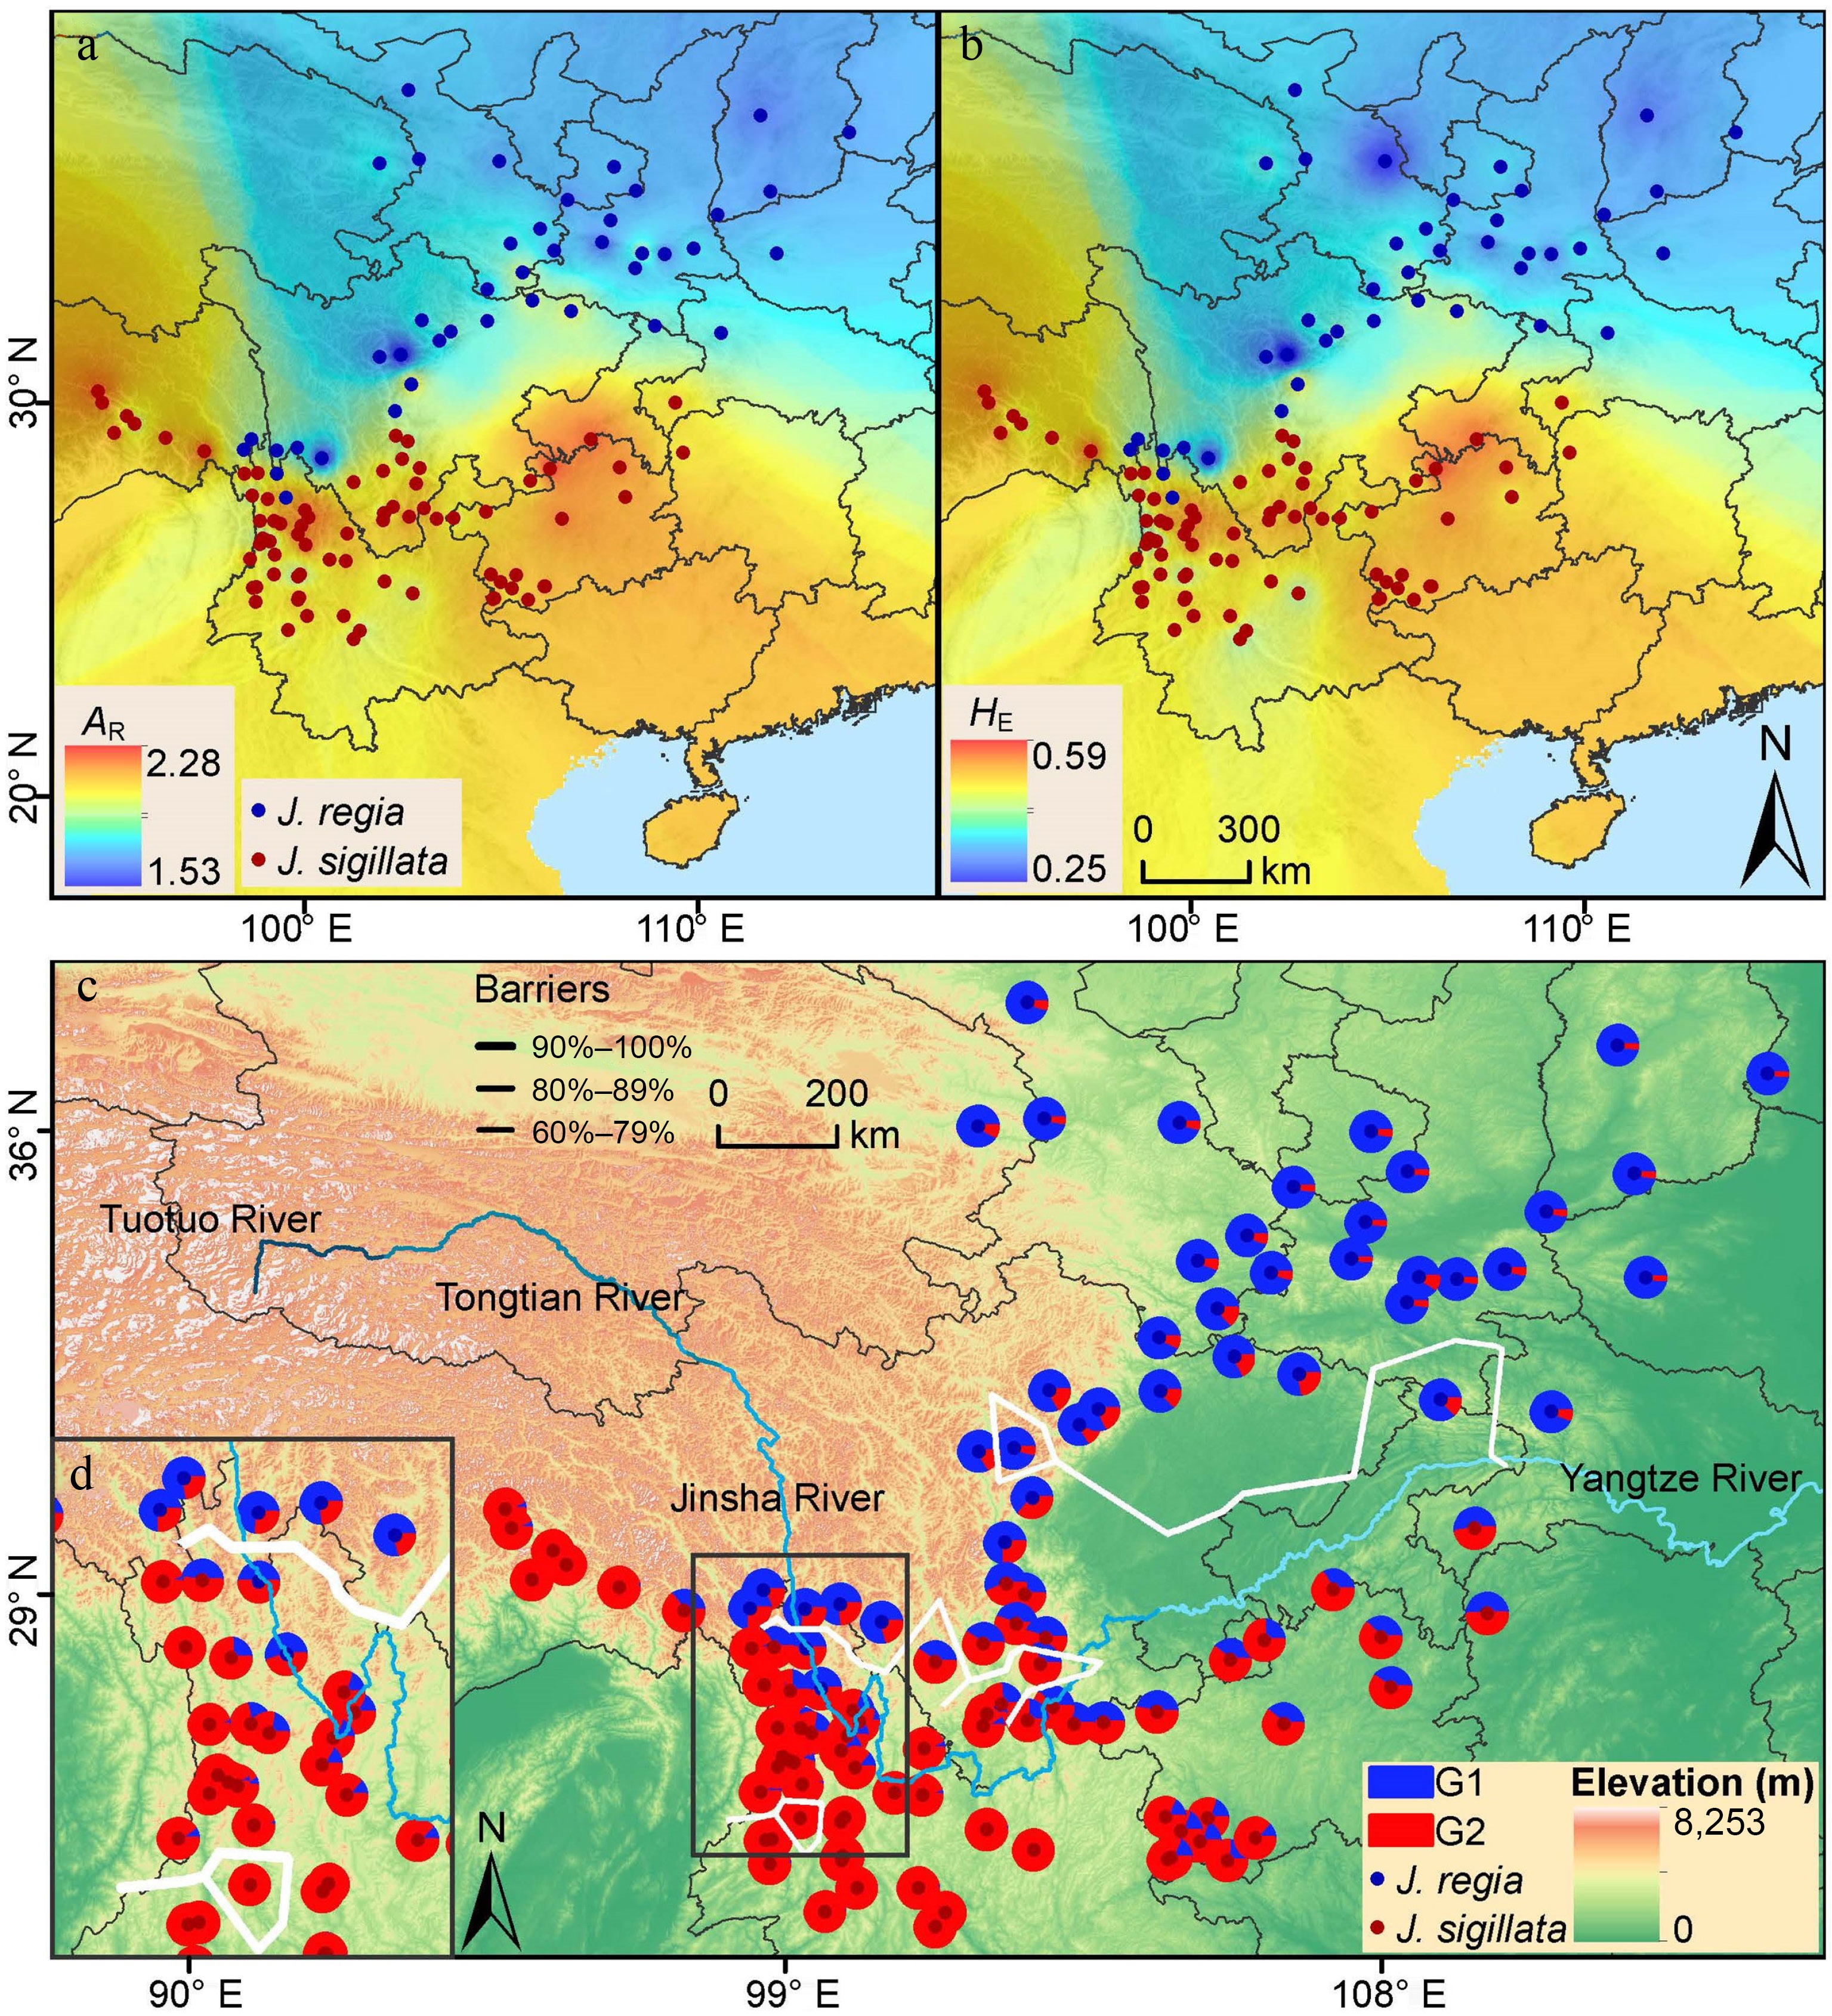
Figure 3.
Spatial patterns of genetic diversity and population structure in 123 walnut populations. Genetic diversity was mapped using IDW (Inverse distance weighted) interpolation in ArcMap: (a) allelic richness (AR); (b) expected heterozygosity (HE); (c) geographical distribution of the population structure. The map is based on the results of STRUCTURE at K = 2. (d) The inset shows the population from the Three Parallel Rivers region. The solid, thick white lines indicate the locations of the two most likely barriers identified through the Barrier analysis.
-
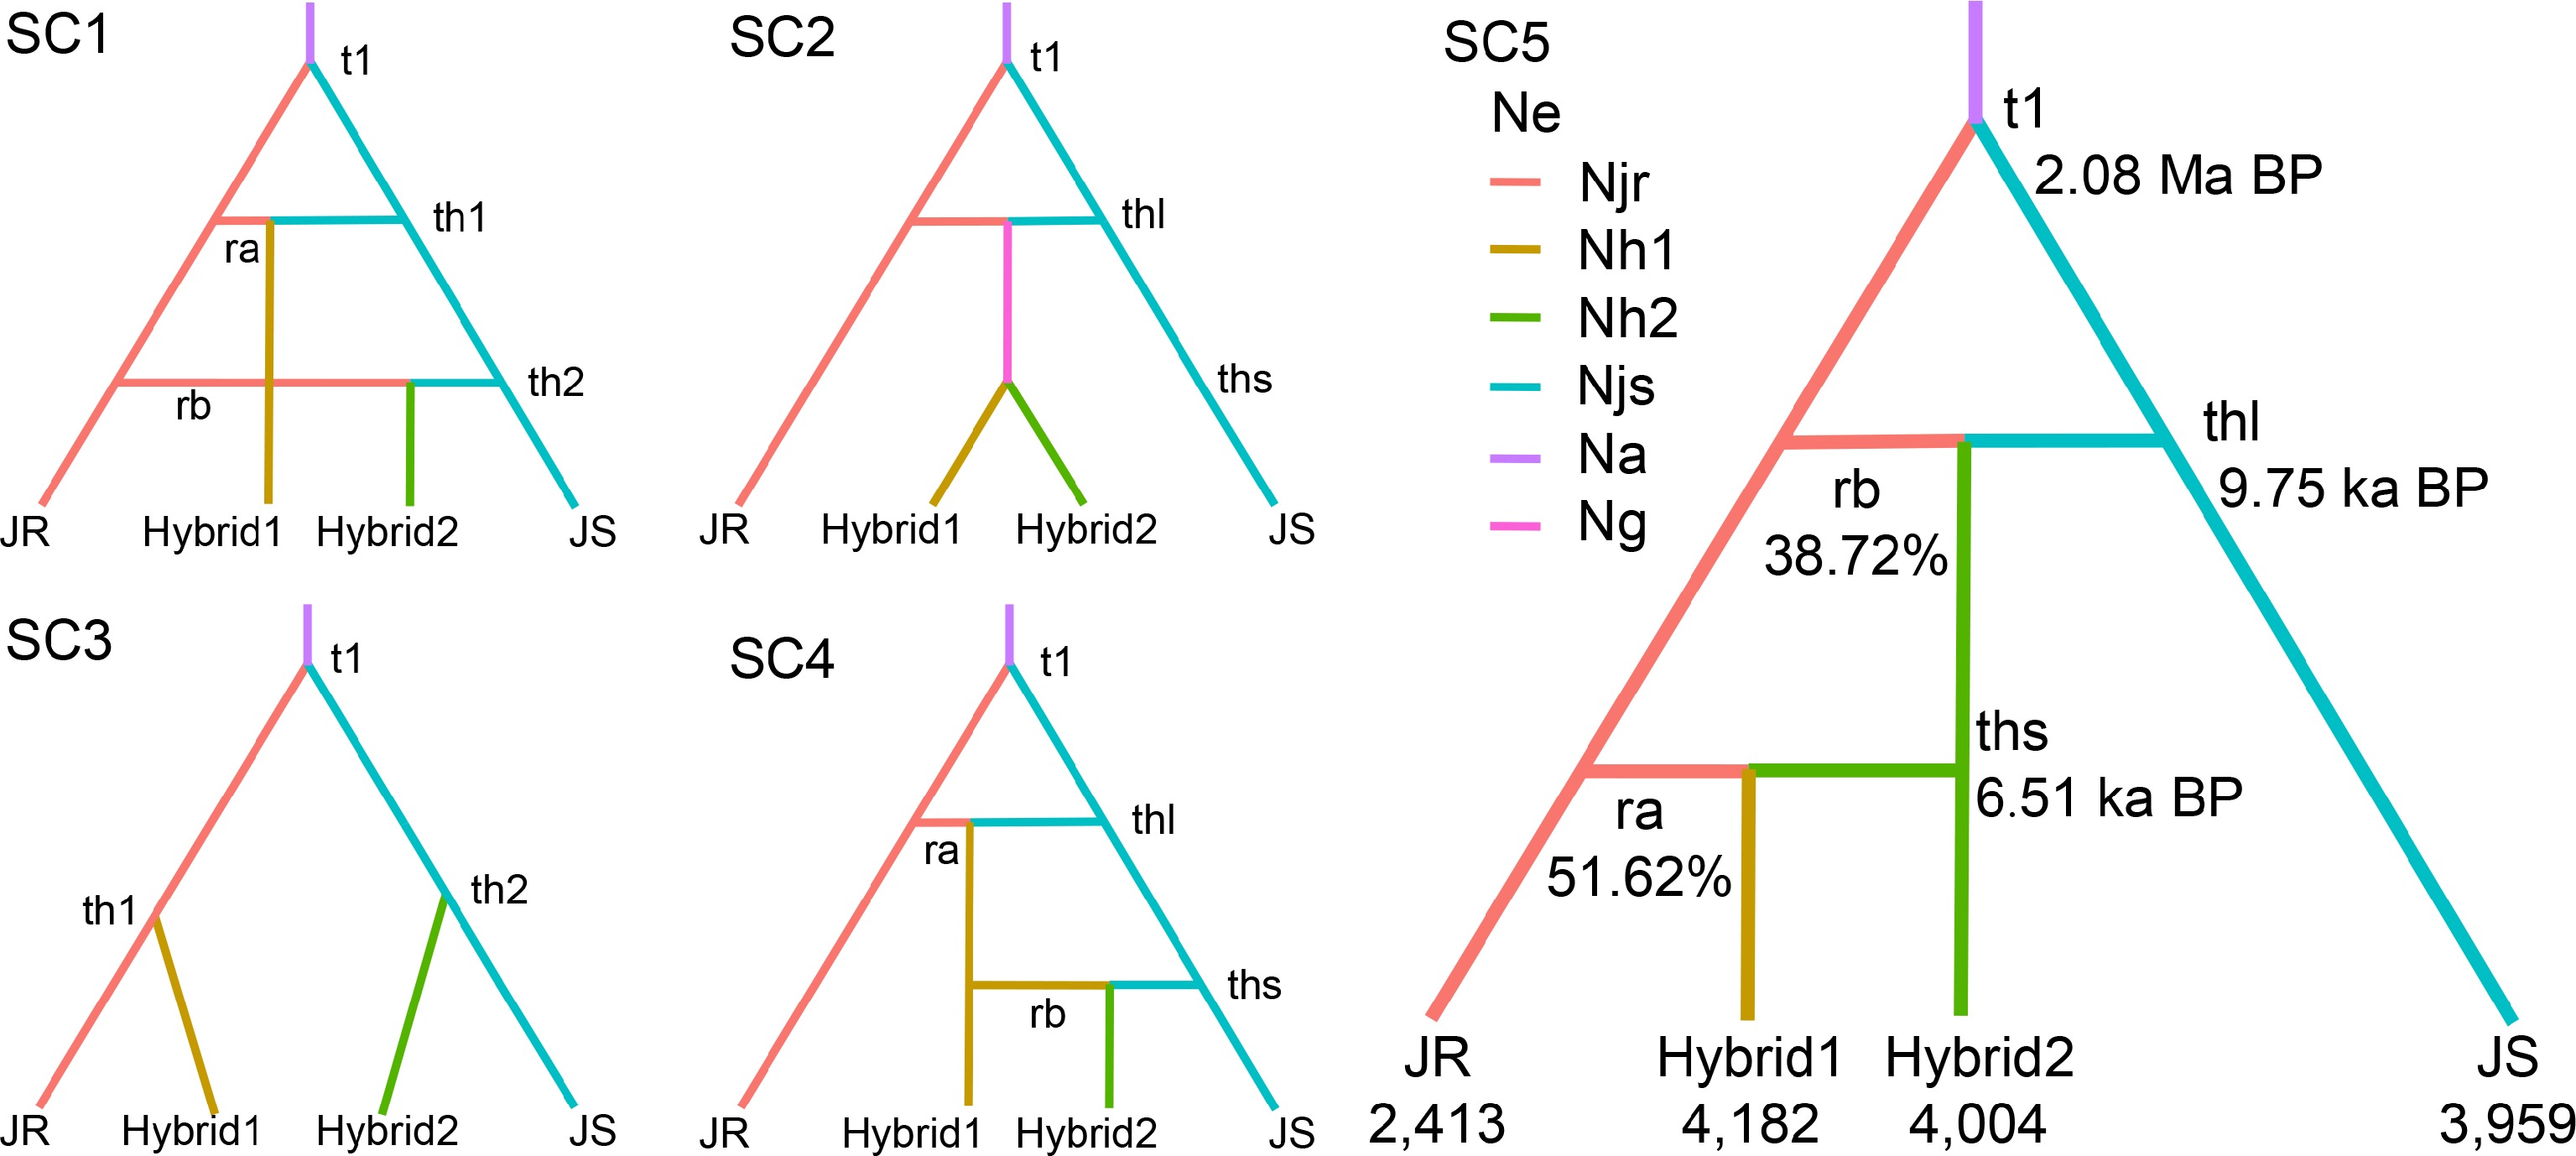
Figure 4.
Population demographic history of walnuts inferred from DIYABC-RF analysis. Demographic and historical parameters include six effective population sizes (Njr, Nh1, Nh2, Njs, Na, and Ng) and five events representing population divergence or admixture (t1, th1, th2, thl, and ths). For the scenarios with admixture, the parameters ra and rb represent the genetic contribution of each of the source groups. Branch colors indicate discrete effective population sizes in the model, with time measured in generations, and is not calibrated to scale. The descriptions of model parameters are provided in Supplementary Table S4.
-
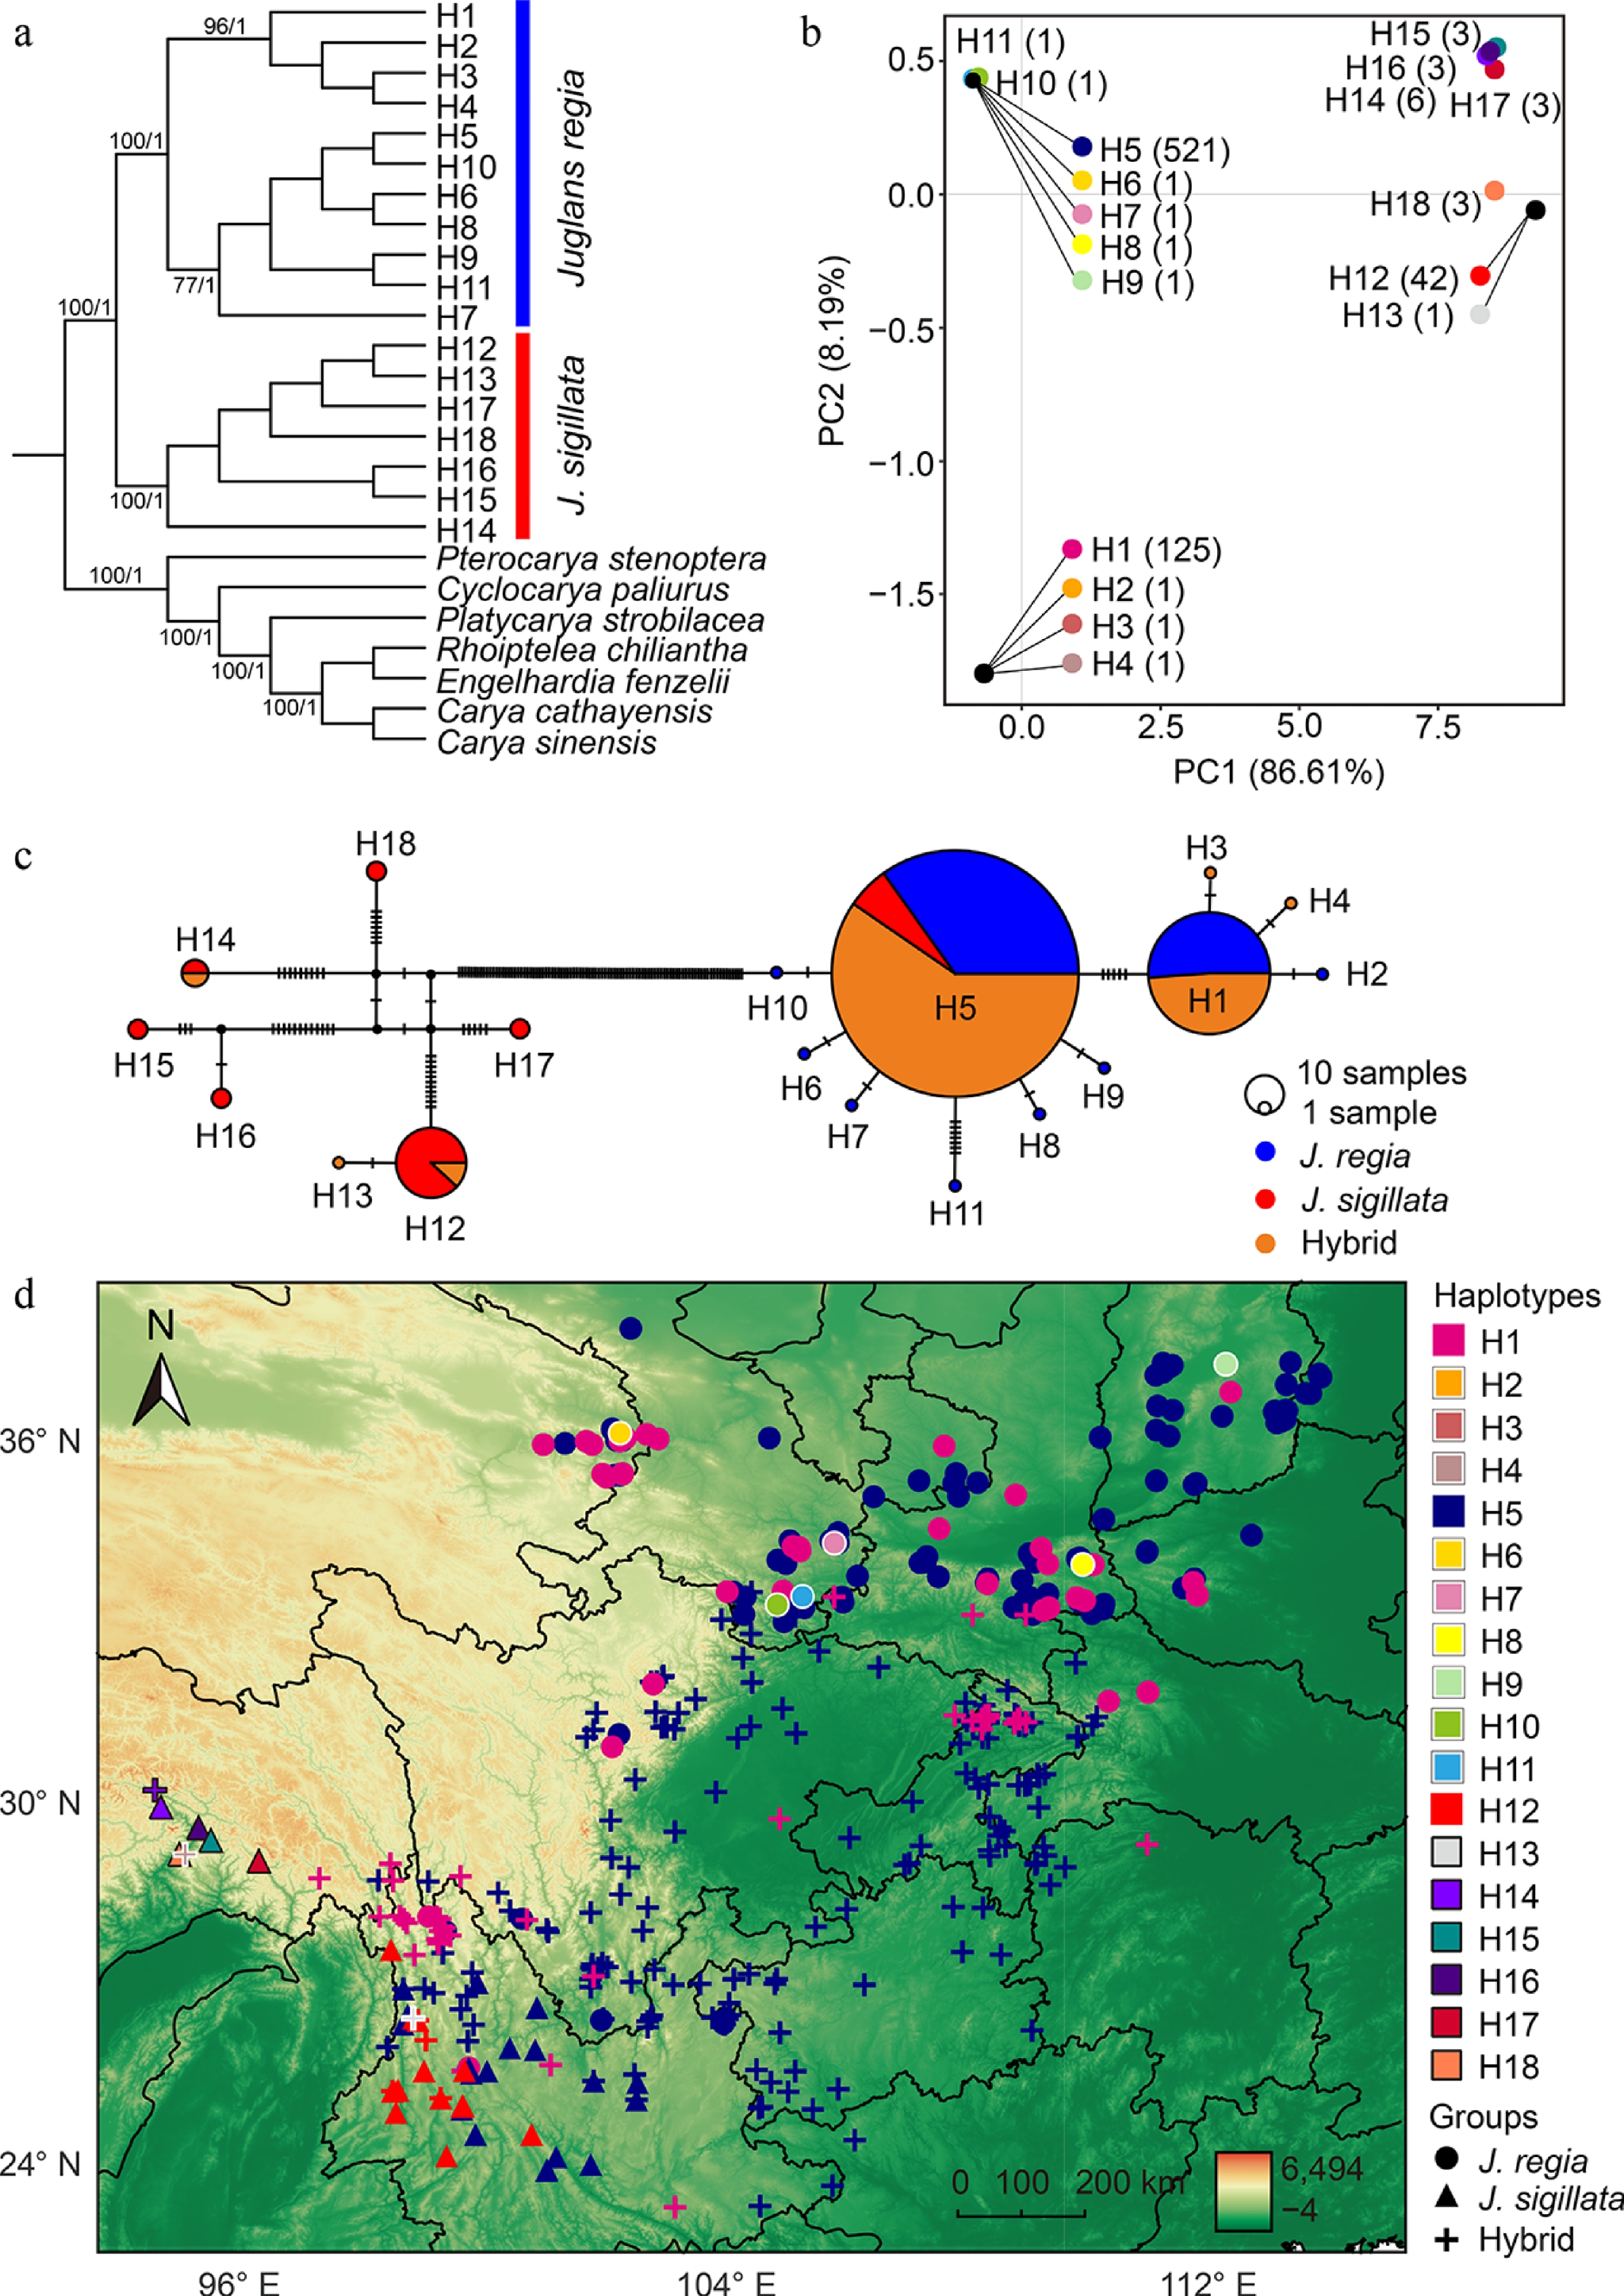
Figure 5.
Clustering relationships and geographical distribution of chloroplast genome haplotypes. (a) Phylogenetic tree inferred using maximum likelihood and Bayesian inference. Numbers on the branches indicate maximum likelihood bootstrap supports (BS) and Bayesian posterior probabilities (PP), respectively. Only major clades and values greater than 70 are shown. (b) Principal component analysis (PCA) of 18 haplotypes identified from 716 chloroplast genomes. The numbers next to the haplotypes indicate the number of individuals carrying each specific haplotype. Haplotypes that overlap due to small genetic distances are indicated by external lines. (c) Network of 18 haplotypes based on 716 chloroplast genomes. The size of each circle corresponds to the proportion of the specific haplotype. Vertical lines indicate mutational steps between haplotypes. (d) Geographical distribution of 18 haplotypes in 716 walnut individuals. Private haplotypes were indicated with white and black outlines for J. regia and J. sigillata, respectively. Different colors correspond to distinct haplotypes, while different shapes represent J. regia (circle), J. sigillata (triangle), and hybrids (plus sign).
-
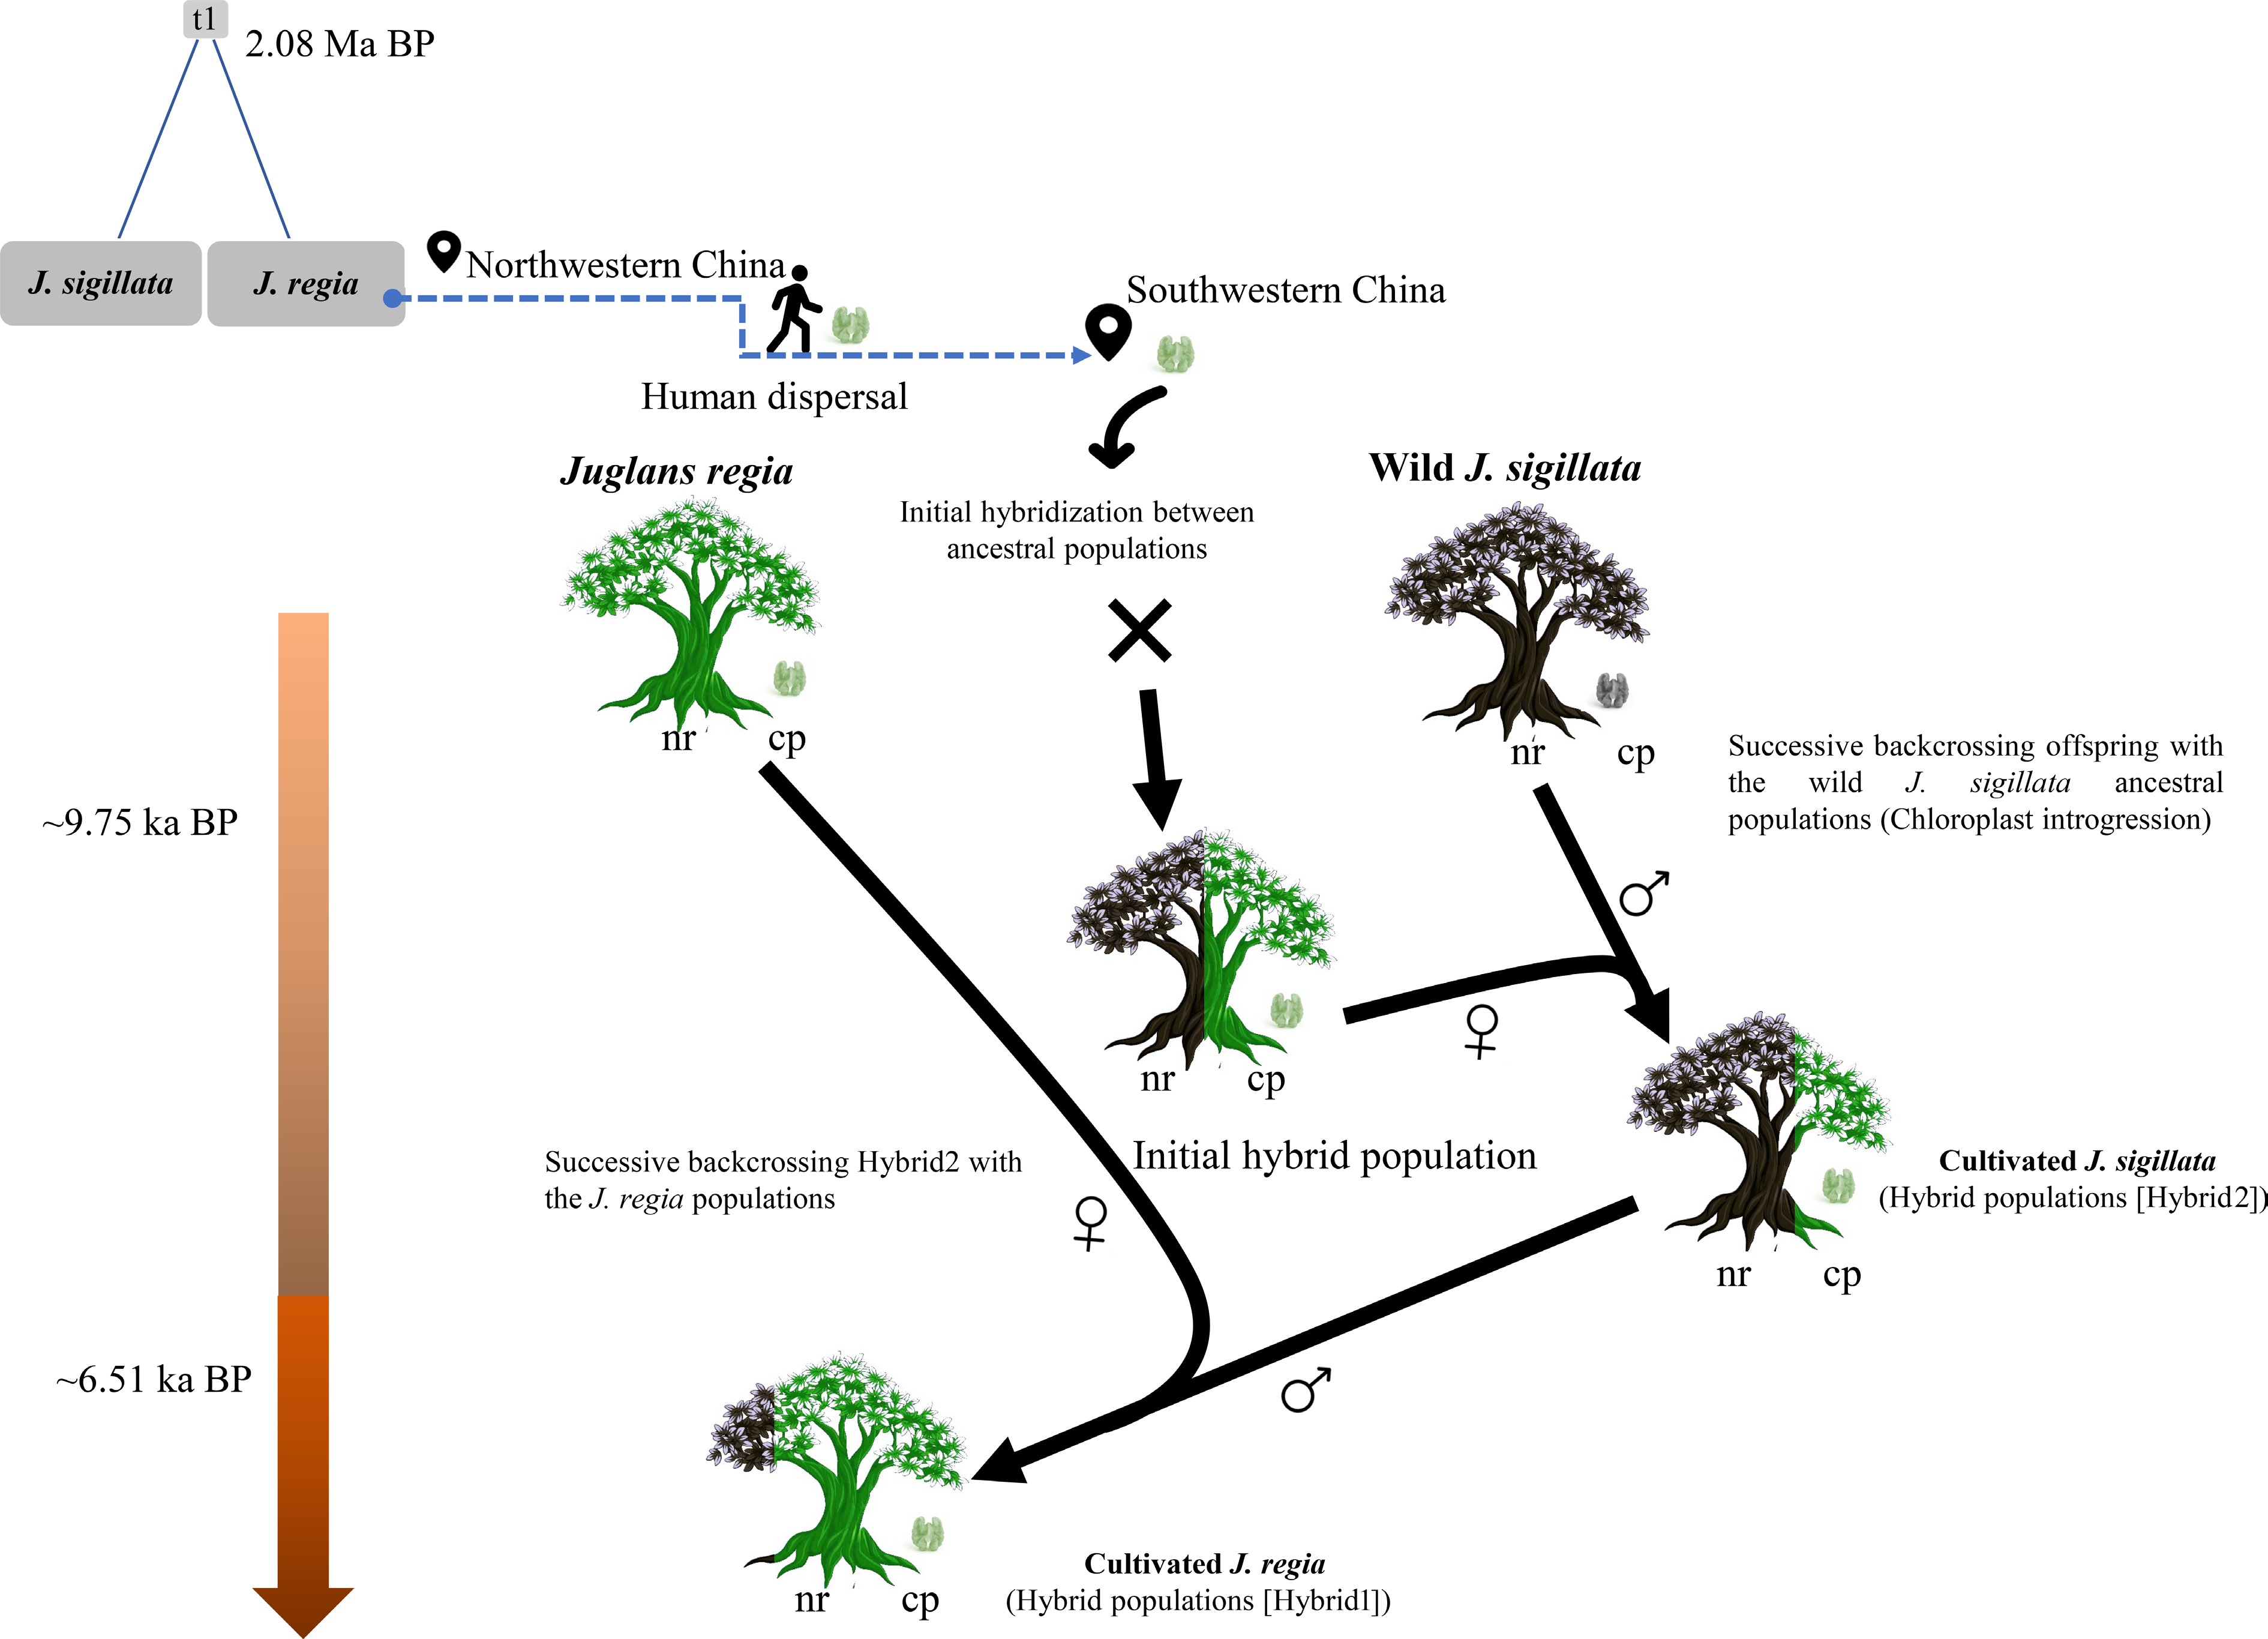
Figure 6.
Schematical model for the hybrid origin of cultivated walnuts in southwestern China. Juglans sigillata and J. regia diverged approximately 2.08 million years ago. Briefly, during the Holocene, J. regia was spread to northern China and was later introduced into southwestern China following the emergence of cultivated hybrid walnuts there. The conceptual diagram depicts successive hybridization events and nuclear genome (nr) exchange, as shown by the color-coded tree stems representing nuclear genome composition. The chloroplast genome (cpDNA) is maternally inherited and is thus denoted by the female symbol (♀) to indicate its maternal origin, whereas the paternal parent is represented by the male symbol (♂). This model proposes the gradual chloroplast introgression in J. sigillata, driven by repeated genetic exchanges through hybridization. Notably, introgression is an ongoing process, not a discrete event.
-
Group N NT NP NA NE HO HE uHE AR FIS JR 871 164 3 5.29 1.94 0.37 0.42 0.42 6.00 0.12 JS 821 237 36 7.65 2.62 0.51 0.58 0.58 8.16 0.13 Hybrid 1,011 207 5 6.68 2.67 0.51 0.58 0.58 7.37 0.11 Total 2,703 251 − 8.10 2.88 0.46 0.61 0.61 8.05 0.24 N, sample size; NT, total number of alleles; NP, private alleles; NA, number of alleles; NE, effective number of alleles; HO, observed heterozygosity; HE, expected heterozygosity; uHE, unbiased expected heterozygosity; AR, allelic richness; FIS, inbreeding coefficient. Table 1.
Genetic diversity within three groups based on microsatellite data. JR: Juglans regia; JS: J. sigillata.
-
Scale Source d.f. Sum of
squaresMean
squaresPercentage of
variation (%)Among pops 122 24,768.26 203.02 36 Within pops 2,580 38,593.24 14.96 64 Total Total 2,702 63,361.50 100 FST 0.37* Among groups 2 13,572.47 6,786.24 29 Within groups 2,700 49,789.03 18.44 71 Groups Total 2,702 63,361.50 100 (JS/JR/
Hybrid)FST 0.29* JS/JR/
Hybrid1/
Hybrid2Among groups 3 7,182.079 2,394.026 18 Within groups 2,699 43,865.67 8.12 82 Total 2,702 51,047.749 100 FST 0.18* Among groups 1 12,759.23 12,759.23 46 Within groups 1,690 29,482.96 17.45 54 JS/JR Total 1,691 42,242.19 100 FST 0.46* Among groups 1 3,599.82 3,599.82 16 Within groups 1,830 37,035.60 20.24 84 JS/Hybrid Total 1,831 40,635.42 100 FST 0.16* Among groups 1 4,518.02 4,518.02 21 Within groups 1,880 33,059.49 17.58 79 JR/Hybrid Total 1,881 37,577.51 100 FST 0.21* d.f., degree of freedom. * p = 0.001. Table 2.
Analysis of molecular variance (AMOVA) of 123 populations and three groups of Juglans regia and J. sigillata.
Figures
(6)
Tables
(2)