-
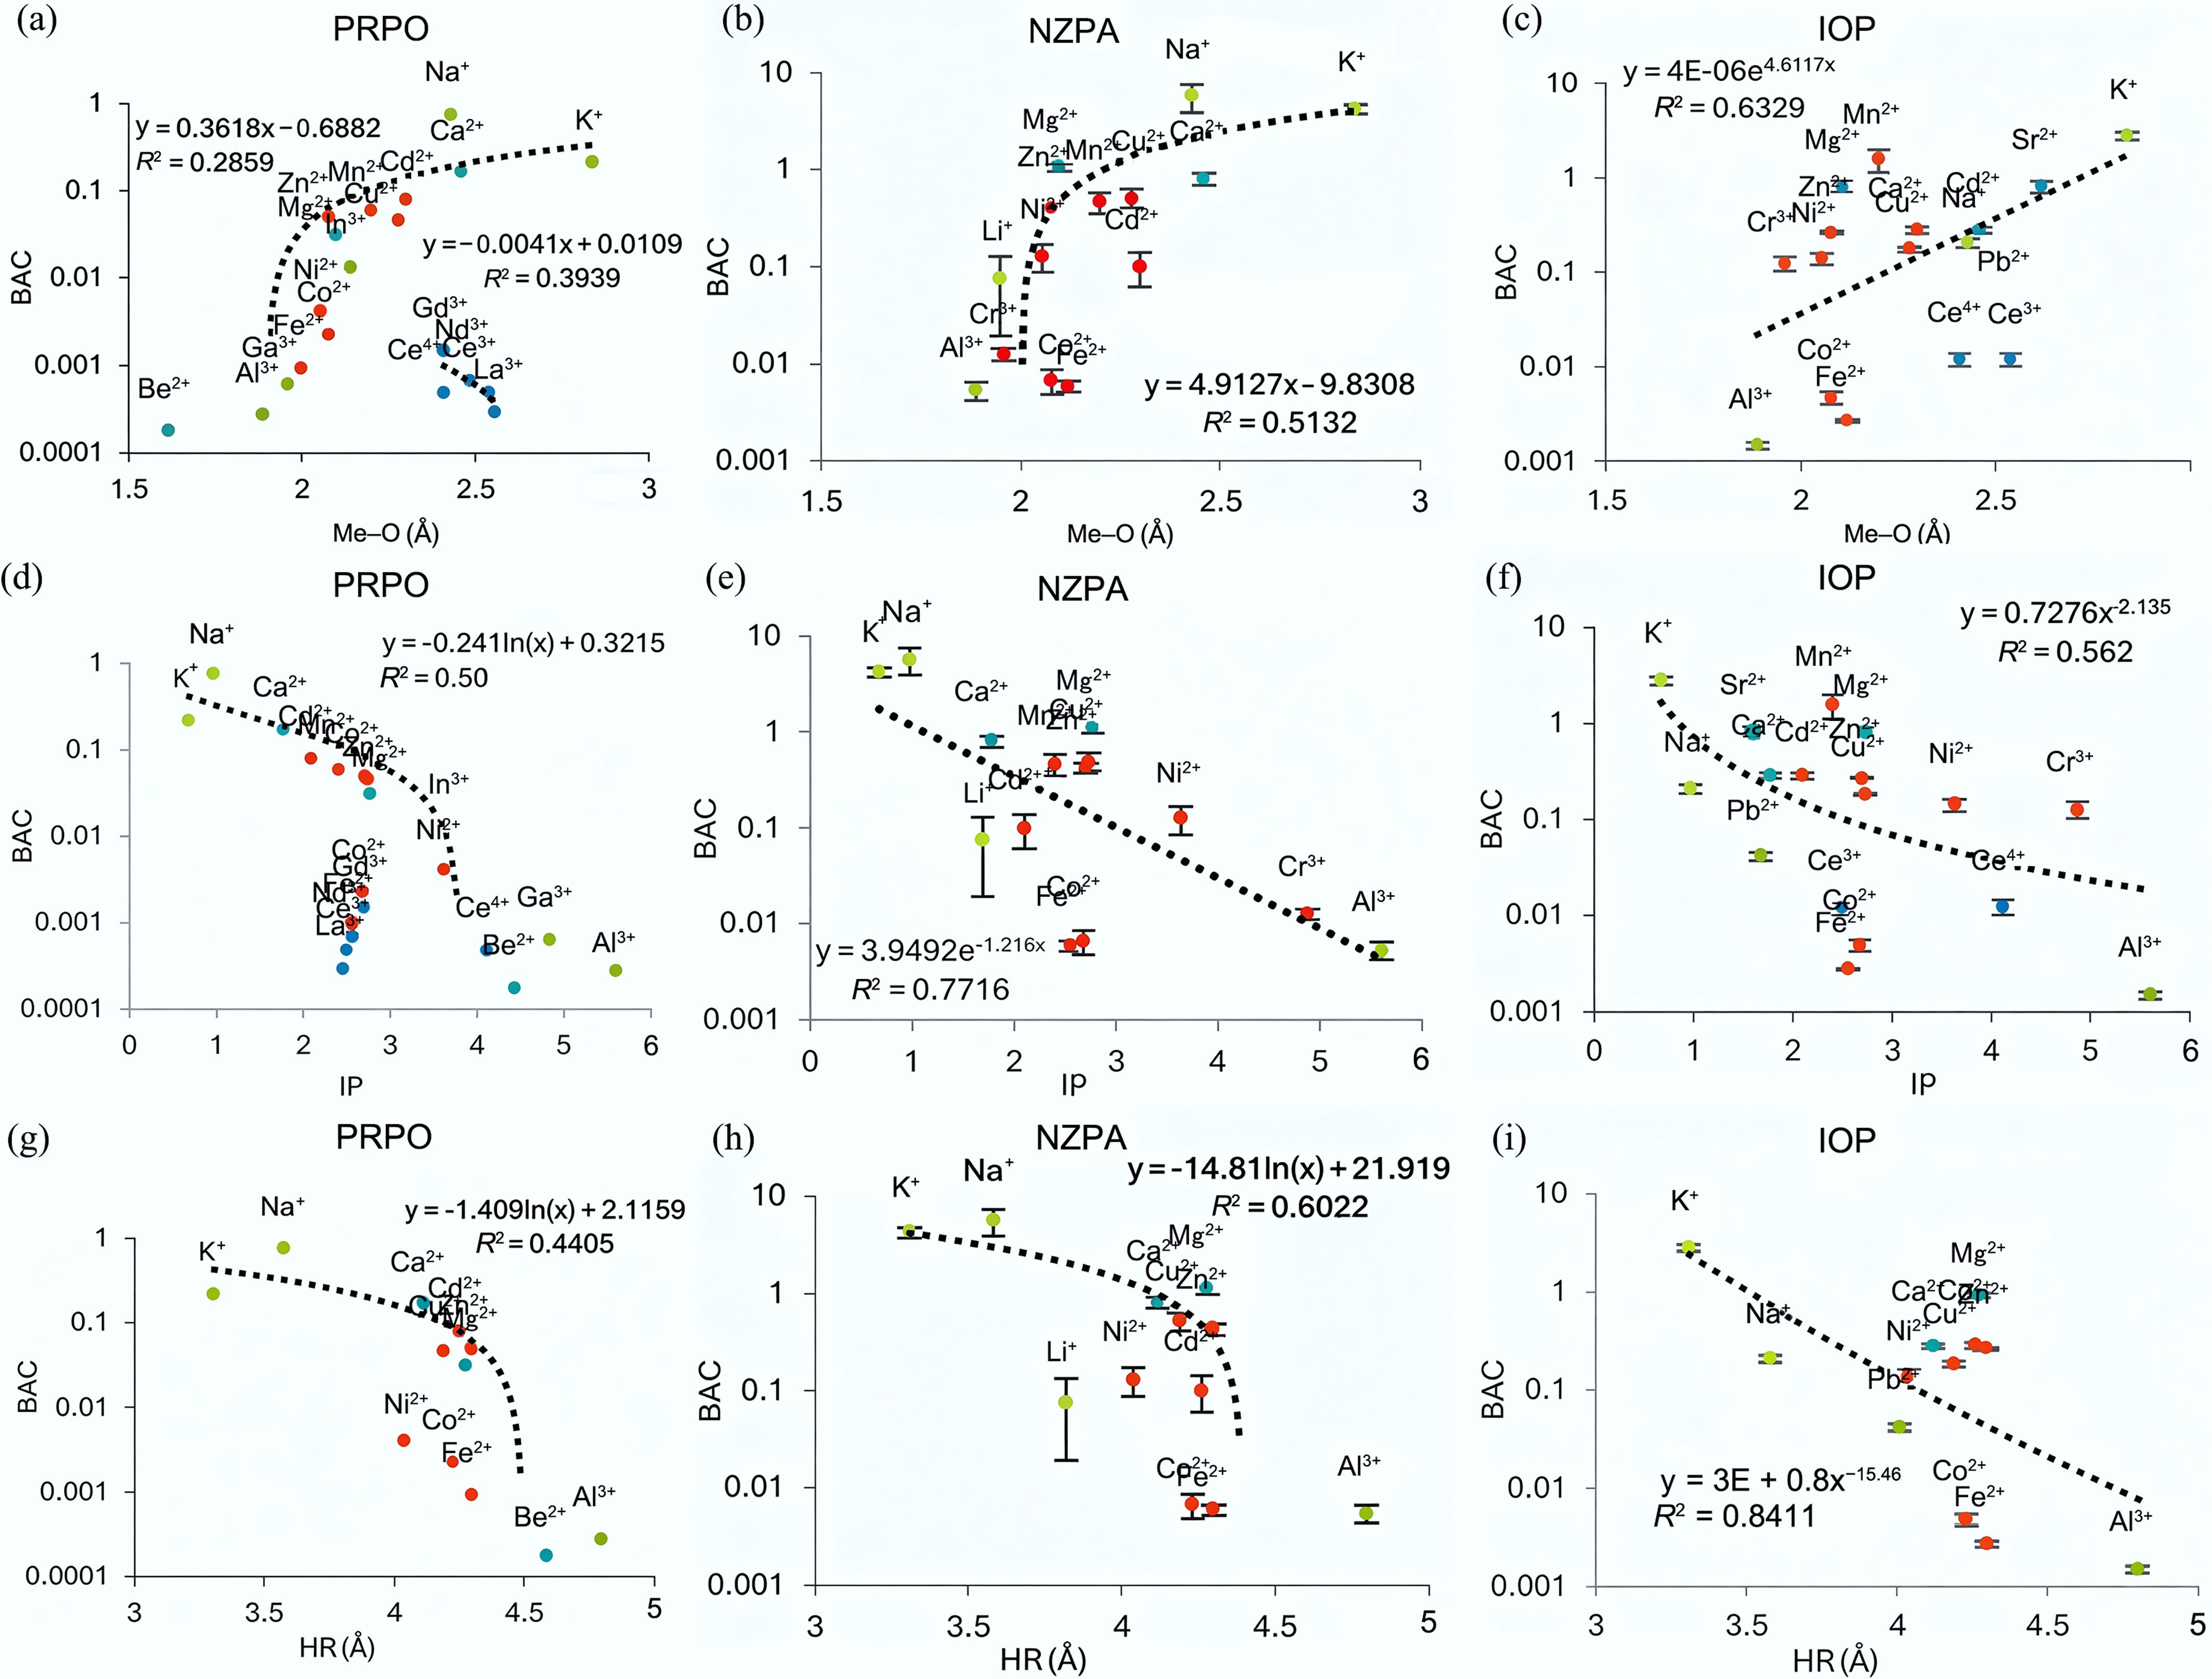
Figure 1.
(a), (d), (g) Effect of Me–O, IP, and HR on the BAC of various elements in a perennial ryegrass pot trial (PRPO). (b), (e), (h) New Zealand pasture (NZPA); and (c), (f), (i) Indonesian oil palm (IOP). Trendlines (except for the small trendline in the first figure) do not include lanthanide elements (La, Ce, Nd, and Gd). Error bars show standard error. The trendlines for graphs (a) and (b) are linear; (d), (g), and (h) are logarithmic; (c) and (e) are exponential; and (f) and (i) are power.
-
Soil property type Soil property value pHab 5.3 Olsen P (mg L−1)a 27 CEC (cmol[+] kg−1)a 13 Base saturation (%)a 61 Total C (%)a 1.9 Texture Loamy sand Sand (%)d 80.4 Silt (%)d 16.2 Clay (%)d 3.1 a Analysis from Hill Labs; b Determined by H2O, 1:2 v/v soil:water; c Sum of extractable cations and extractable acidity; d Particle size distribution measured in a Saturn DigiSizer II 5205 v1.03, soil textures classified by the texture diagram in McLaren & Cameron[23]. Table 1.
Properties of the Christchurch Fluvial Recent Soil used for the PRPO
-
Dataset Measure Me–O IP HR PRPO 0.2859 0.501 0.4405 0.1035 0.3193 NZPA 0.5132 0.7716 0.6022 IOP 0.6329 0.562 0.8411 0.5036 0.581 Bold numbers are the R2 values before lanthanides were removed from the dataset. Table 2.
R2 values for the trendlines in Fig. 1. between Me–O, IP, and HR, and BAC for the PRPO, NZPA, and IOP datasets
-
Dataset Measure Me–O IP HR PRPO 0.040* 0.016* 0.019* 0.167 0.009** NZPA 0.004** 0.021* 0.004** IOP 0.023* 0.086 0.019* 0.050* 0.057 Bold numbers are the R2 values before lanthanides were removed from the dataset. Stars denote significance; * is significant, ** is very significant, and *** is highly significant. Table 3.
p values for linear regression analysis between Me–O, IP, and HR, and BAC for the PRPO, NZPA, and IOP datasets
Figures
(1)
Tables
(3)