-
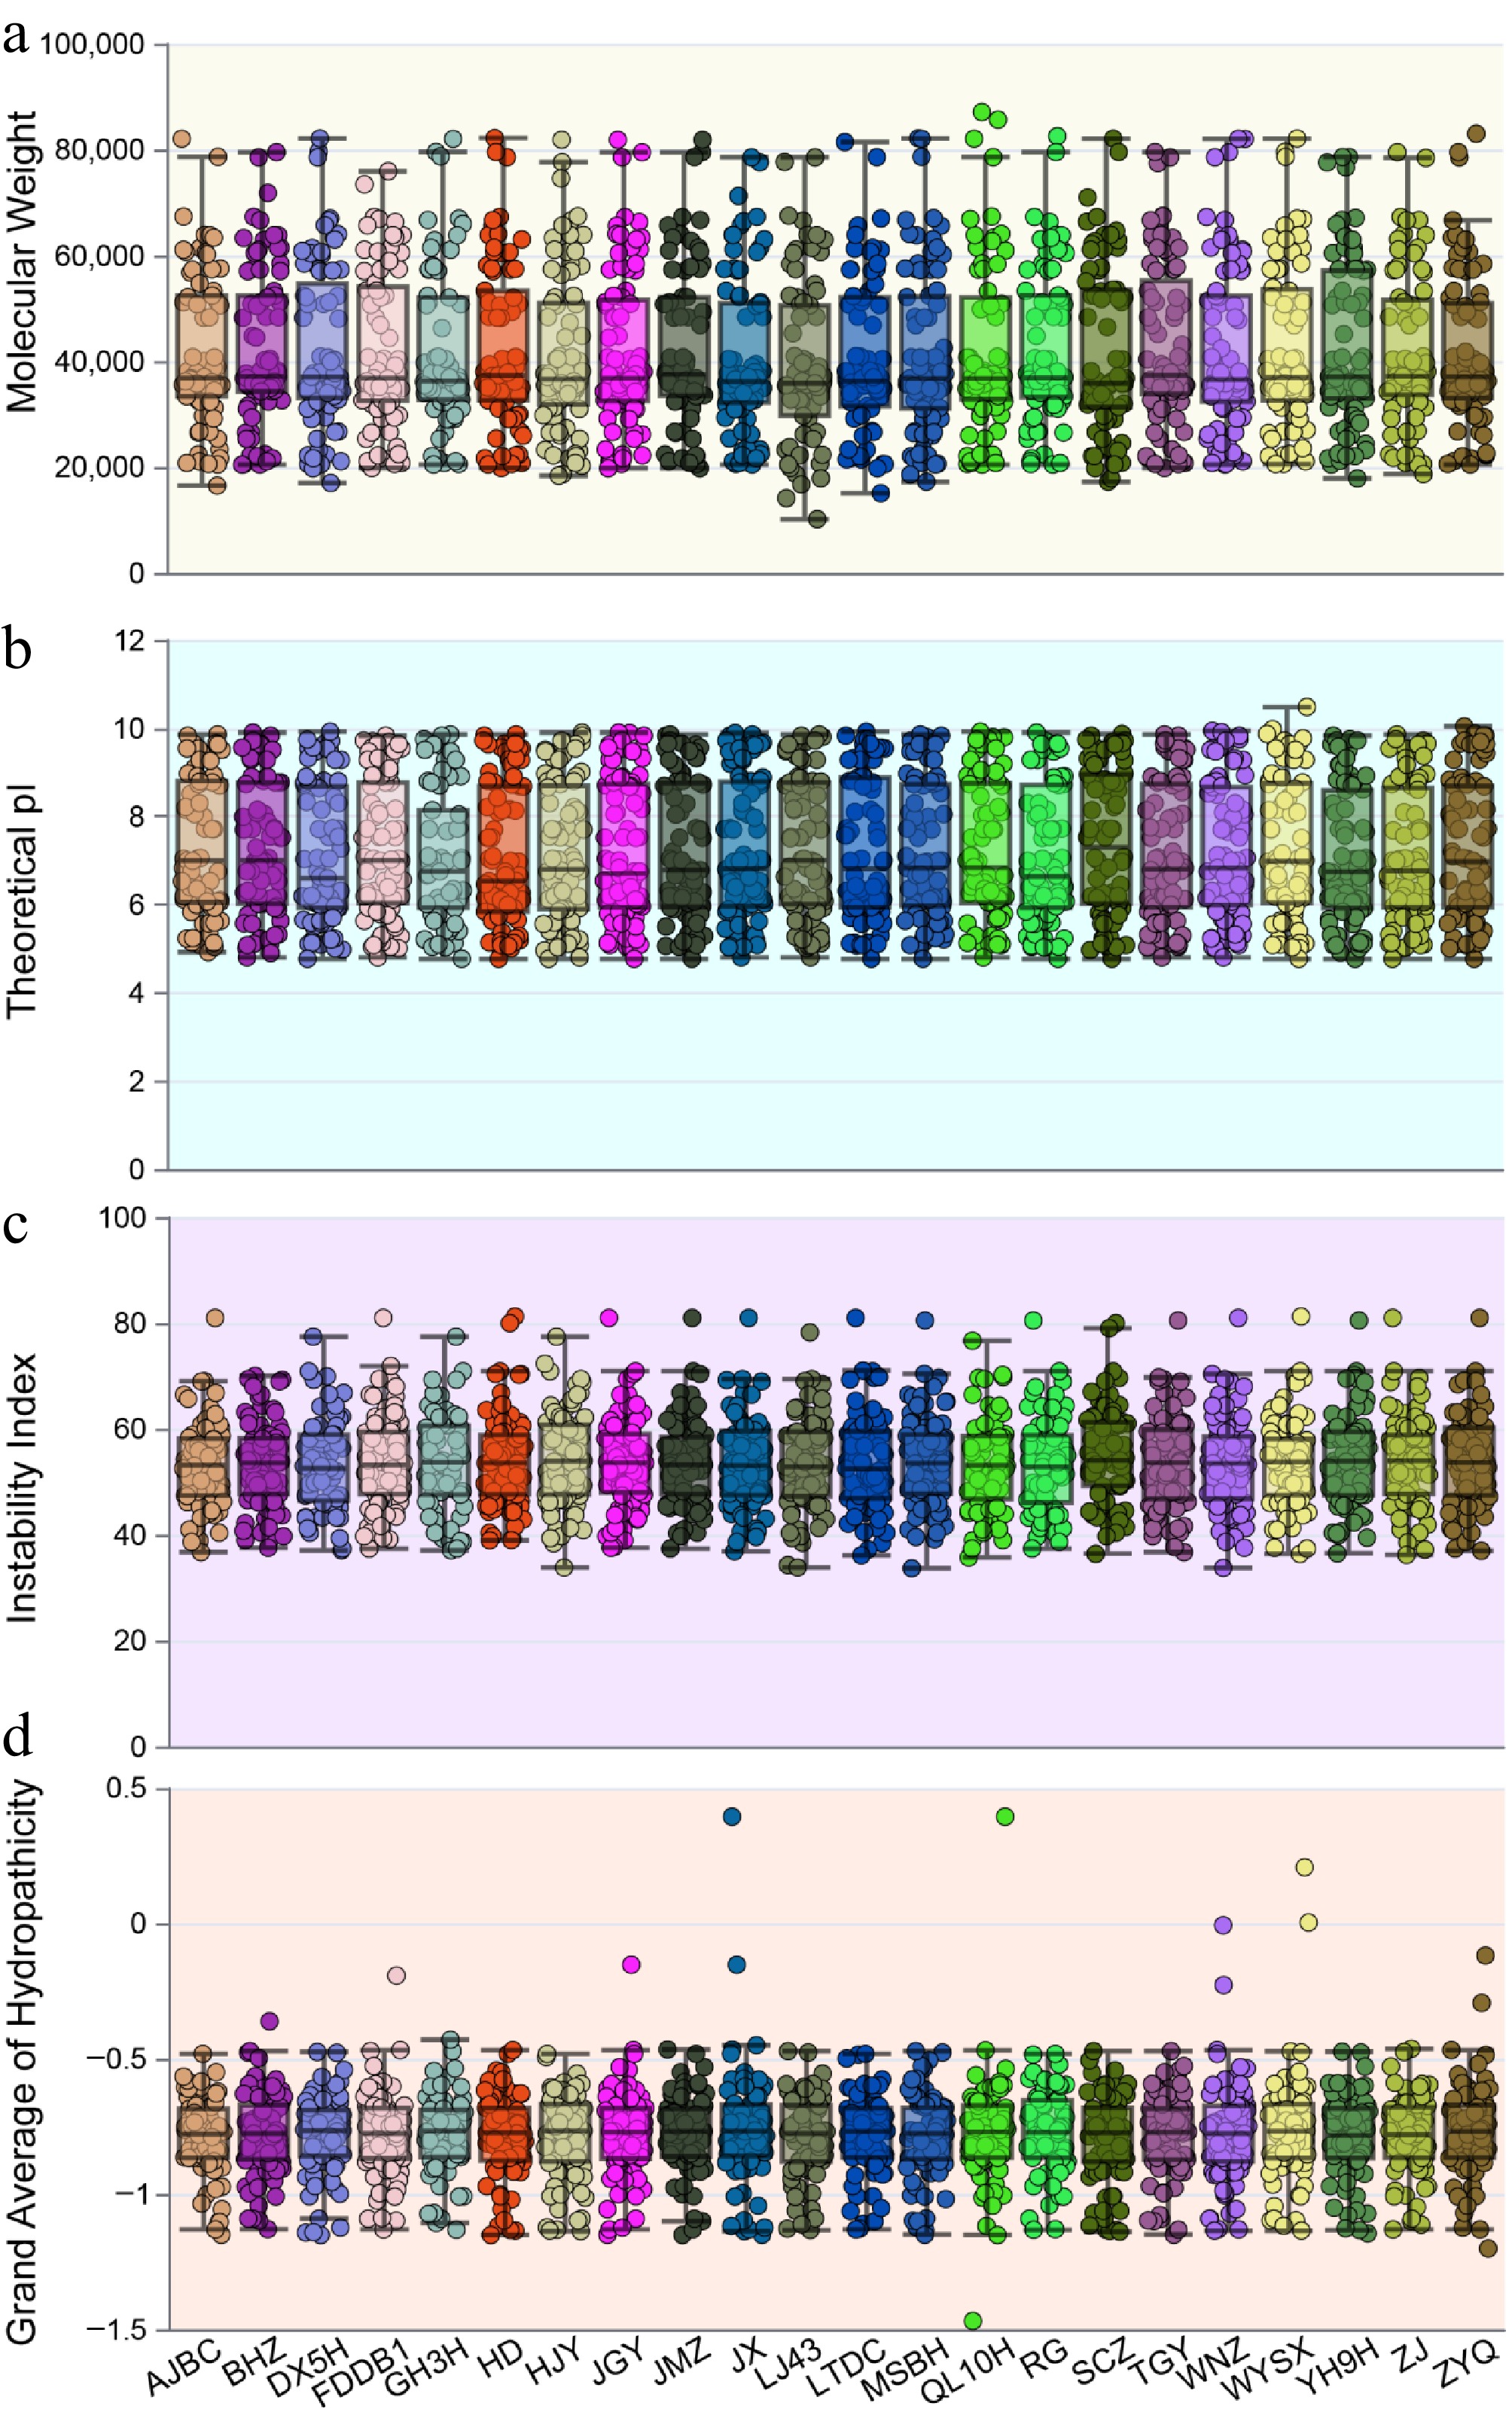
Figure 1.
Statistical analysis of the physicochemical properties of WRKY proteins in 22 tea plant cultivars. (a) Molecular weight, (b) isoelectric point, (c) instability index, (d) hydropathicity.
-
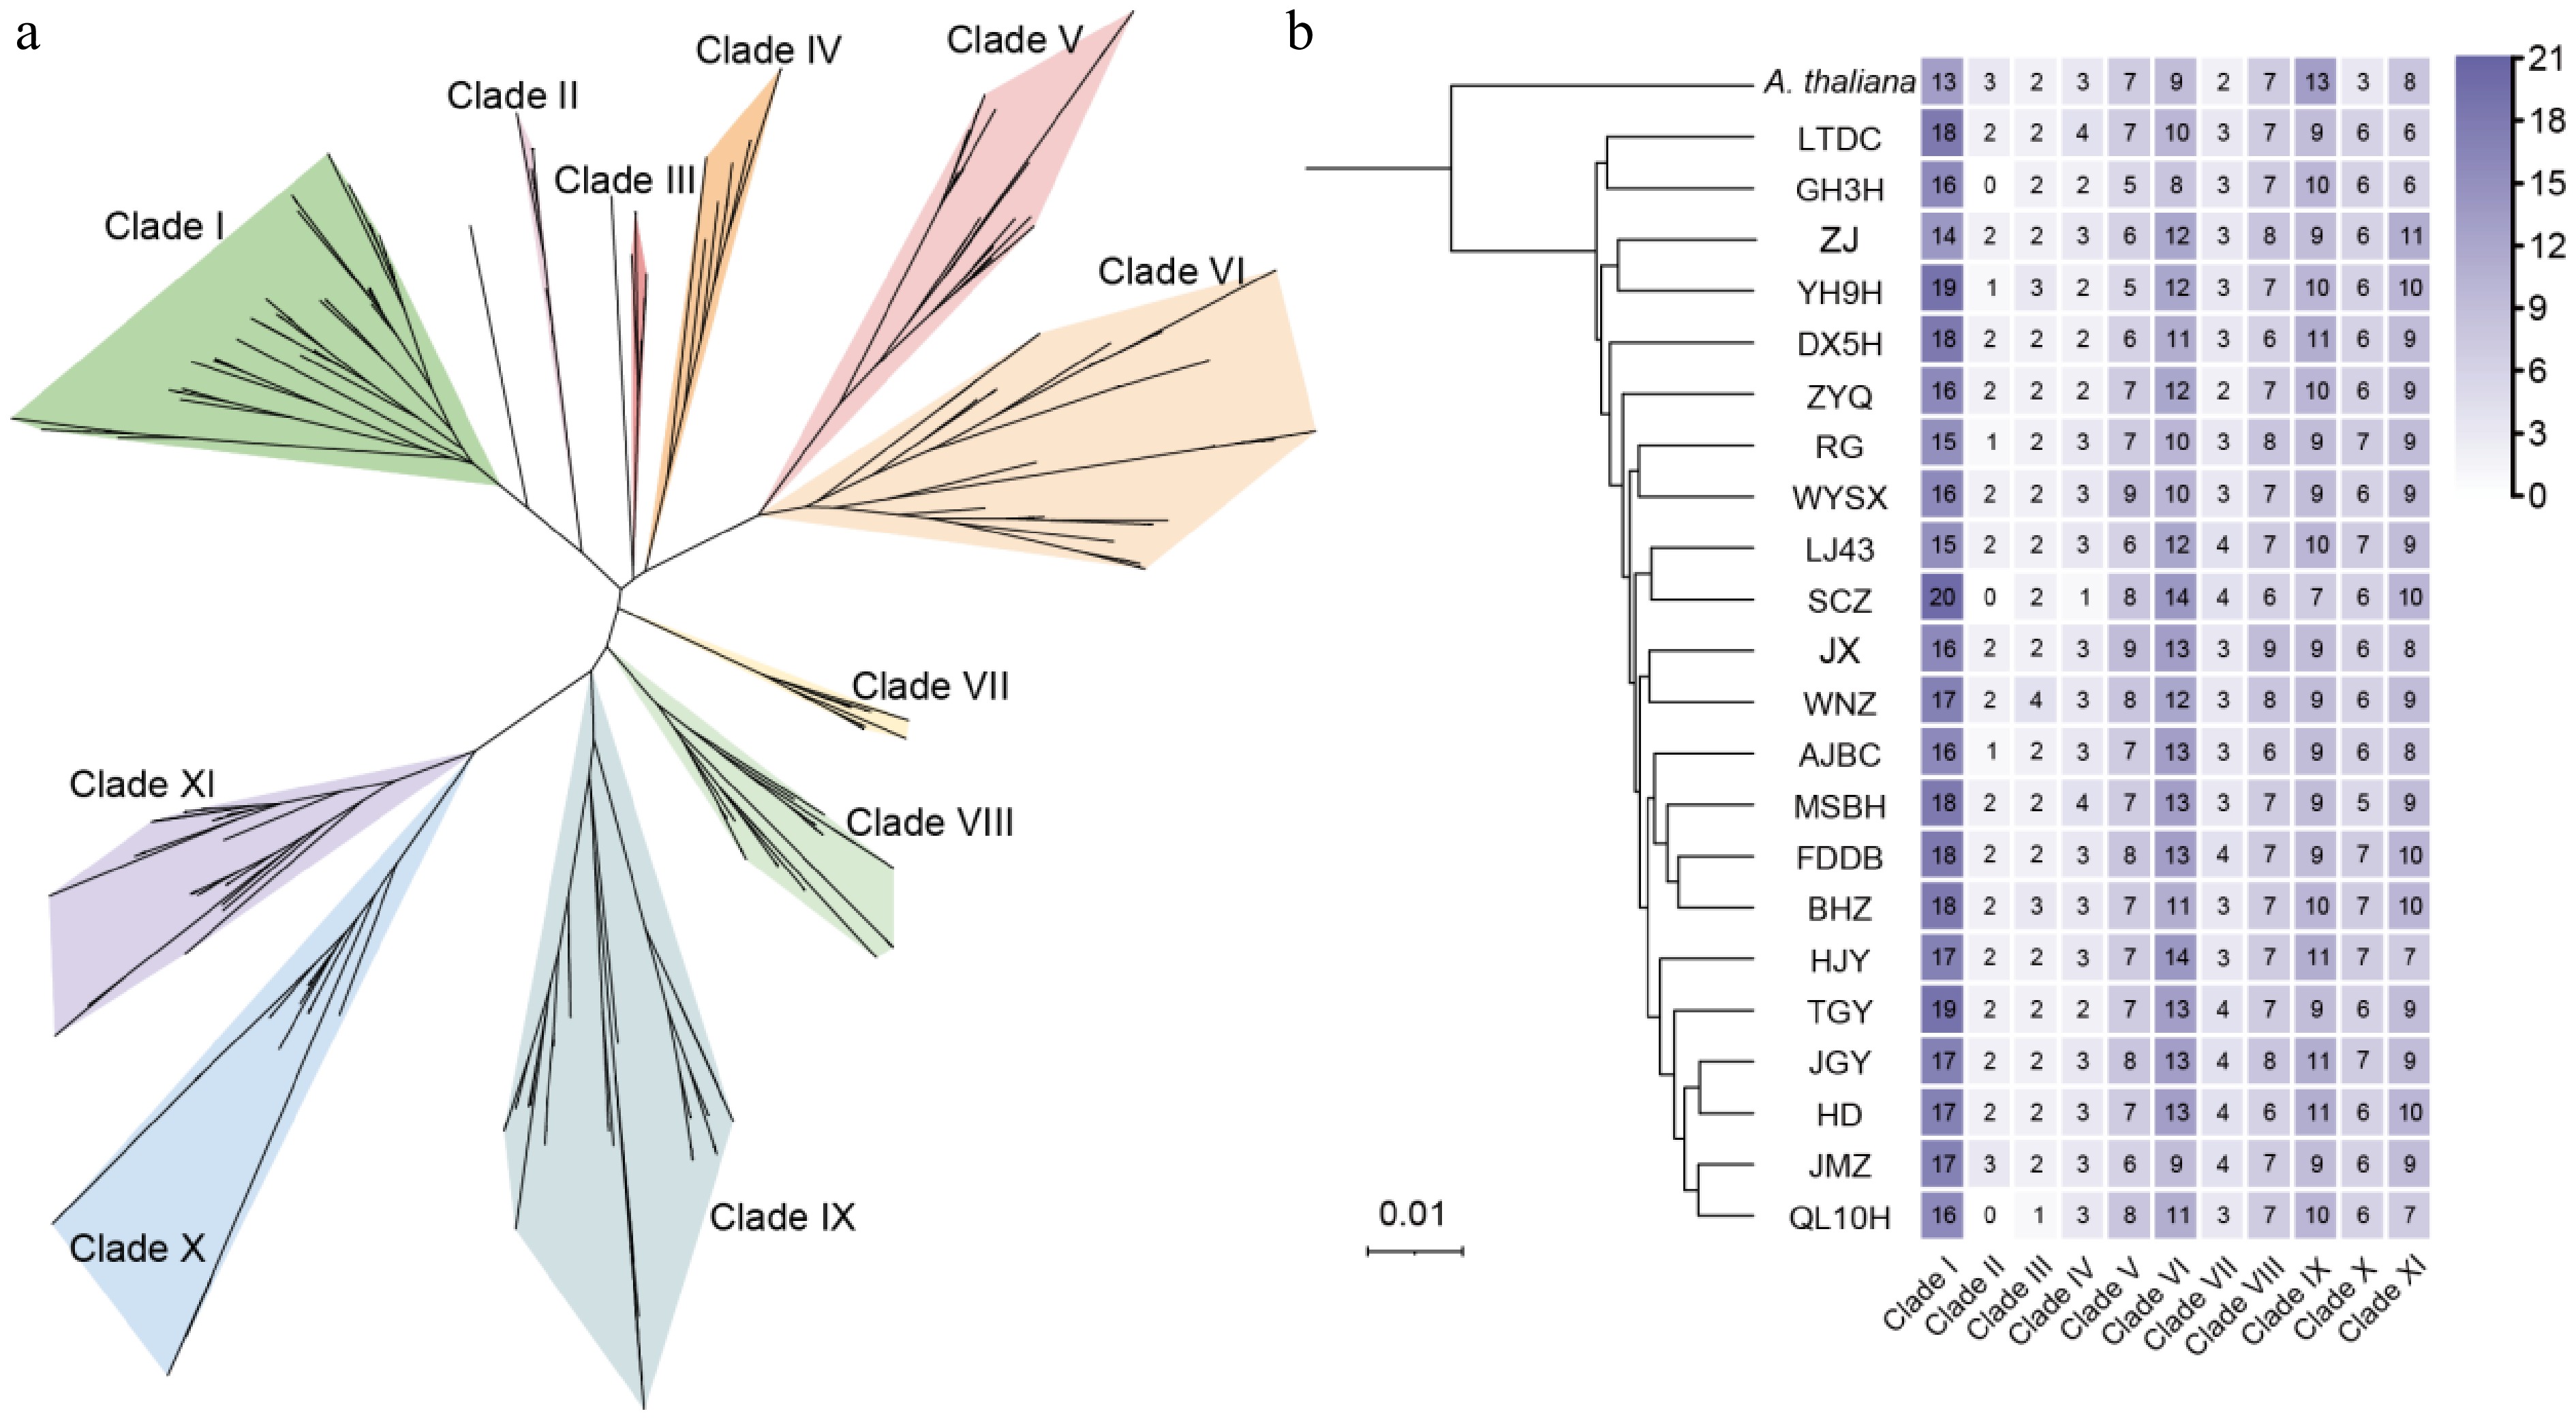
Figure 2.
Phylogenetic tree and quantitative statistics of WRKY members in 22 tea plant genomes. (a) The background colors in the phylogenetic tree are used to distinguish different evolutionary clades. (b) The phylogenetic tree is derived from previously published literature. The numbers in the heatmap represent the count of members from each cultivar within each clade, with color intensity ranging from light to dark indicating the corresponding member count.
-
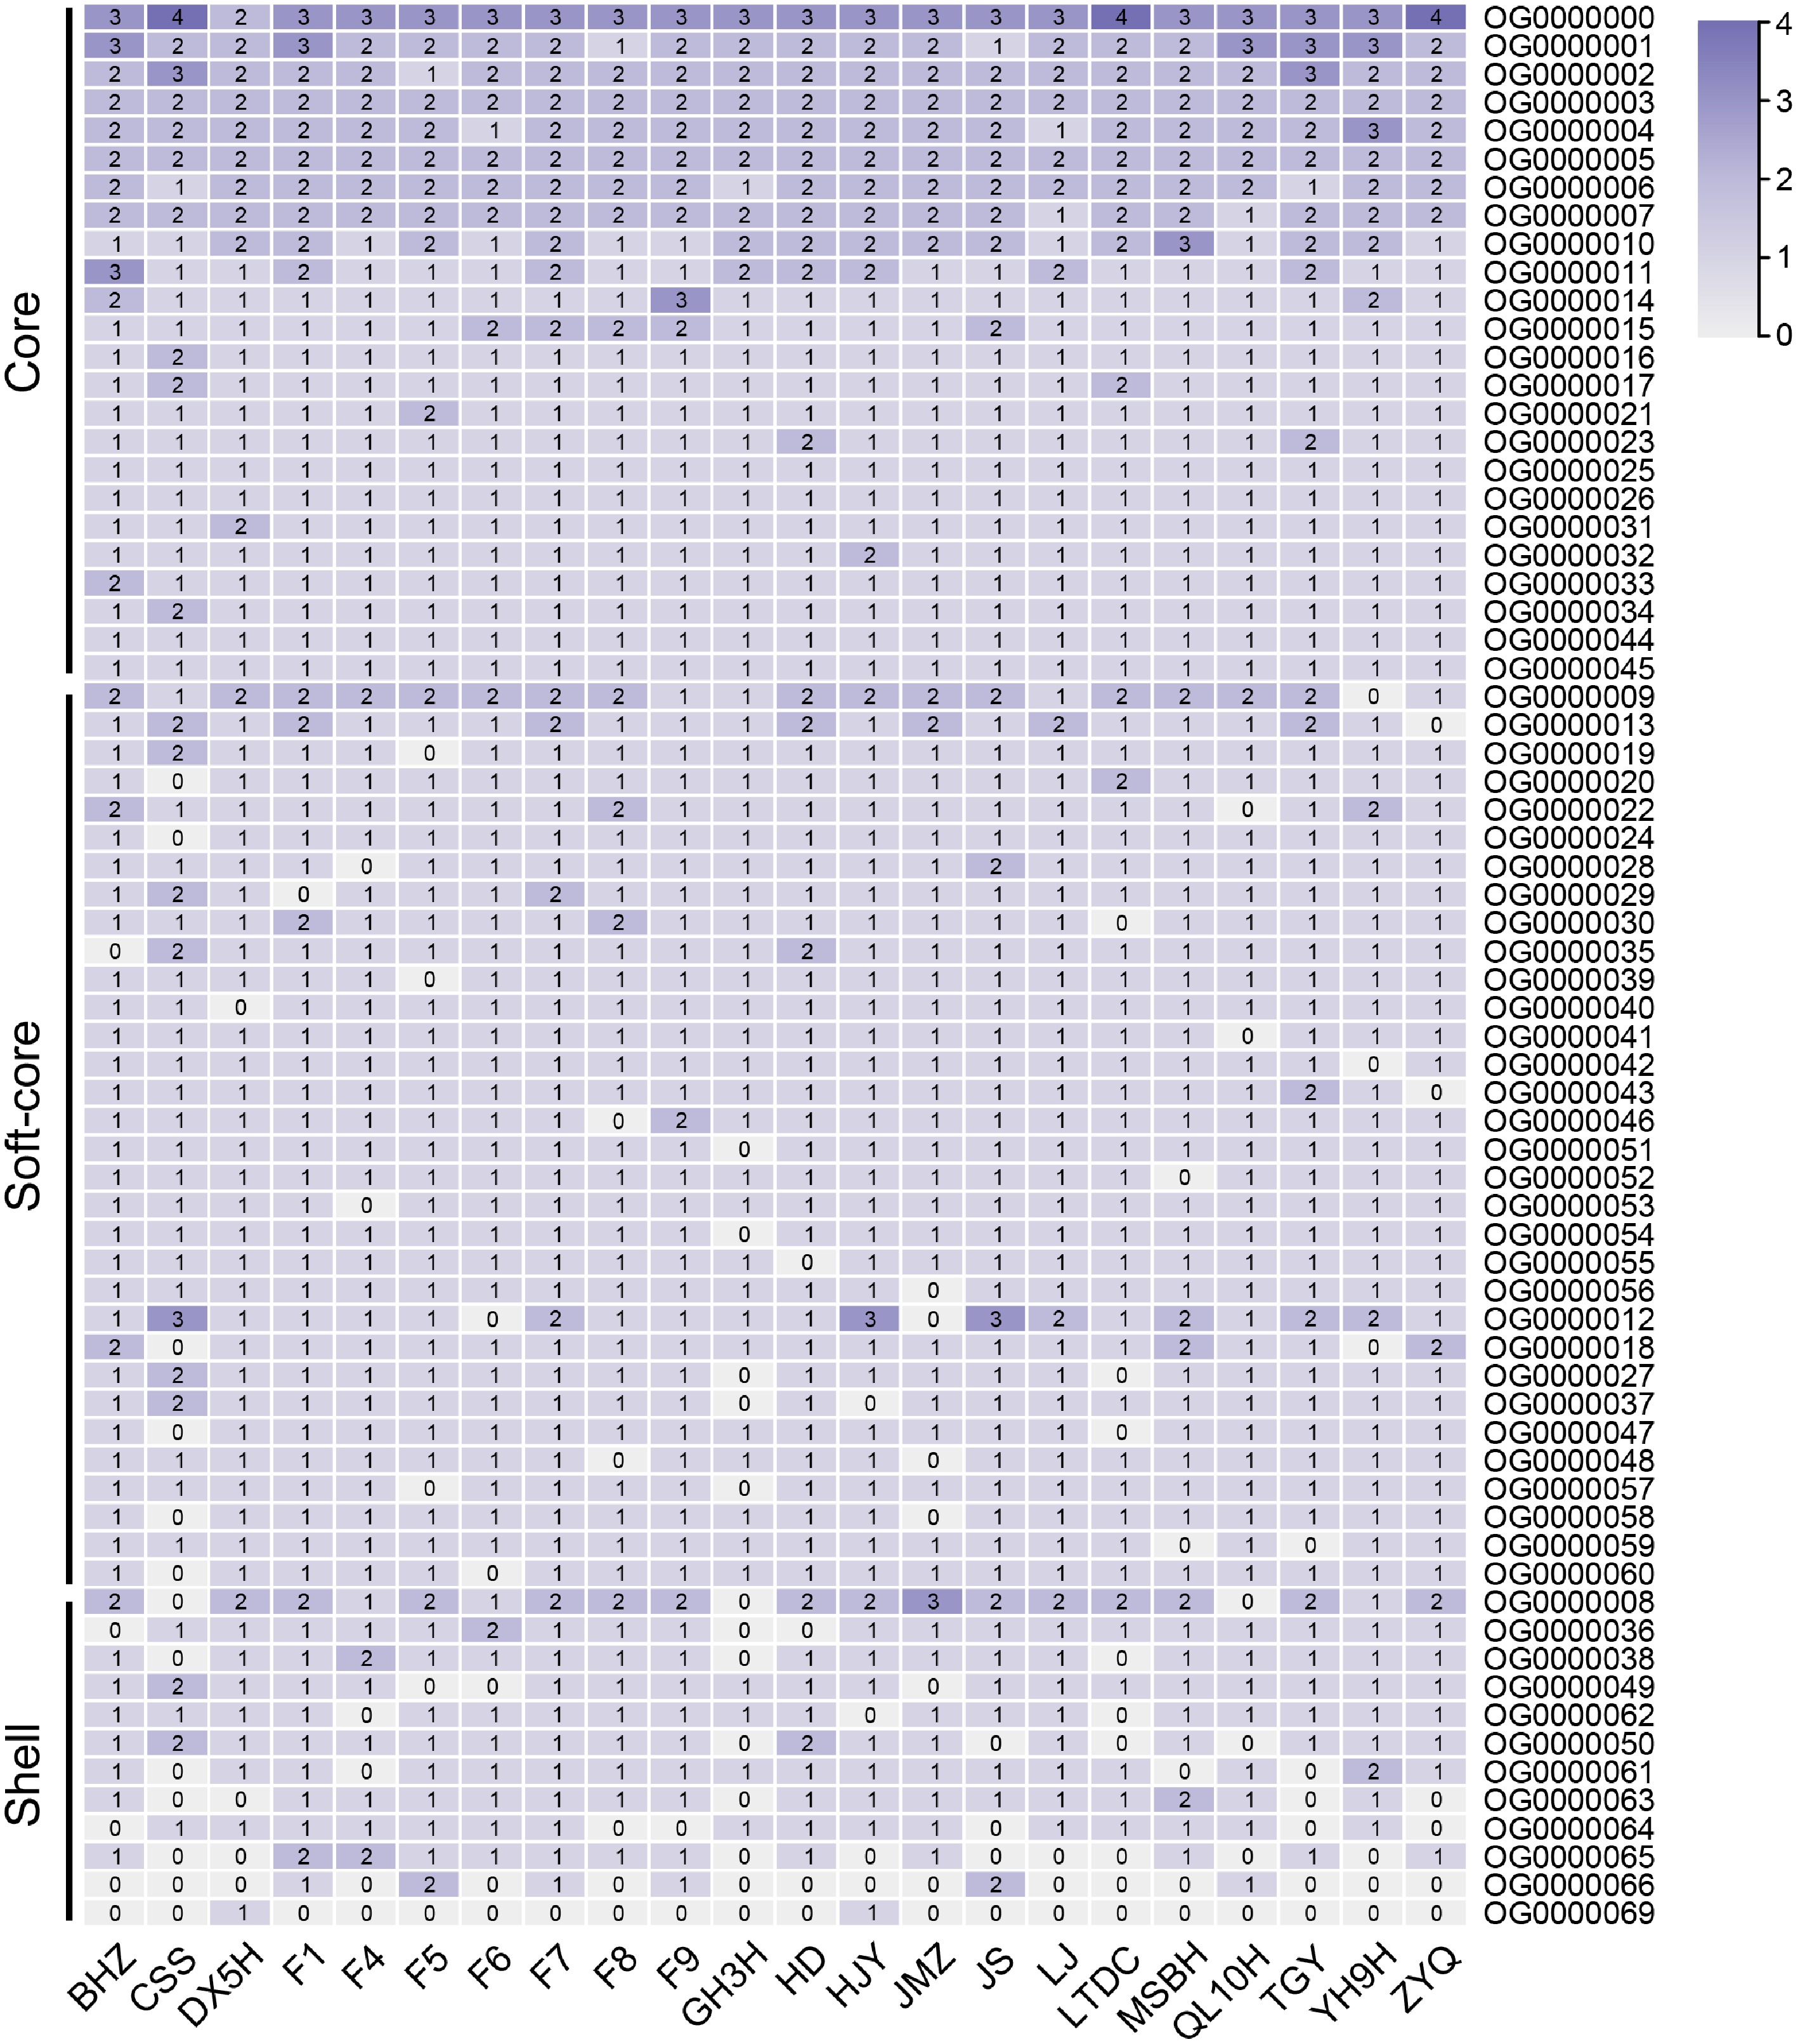
Figure 3.
Cluster analysis of tea plant WRKY members based on OrthoFinder results. "Core" represents gene clusters where members are present in all 22 tea plant cultivars. "Soft-core" represents gene clusters where members are present in at least 90% of the tea plant cultivars. "Shell" represents gene clusters where members are present in less than 90% of the tea plant cultivars.
-
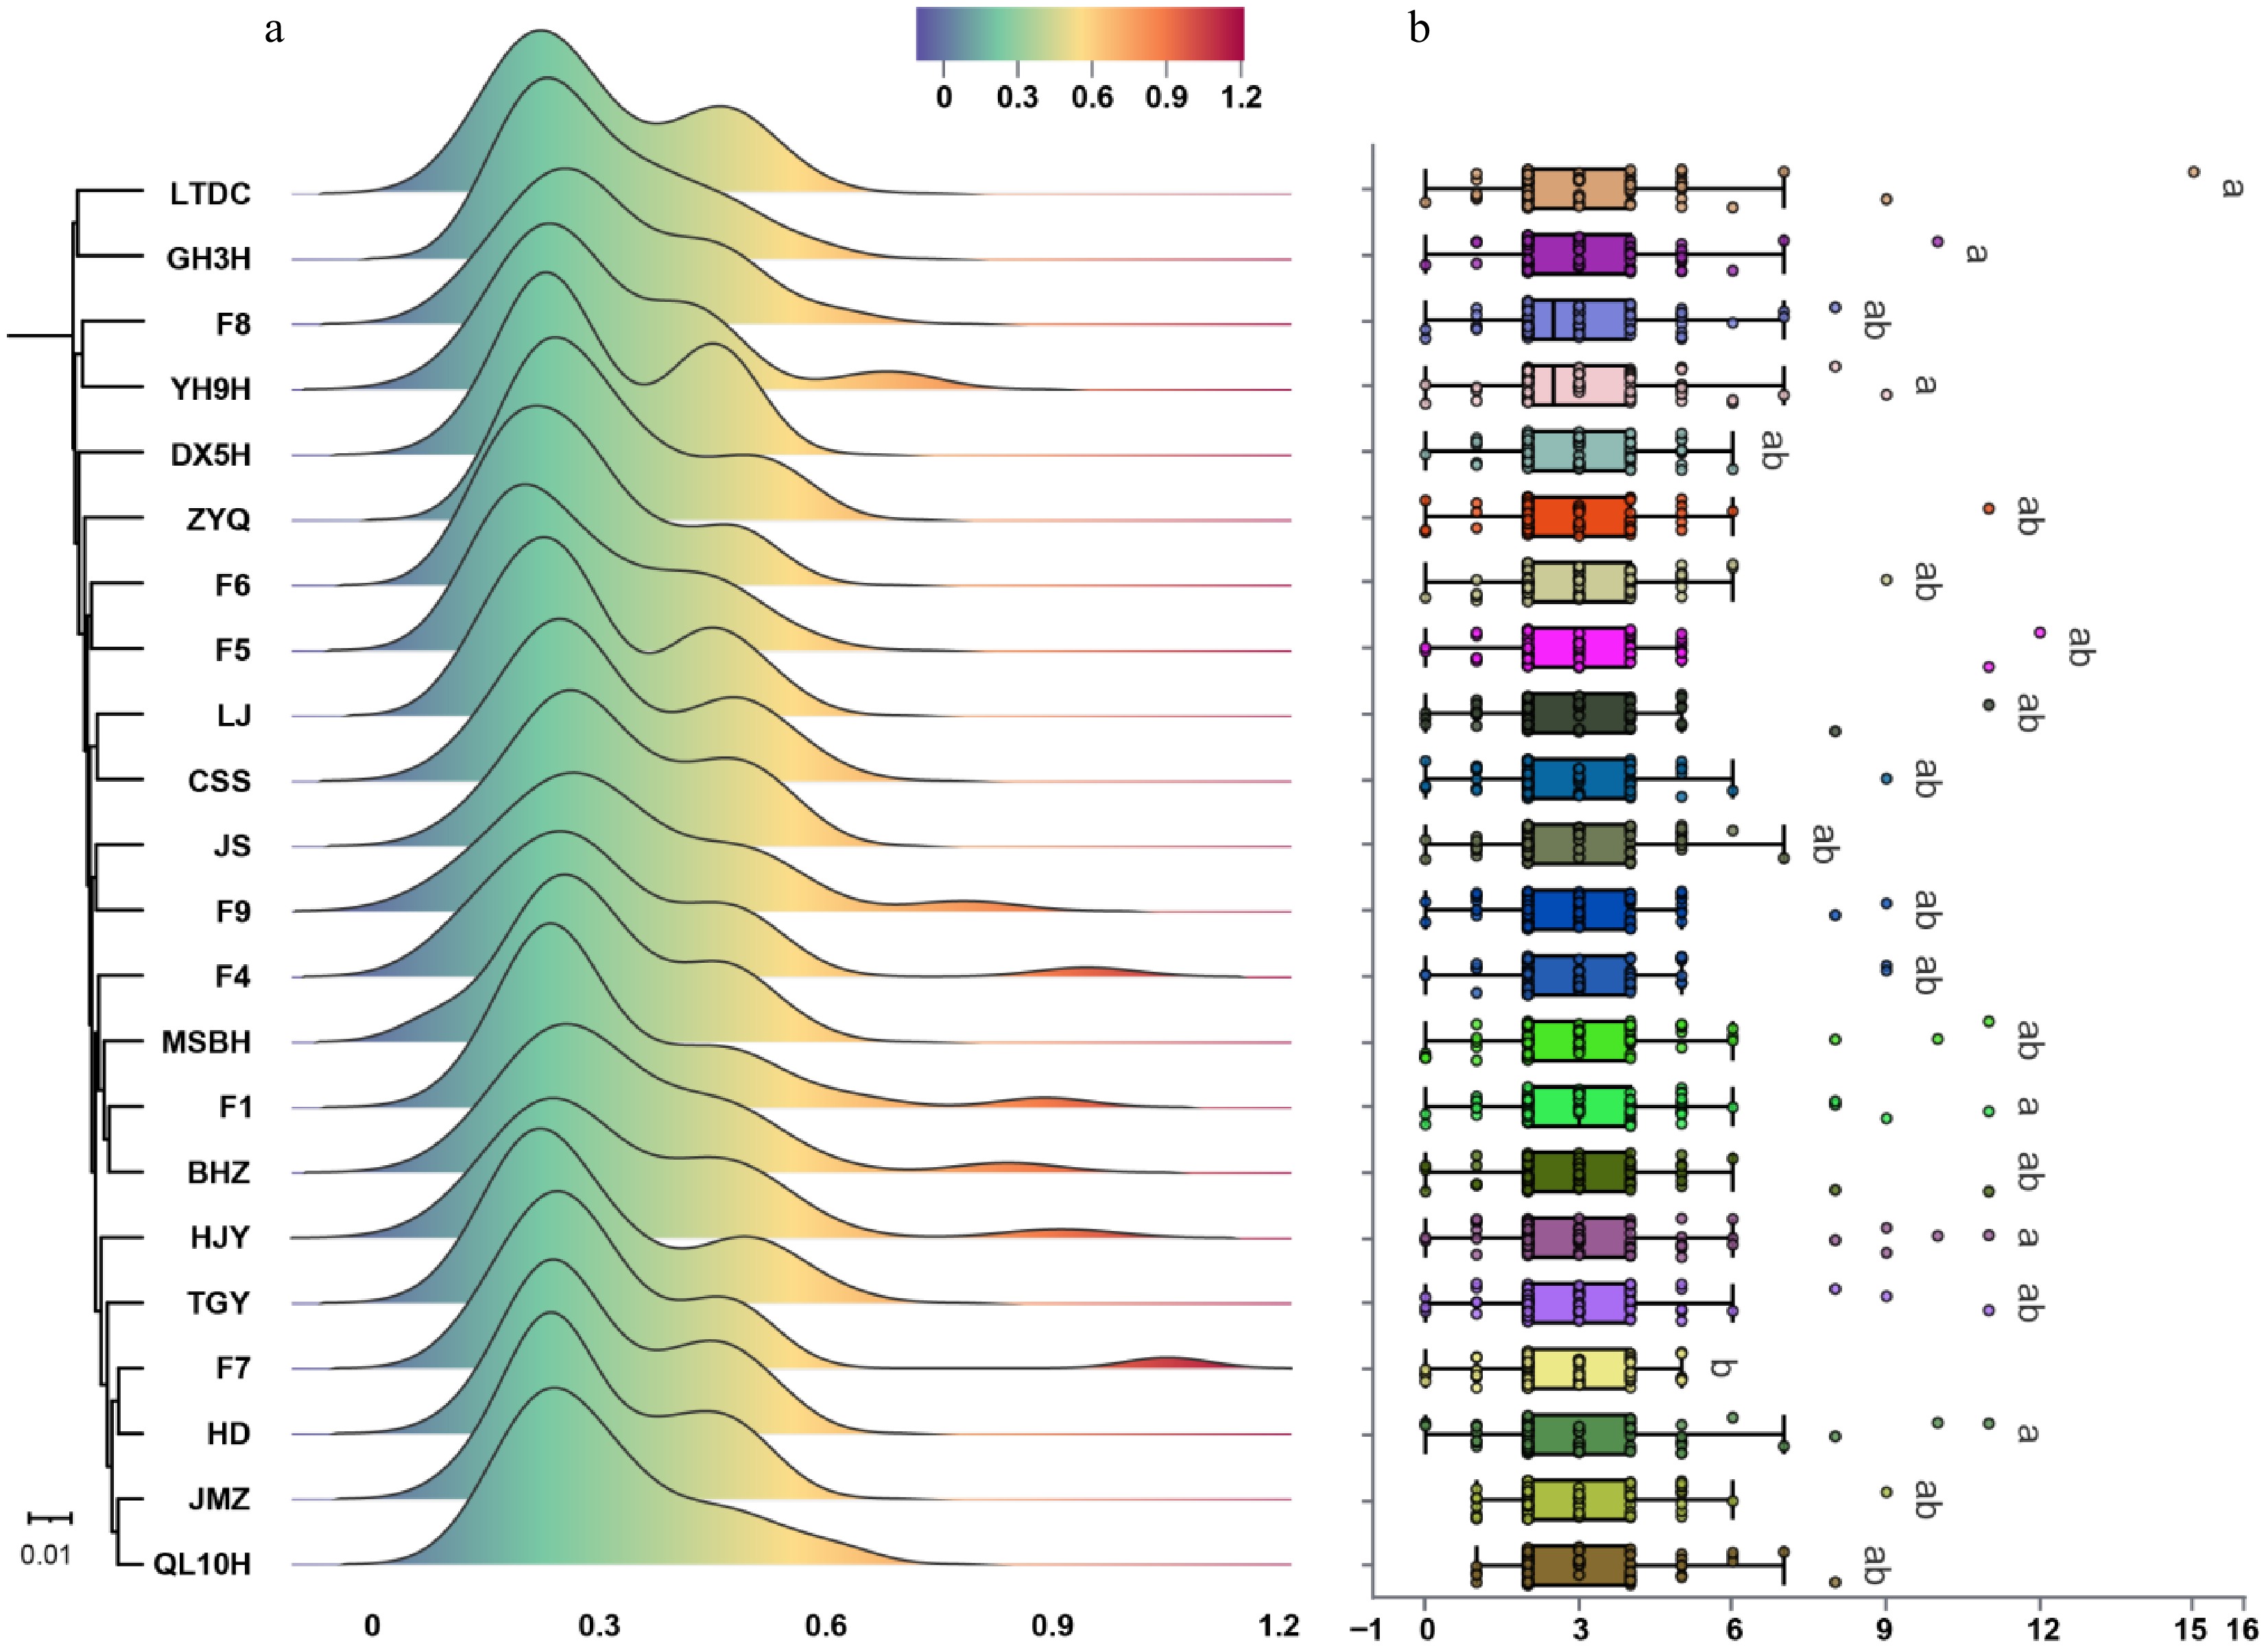
Figure 4.
Ka/Ks analysis and intron number identification of WRKY members in 22 tea plant cultivars. (a) Distribution of Ka/Ks values among WRKY members in 22 tea plant cultivars. (b) Statistics of intron numbers in WRKY members across 22 tea plant cultivars. Significance analysis was performed using ANOVA, followed by Fisher's LSD post hoc test.
-
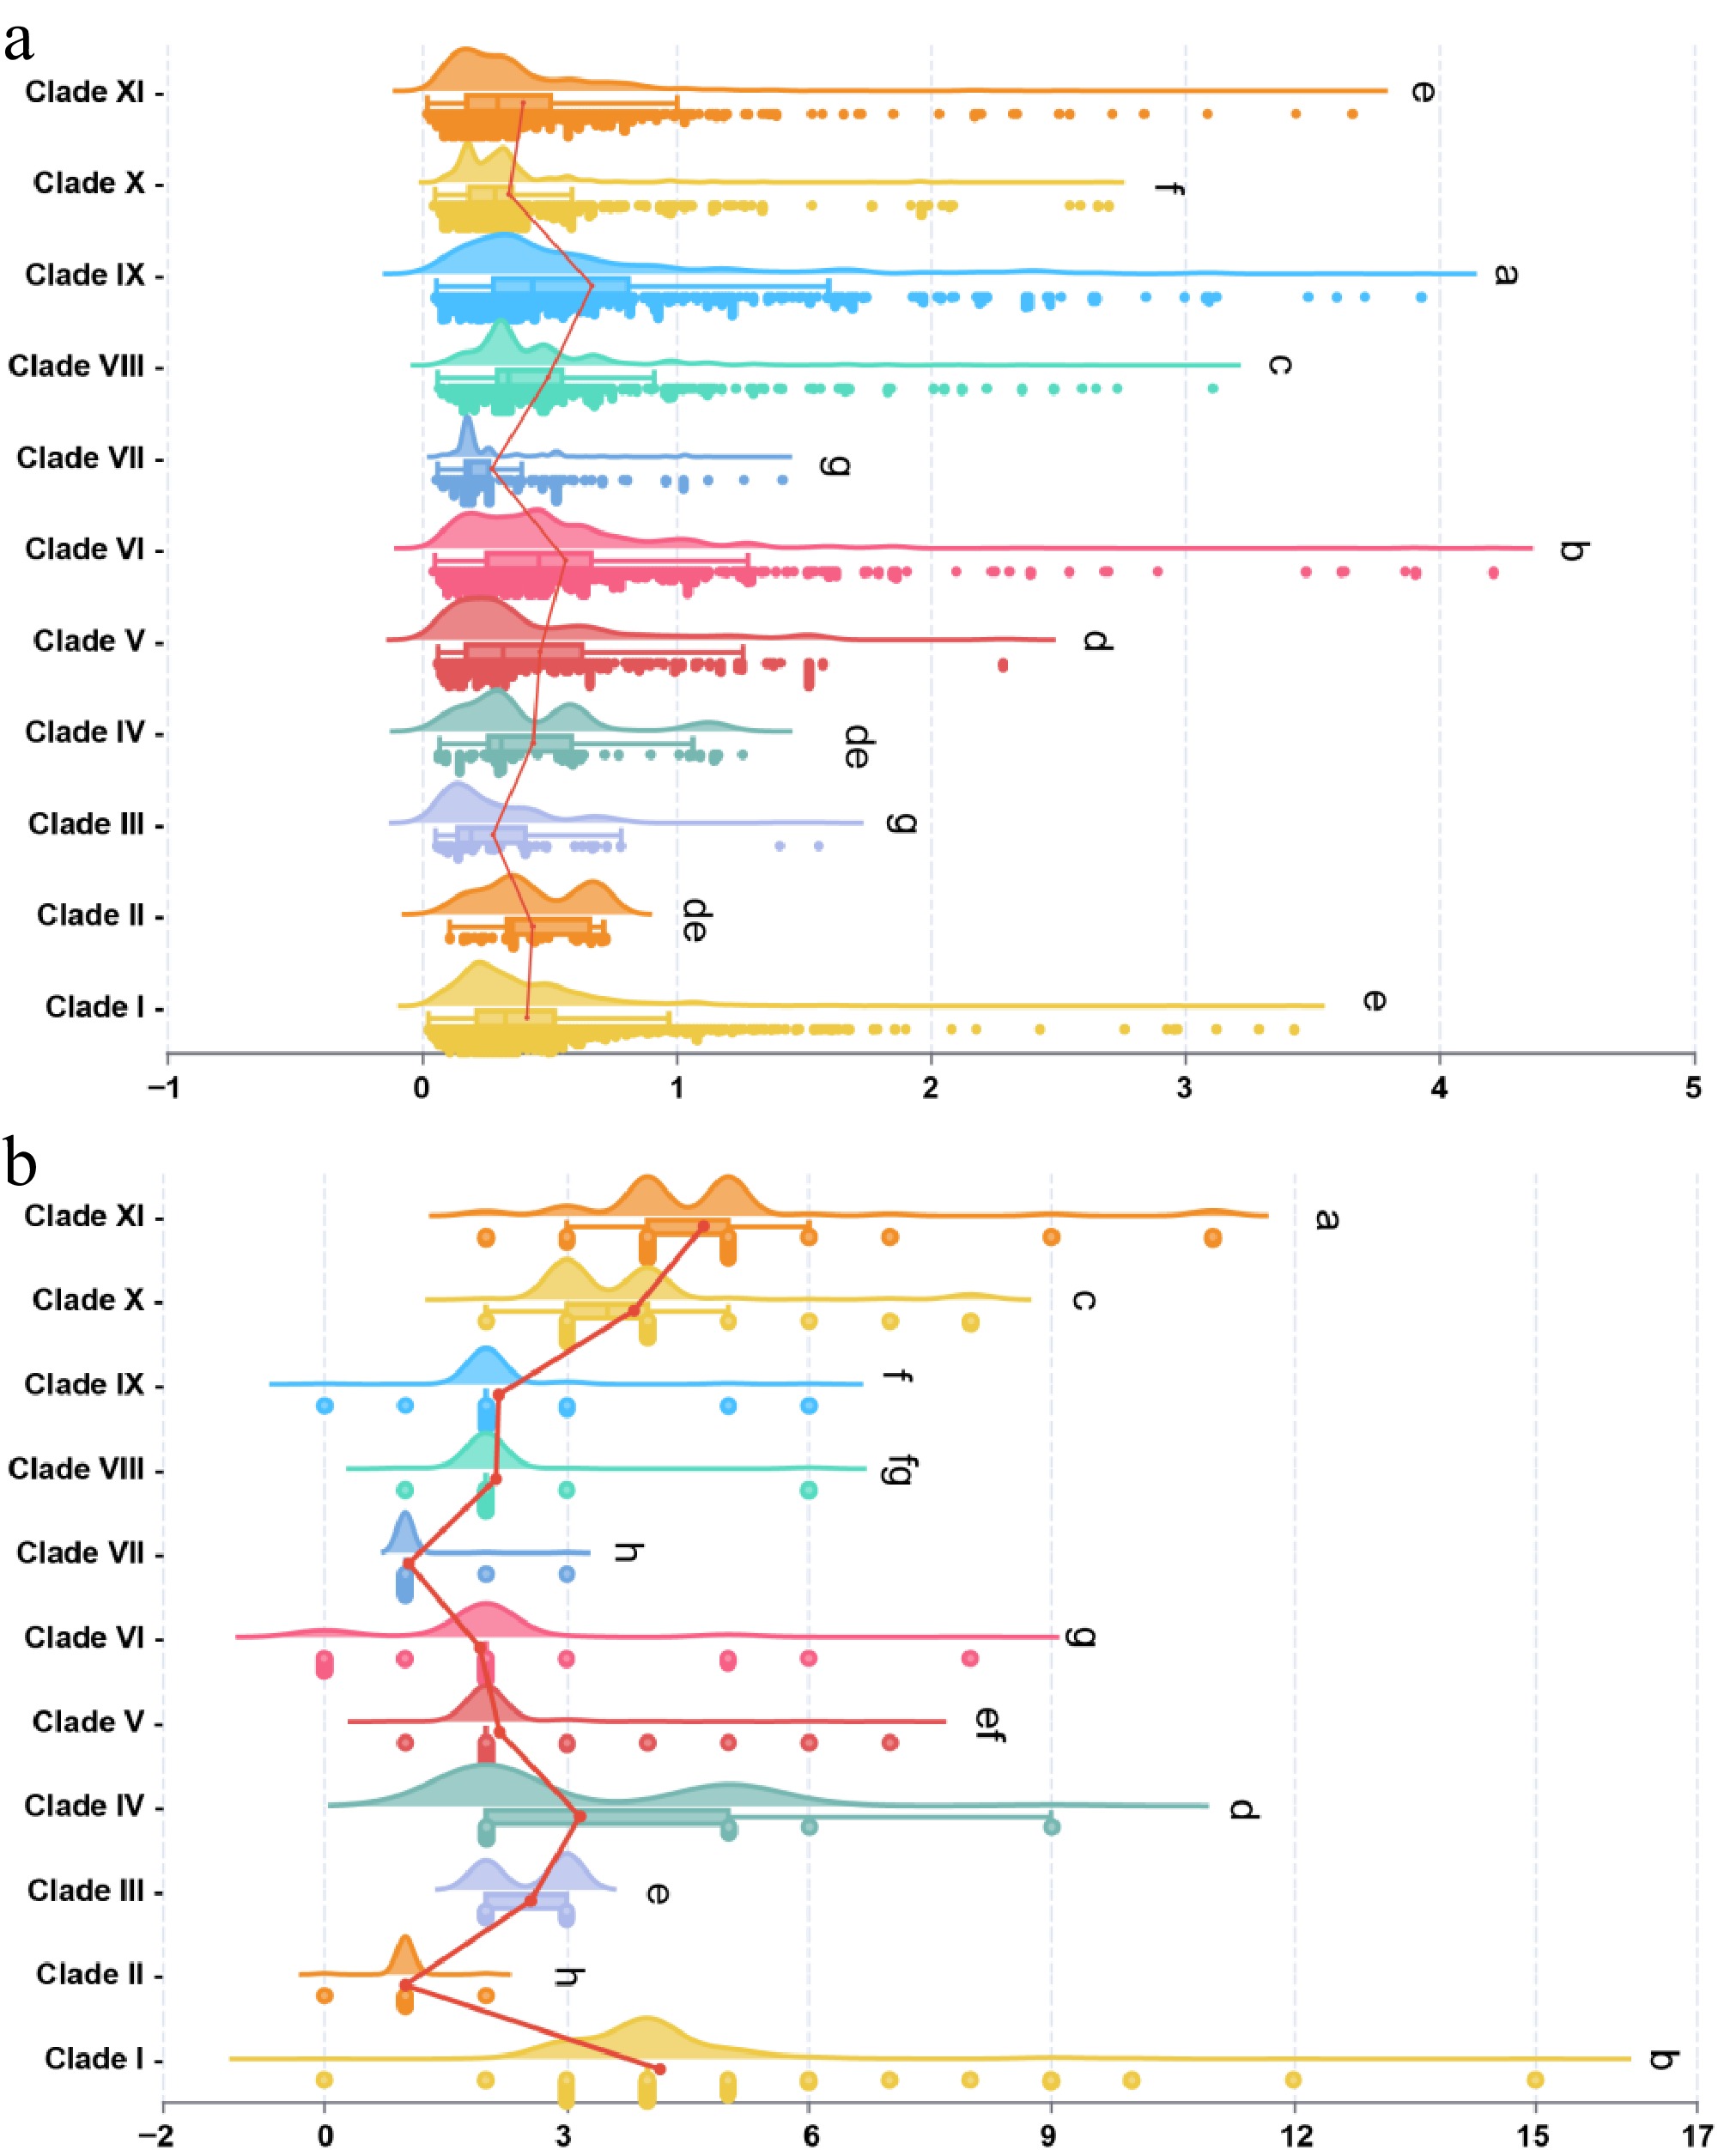
Figure 5.
Ka/Ks analysis and intron number statistics of WRKY members across 11 clades. (a) Distribution of Ka/Ks values among WRKY members in the 11 clades. (b) Statistics of intron numbers in WRKY members across the 11 clades. Significance analysis was performed using ANOVA, followed by Fisher's LSD post hoc test.
-
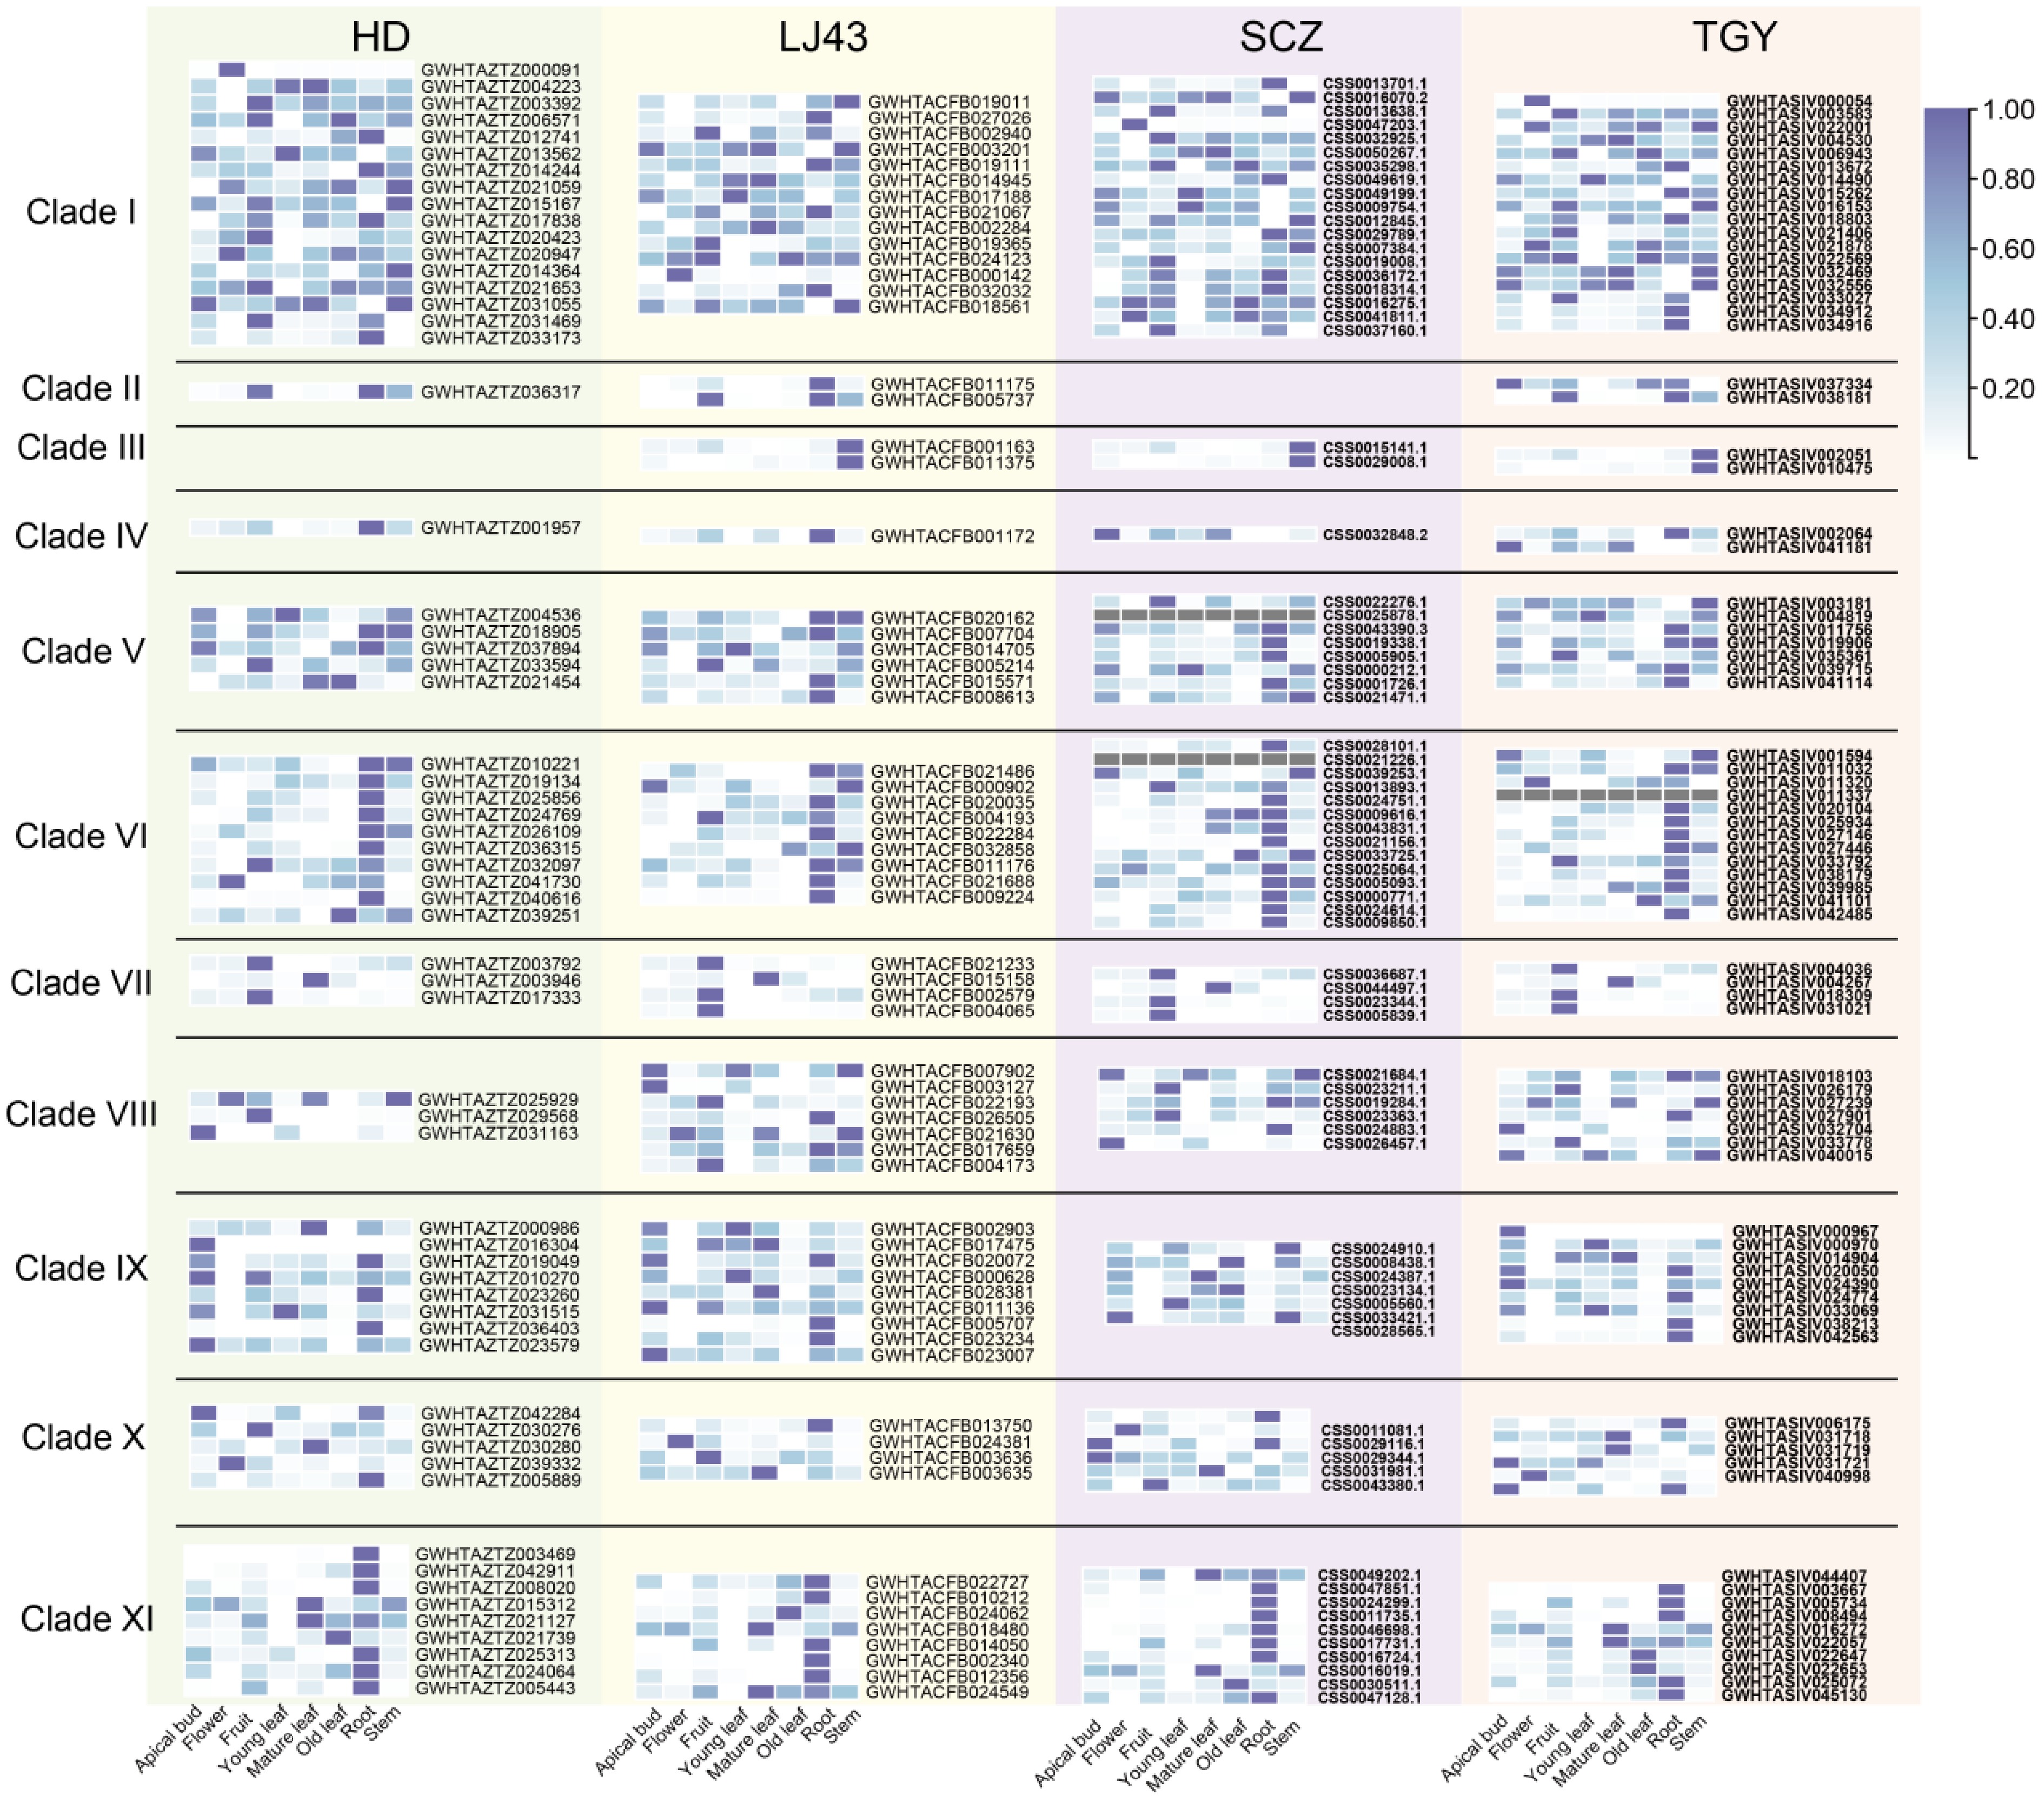
Figure 6.
Analysis of WRKY gene expression in different tissues of tea plants.
-
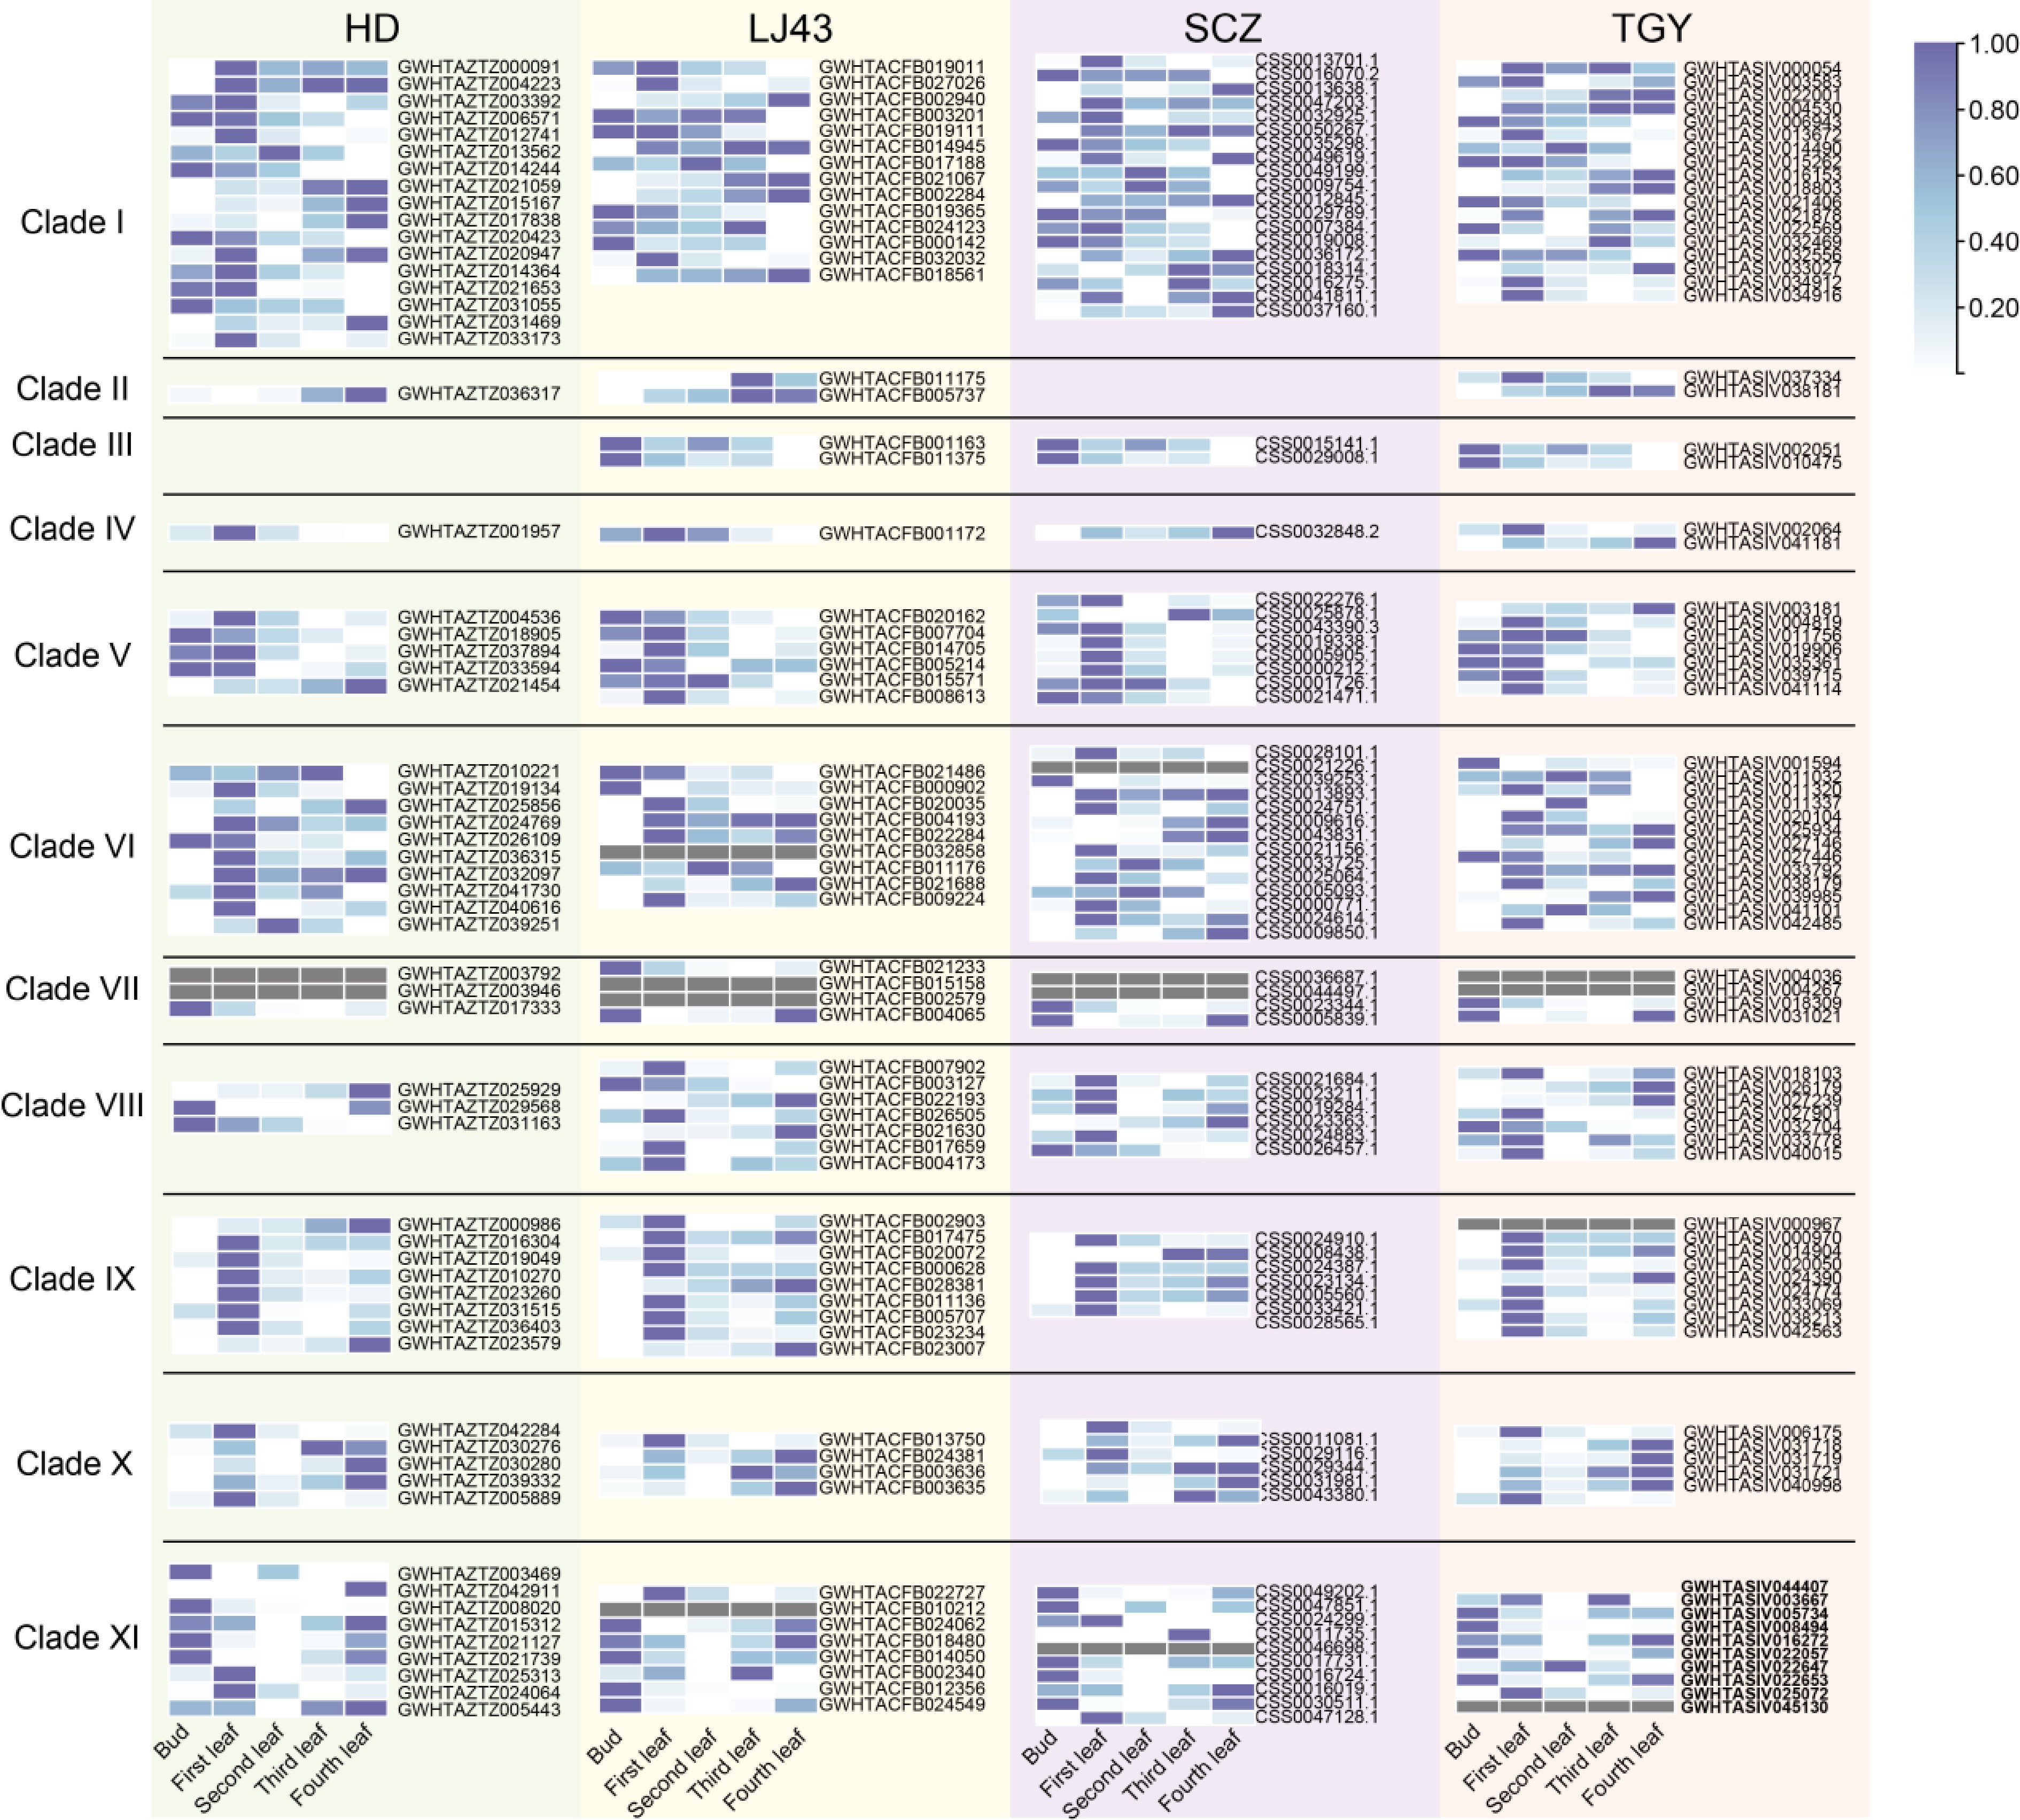
Figure 7.
Expression analysis of WRKY genes at different leaf developmental stages in tea plants.
Figures
(7)
Tables
(0)