-
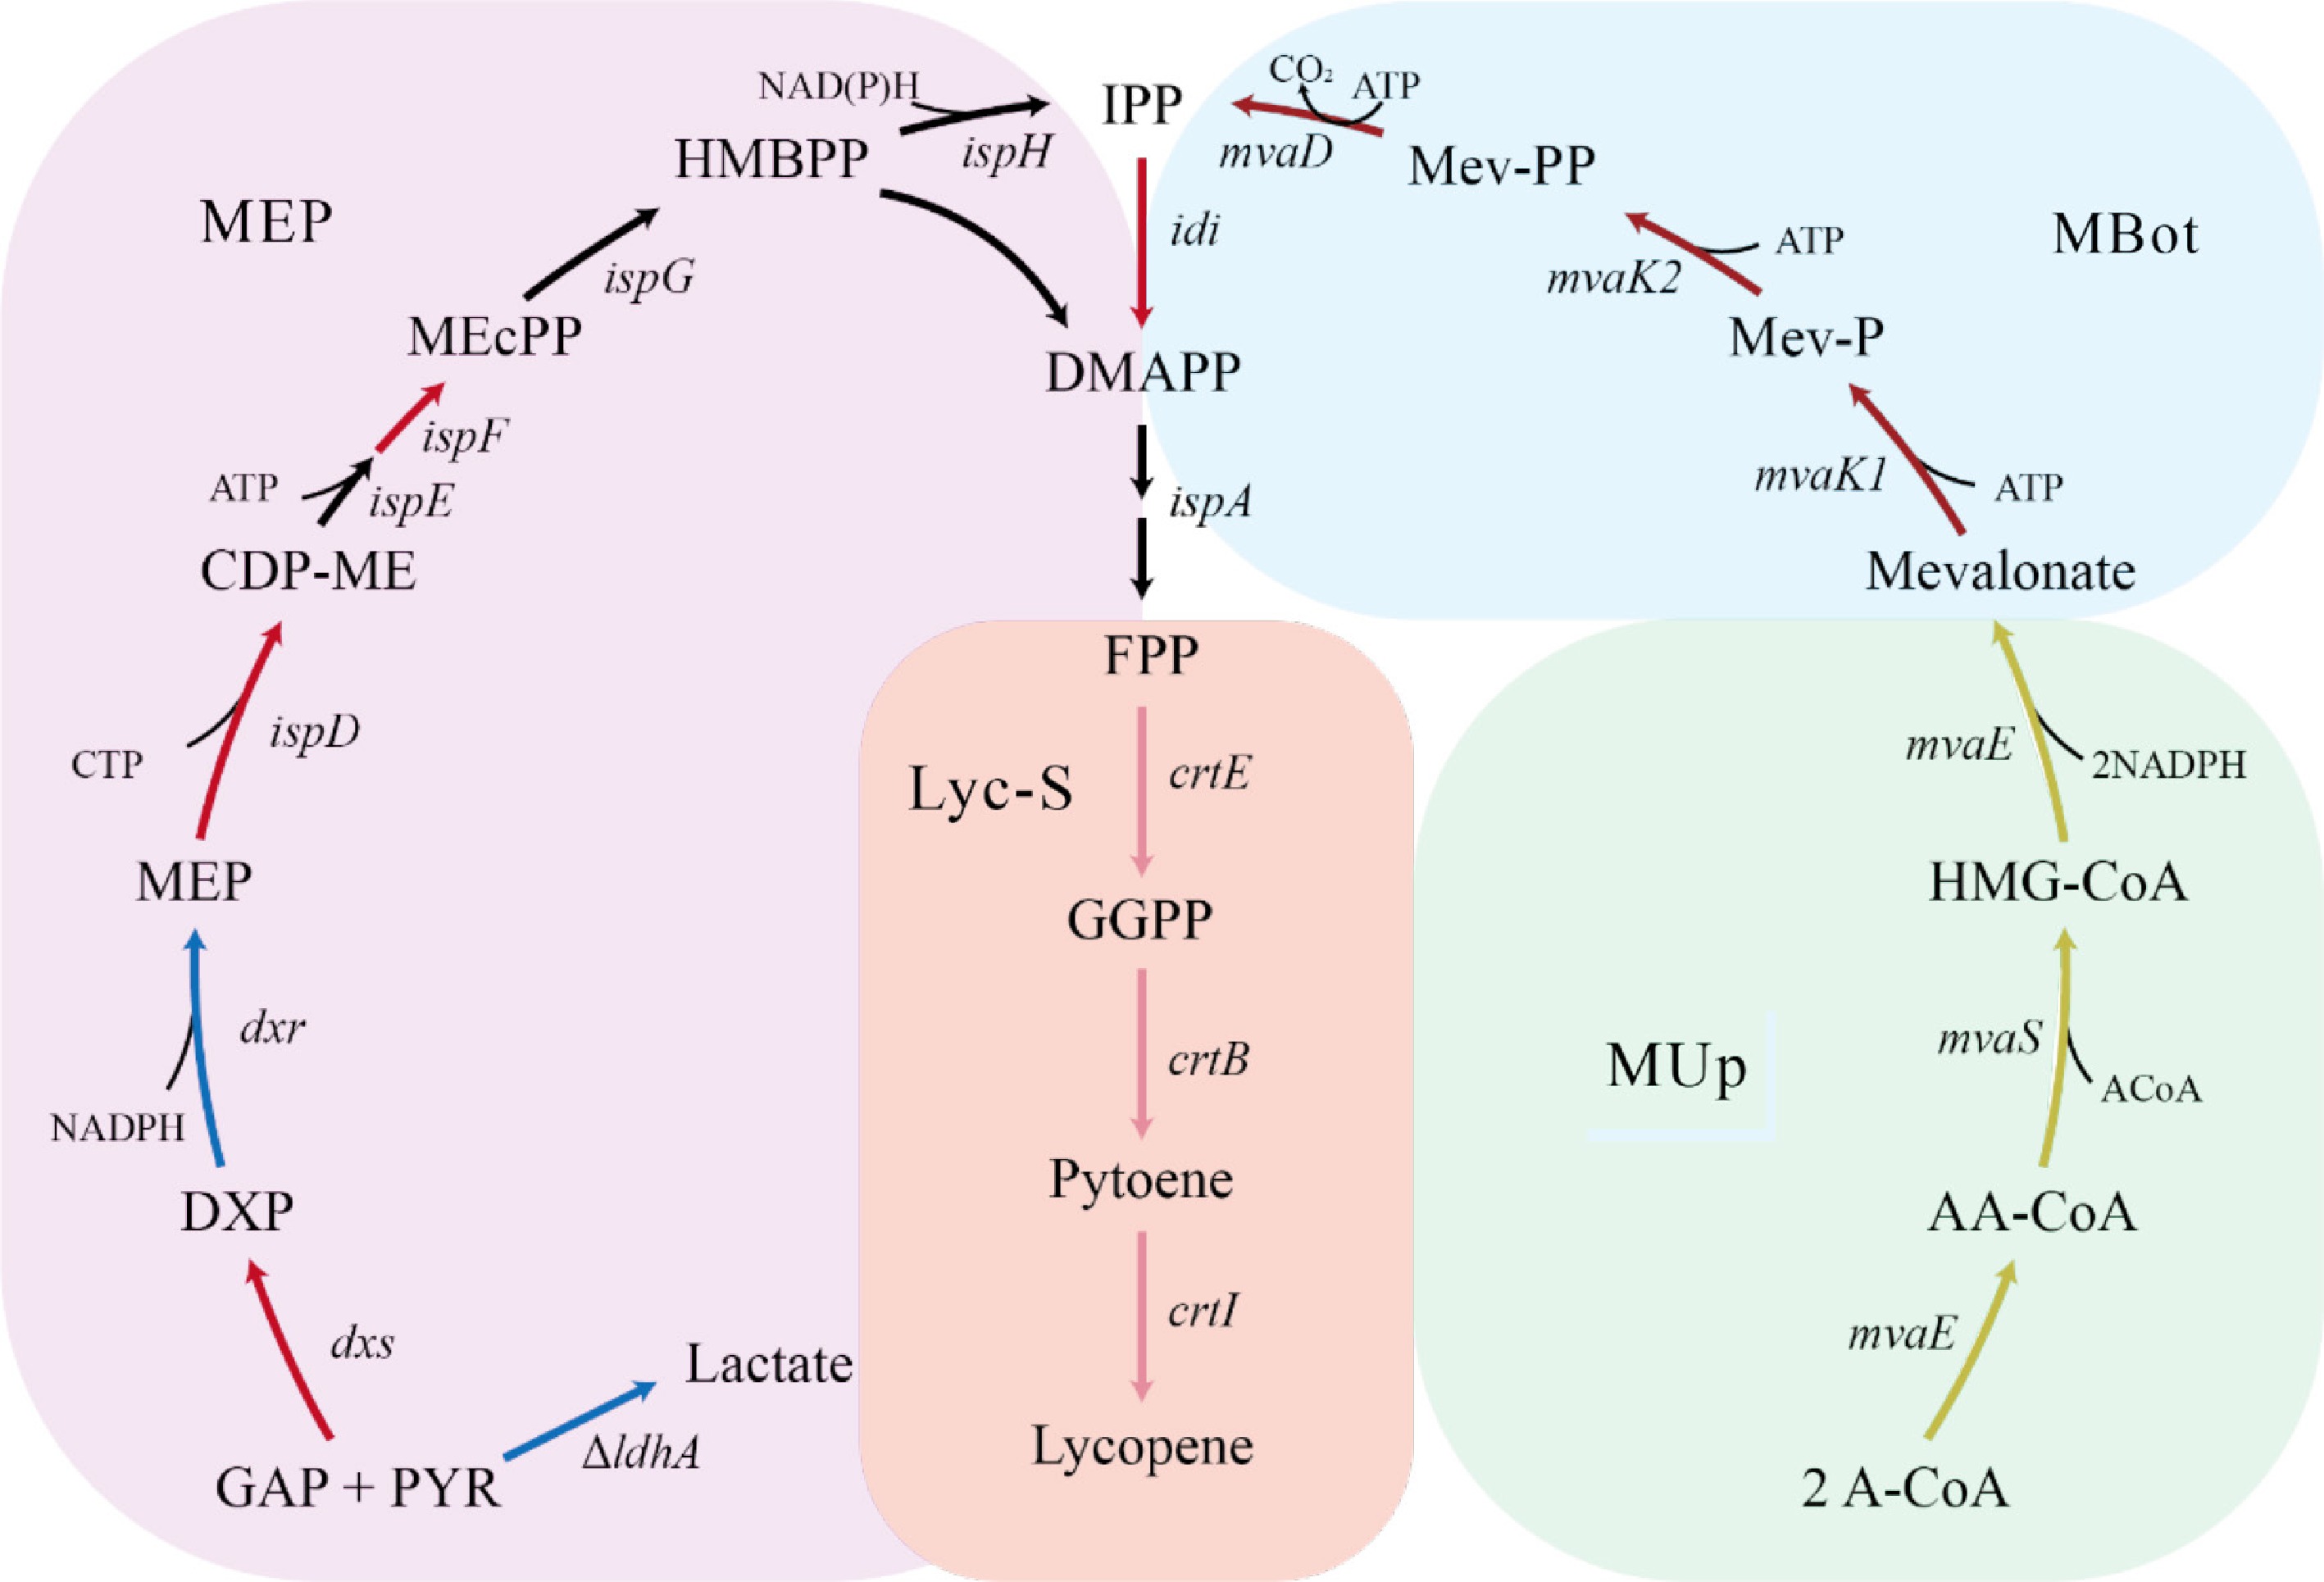
Figure 1.
Metabolic pathway for lycopene biosynthesis. GAP, glyceraldehyde-3-phosphate; PYR, pyruvate; DXP, 1-deoxy-D-xylulose-5-phosphate; MEP, methylerythritol-4-phosphate; CDP-ME, 4-diphosphocytidyl-2-C-methyl-D-erythritol; MEcPP, 2-C-methyl-D-erythritol-2,4-cyclodiphosphate; HMBPP, 2-Chydroxymethylbutenyl-4-diphosphate; IPP, isopentenyl pyrophosphate; DMAPP, dimethylallyl pyrophosphate; A-CoA, acetyl-CoA; AA-CoA, acetoacetyl-CoA; HMG-CoA, 3-hydroxy-3-methylglutaryl-CoA; Mevalonate, mevalonic acid; Mev-P, mevalonate-5-phosphate; Mev-PP, mevalonate-5-pyrophosphate; FPP, farnesyl pyrophosphate; GGPP, geranylgeranyl pyrophosphate; Phytoene, phytoene. Enzyme abbreviations: dxs, DXP synthase; dxr, DXP reductoisomerase; ispD, ispE, ispF, MEcPP synthase complex; ispG, MEcPP lyase; ispH, HMBPP reductase; idi, IPP isomerase; ispA, FPP synthase; crtE, GGPP synthase; crtB, phytoene synthase; crtI, phytoene desaturase; mvaE, cetoacetyl-CoA thiolase; mvaS, HMG-CoA synthase; mvaK1, mevalonate kinase; mvaK2, mevalonate-5-phosphate kinase; mvaD, mevalonate-5-pyrophosphate decarboxylase.
-
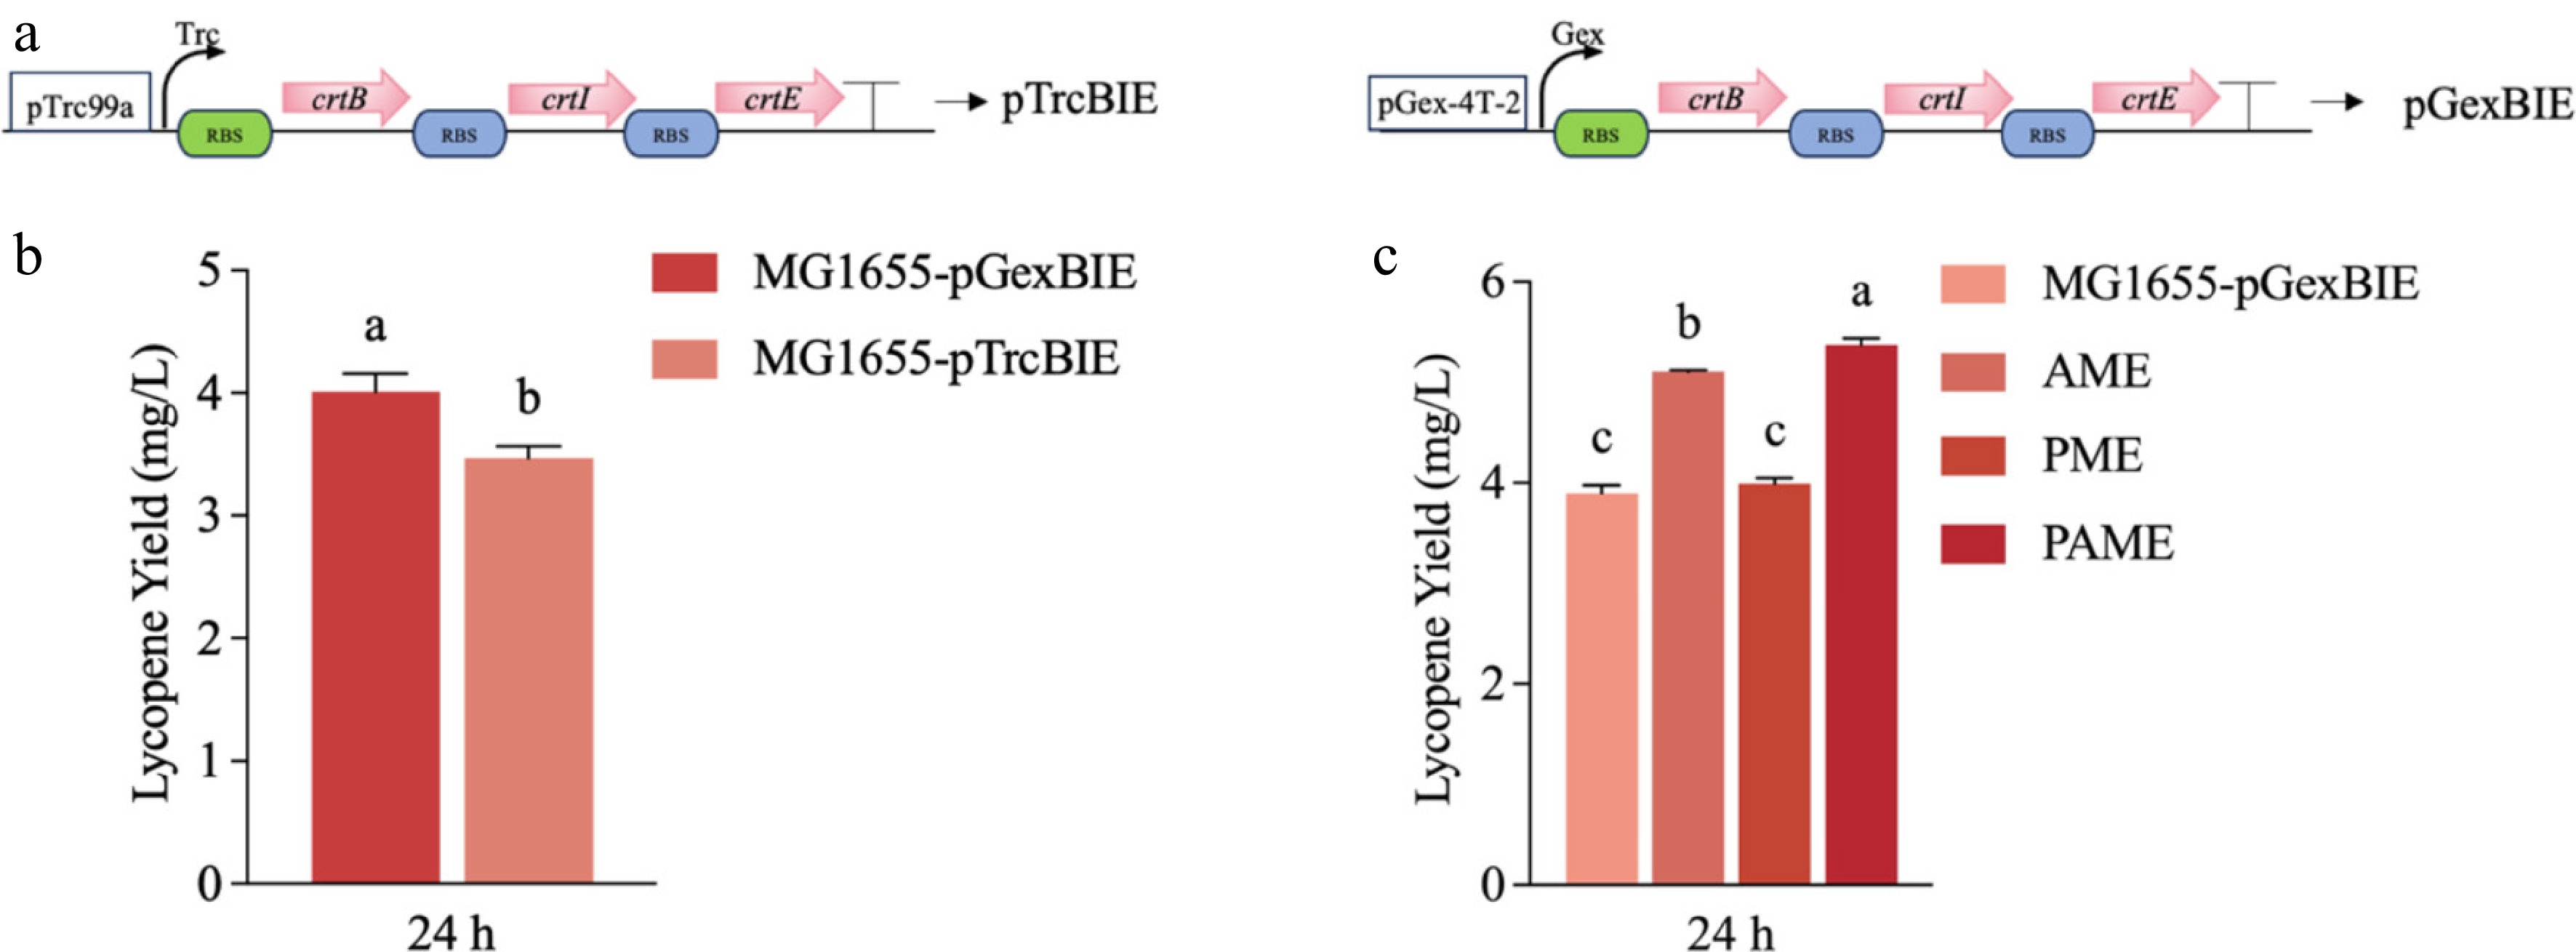
Figure 2.
Construction of the lycopene-synthesis module. (a) Genetic circuit diagrams of pTrcBIE and pGexBIE. Trc and Gex denote the Trc promoter and the Gex promoter, respectively, and a single arrow denotes one gene oriented 5′-3′. (b) Lycopene-producing capacities of pTrcBIE and pGexBIE in MG1655. (c) Effects of different MEP-pathway enhancement strategies on lycopene production. Values are means ± SD. Different lowercase letters (a, b, c) above the bars indicate significant differences among groups (p < 0.05).
-
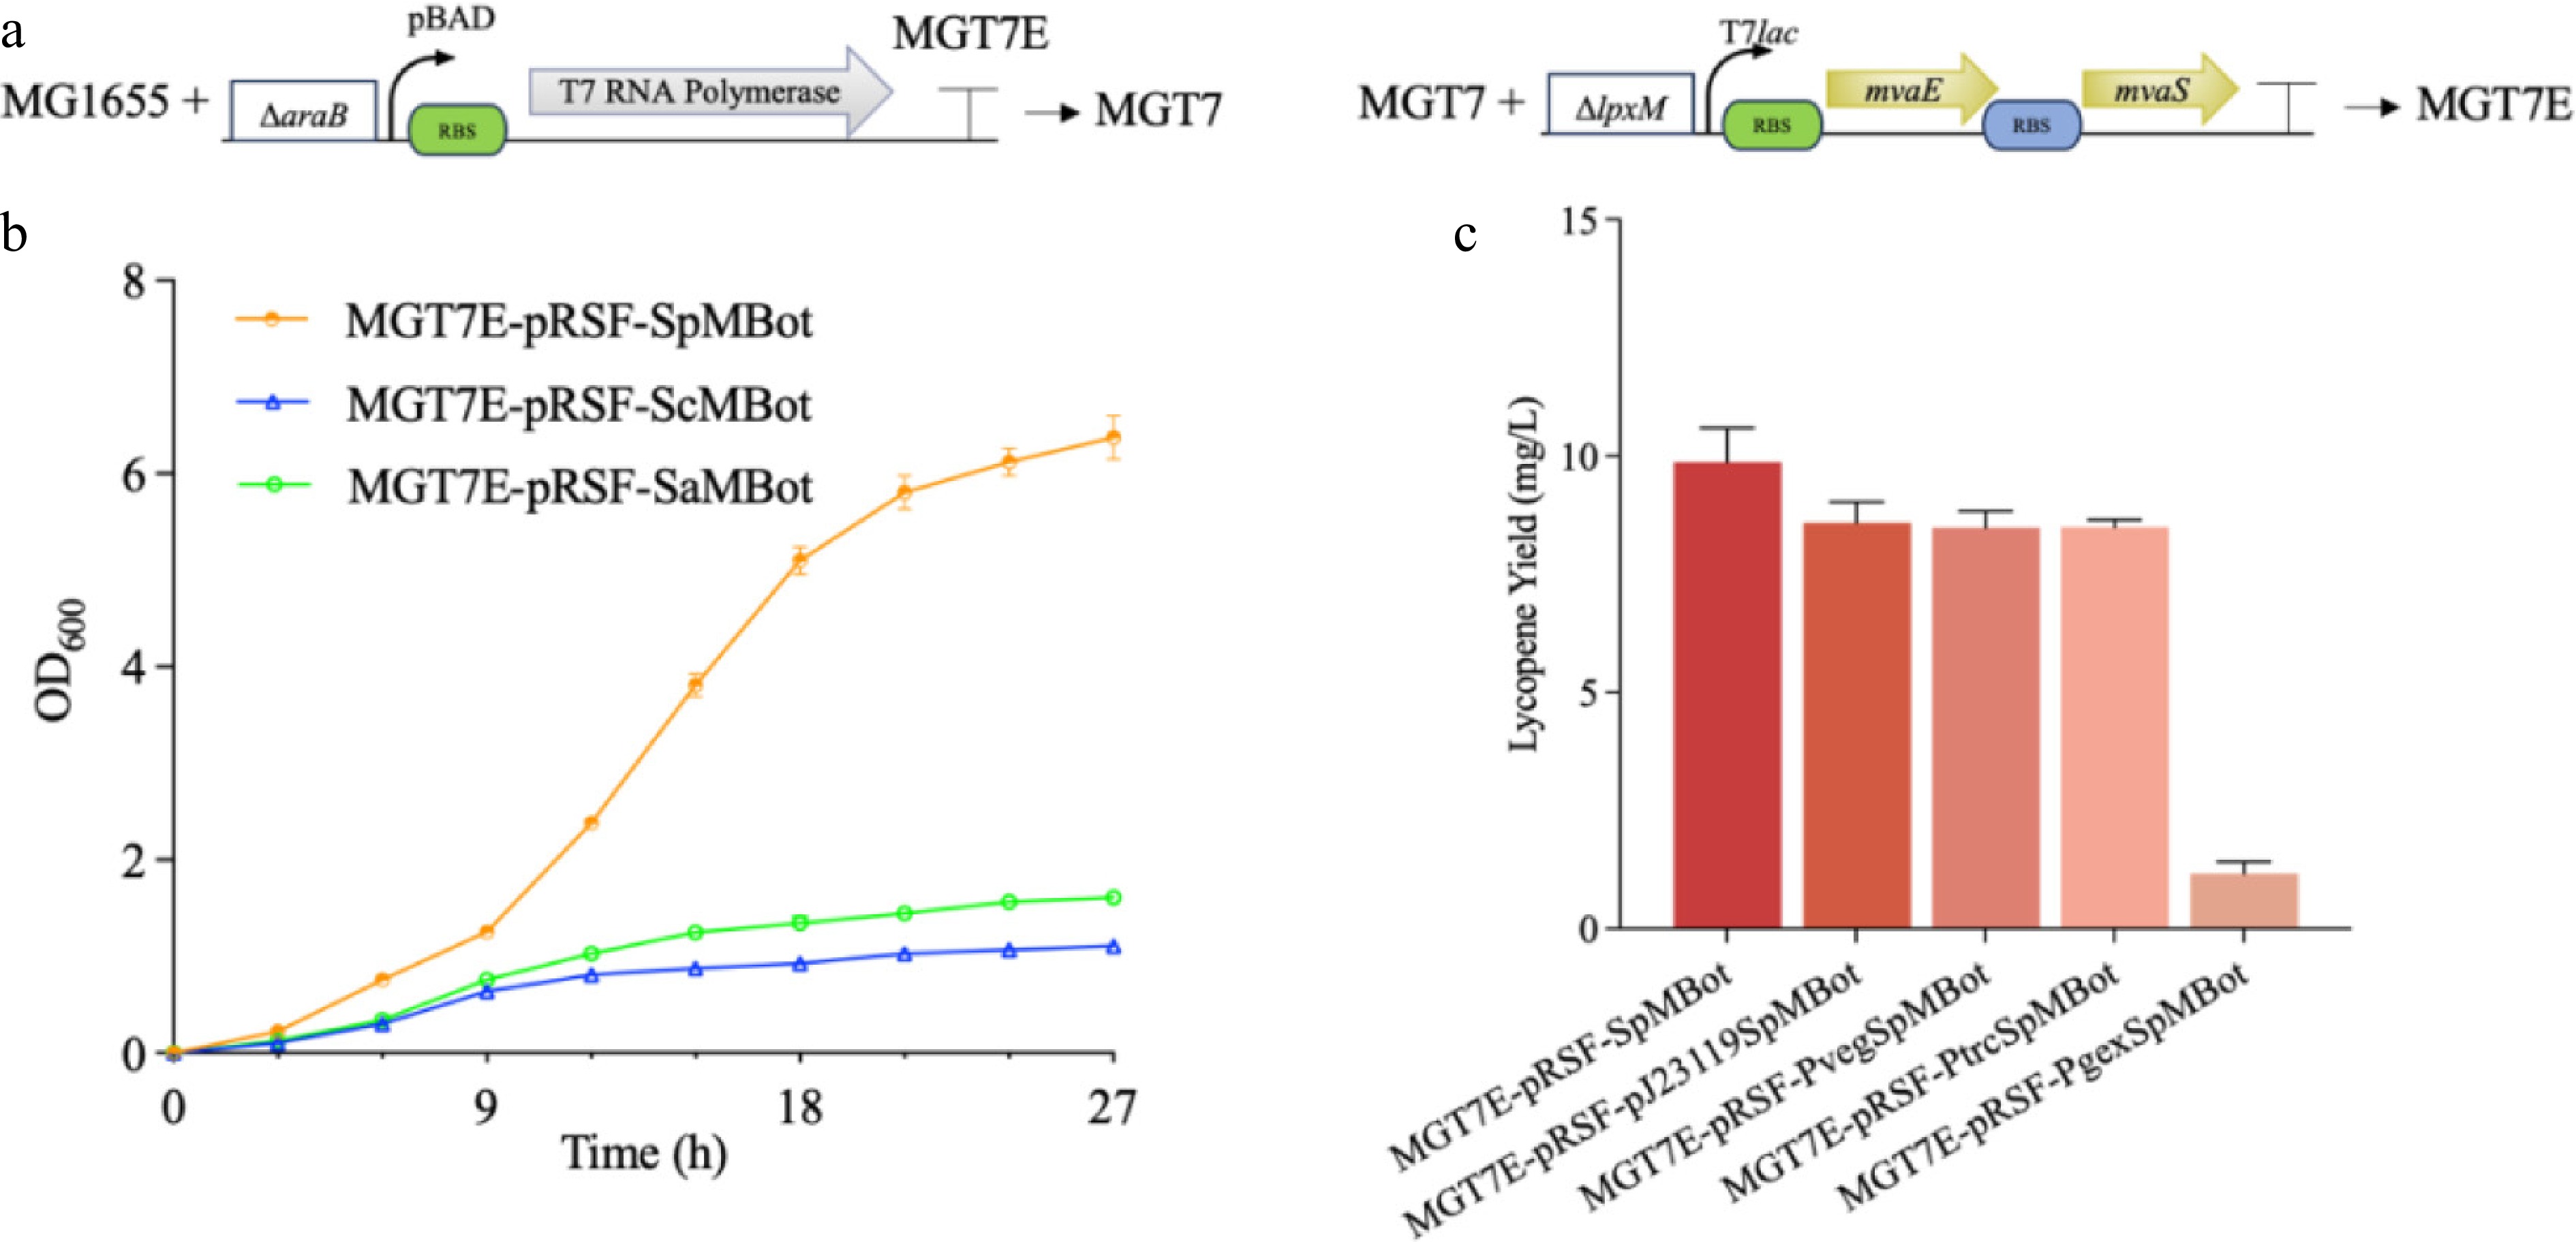
Figure 3.
Genomic integration of MUp and establishment of a plasmid-based MBot overexpression system. (a) Schematic depiction of the genomic integration sites and genetic circuits in the MGT7 and MGT7E strains. Green and blue rectangles indicate distinct RBS regions; ΔaraB denotes replacement of the chromosomal araB gene with T7 RNA polymerase; ΔlpxM indicates substitution of the lpxM gene with the MUp module. T7lac represents the T7-lac promoter, and each arrow represents a single gene oriented 5′-3′. (b) Effects of plasmid-based overexpression of MBot modules from different sources within pRSFduet on lycopene production. (c) Influence of promoter optimization for SpMBot in pRSFduet on lycopene synthesis.
-
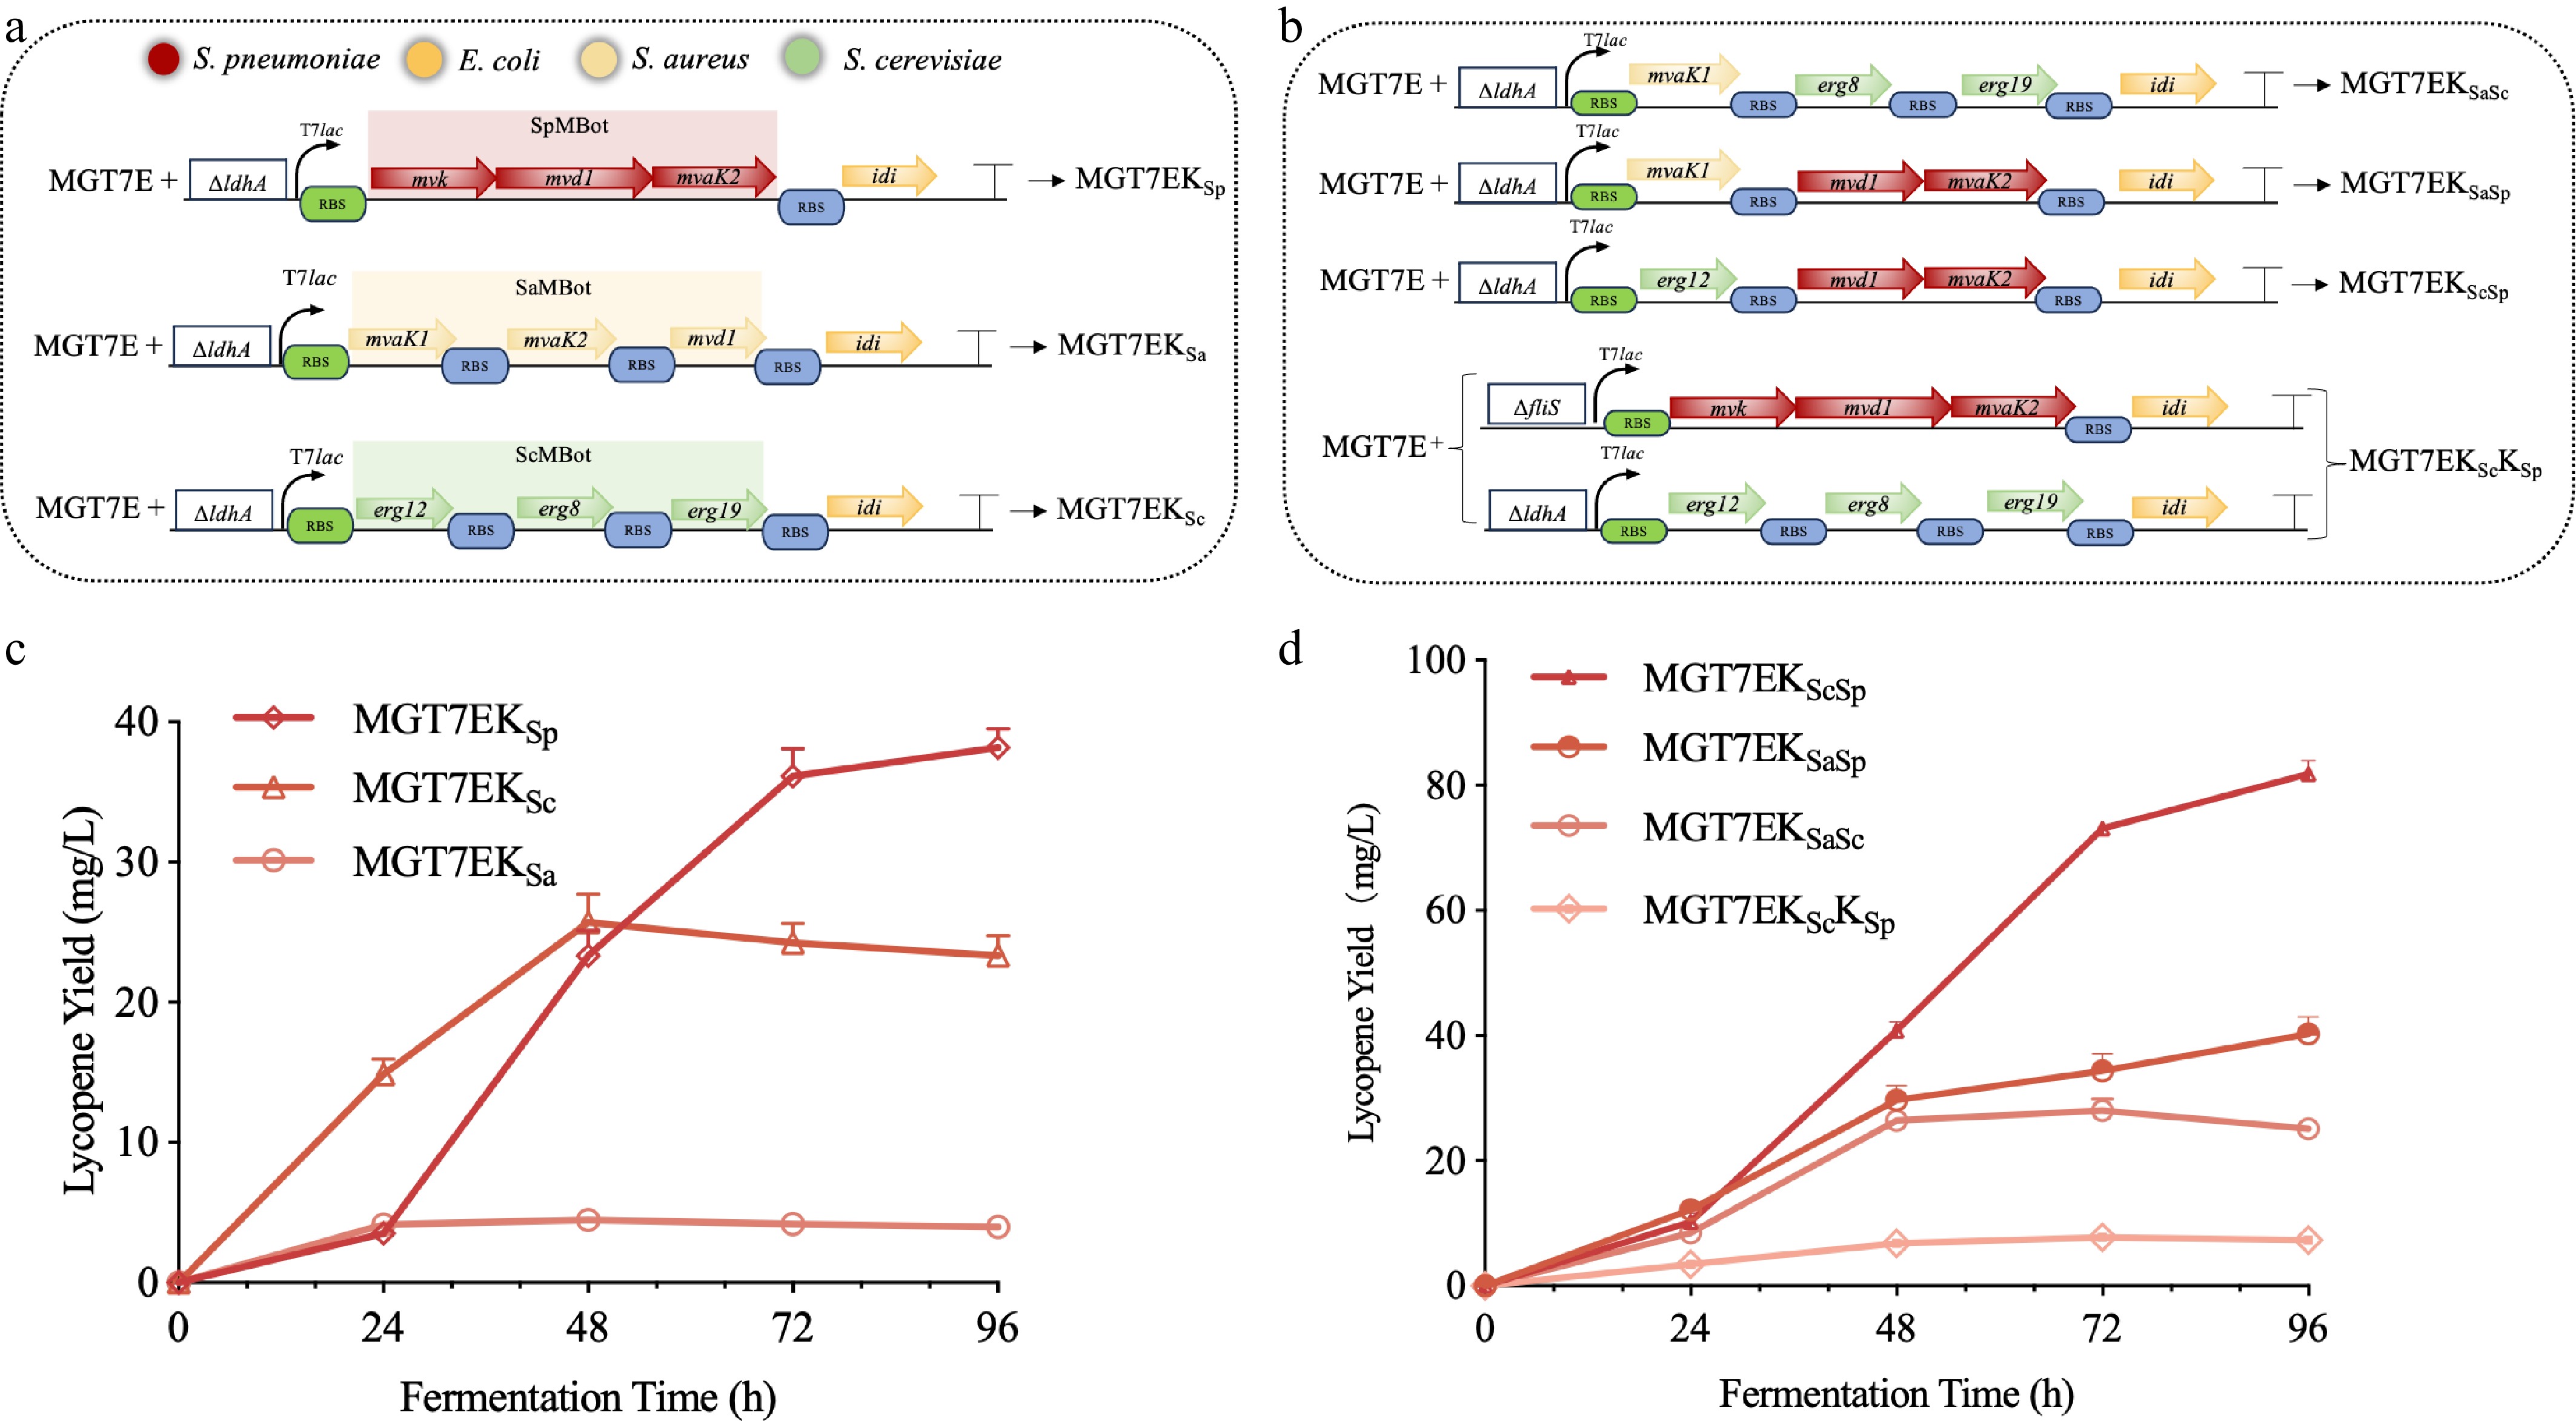
Figure 4.
Genomic integration and optimization of MBot modules from diverse origins. (a) Schematic representation of the genomic integration loci and genetic circuits for MBot modules from different sources. ΔldhA indicates replacement of the ldhA gene with the corresponding MBot cassette. Green and blue rectangles denote distinct RBS regions; T7lac represents the T7-lac promoter; each arrow represents a single gene oriented 5′-3′. Colors are keyed as follows: red—S. pneumoniae, orange—Escherichia coli, beige—S. aureus, green—S. cerevisiae. (b) Lycopene production profiles following genomic integration of MBot modules from the indicated sources. (c) Schematic overview of the distinct MBot optimization strategies. Square brackets denote simultaneous integration of two pathways into the fliS and ldhA loci of the MGT7E genome. (d) Lycopene-producing capacities of strains constructed via the indicated MBot optimization strategies.
-
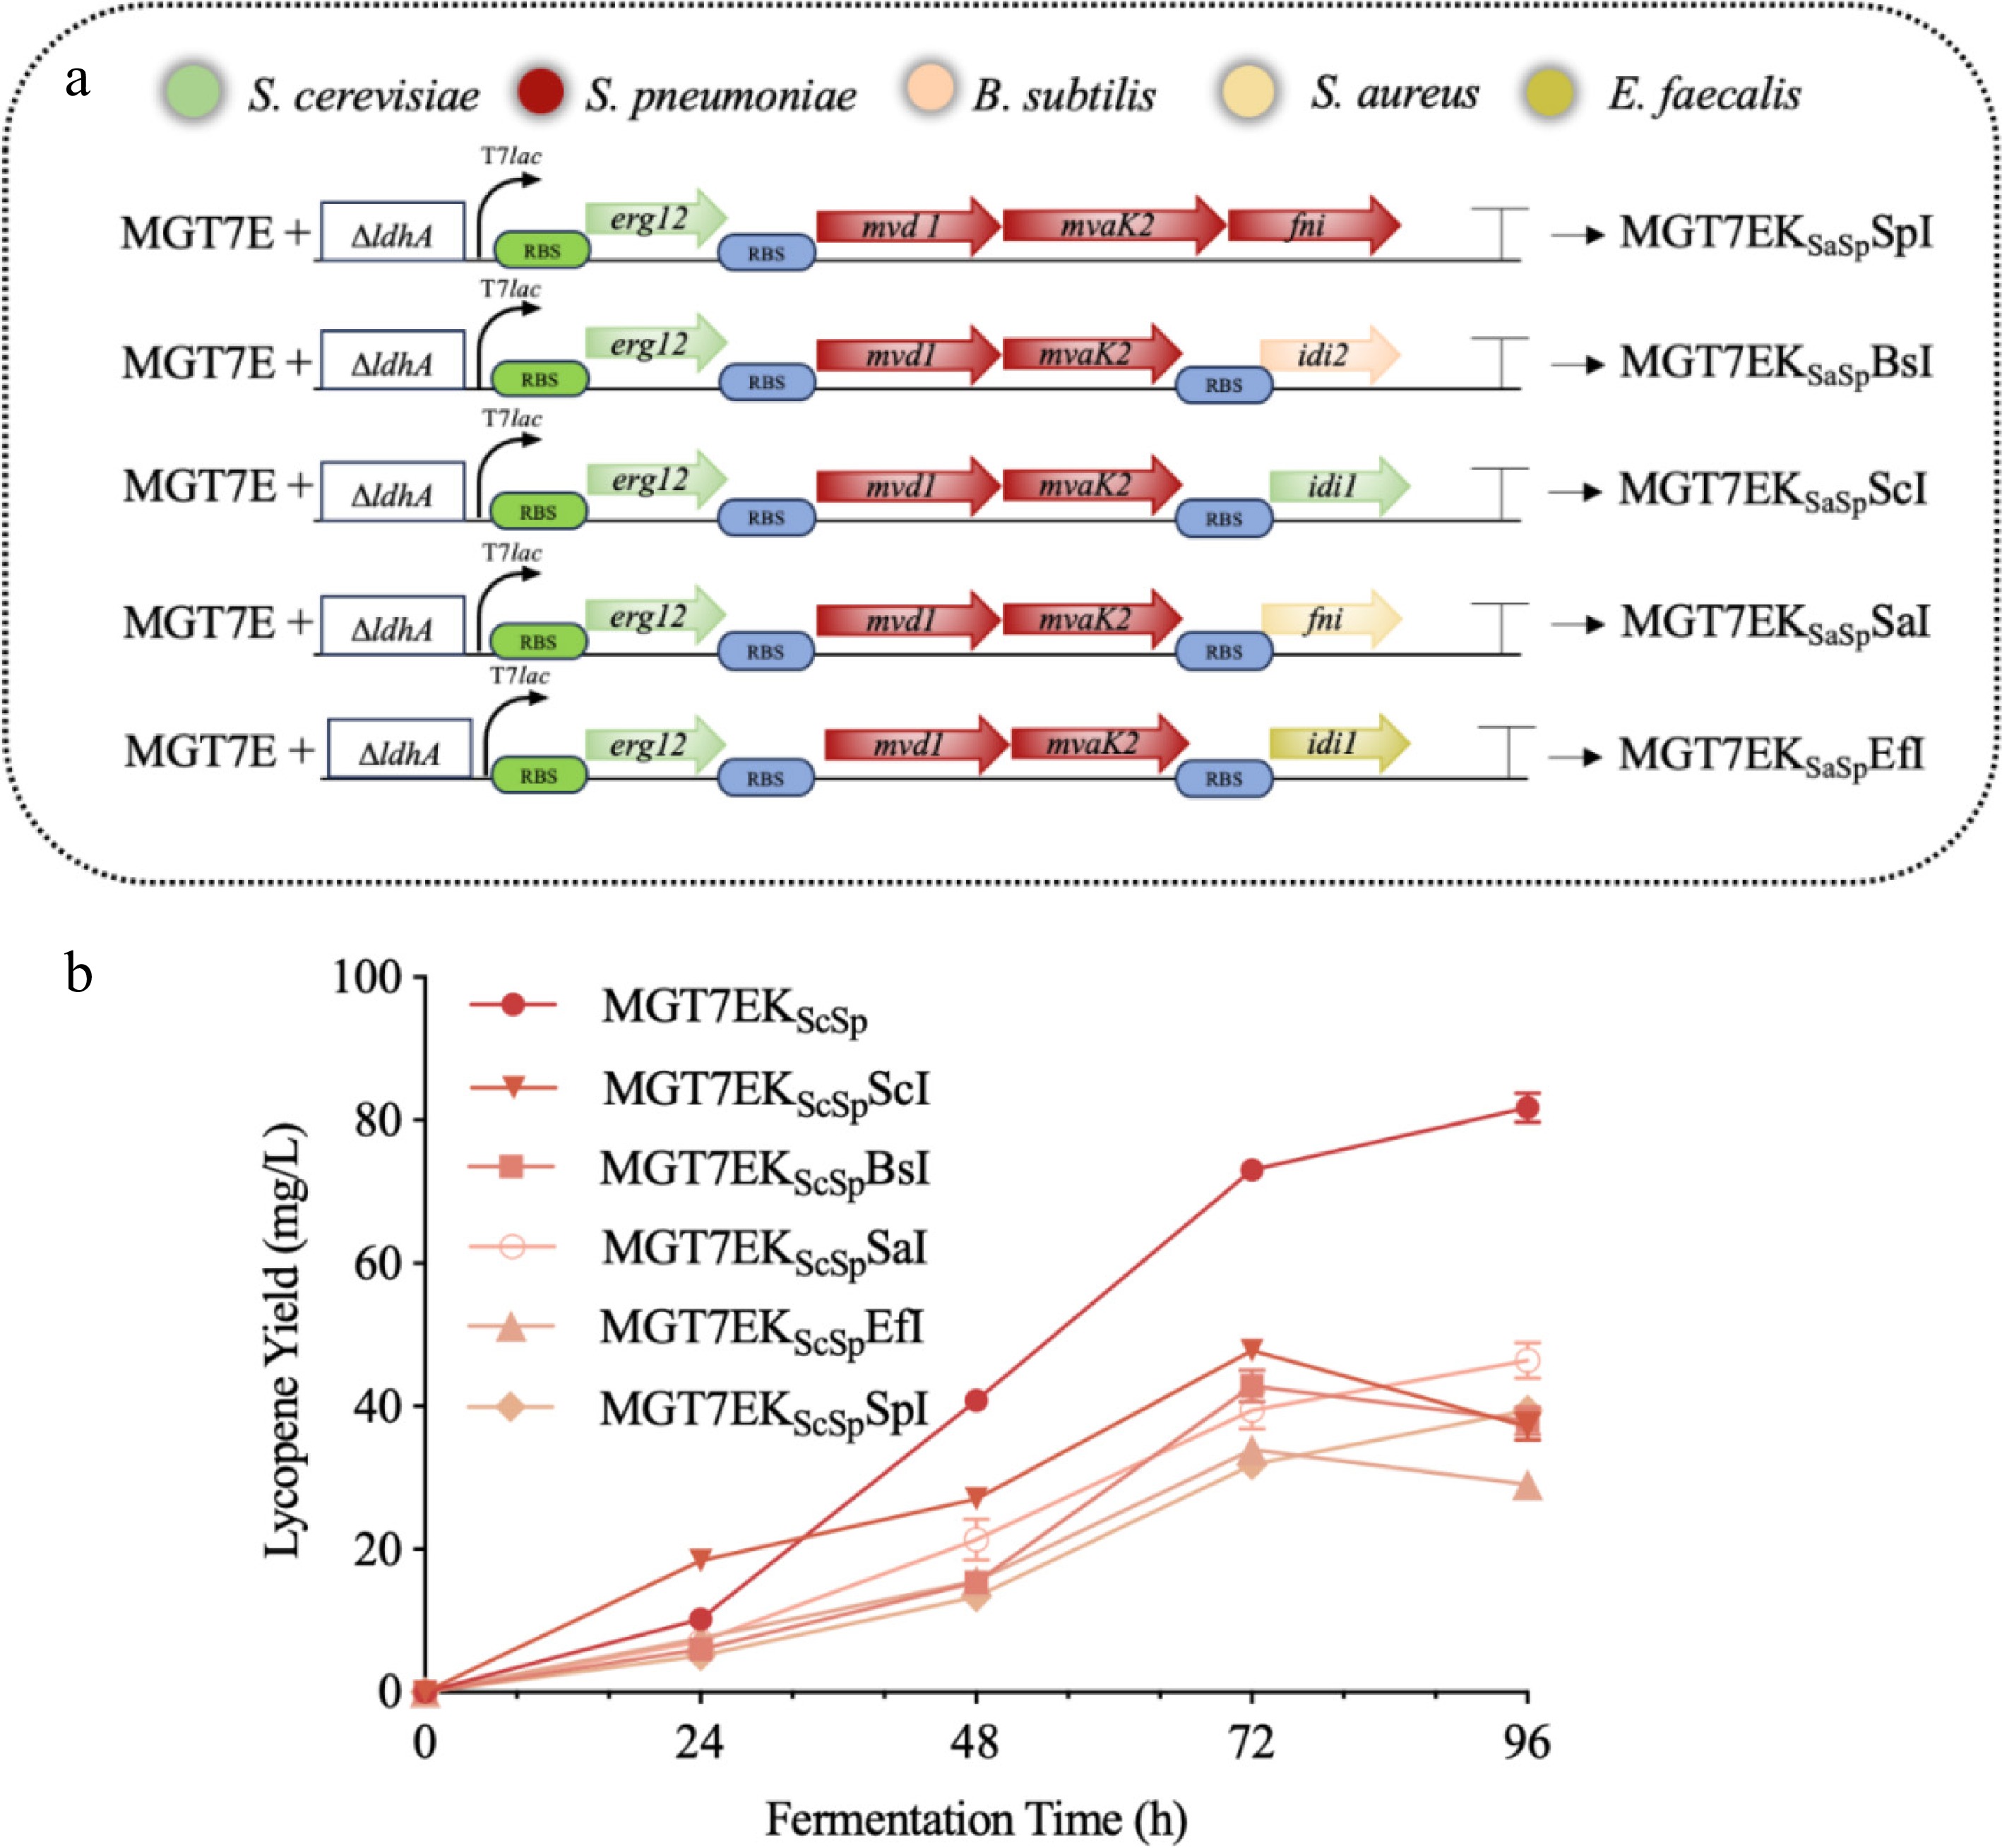
Figure 5.
Screening of idi orthologs from diverse sources. (a) Schematic diagram of the optimization strategies employing idi genes from multiple origins. ΔldhA denotes replacement of the ldhA gene with the corresponding MBot cassette. Green and blue rectangles indicate distinct RBS regions; T7lac represents the T7-lac promoter; each arrow represents a single gene oriented 5′-3′. Colors correspond to the following sources: green—S. cerevisiae, red—S. pneumoniae, peach—B. subtilis, beige—S. aureus, chartreuse—Enterococcus faecalis. (b) Lycopene production profiles for strains harboring idi variants from the indicated sources.
-
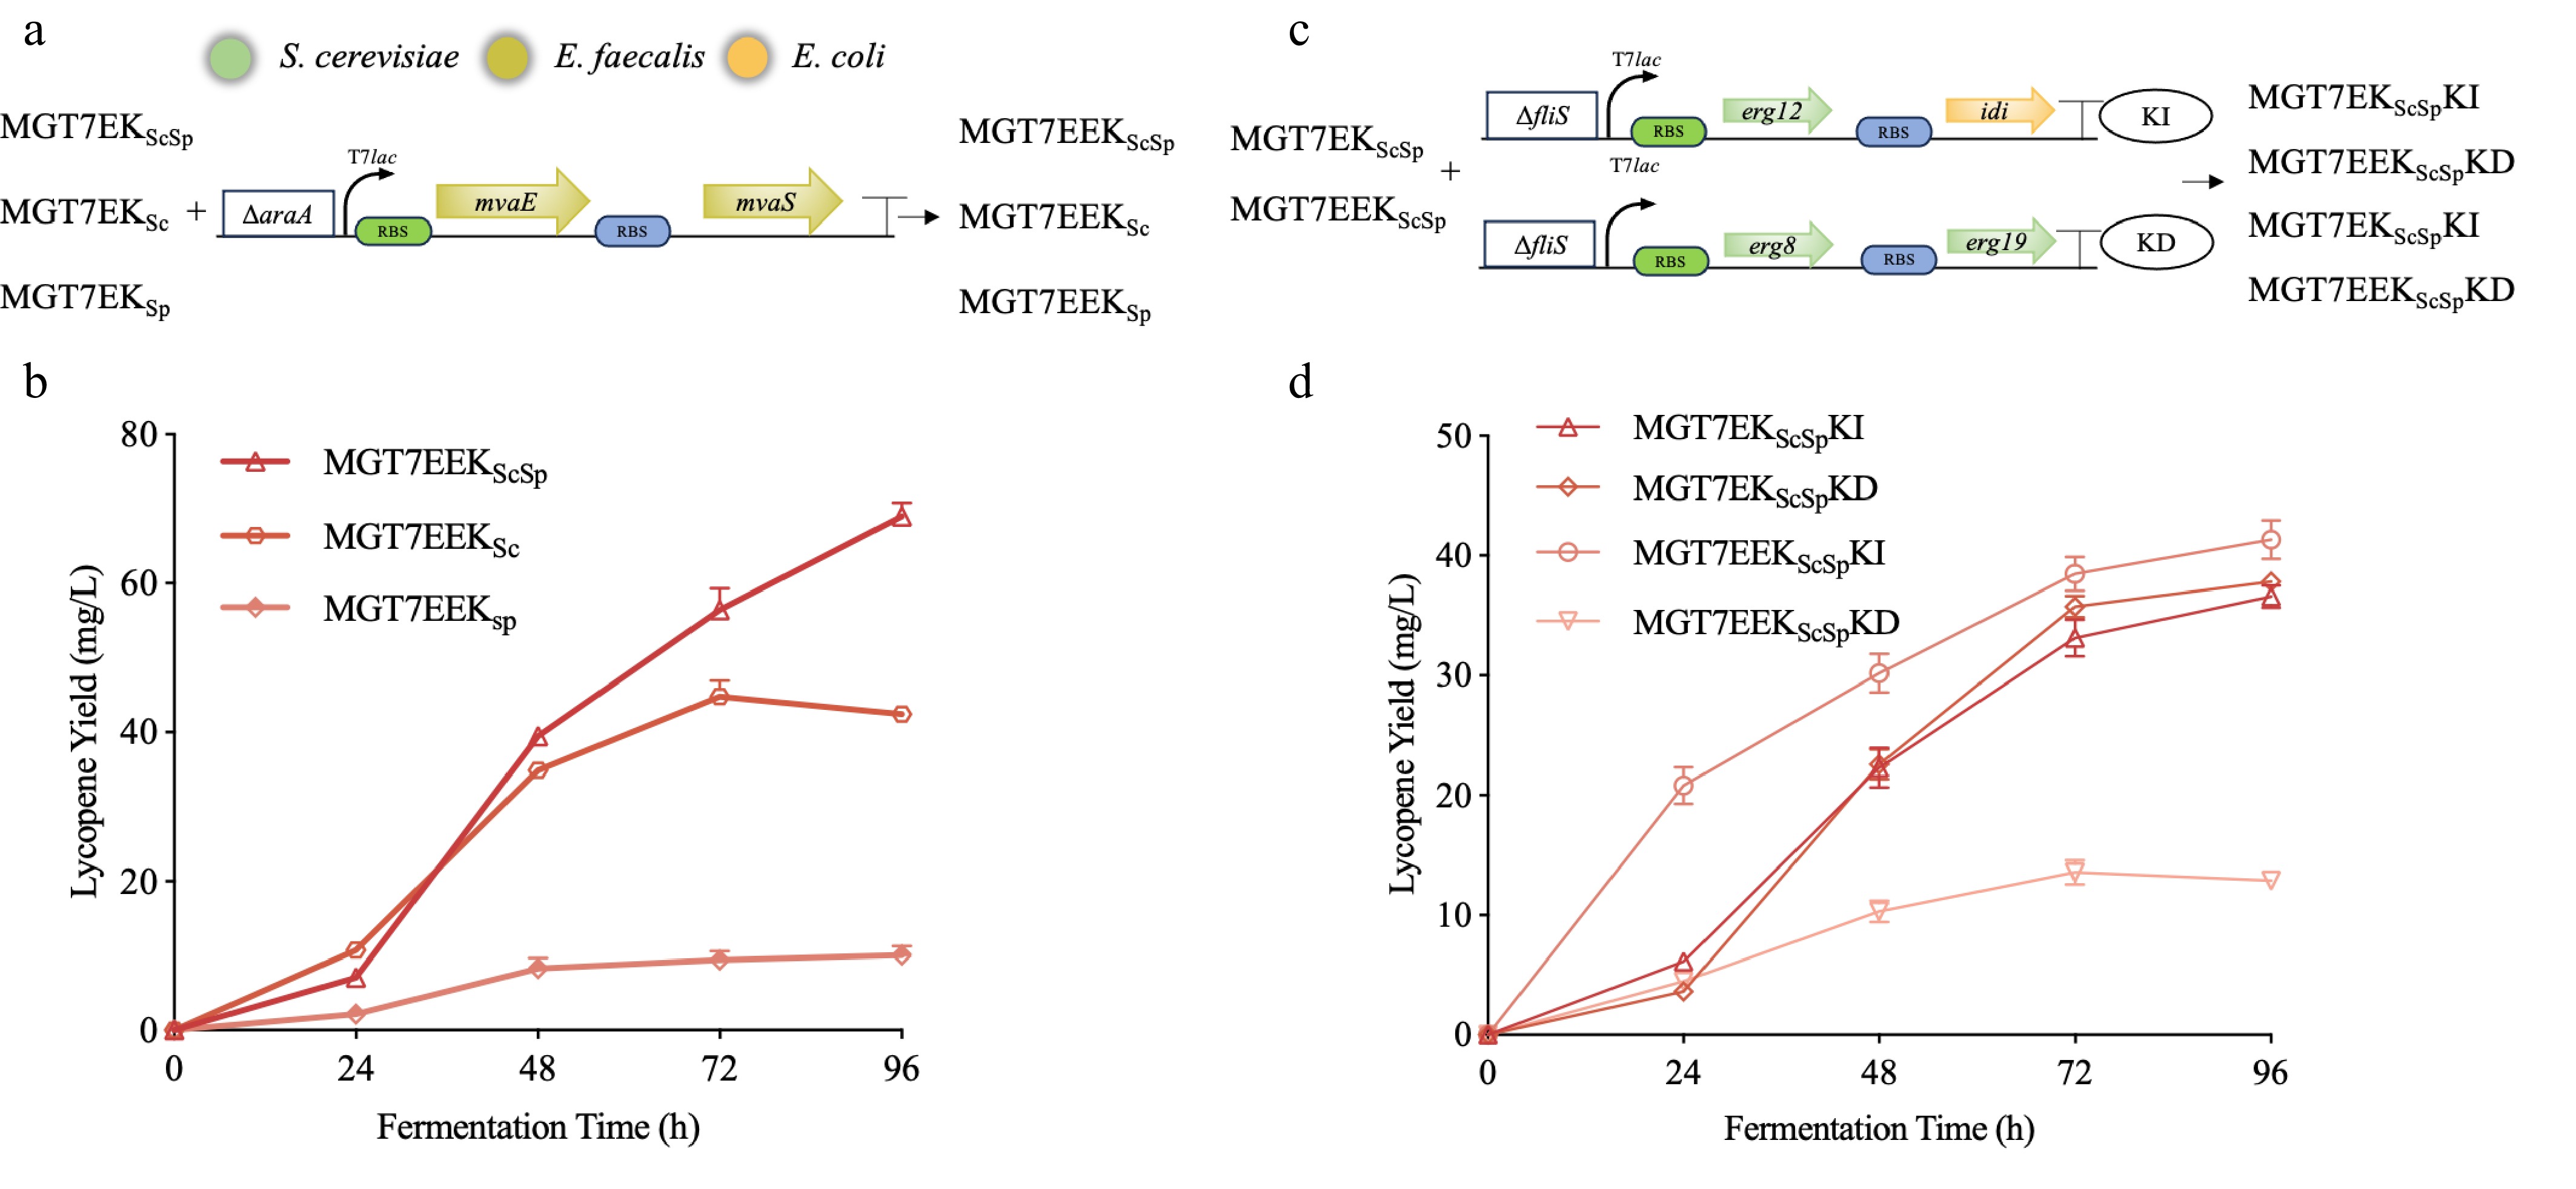
Figure 6.
Enhancement of MUp and synergistic optimization of MBot. (a) Schematic of MUp enhancement in the MGT7EKScSp, MGT7EKSc, and MGT7EKSp. ΔaraA indicates replacement of the araA gene with the MUp module. Green and blue rectangles denote distinct RBS regions; T7lac represents the T7-lac promoter; each arrow represents a single gene oriented 5′-3′. Colors correspond to the following sources: green—S. cerevisiae, chartreuse—Enterococcus faecalis, orange—Escherichia coli. (b) Impact of MUp enhancement on lycopene production by different MBot modules. (c) Optimization strategies for MBot. KD and KI designate the corresponding modules in strain nomenclature; ΔfliS denotes replacement of the fliS gene with the indicated module. (d) Lycopene production profiles following MUp and MBot optimization.
-
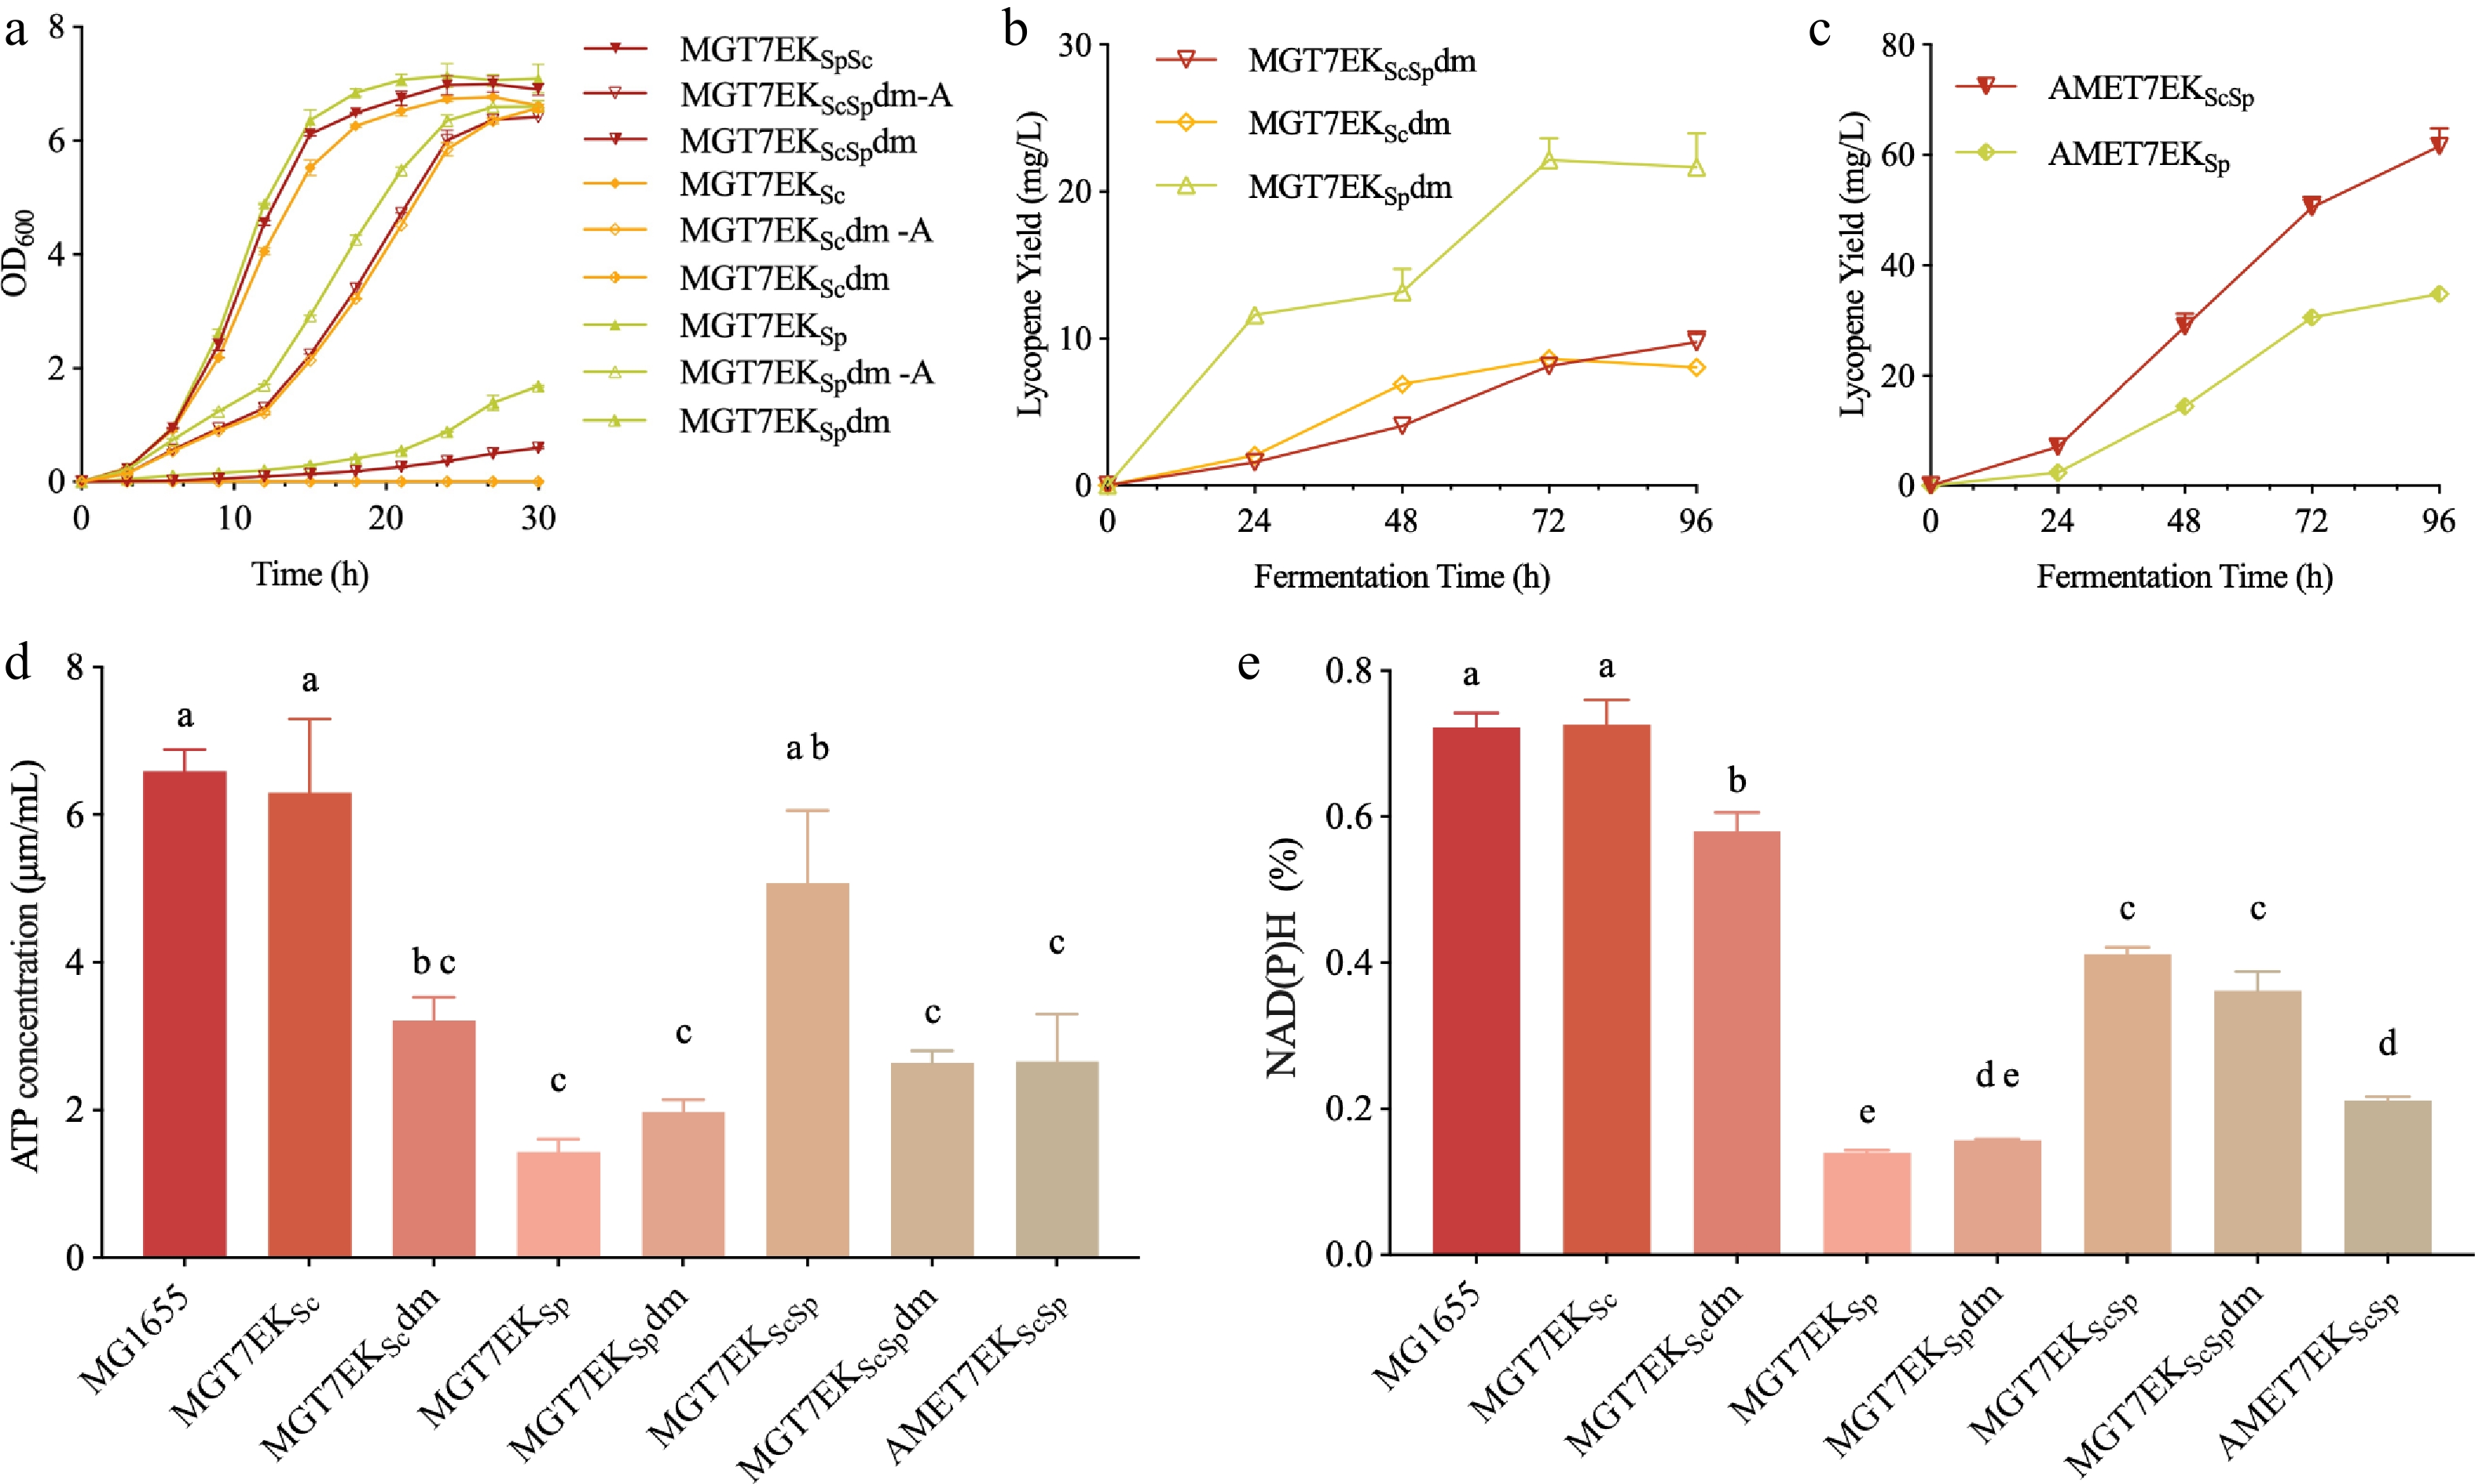
Figure 7.
Role of the MEP pathway in MVA-mediated lycopene synthesis. (a) Growth curves of MGT7EKScSp, MGT7EKSc, and MGT7EKSp after deletion of the dxr gene; '–A' indicates medium supplemented with 0.2% L-arabinose, and 'dm' denotes dxr deletion. (b) Impact of dxr deletion on lycopene production. (c) Effect of MEP-pathway overexpression on lycopene synthesis. (d) Intracellular ATP levels in dxr-deleted and MEP-overexpressing strains. (e) Intracellular reducing-power levels in dxr-deleted and MEP-overexpressing strains.
-
Name Description Origin DH5α F− φ80 lac ZΔM15 Δ(lacZYA-argF) U169 endA1 recA1 hsdR17(rk−, mk+) supE44 λ− thi− gyrA96 relA1 phoA Lab stock MG1655 Wild-type Lab stock MG1655-pTrcBIE MG1655 harbouring pTrc-crtBIE This study MG1655-pGexBIE MG1655 harbouring pGex-crtBIE This study AME MG1655 ΔAraA:: Ptrc-dxs-idi-ispDF containing pGex-crtBIE This study PME MG1655 containing pcrEG-TrcMEP, pGex-crtBIE This study PAME AME containing pcrEG-TrcMEP This study MGT7 MG1655 ΔAraB::T7 RNAP This study MGT7E MGT7 ΔlpxM::T7 lac MvaES This study MGT7EE MGT7 ΔaraA::T7 lac MvaES This study MGT7E-pRSF-SaMBot MGT7E harbouring pRSF-SaMBot This study MGT7E-pRSF-ScMBot MGT7E harbouring pRSF-ScMBot This study MGT7E-pRSF-SpMBot MGT7E harbouring pRSF-SpMBot This study MGT7E-pRSF-PTrcSpMBot MGT7E harbouring pRSF-PtrcSpMBot This study MGT7E-pRSF-PGexSpMBot MGT7E harbouring pRSF-PgexSpMBot This study MGT7E-pRSF-PVegSpMBot MGT7E harbouring pRSF-PvegSpMBot This study MGT7E-pRSF-pJ23119SpMBot MGT7E harbouring pRSF-PJ23119SpMBot This study MGT7EKSa MGT7E ΔldhA::T7 lac SaMBot This study MGT7EKSp MGT7E ΔldhA::T7 lac SpMBot This study MGT7EKSc MGT7E ΔldhA::T7 lac ScMBot This study MGT7EKSaSp MGT7E ΔldhA::T7 lac SaSpMBot (mvaK1 from S.aureus and mvaK2/mvaD from S. pneumoniae) This study MGT7EKScSp MGT7E ΔldhA::T7 lac ScSpMBot (erg12 from S.cerevisiae and mvaK2/mvaD from S. pneumoniae) This study MGT7EKSaSc MGT7E ΔldhA::T7 lac SaScMBot (mvaK1 from S.aureus and mvaK2/mvaD from S.cerevisiae) This study MGT7EEKSp MGT7EE ΔldhA::T7 lac SpMBot This study MGT7EEKSc MGT7EE ΔldhA::T7 lac ScMBot This study MGT7EEKScSp MGT7EE ΔldhA::T7 lac ScSpMBot (erg12 from S.cerevisiae and mvaK2/mvaD from S. pneumoniae) This study MGT7EKSc dM MGT7EKSc Δdxr This study MGT7EKSp dM MGT7EKSp Δdxr This study MGT7EKScSpdM MGT7EKScSp Δdxr This study AMET7EKScSp MGT7EKScSp ΔAraA::Ptrc-dxs-idi-ispDF This study Table 1.
Strains constructed in this study.
Figures
(7)
Tables
(1)