-
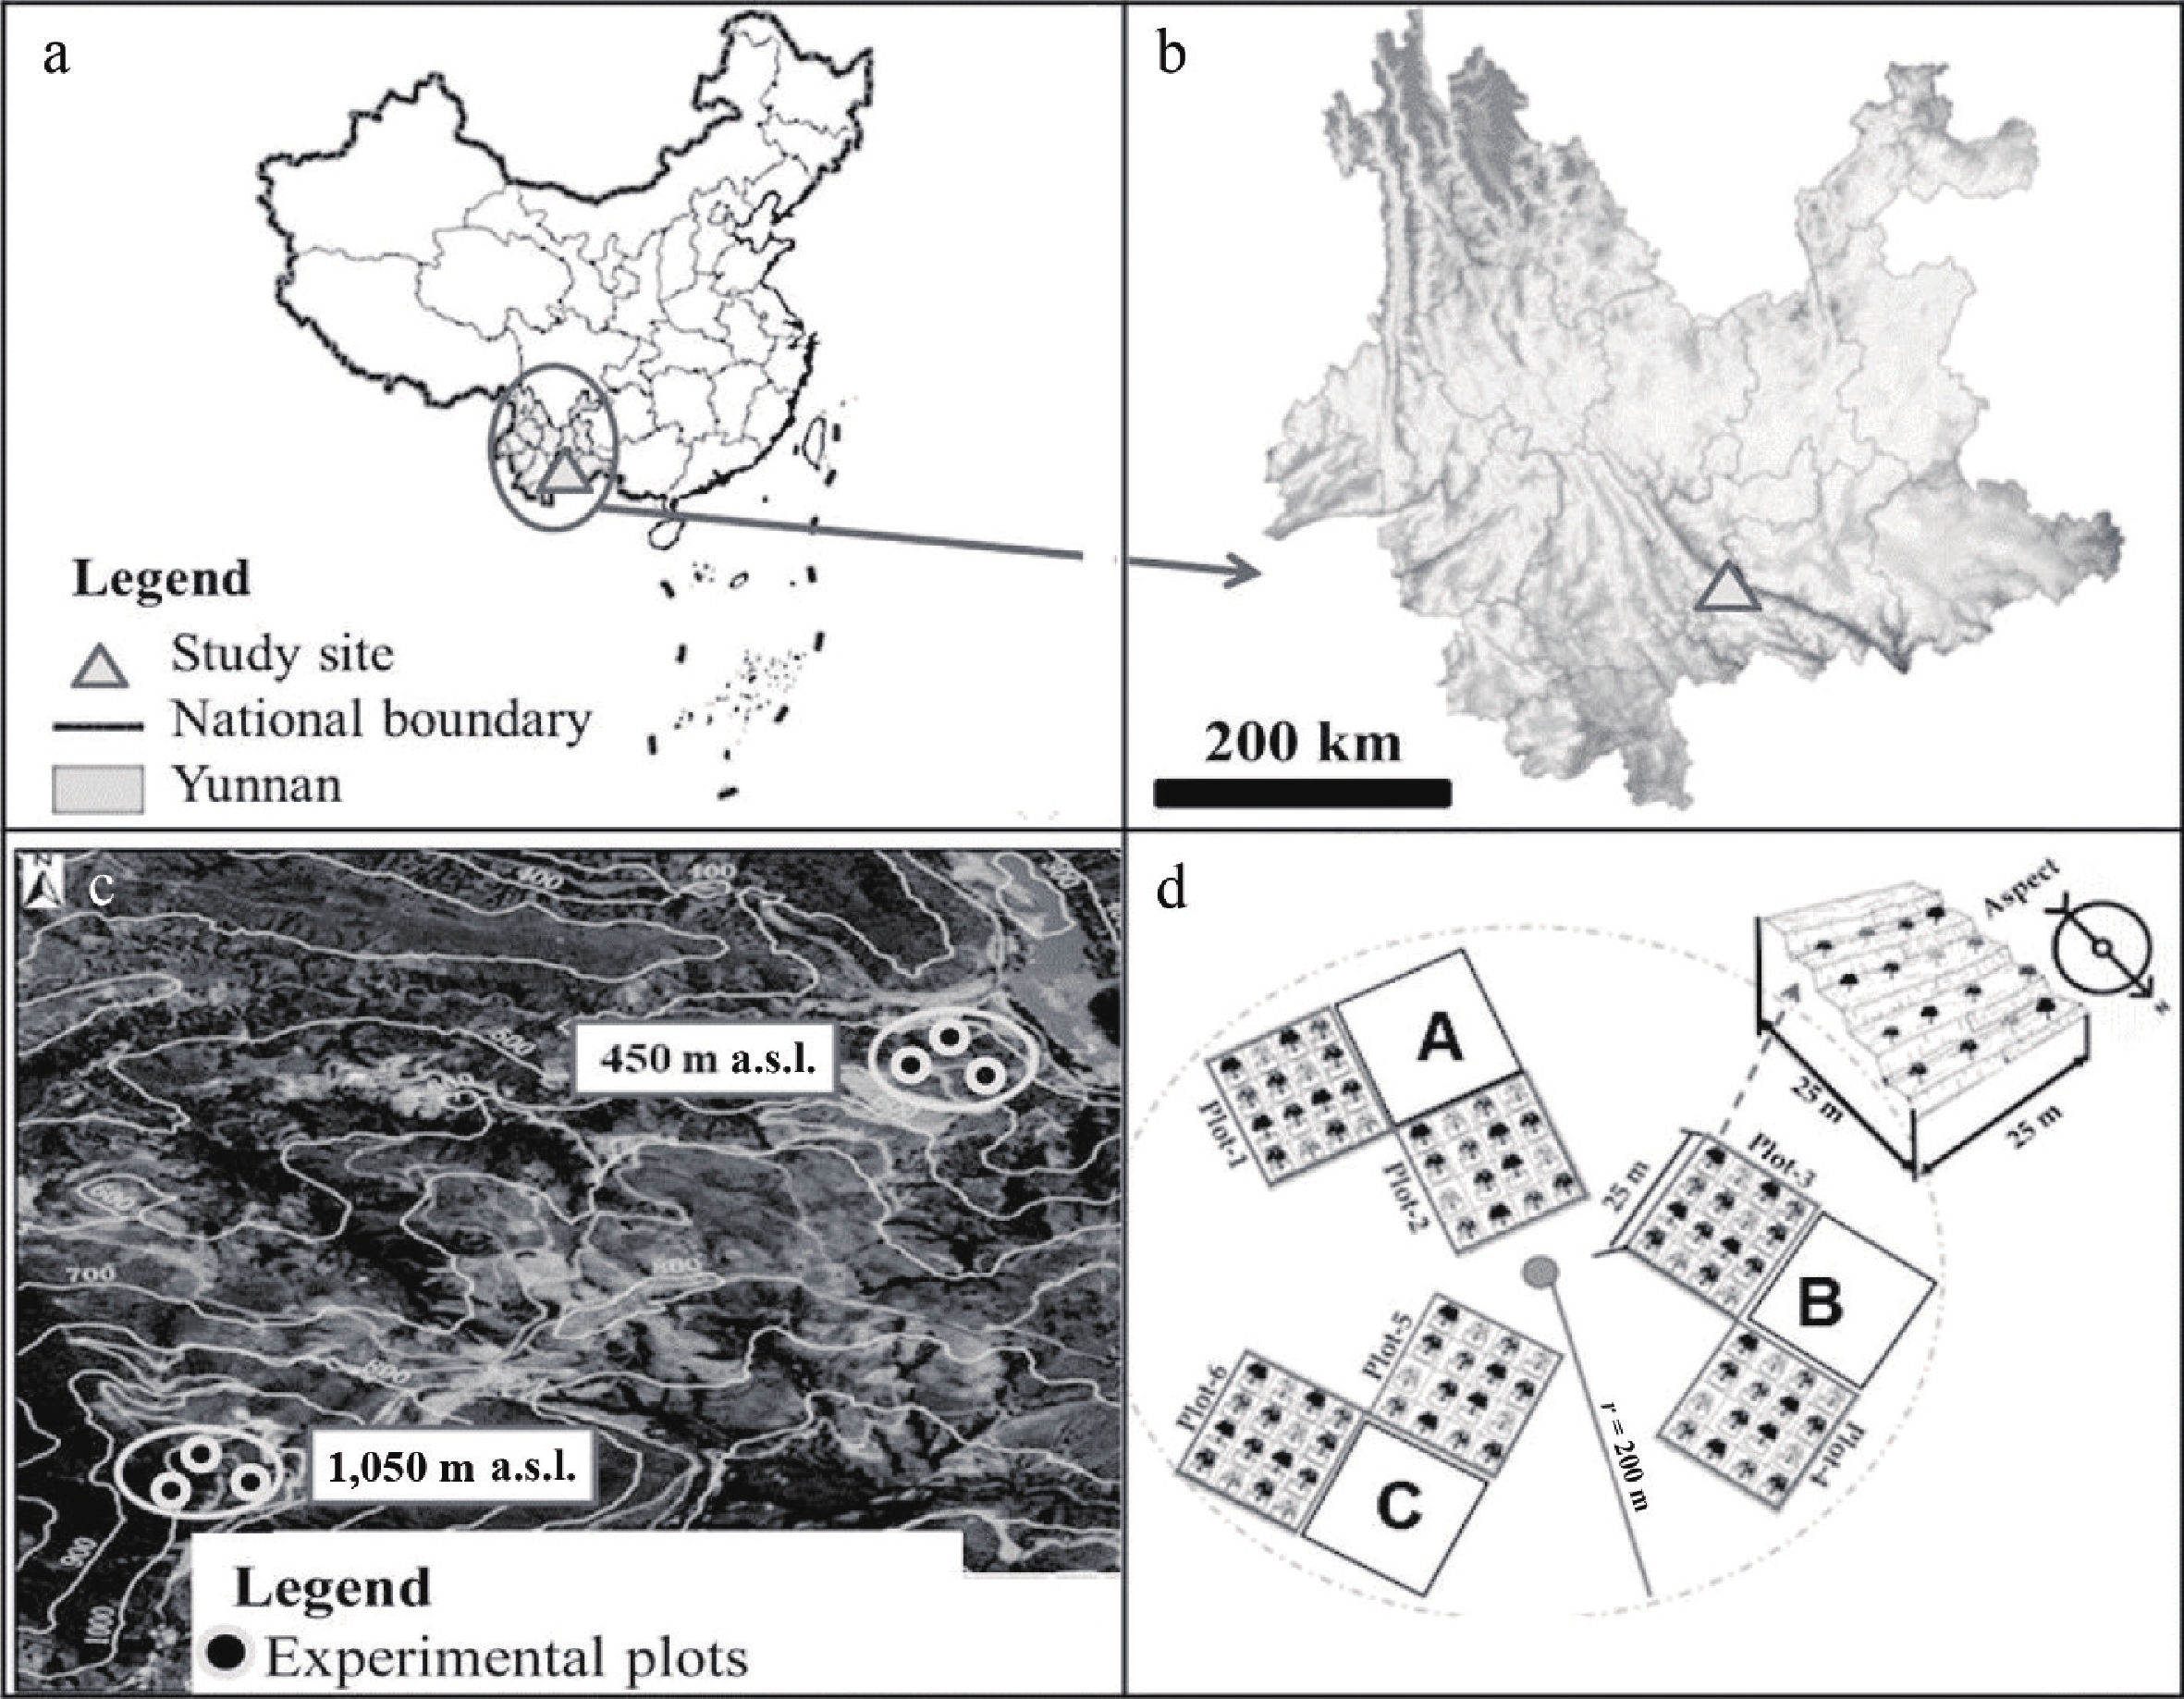
Figure 1.
(a) Experimental plots located at altitude 450 and 1,050 m a.s.l. (a), (b) Map of the study location at Honghe County, Yunnan Province, China (c) Experimental plots at 450 or 1,050 m a.s.l. (d) Illustration of experimental plots layout located within a radius of (ca. 100 m), and facing north. (GIS clip from global map).
-
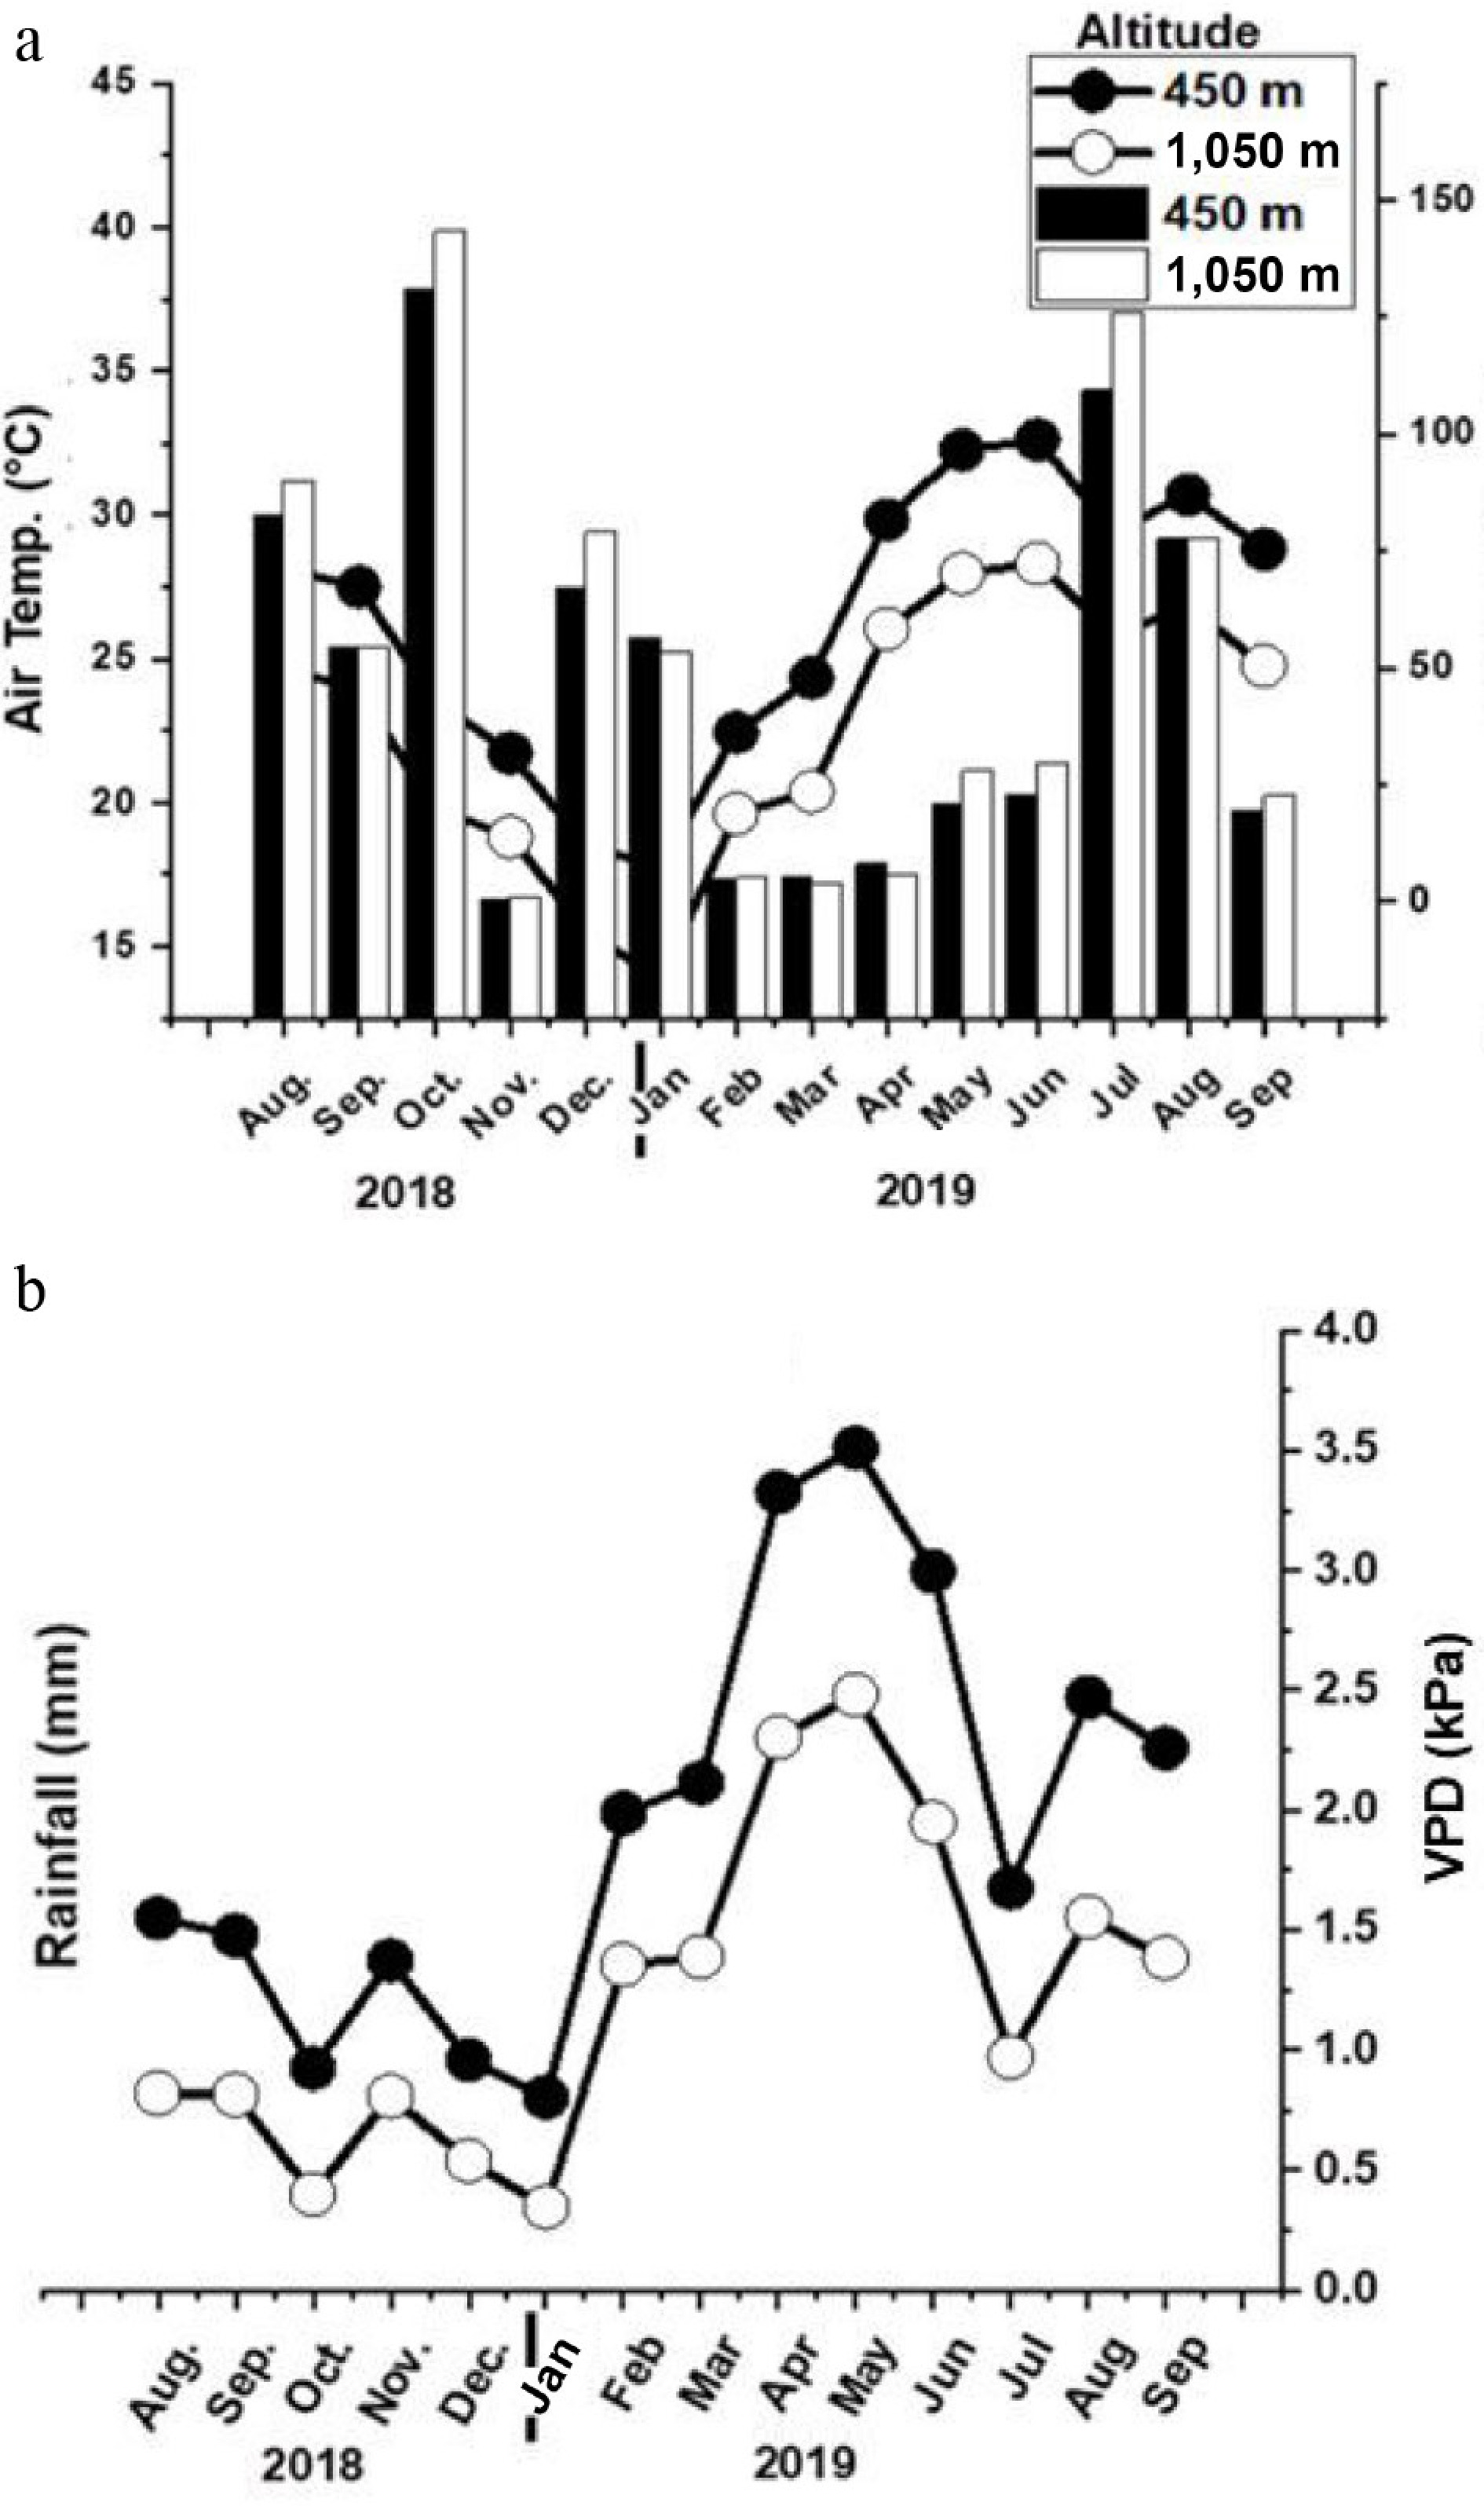
Figure 2.
(a) Monthly mean air temperature (°C), and rainfall (mm). (b) Vapor pressure deficit (VPD kPa) of the study site at 450 and 1,050 m a.s.l.
-
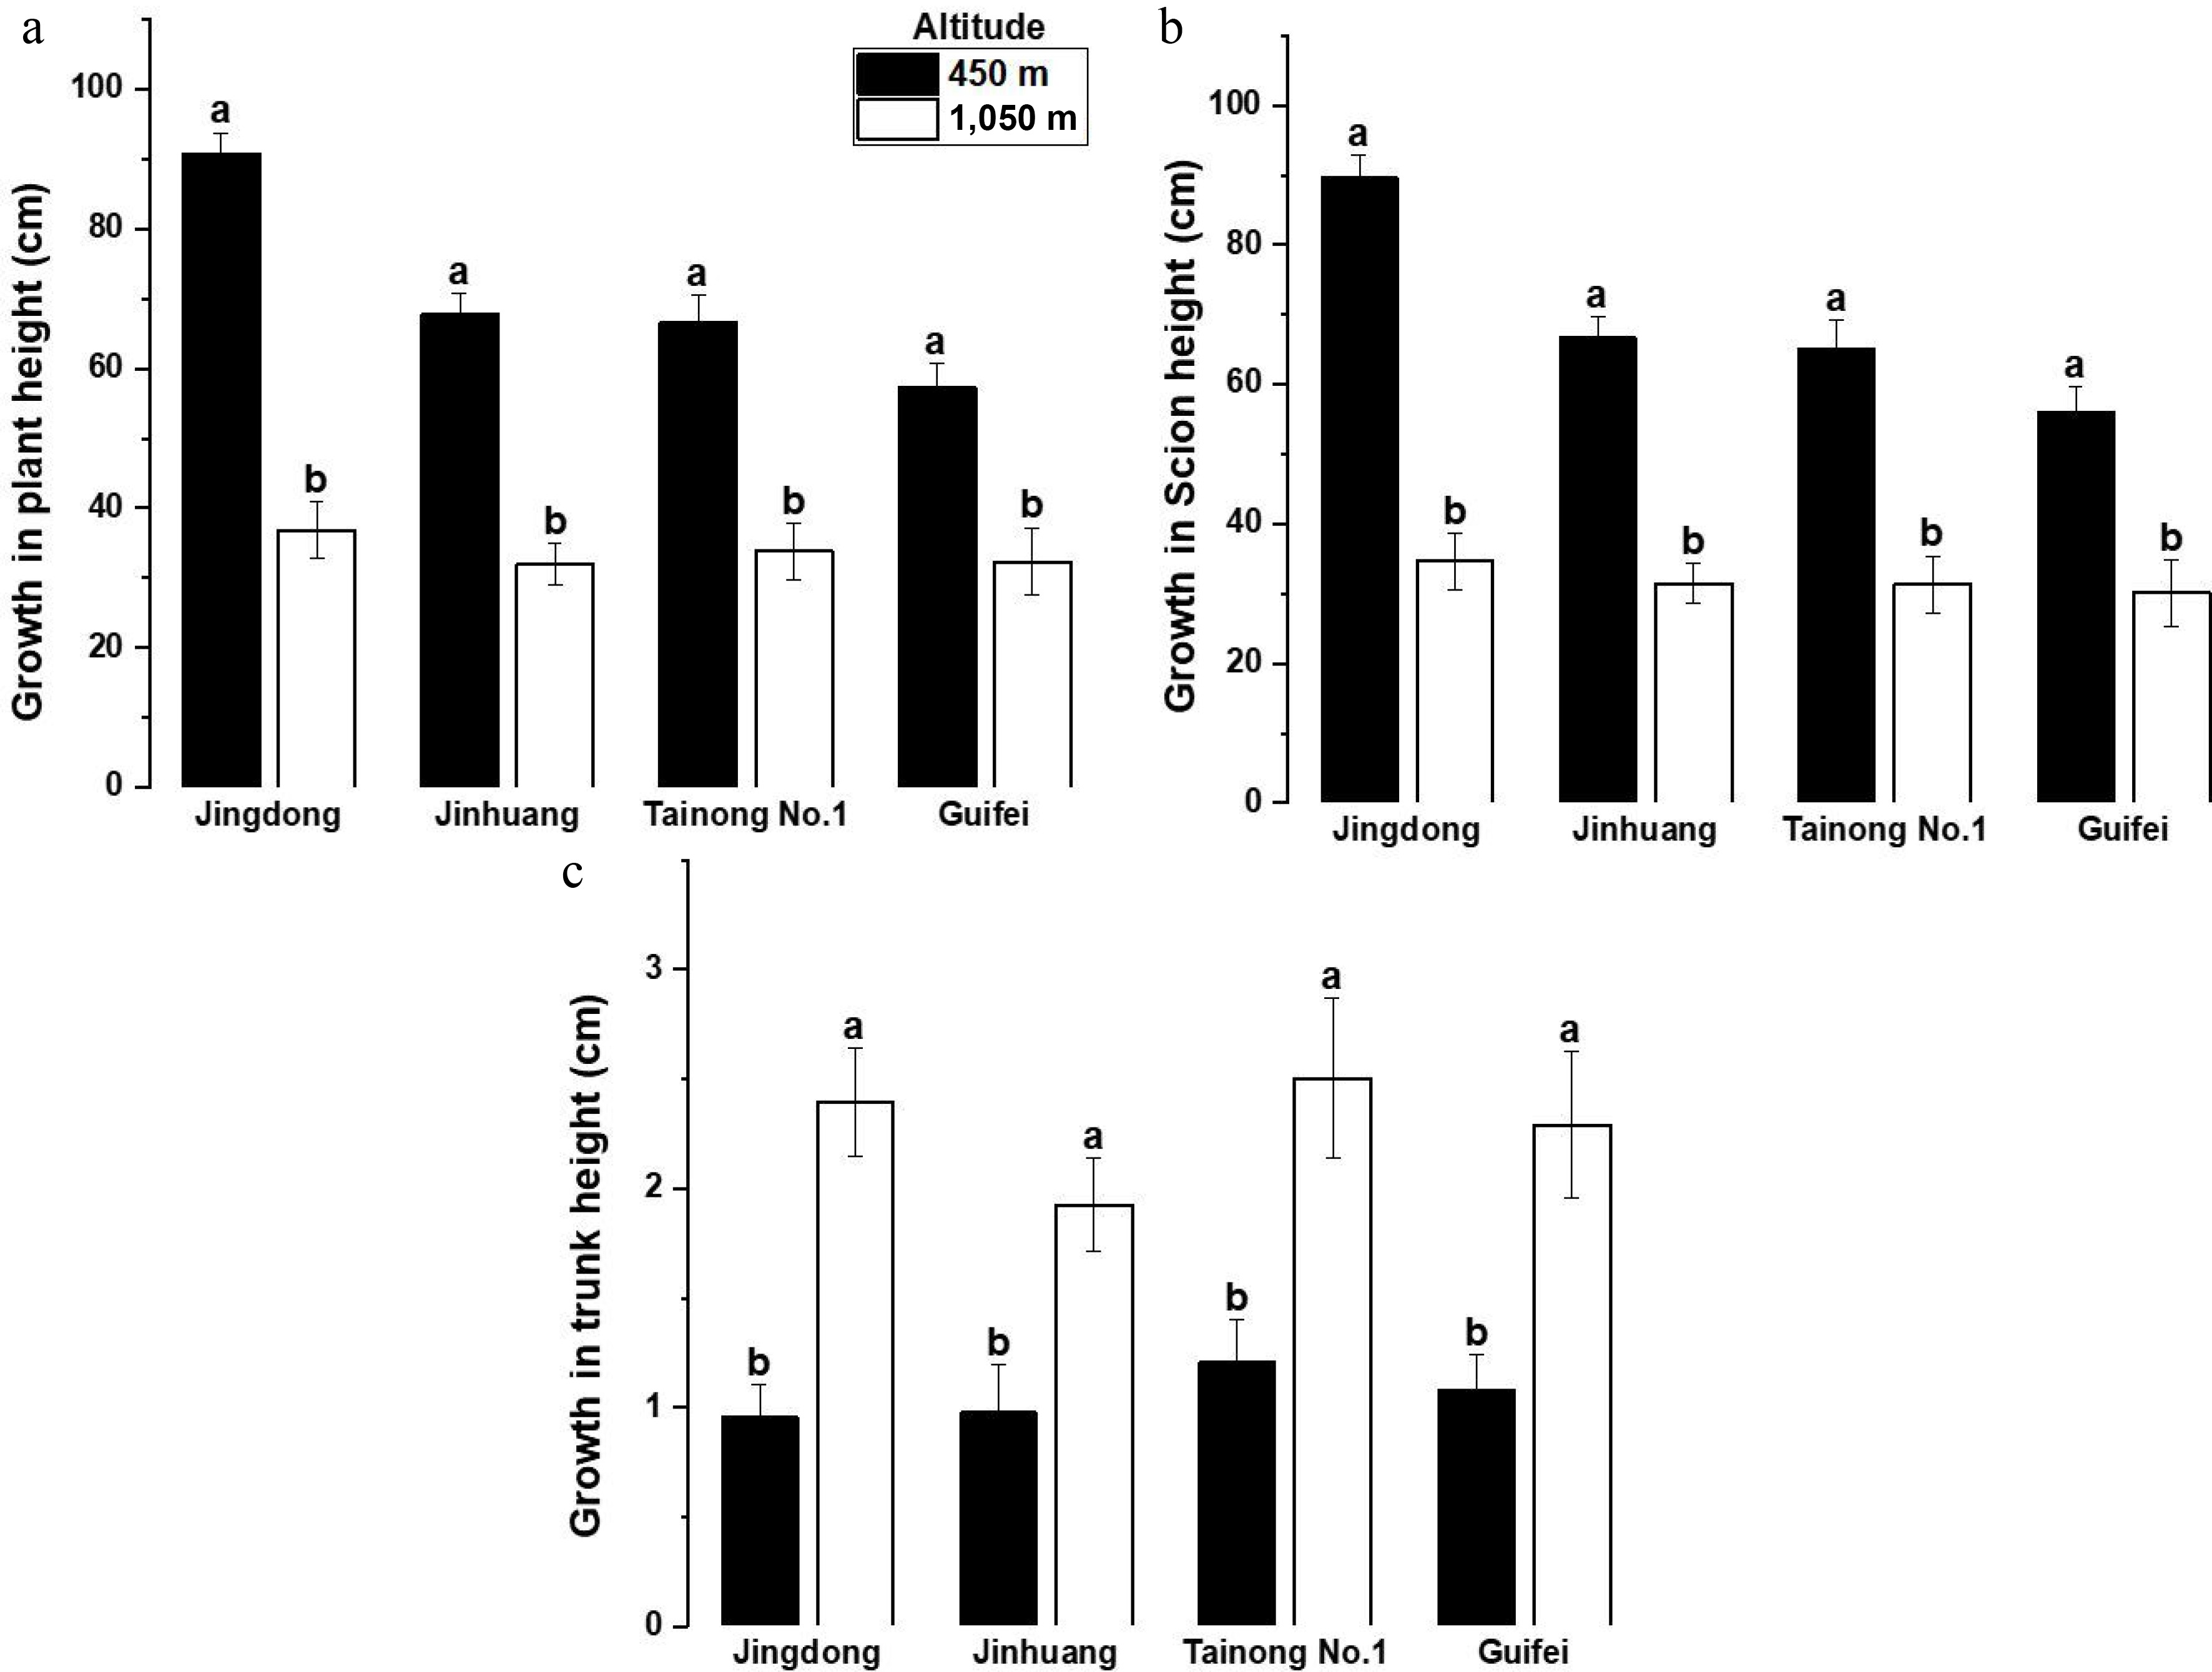
Figure 3.
Mean ± SE annual growth in (cm). (a) Plant height, (b) scion heights, (c) trunk height of four mango cultivars grown at altitudes of 450 and 1,050 m a.s.l. Different letters indicate differences between means are statistically significant p < 0.01.
-
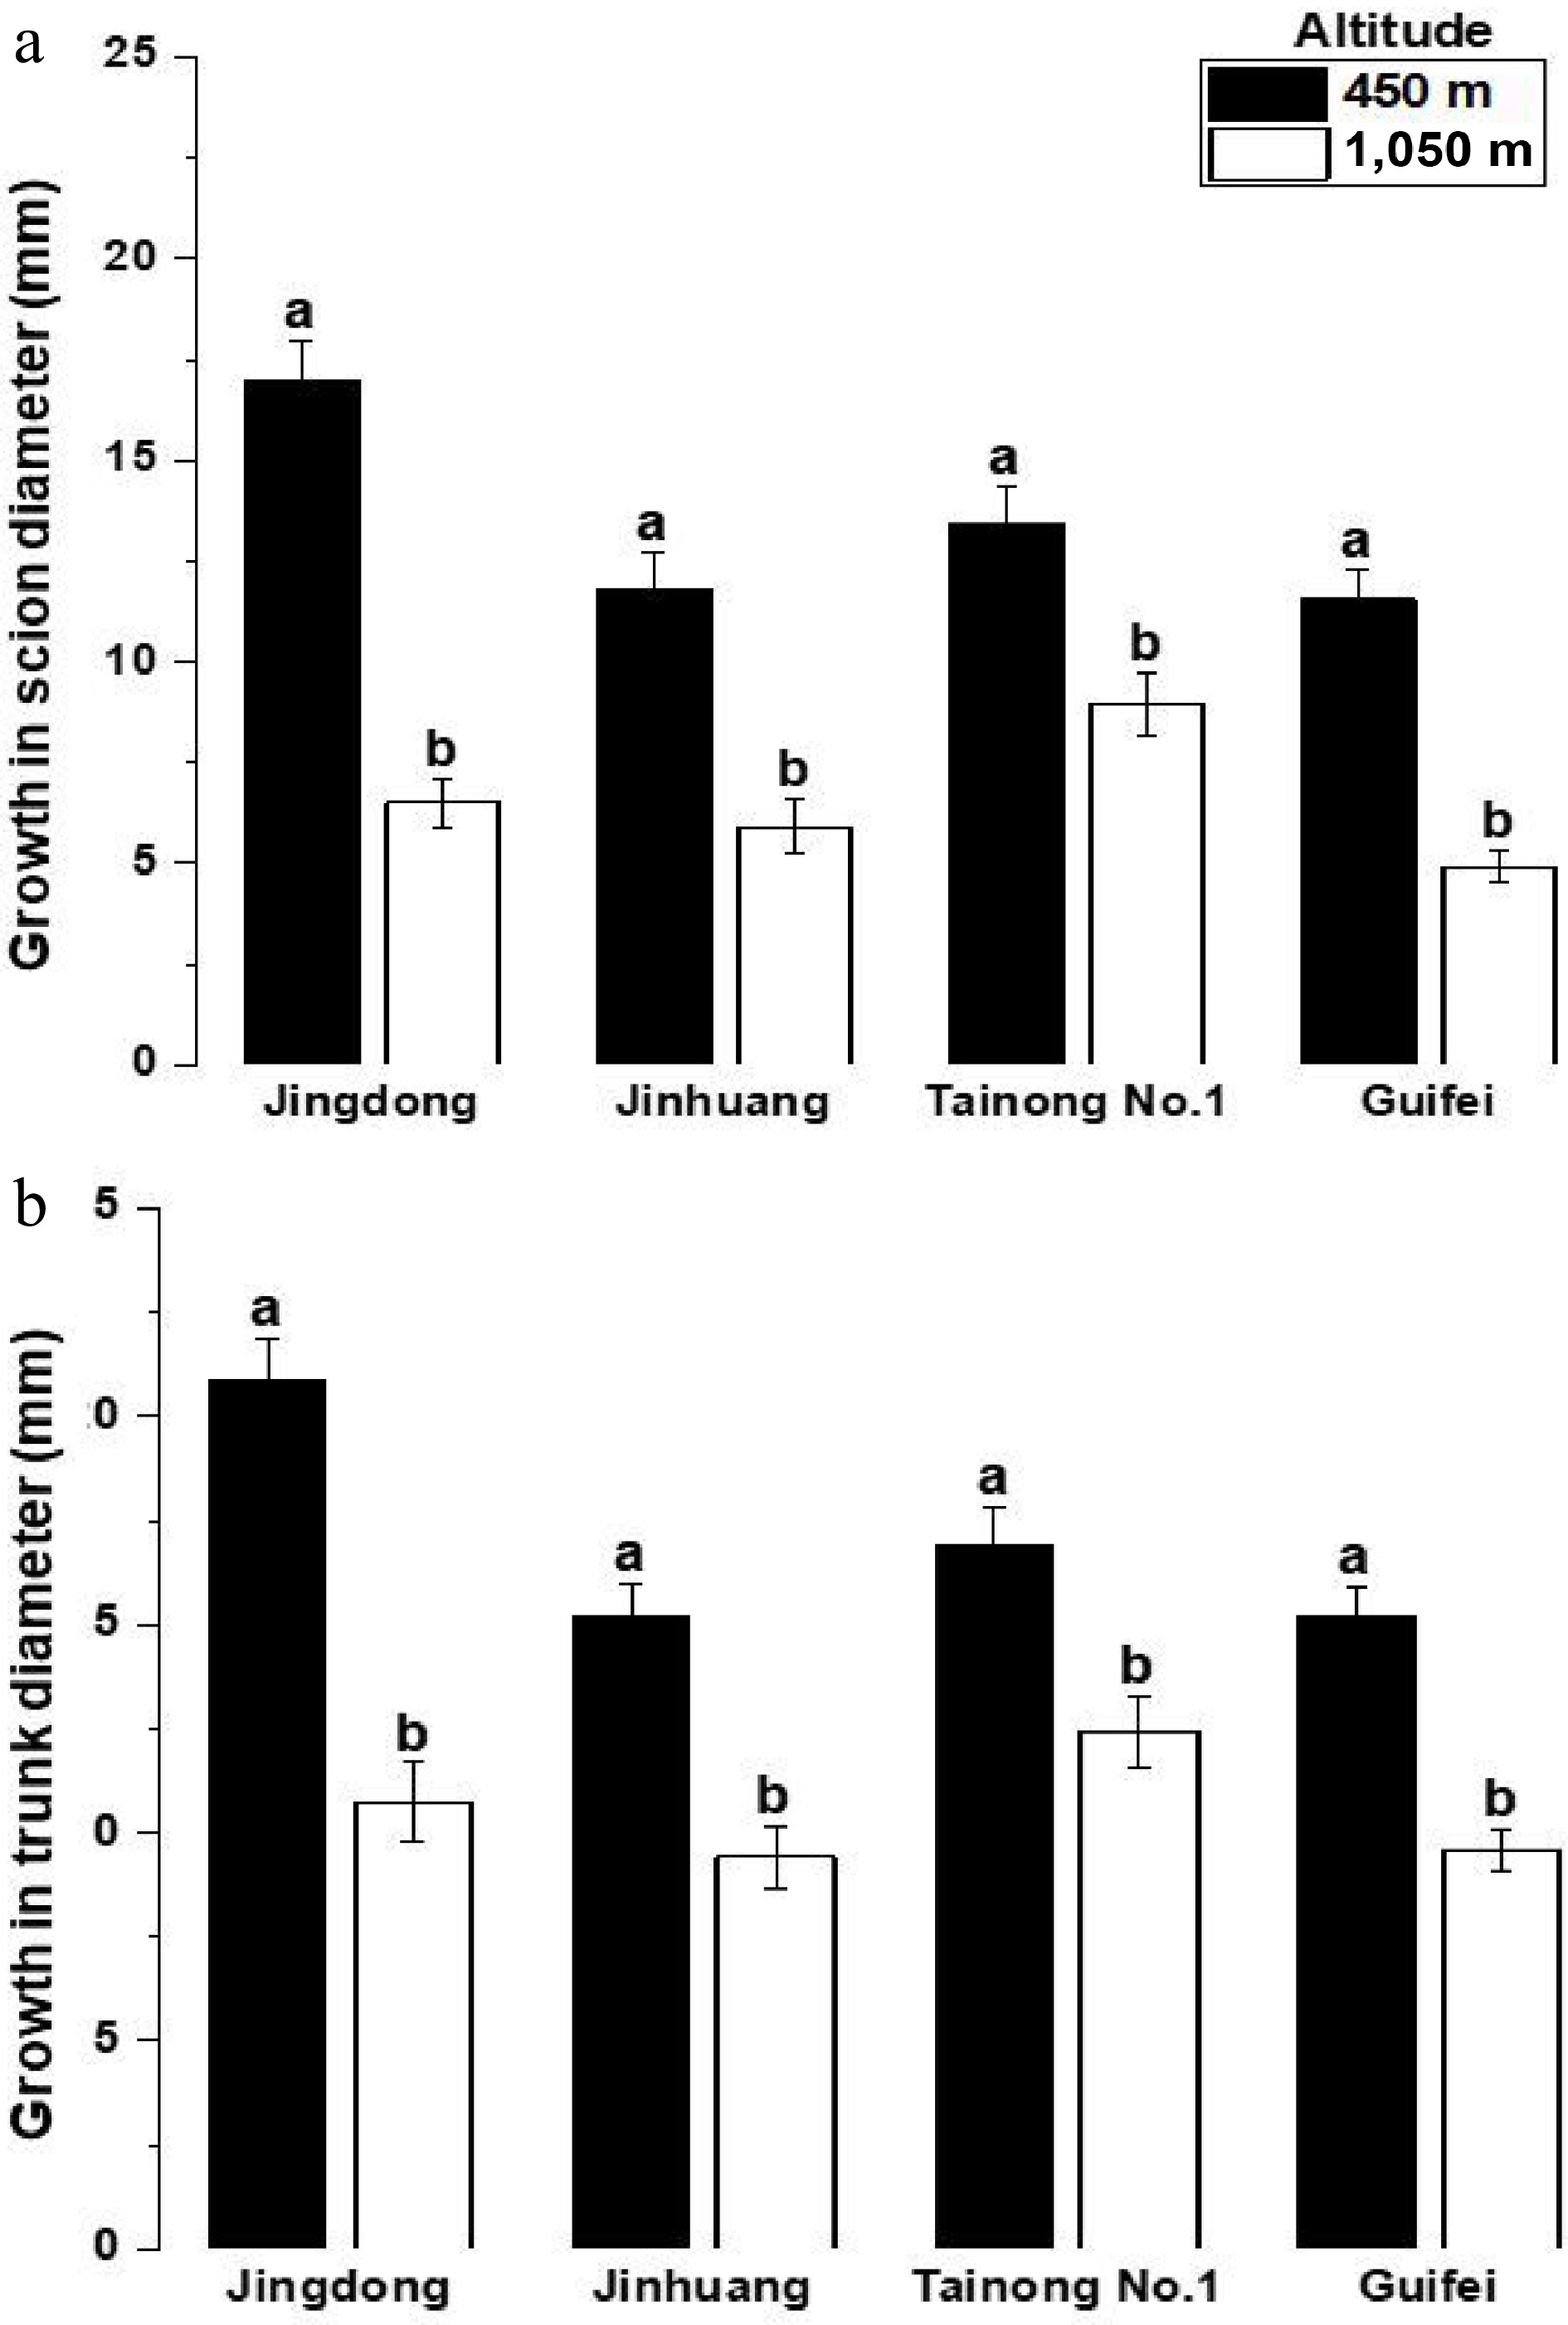
Figure 4.
Mean ± SE annual growth in (mm). (a) Scion, (b) trunk diameters of mango cultivars grown at altitudes of 450 and 1,050 m a.s.l. Different letters indicate the difference between means is statistically significant, p < 0.01.
-
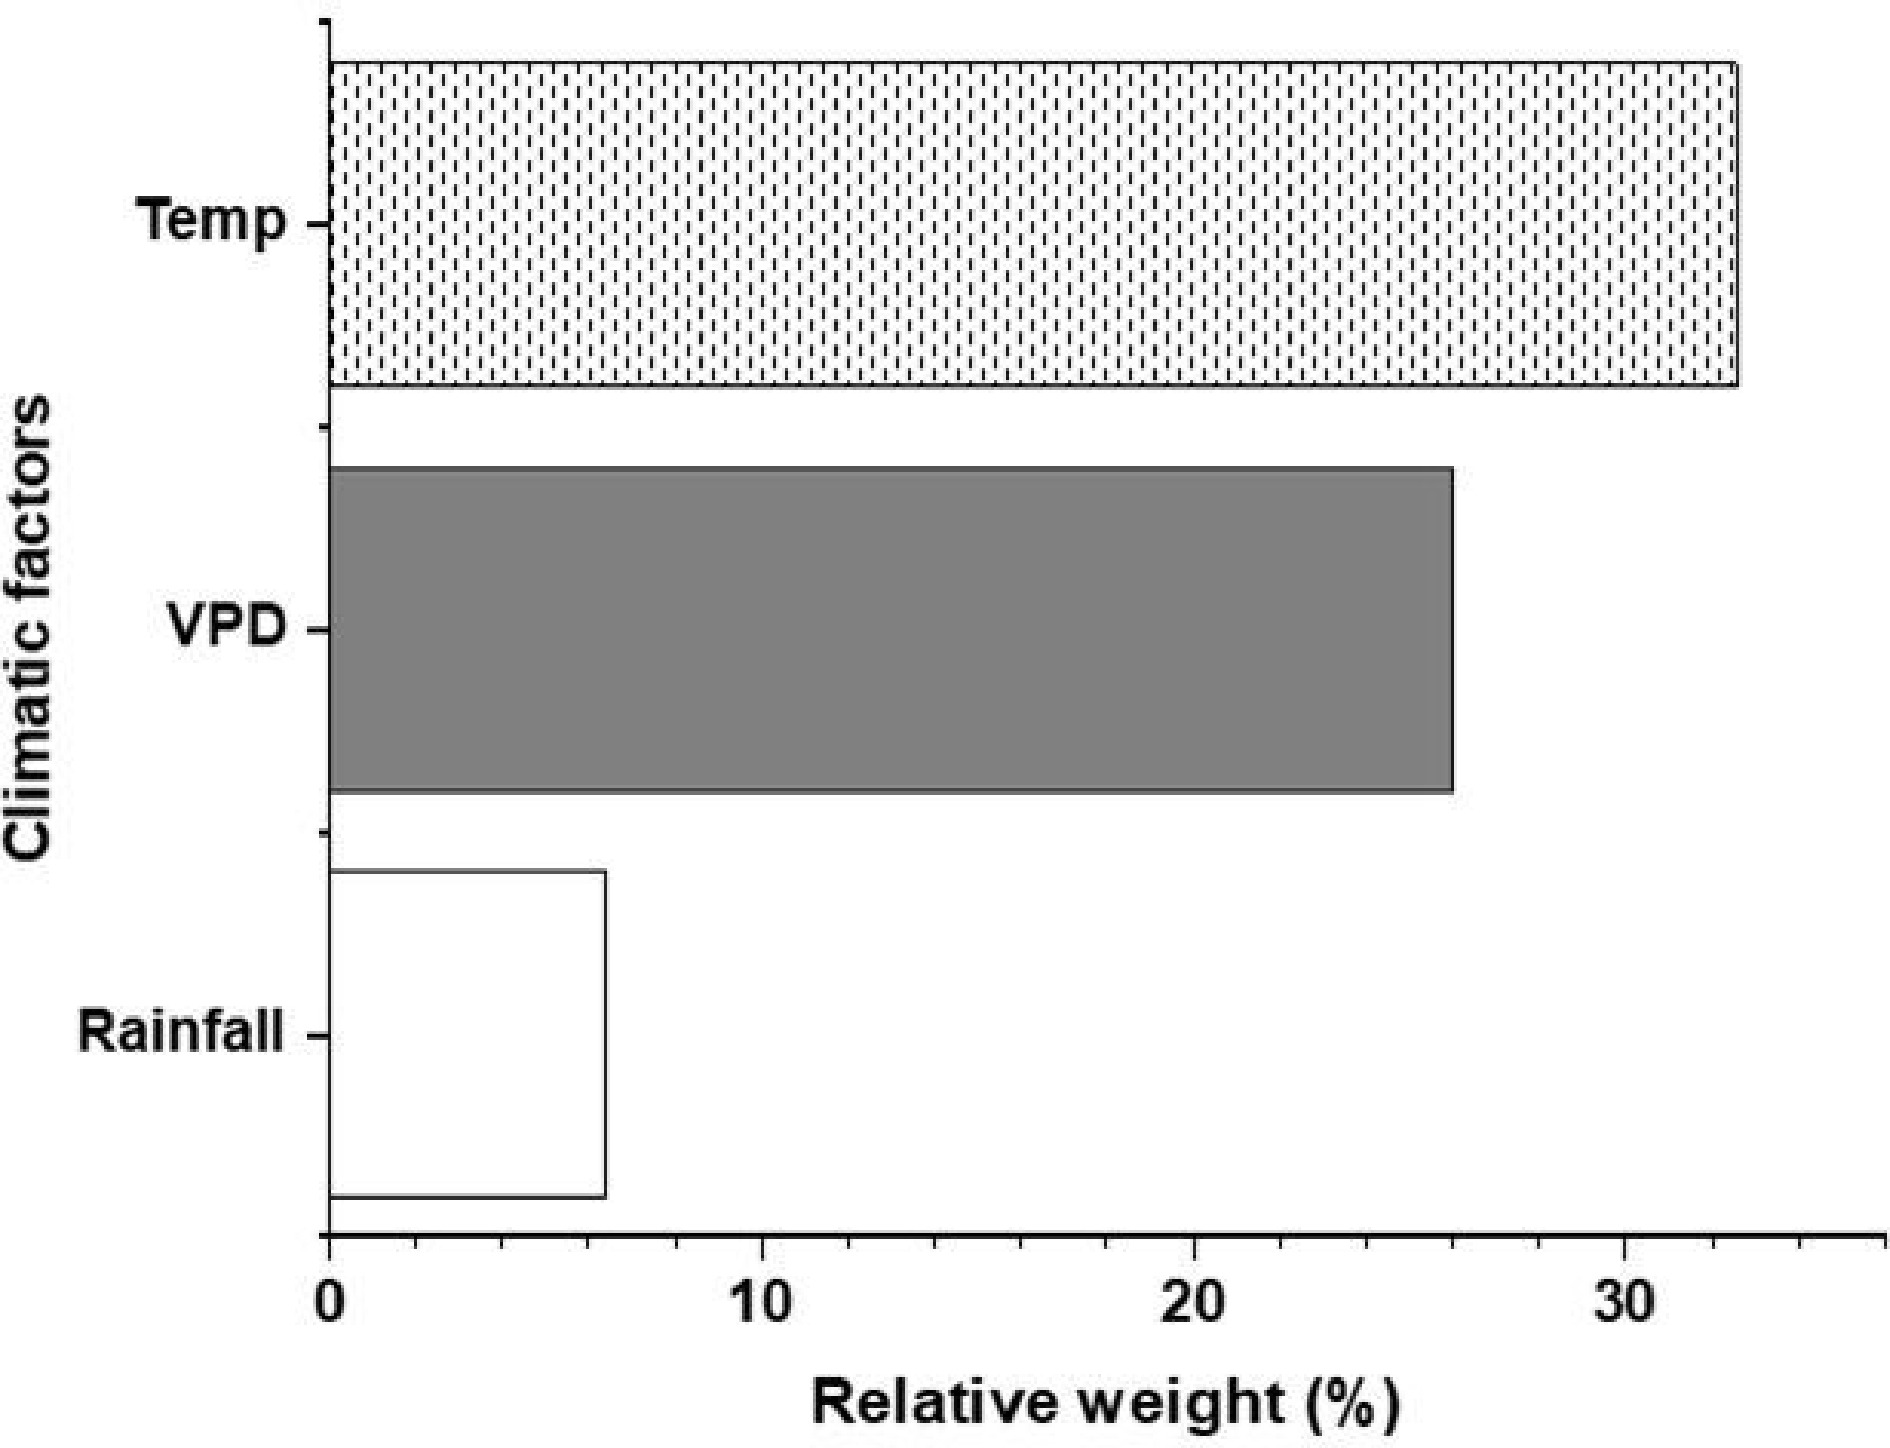
Figure 5.
Relative weight (%) of climatic factors to vegetative growth variation (R2 = 0.87).
-
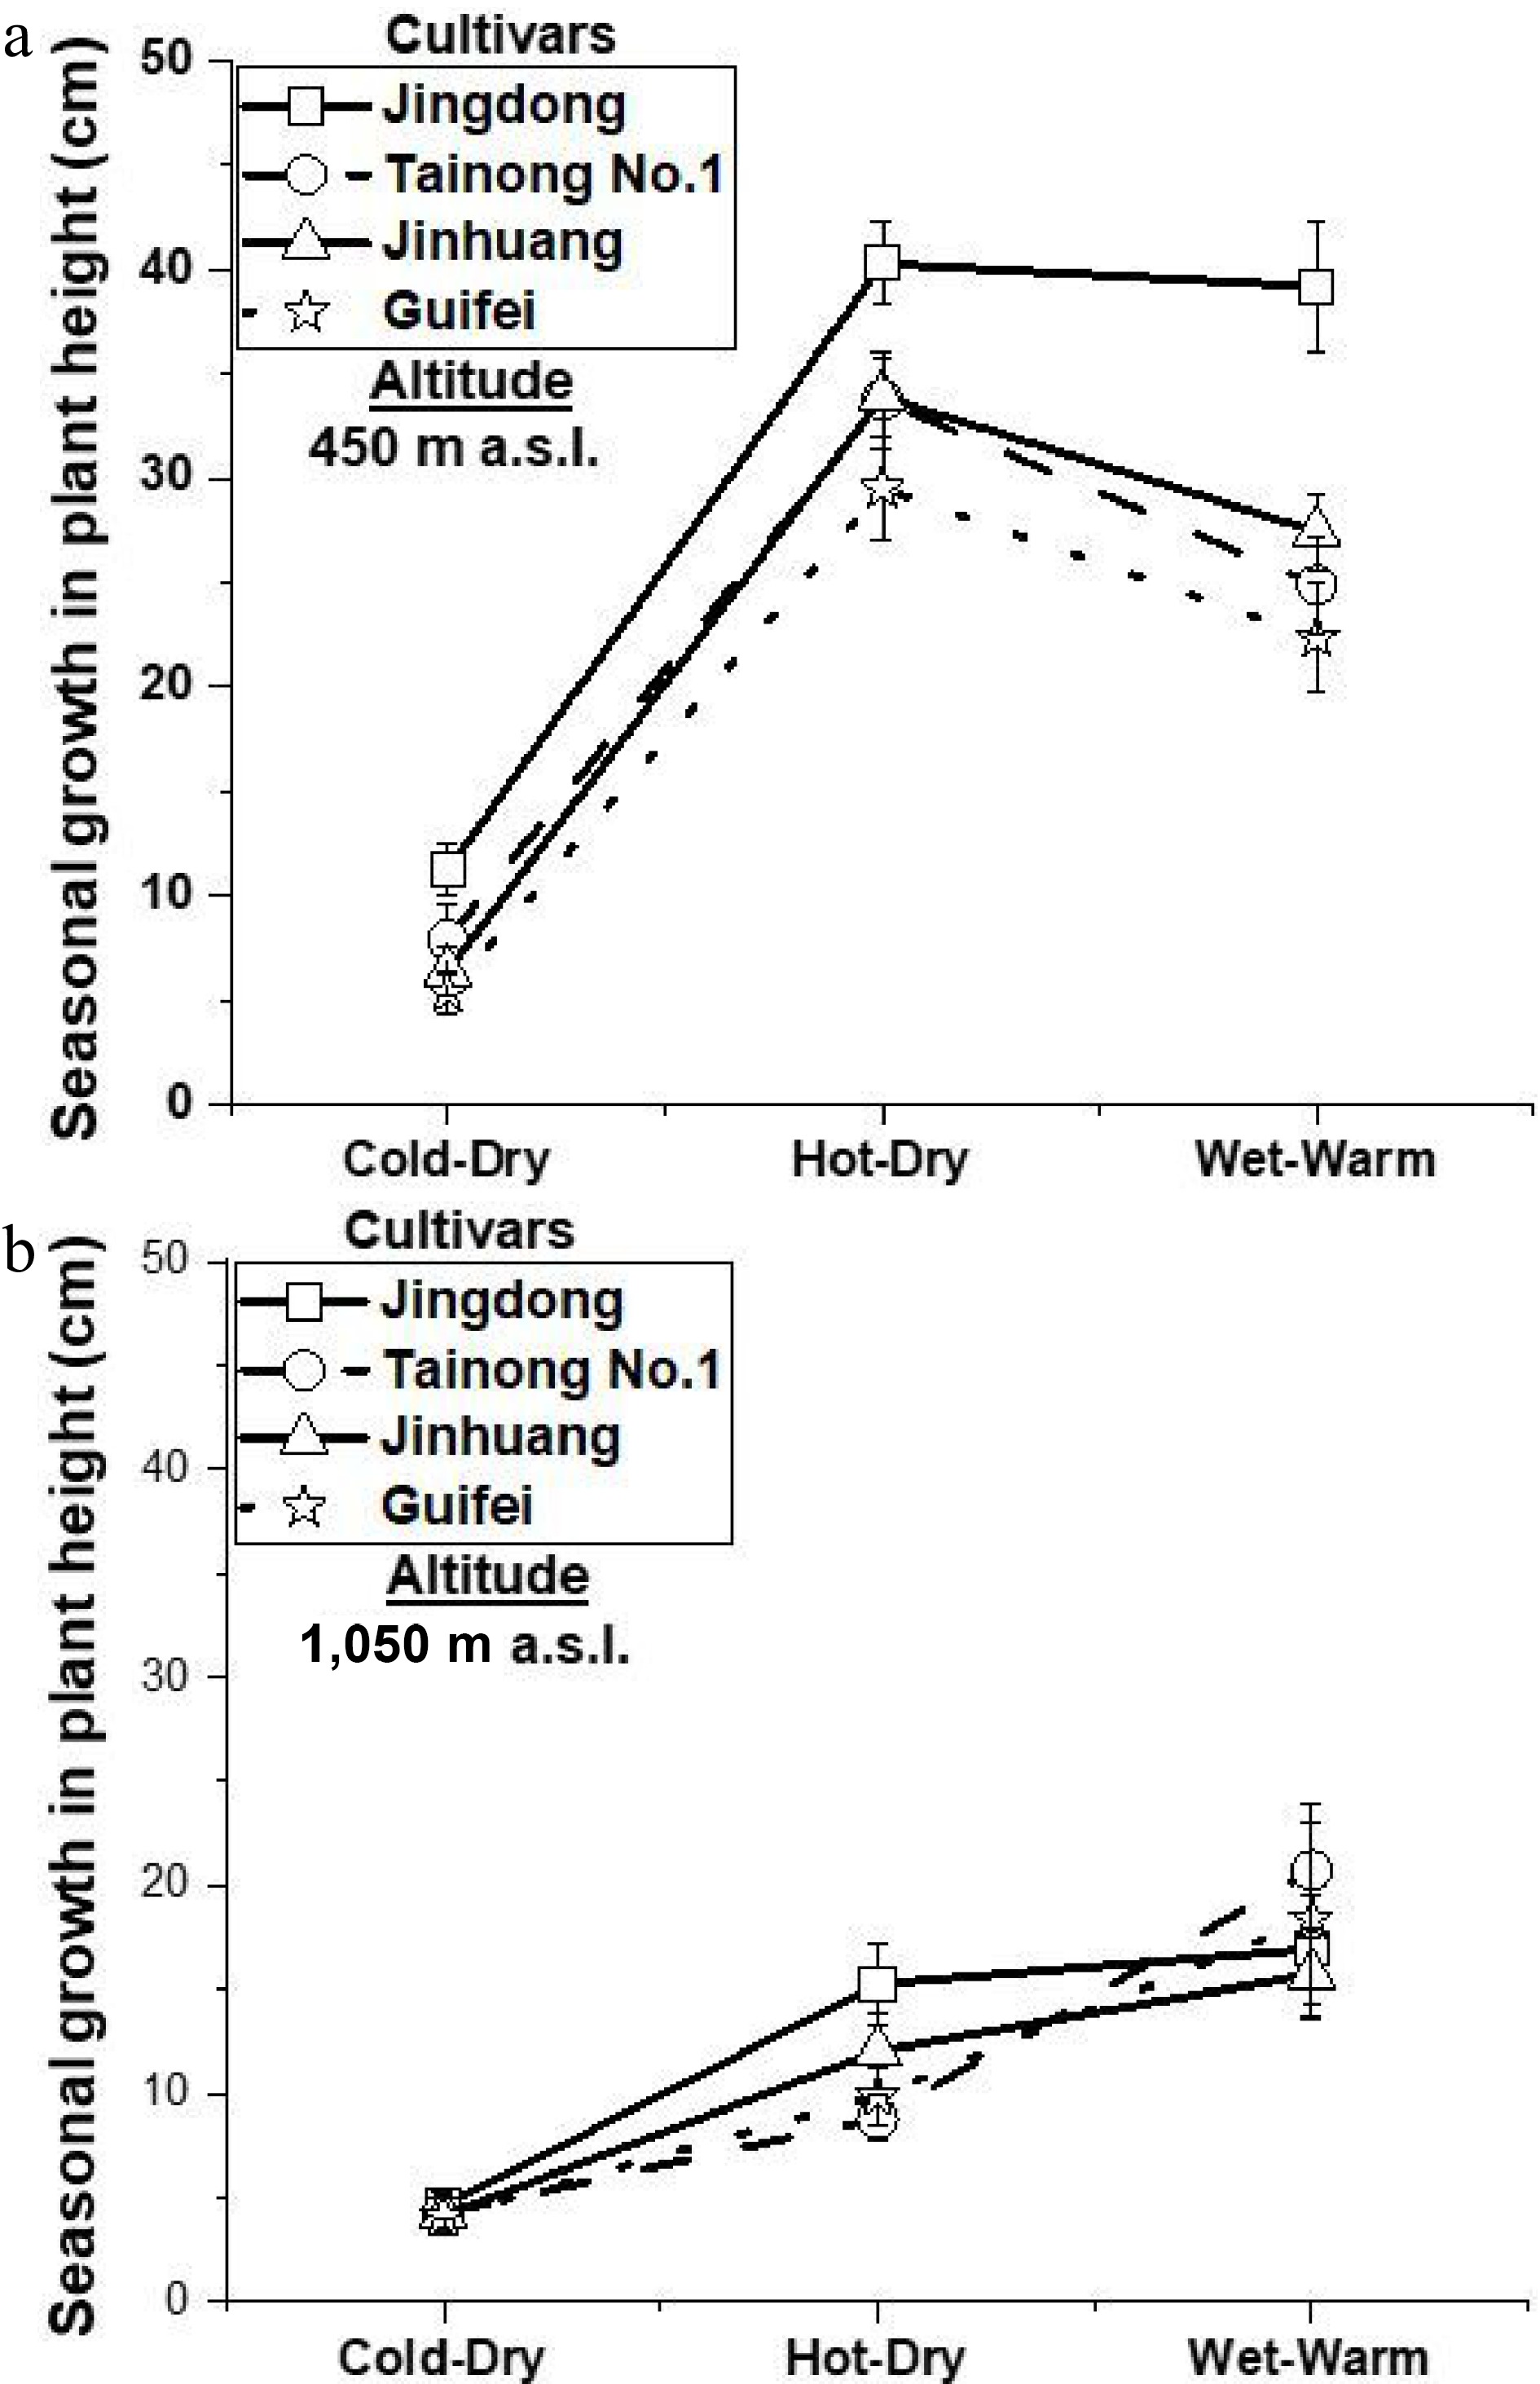
Figure 6.
Mean ± SE seasonal height growth (cm) during cold-dry, hot-dry, and wet-warm of four mango cultivars grown at 450 and 1,050 m, p < 0.01.
-
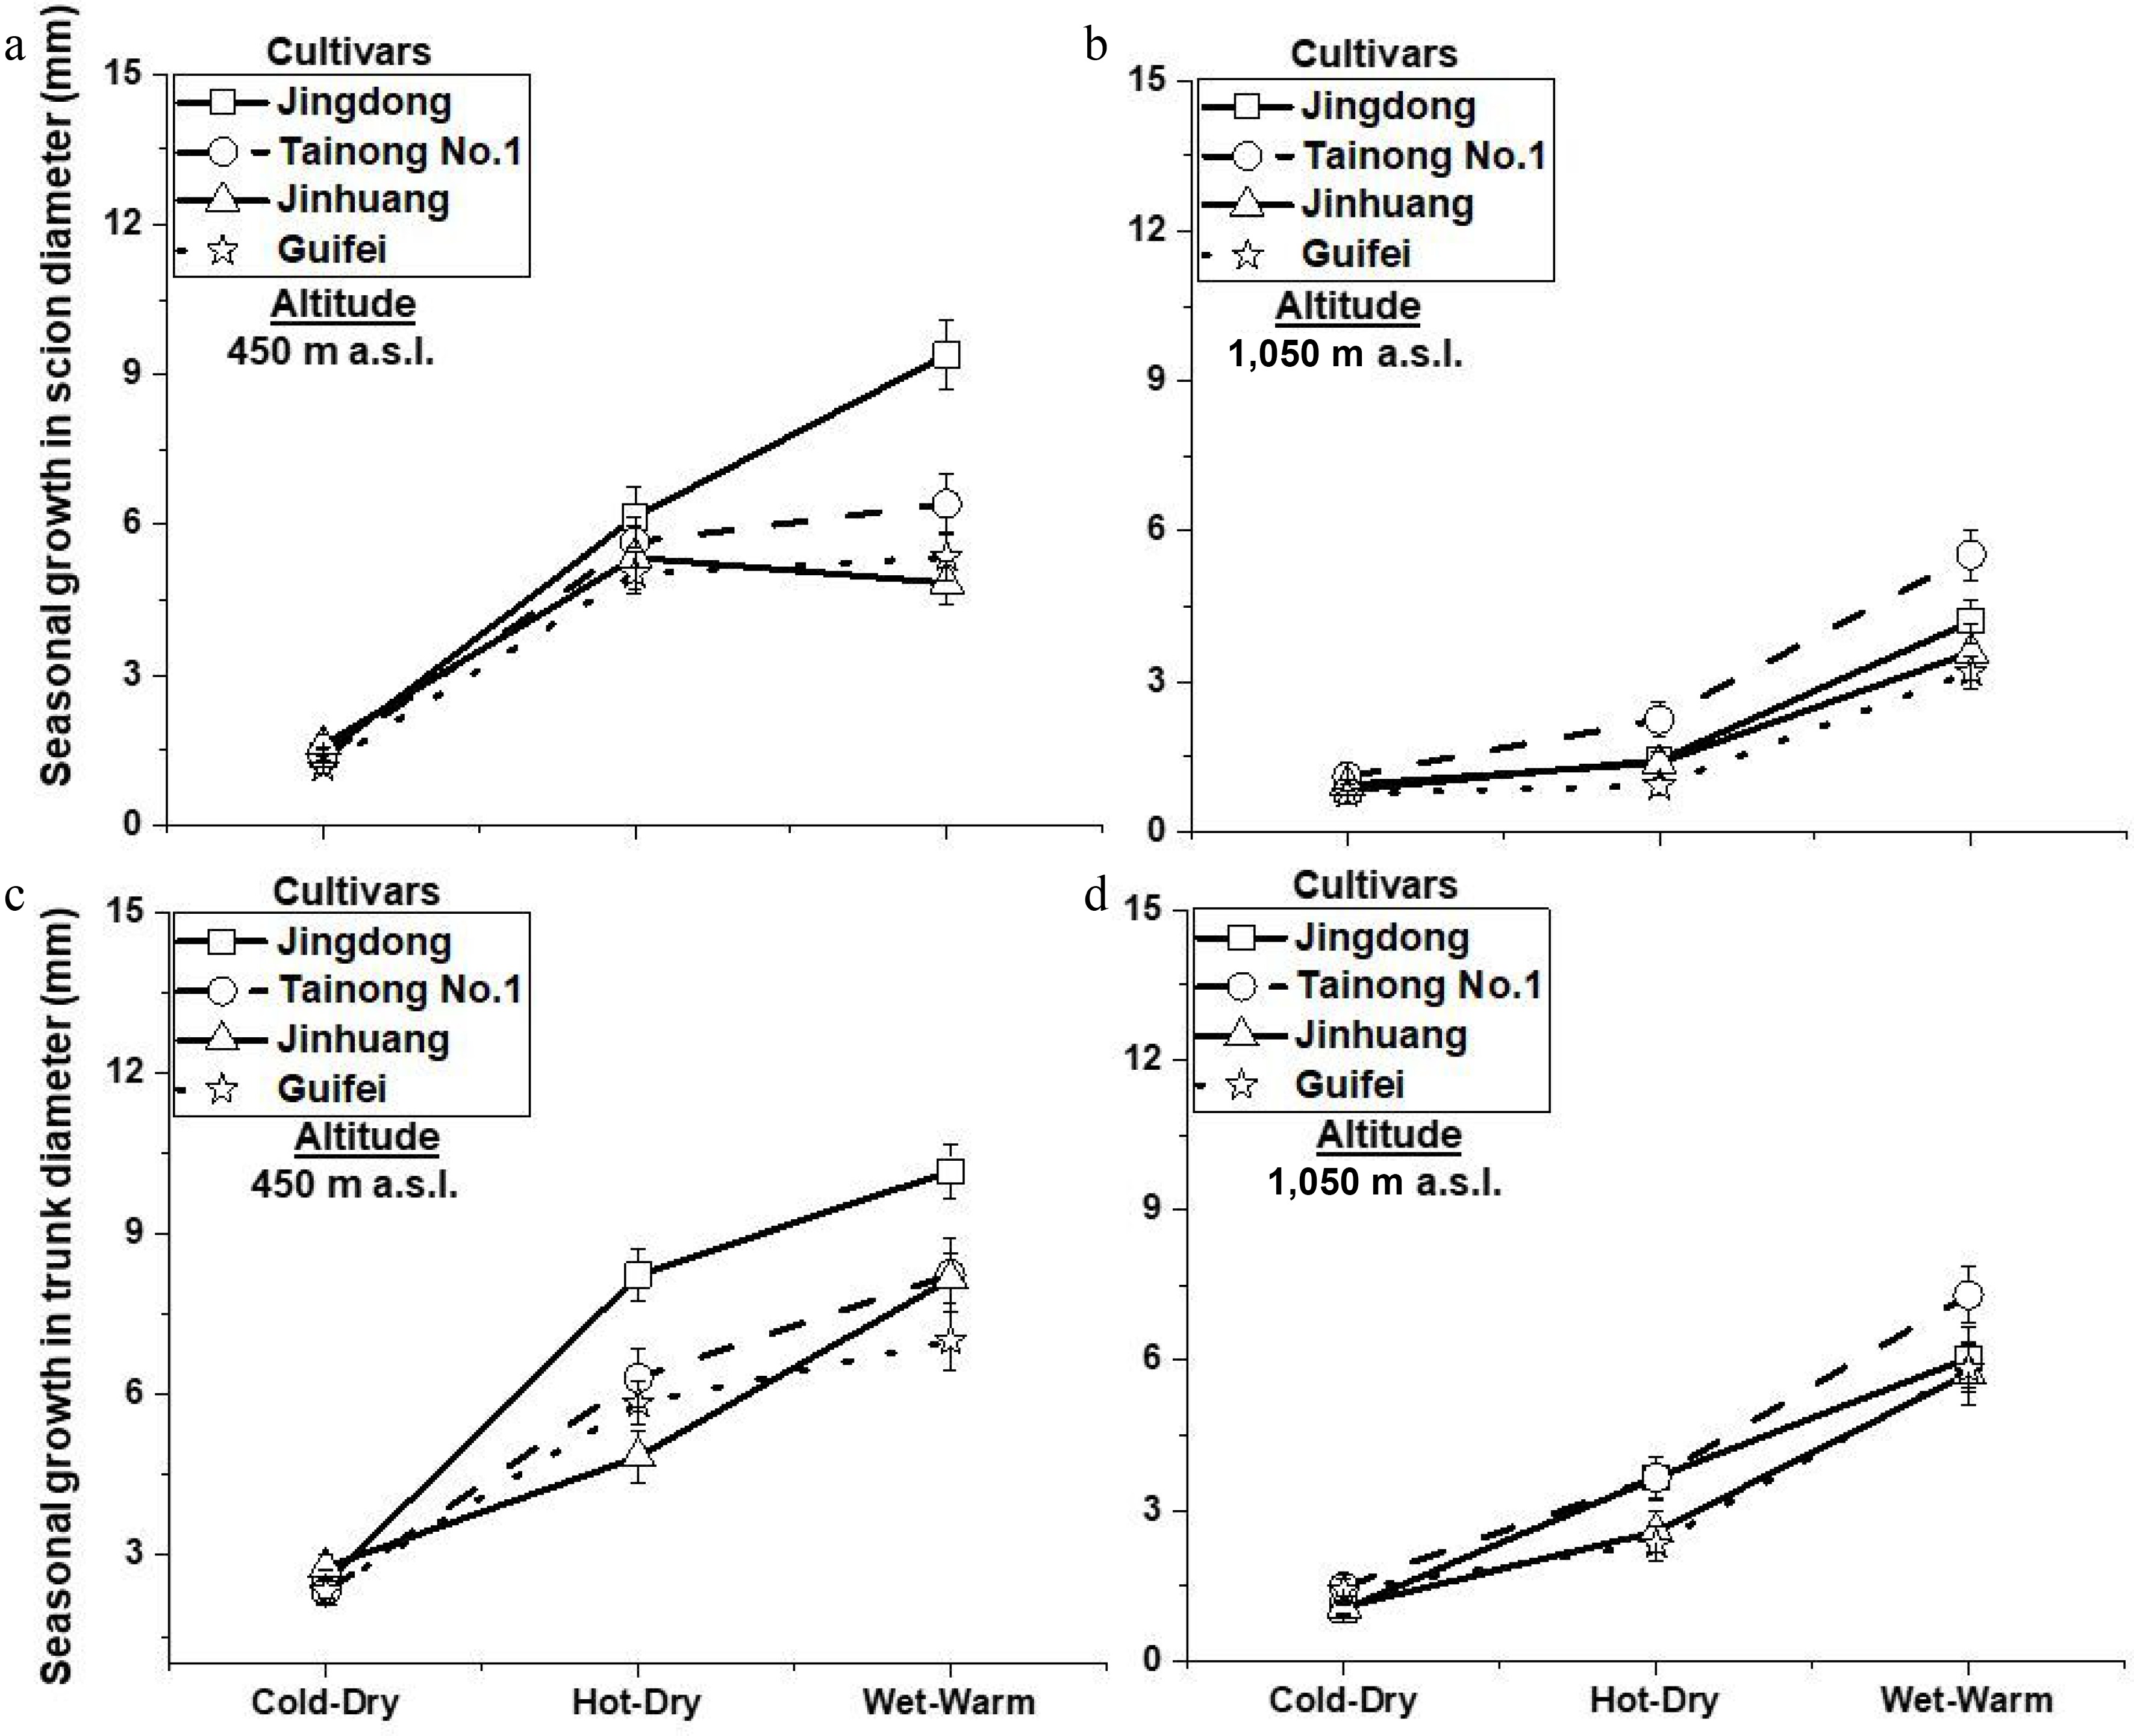
Figure 7.
Mean ± SE seasonal growth in scion and trunk diameter (mm) during cold-dry, hot-dry, and wet-warm of four mango cultivars grown at 450 and 1,050 m, p < 0.01.
-
Composition Unit Altitude (m) 450 1,050 pH − 6.72 ± 0.05a 6.67 ± 0.07a Soil organic carbon g/kg 8.89 ± 0.8a 7.61 ± 0.4a Total nitrogen g/kg 1.21 ± 0.7a 1.016 ± 0.03a Total phosphorous g/kg 0.5 ± 0.01a 0.54 ± 0.02a Available phosphorous mg/kg 9.49 ± 0.34a 8.93 ± 0.68a Total potassium g/kg 26.12 ± 0.7a 27.3 ± 1.0a Available potassium g/kg 0.224 ± 0.02a 0.22 ± 0.01a Table 1.
Soil chemical composition of the study plots located at 450 and 1,050 m altitudes before any treatment is applied. Different letters indicate the difference between means is statistically significant, whereas similar letters indicate the absence of a statistically significant difference between means, p ≤ 0.05.
-
Nutrient Unit R2cal R2Val RMSE RPD Carbon (C) g/kg 0.88 0.84 20.53 2.4 Nitrogen (N) g/kg 0.91 0.87 2.96 2.8 Potassium (K) g/kg 0.89 0.85 1.15 2.5 Calcium (Ca) g/kg 0.92 0.88 0.55 2.9 Phosphorus (P) g/kg 0.85 0.81 0.27 2.1 Magnesium (Mg) g/kg 0.86 0.82 0.06 2.2 Table 2.
Calibration and validation statistics for the mid-infrared (MIR) spectroscopy models of mango leaf nutrients (n = 48).
-
Altitude (m) Cultivars Fresh weight (g) Dry weight (g) Leaf area (cm2) Specific leaf area (cm2 g−1) 450 Jingdong 1.72 ± 0.07a 0.75 ± 0.03a 59.8 ± 1.9a 86.52 ± 1.6a Jinhuang 2.30 ± 0.2a 0.97 ± 0.04a 67.2 ± 2.2a 72.28 ± 1.1a Tainong No.1 1.77 ± 0.1a 0.77 ± 0.03a 58.0 ± 1.8a 77.98 ± 1.5a Guifei 2.35 ± 0.01a 1.07 ± 0.04a 72.8 ± 2.4a 72.43 ± 1.1a 1,050 Jingdong 1.35 ± 0.06b 0.60 ± 0.02b 48.3 ± 1.5b 87.22 ± 1.6a Jinhuang 2.00 ± 0.06a 0.85 ± 0.03a 59.8 ± 1.7a 75.10 ± 3.6a Tainong No.1 1.52 ± 0.05b 0.68 ± 0.02b 49.3 ± 1.4b 74.77 ± 1.2a Guifei 2.03 ± 0.08a 0.87 ± 0.04a 64.3 ± 2.2a 77.33 ± 1.6a Table 3.
Mean ± SE of leaf fresh weight, dry weight, area, specific leaf area of mango cultivars at altitudes of 450 and 1,050 m a.s.l. Different letters indicate that the difference between means is statistically significant, whereas similar letters indicate the absence of statistically significant differences between means (p < 0.05).
-
Altitude (m) Cultivar N (%) p < 0.01 K (mg g−1) p < 0.05 Ca (mg g−1) p < 0.05 C : P ratio p < 0.05 C : N ratio p < 0.05 450 Jingdong 2.2 ± 0.029b 6.4 ± 0.12b 25.08 ± 0.7a 312.2 ± 5.3a 18.7 ± 0.17a Jinhuang 2.2 ± 0.03b 6.3 ± 0.1b 25.7 ± 0.7a 321.8 ± 5.1a 19.135 ± 0.28a Tainong No.1 2.2 ± 0.028b 6.7 ± 0.12b 24.5 ± 0.8a 305.4 ± 7.8b 18.6 ± 0.13a Guifei 2.2 ± 0.037b 6.1 ± 0.21b 26.7 ± 0.9a 305.4 ± 7.8a 18.7 ± 0.2a 1,050 Jingdong 2.4 ± 0.02a 7.01 ± 0.14a 22.7 ± 0.6b 324 ± 5.5a 17.6 ± 0.17b Jinhuang 2.37 ± 0.027a 7.02 ± 0.12a 23.2 ± 0.4a 322.6 ± 8.1a 17.8 ± 0.18b Tainong No.1 2.4 ± 0.02a 7.01 ± 0.12a 22.8 ± 0.6b 326.45 ± 5a 17.8 ± 0.12b Guifei 2.39 ± 0.03a 7.02 ± 0.1a 23.4 ± 0.5b 318.7 ± 6.4a 17.7 ± 0.26b Table 4.
Mean ± SE of leaf nutrient content of four mango cultivars of mango cultivars at altitudes of 450 and 1,050 m a.s.l. Different letters indicates the difference between means is statistically significant.
Figures
(7)
Tables
(4)