-
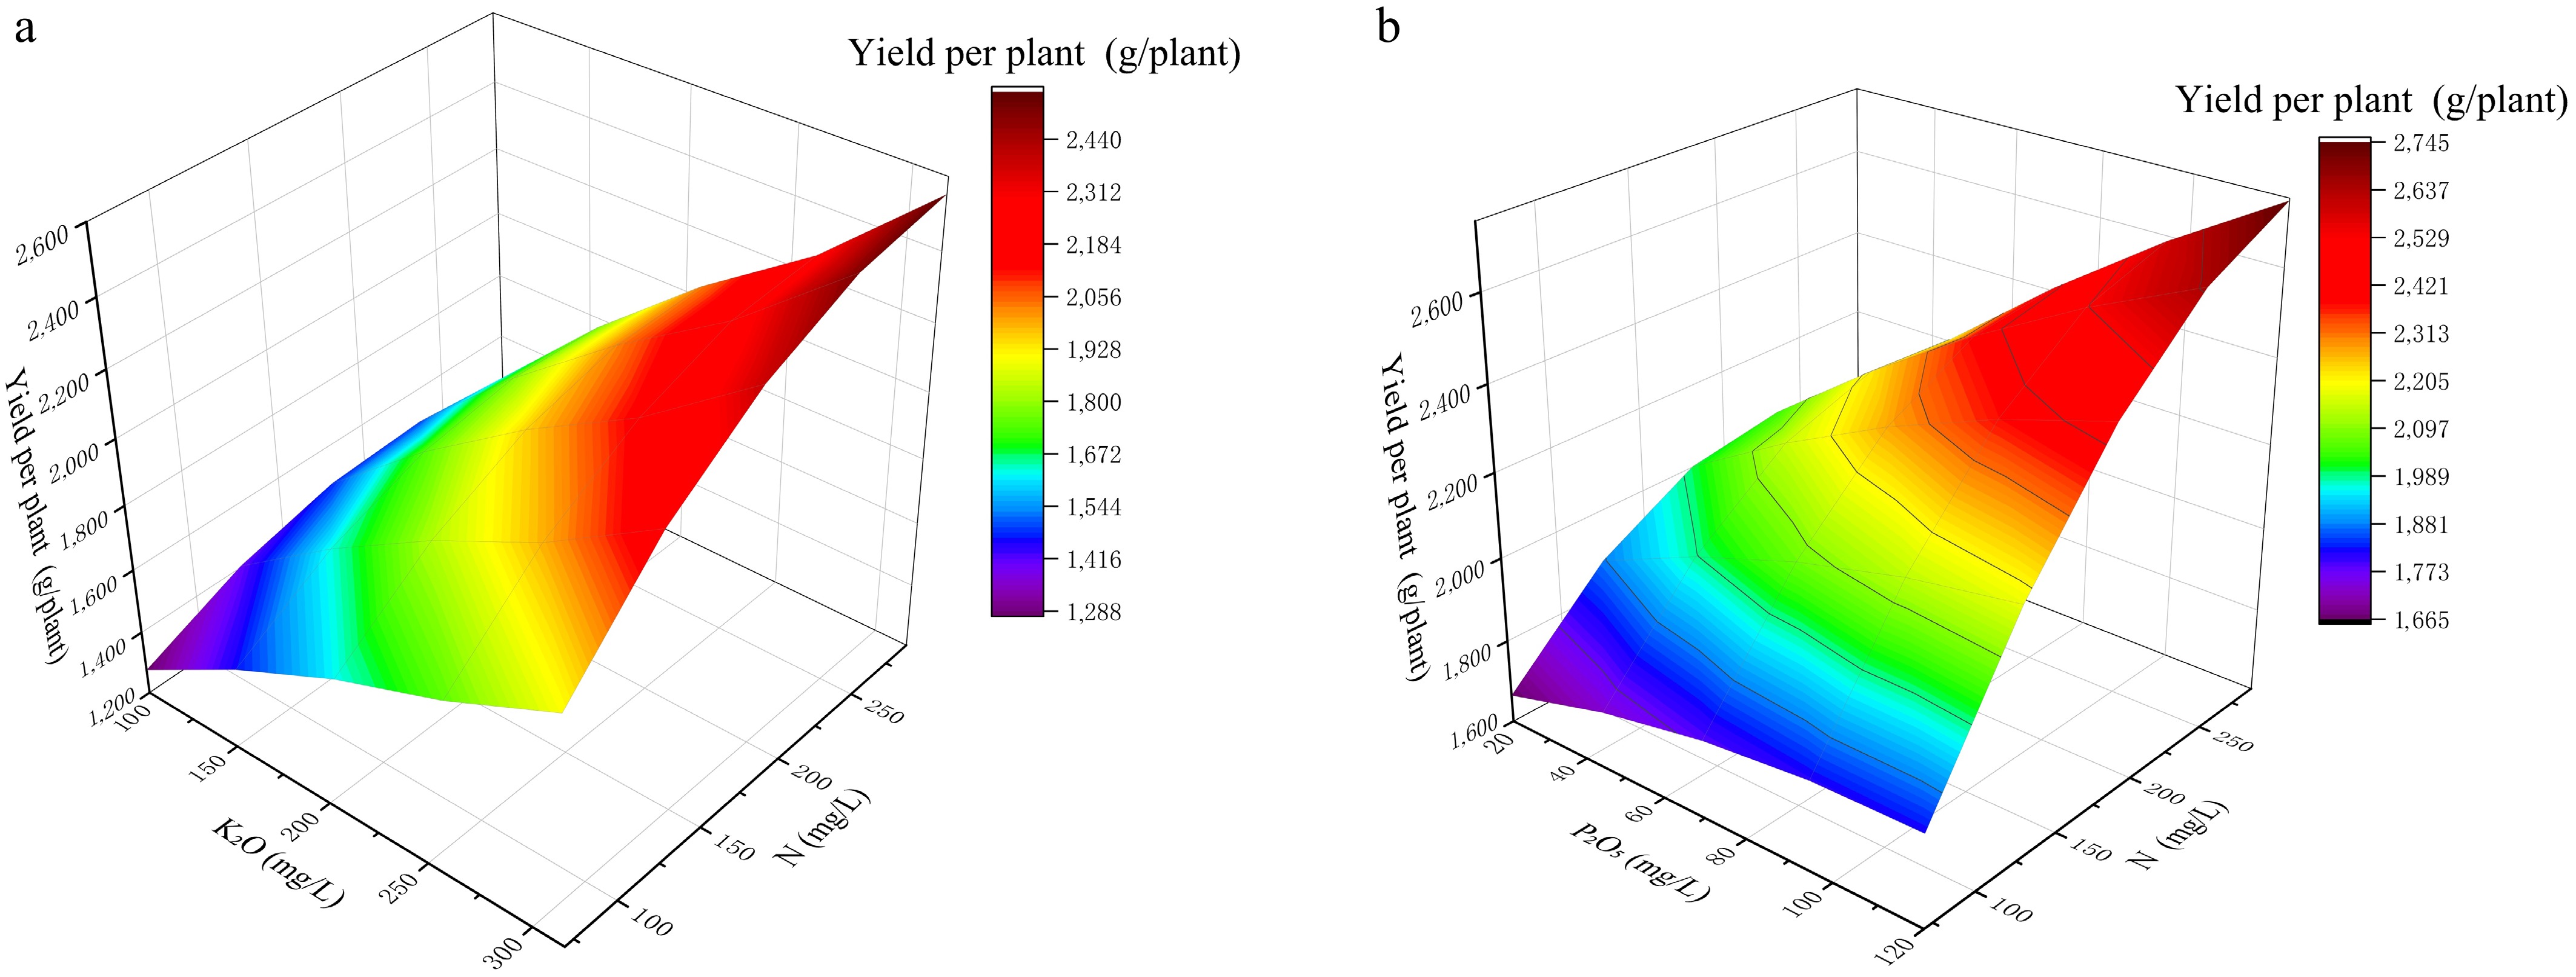
Figure 1.
Response surfaces showing the effects of N × K2O and N × P2O5 interactions on single-plant yield. (a) Response surface of N and P interaction on yield per plant at a fixed K level of 315 mg L−1. (b) Response surface of N and K interaction on yield per plant at a fixed P level of 120 mg L−1.
-
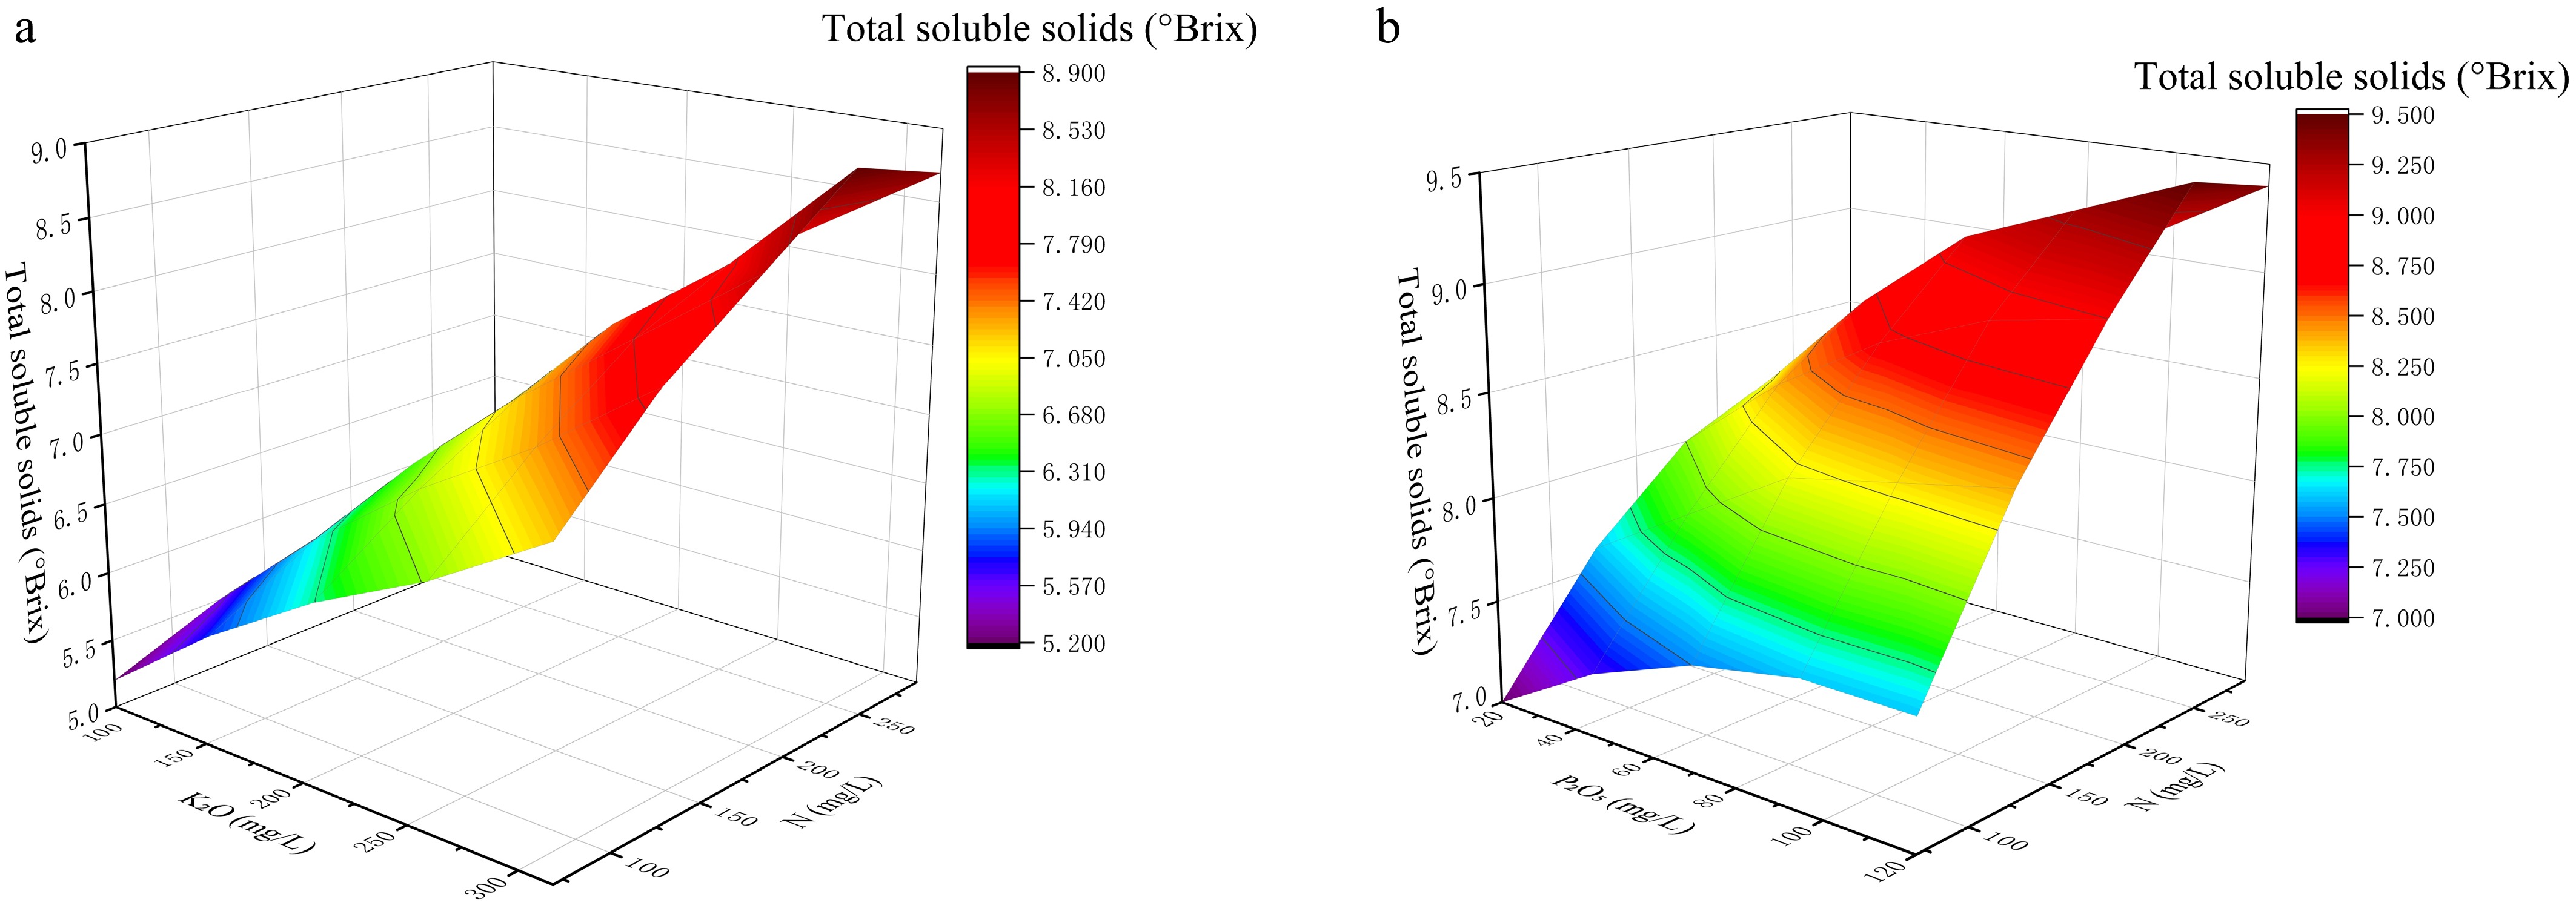
Figure 2.
Response surfaces showing the effects of N × K2O and N × P2O5 interactions on total soluble solids.(a) Response surface of N and P2O5 for TSS at a fixed K2O level of 315 mg L−1. (b) Response surface of N and K interaction to soluble solids content when P level is fixed at 120 mg L−1.
-
Coded level N (mg L−1) P2O5 (mg L−1) K2O (mg L−1) +α 350 170 400 1 290 120 315 0 180 70 207.5 −1 70 20 100 −α 50 10 80 Table 1.
Factor levels and coded values used in the central composite design (CCD).
-
Run type Factorial point Center point Axial point Treatment (mg L−1) 1 2 3 4 5 6 7 8 9 10 11 12 13 14 15 16 17 N 70 70 70 70 290 290 290 290 180 180 180 70 290 180 180 180 180 P2O5 20 20 120 120 20 20 120 120 70 70 70 70 70 20 120 70 70 K2O 100 315 100 315 100 315 100 315 207.5 207.5 207.5 207.5 207.5 207.5 207.5 100 315 Table 2.
Nutrient-solution compositions (Yamazaki-based) used in the CCD optimization experiment.
-
Run Yield (g plant−1) Sugar/acid ratio Lycopene
(mg 100 g−1)Soluble sugars
(mg 100 g−1)Total soluble
solids (°Brix)Vitamin C
(mg 100 g−1)Citric acid
(mg g-−1)Titratable acidity 1 1,216 ± 137 8.5 ± 0.17 3.2 ± 1.47 52 ± 1.38 5.1 ± 0.26 17.5 ± 1.12 2.1 ± 0.14 2.8 ± 0.25 2 1,634 ± 109 12.5 ± 0.25 5.8 ± 2.14 62 ± 2.05 6.3 ± 0.38 18.5 ± 1.63 2.5 ± 0.16 3 ± 0.30 3 1,292 ± 165 9 ± 0.25 4.5 ± 2.91 54 ± 2.61 5.4 ± 0.33 17.8 ± 1.47 2.2 ± 0.15 2.9 ± 0.28 4 1,862 ± 151 15.2 ± 0.33 7.2 ± 1.44 68 ± 1.92 6.9 ± 0.41 19 ± 1.81 2.6 ± 0.17 3.4 ± 0.37 5 1,406 ± 204 10.5 ± 0.22 3.8 ± 3.32 55 ± 3.36 5.6 ± 0.34 18 ± 1.44 2.4 ± 0.17 3 ± 0.30 6 1,938 ± 114 16.5 ± 0.32 8.5 ± 1.55 78 ± 1.59 7.7 ± 0.54 20.2 ± 2.14 2.7 ± 0.22 3.6 ± 0.45 7 1,140 ± 107 7.6 ± 0.29 3.5 ± 3.20 50 ± 3.35 4.9 ± 0.27 17 ± 1.19 2 ± 0.13 2.7 ± 0.24 8 2,090 ± 152 15.8 ± 0.28 7.8 ± 1.92 74 ± 1.60 7.4 ± 0.52 19.5 ± 2.04 2.85 ± 0.24 3.8 ± 0.49 9 1,786 ± 236 15.2 ± 0.36 6.5 ± 2.28 66 ± 2.63 6.6 ± 0.46 19 ± 1.71 2.6 ± 0.19 3.4 ± 0.39 10 1,808 ± 192 15.5 ± 0.32 6.6 ± 2.26 67 ± 2.36 6.7 ± 0.41 19.1 ± 1.86 2.62 ± 0.20 3.4 ± 0.41 11 1,763 ± 109 14.9 ± 0.28 6.3 ± 3.44 65 ± 3.90 6.4 ± 0.38 18.9 ± 1.70 2.58 ± 0.19 3.3 ± 0.38 12 1,520 ± 184 11 ± 0.24 4.8 ± 1.31 58 ± 1.35 5.7 ± 0.31 18.2 ± 1.28 2.3 ± 0.16 3.1 ± 0.31 13 1,900 ± 167 16.2 ± 0.28 7.5 ± 4.18 72 ± 3.70 7.3 ± 0.51 19.6 ± 2.06 2.72 ± 0.23 3.6 ± 0.47 14 1,672 ± 195 13.5 ± 0.30 5.5 ± 1.94 61 ± 1.83 6 ± 0.36 18.5 ± 1.57 2.5 ± 0.18 3.2 ± 0.35 15 1,862 ± 183 16.8 ± 0.36 8.2 ± 2.70 76 ± 2.72 7.6 ± 0.53 19.8 ± 2.08 2.68 ± 0.23 3.7 ± 0.48 16 1,254 ± 177 9.5 ± 0.22 3.6 ± 1.43 53 ± 1.74 5.2 ± 0.26 17.6 ± 1.23 2.15 ± 0.15 2.9 ± 0.26 17 1,884 ± 102 17 ± 0.28 8 ± 3.43 75 ± 3.18 7.5 ± 0.53 20 ± 2.10 2.75 ± 0.24 3.7 ± 0.48 Table 3.
Yield and fruit-quality responses of cherry tomato under different nutrient-solution treatments in the CCD experiment.
-
Source df Yield Soluble solids F-value p-value F-value p-value Model 9 23.19 0.0002** 5.56 0.0171* A-(N) 1 14.42 0.0067** 4.92 0.0621 ns B-(P) 1 2.31 0.1726 ns 0.9 0.3735 ns C-(K) 1 153.5 < 0.0001** 37.01 0.0005** AB 1 3.49 0.1040 ns 1.81 0.2202 ns AC 1 4.87 0.0630 ns 1.81 0.2202 ns BC 1 6.49 0.0383* 0.25 0.6351 ns A² 1 0.59 0.4669 ns 0.46 0.5202 ns B² 1 0.17 0.6941 ns 0.09 0.7676 ns C² 1 13.59 0.0078** 1.37 0.2807 ns Residual 7 Lack of fit 5 16.91 0.0568 ns 14.54 0.0656 ns Pure error 2 R² 0.9676 0.8772 R² adj R² 0.9258 0.7193 CV% 4.8 7.83 ** indicates p < 0.01; * indicates p < 0.05; ns indicates not significant. Table 4.
ANOVA for the quadratic regression models of single-plant yield and total soluble solids.
-
Term Yield model Soluble solids model Coefficient Std error p-value Coefficient Std error p-value Intercept 1,763.68 33.86 < 0.0001** 6.65 0.21 < 0.0001** A-(N) 95 25.02 0.0067** 0.35 0.16 0.0621 ns B-(P) 38 25.02 0.1726 ns 0.15 0.16 0.3735 ns C-(K) 310 25.02 < 0.0001** 0.96 0.16 0.0005** AB −52.25 27.97 0.1040 ns −0.24 0.18 0.2202 ns AC 61.75 27.97 0.0630 ns 0.24 0.18 0.2202 ns BC 71.25 27.97 0.0383* 0.09 0.18 0.6351 ns A² −37.18 48.34 0.4669 ns −0.21 0.3 0.5202 ns B² 19.82 48.34 0.6941 ns 0.09 0.3 0.7676 ns C² −178.18 48.34 0.0078** −0.36 0.3 0.2807 ns ** indicates p < 0.01; * indicates p < 0.05; ns indicates not significant. Table 5.
Estimated regression coefficients and significance tests for the yield and total soluble solids models.
-
Growth stage Treatment Plant height (cm) Stem diameter (mm) Leaf number Total dry mass (g) SPAD Yield (g plant−1) Seedling vigor index Seedling stage TQ 34.77 ± 2.68b 4.82 ± 0.23b 8.50 ± 0.22b 1.85 ± 0.12b 33.14 ± 0.51b − 0.23 ± 0.10b CK 35.05 ± 2.88b 4.95 ± 0.15b 9.25 ± 0.42ab 1.98 ± 0.24b 34.19 ± 0.22b − 0.29 ± 0.04ab TB 38.90 ± 1.26a 5.11 ± 0.18a 9.55 ± 0.25a 2.25 ± 0.17a 35.62 ± 0.35a − 0.33 ± 0.02a Harvest stage TQ 124.88 ± 2.14b 10.51 ± 0.29 b 18.68 ± 0.58b 153.43 ± 6.52b 43.26 ± 2.15b 1,850 ± 45b − CK 126.13 ± 2.55b 10.60 ± 0.17b 18.70 ± 0.46b 158.08 ± 3.55b 44.54 ± 1.67b 1,811 ± 52b − TB 131.25 ± 1.47a 10.94 ± 0.30a 19.50 ± 0.32a 160.91 ± 3.89a 48.88 ± 2.14a 2,022 ± 42a − Different lowercase letters within a column indicate significant differences among treatments (Duncan's multiple range test, p < 0.05); '−' indicates not measured. Table 6.
Effects of model-derived nutrient solutions on cherry tomato growth and yield in the validation experiment.
-
Leaf Stem Fruit Root N P K N P K N P K N P K Content (g kg−1) TQ 31.63 ±
0.14c4.89 ±
0.12b49.65 ±
0.93b20.47 ±
0.22b6.62 ±
0.18b31.17 ±
0.54b19.76 ±
0.35b5.05 ±
0.06b37.15 ±
0.46b19.50 ±
0.50b6.80 ±
0.30b29.5 ±
1.00aCK 32.66 ±
0.22b5.11 ±
0.16a50.12 ±
0.52b21.18 ±
0.67a6.72 ±
0.22ab32.17 ±
0.56a20.25 ±
0.25b5.06 ±
0.08b37.52 ±
0.24b20.20 ±
0.40a7.00 ±
0.20ab30.5 ±
0.80aTB 33.51 ±
0.32a5.25 ±
0.14a52.15 ±
1.30a21.97 ±
0.36a6.88 ±
0.42a33.55 ±
0.23a21.55 ±
0.16a5.16 ±
0.06a38.14 ±
0.27a21.00 ±
0.60a7.30 ±
0.40a31.5 ±
1.20aUptake (mg plant−1) TQ 1.77 ±
0.11b0.29 ±
0.11b3.18 ±
0.18b0.68 ±
0.10b0.21 ±
0.02b0.97 ±
0.06b1.09 ±
0.09b0.28 ±
0.11b2.00 ±
0.10b0.52 ±
0.05b0.18 ±
0.02b0.78 ±
0.06bCK 1.89 ±
0.12b0.32 ±
0.13ab3.32 ±
0.22ab0.71 ±
0.06b0.23 ±
0.02ab1.01 ±
0.02ab1.12 ±
0.10b0.29 ±
0.06b2.03 ±
0.20b0.58 ±
0.04b0.20 ±
0.02b0.87 ±
0.05bTB 2.22 ±
0.15a0.36 ±
0.13a3.45 ±
0.17a0.81 ±
0.08a0.28 ±
0.02a1.10 ±
0.05a1.18 ±
0.04a0.32 ±
0.03a2.11 ±
0.15a0.65 ±
0.06a0.23 ±
0.03a0.97 ±
0.08aDifferent lowercase letters within a column indicate significant differences among treatments (Duncan's multiple range test, p < 0.05). TQ, quality-optimized formulation; CK, Yamazaki formula (control); TB, comprehensive optimum (yield + quality). Table 7.
N, P, and K contents and uptakes in different organs of cherry tomato under different nutrient-solution treatments.
-
Treatment Firmness
(kg cm−2)Total soluble
solids (°Brix)Soluble total sugars
(mg 100 g−1)Citric acid
(mg g−1)Malic acid
(mg g−1)Lycopene
(mg 100 g−1)Sugar/acid ratio Vitamin C
(mg 100 g−1)TQ 5.25 ± 0.35b 7.65 ± 0.28a 78.50 ± 2.20a 2.65 ± 0.45a 0.61 ± 0.15b 8.08 ± 1.68a 16.5 ± 0.24a 22.5 ± 0.85a CK 5.18 ± 0.45b 6.67 ± 0.39b 70.14 ± 1.78b 2.05 ± 0.03b 0.64 ± 0.11b 7.15 ± 1.56b 15.2 ± 0.22b 18.7 ± 0.89b TB 5.71 ± 0.31a 7.48 ± 0.32a 76.80 ± 2.05a 2.60 ± 0.25a 0.75 ± 0.17a 8.25 ± 2.88a 16.0 ± 0.18a 23.0 ± 0.82a Different lowercase letters within a column indicate significant differences among treatments (Duncan's multiple range test, p < 0.05). Table 8.
Fruit quality of cherry tomato under different nutrient-solution treatments in the validation experiment.
Figures
(2)
Tables
(8)