-
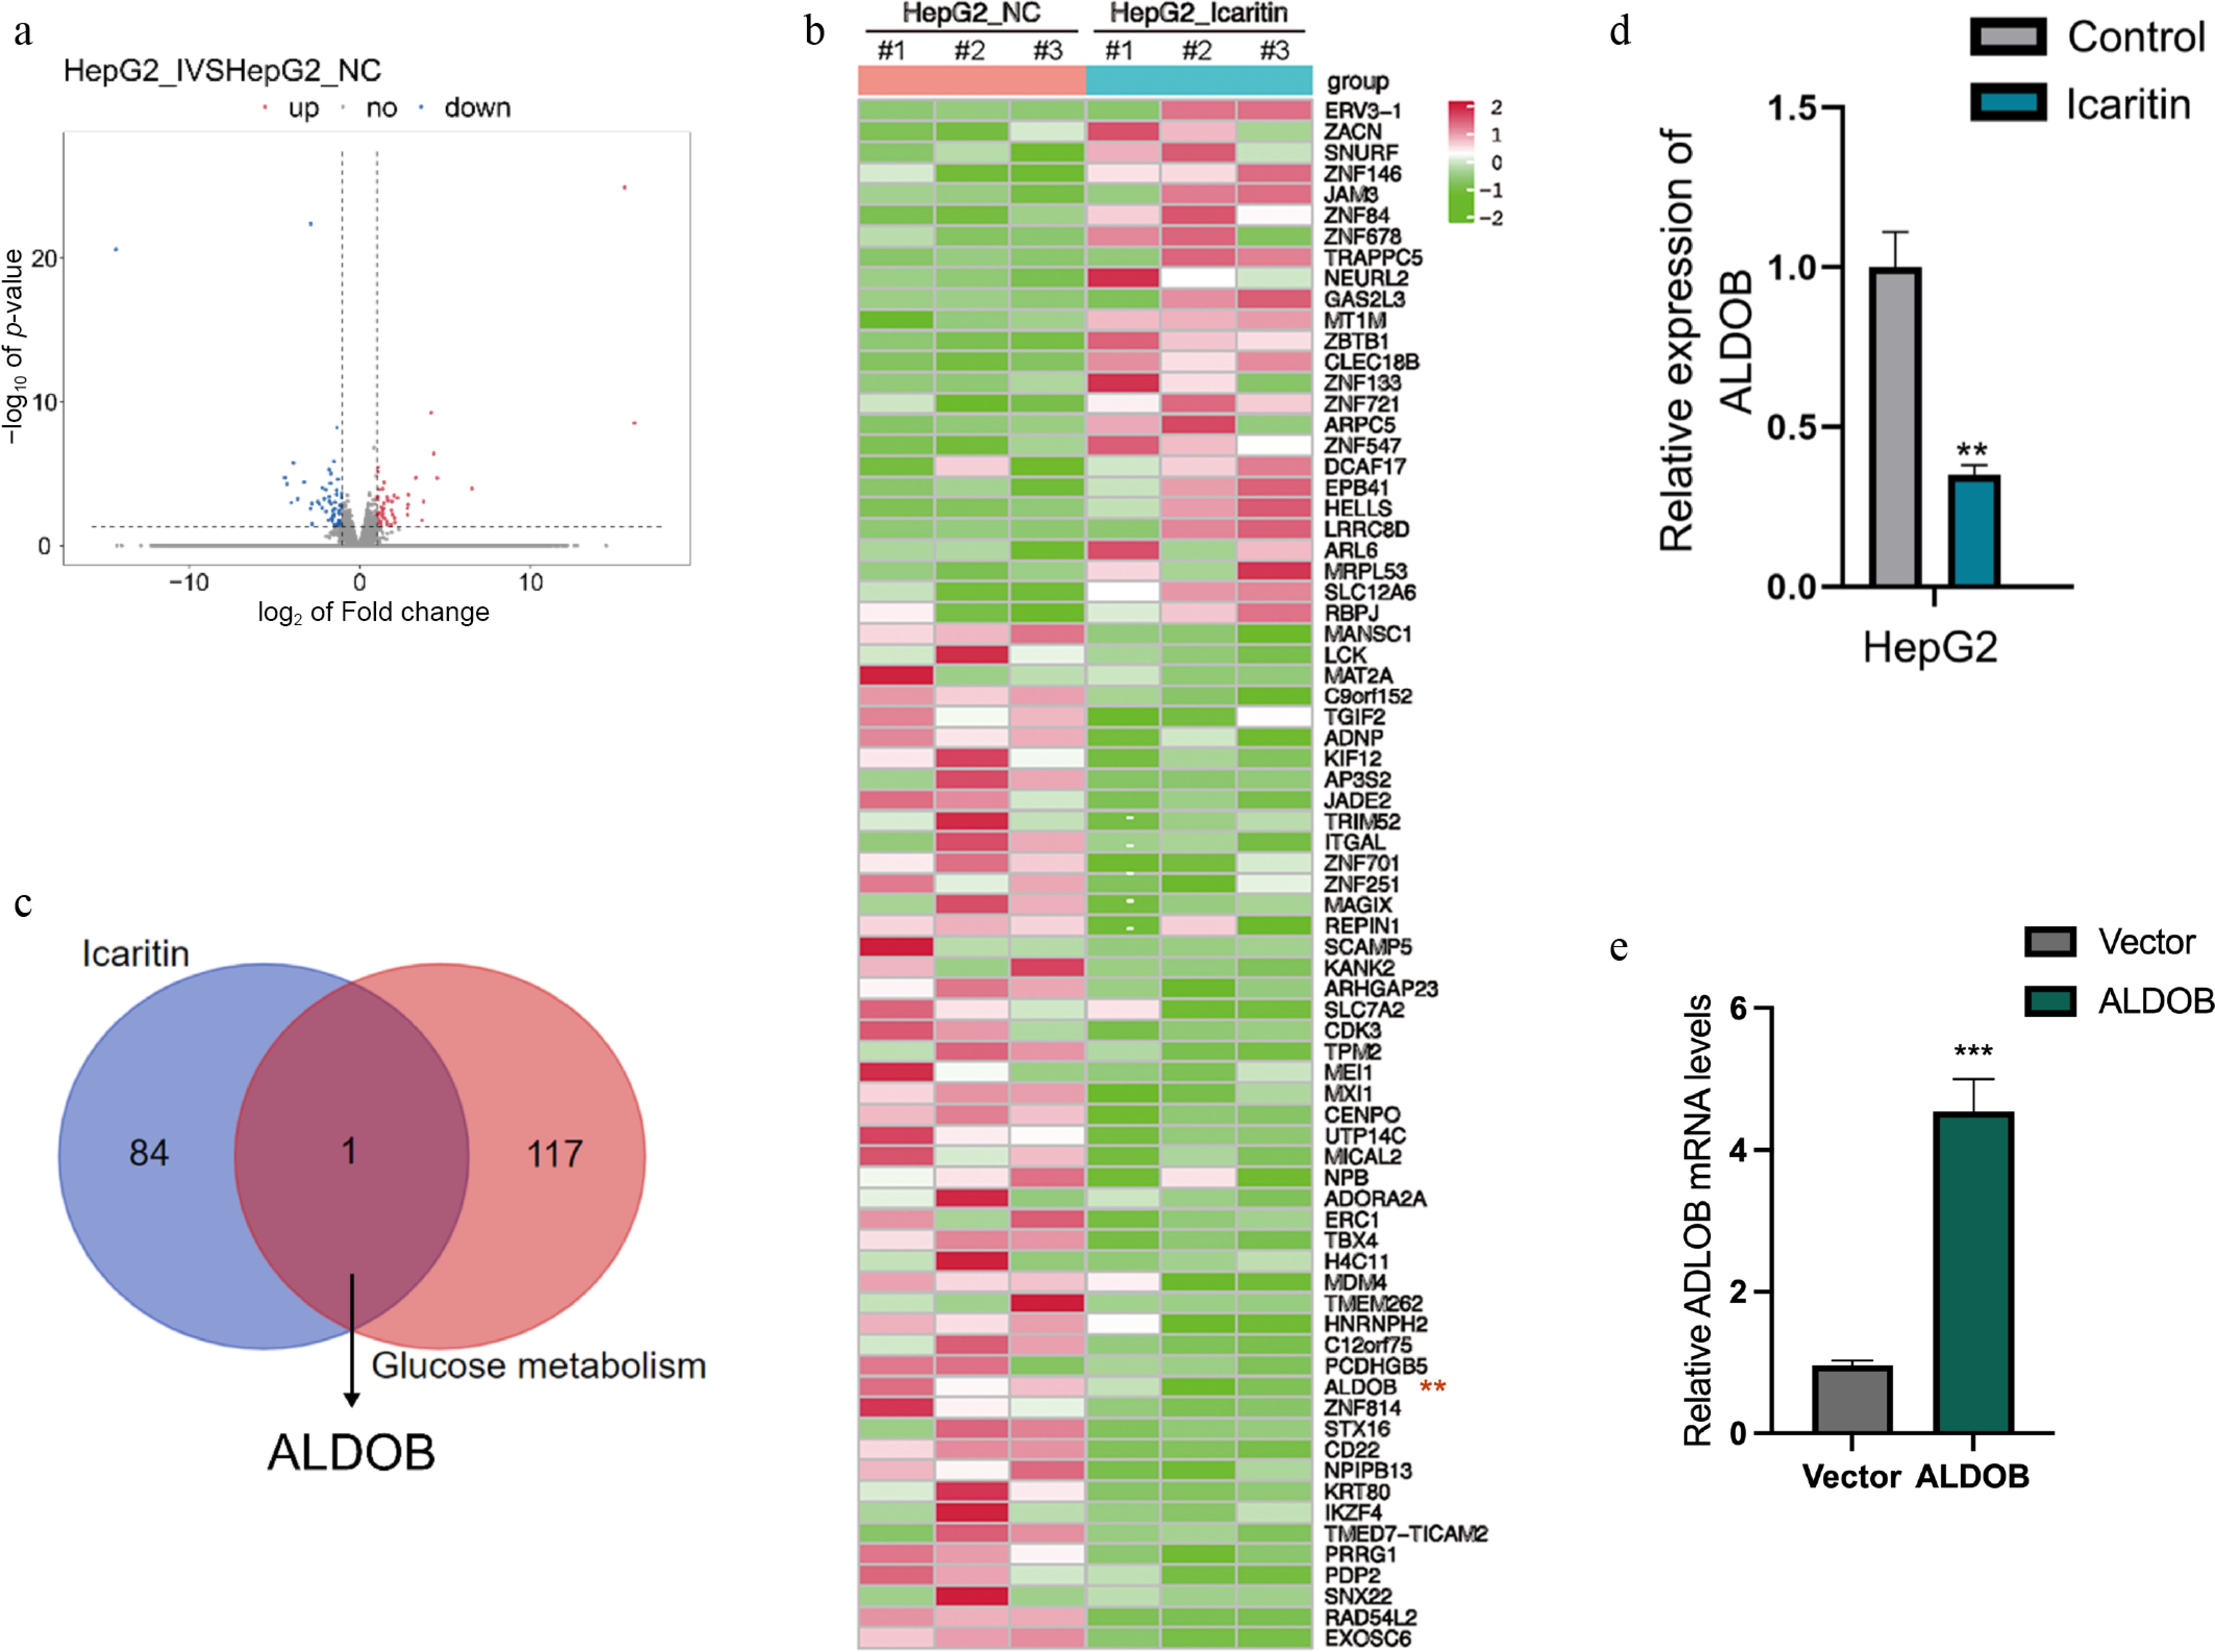
Figure 1.
Identification of ALDOB as a glycolysis-related target downregulated by icaritin in HCC cells. (a) RNA-seq identification of differentially expressed genes (DEGs) in HCC cells treated with or without icaritin (b) Identification of DEGs, with 49 downregulated and 25 upregulated genes. (c) Screening of downregulated DEGs for glycolysis-associated genes identified ALDOB. (d) Icaritin significantly reduced ALDOB's mRNA expression as measured by qPCR. (e) Successful overexpression of ALDOB in HCC cells was verified by qPCR. * p < 0.05, ** p < 0.01, *** p < 0.001; n = 3.
-
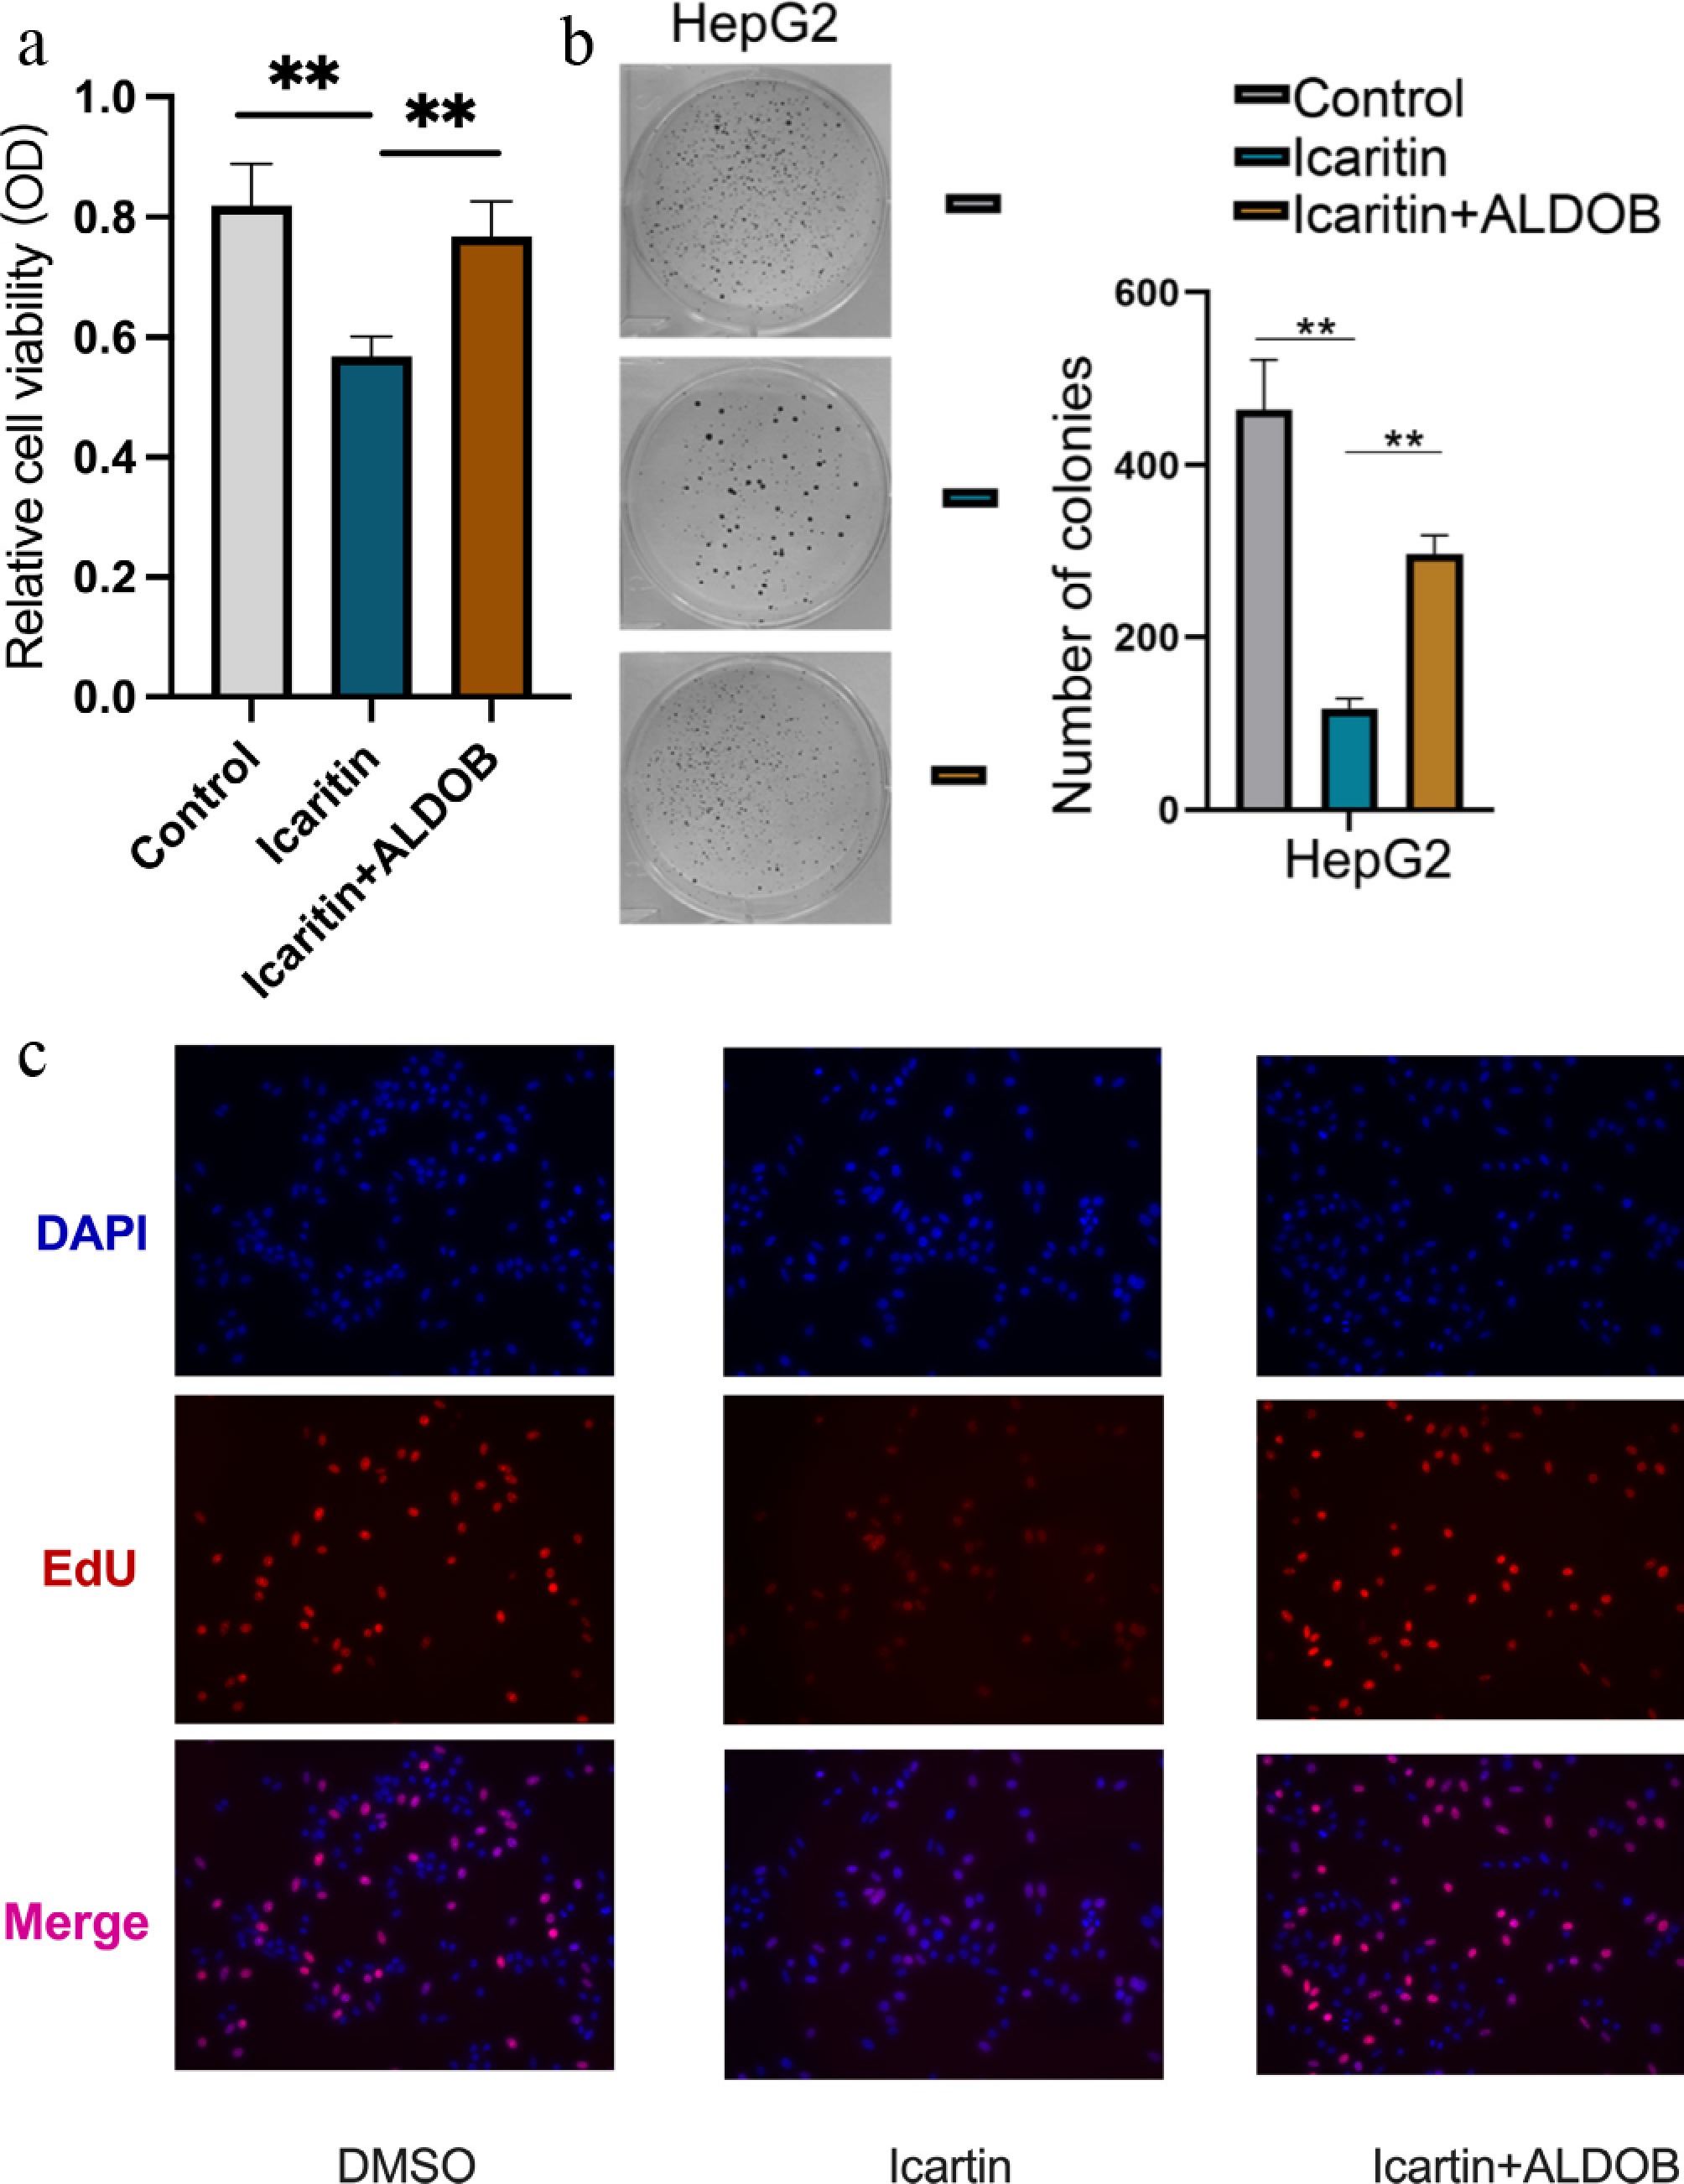
Figure 2.
Overexpression of ALDOB rescues icaritin-induced inhibition of HCC cell proliferation. (a) Cell viability was measured by an CCK-8 assay in HCC cells with or without ALDOB overexpression following treatment with the indicated concentrations of icaritin. (b) Representative images (left) and quantification (right) of colony formation assays under the same conditions. (c) The percentage of proliferating cells was assessed by an EdU assay. * p < 0.05, ** p < 0.01, *** p < 0.001; n = 6.
-
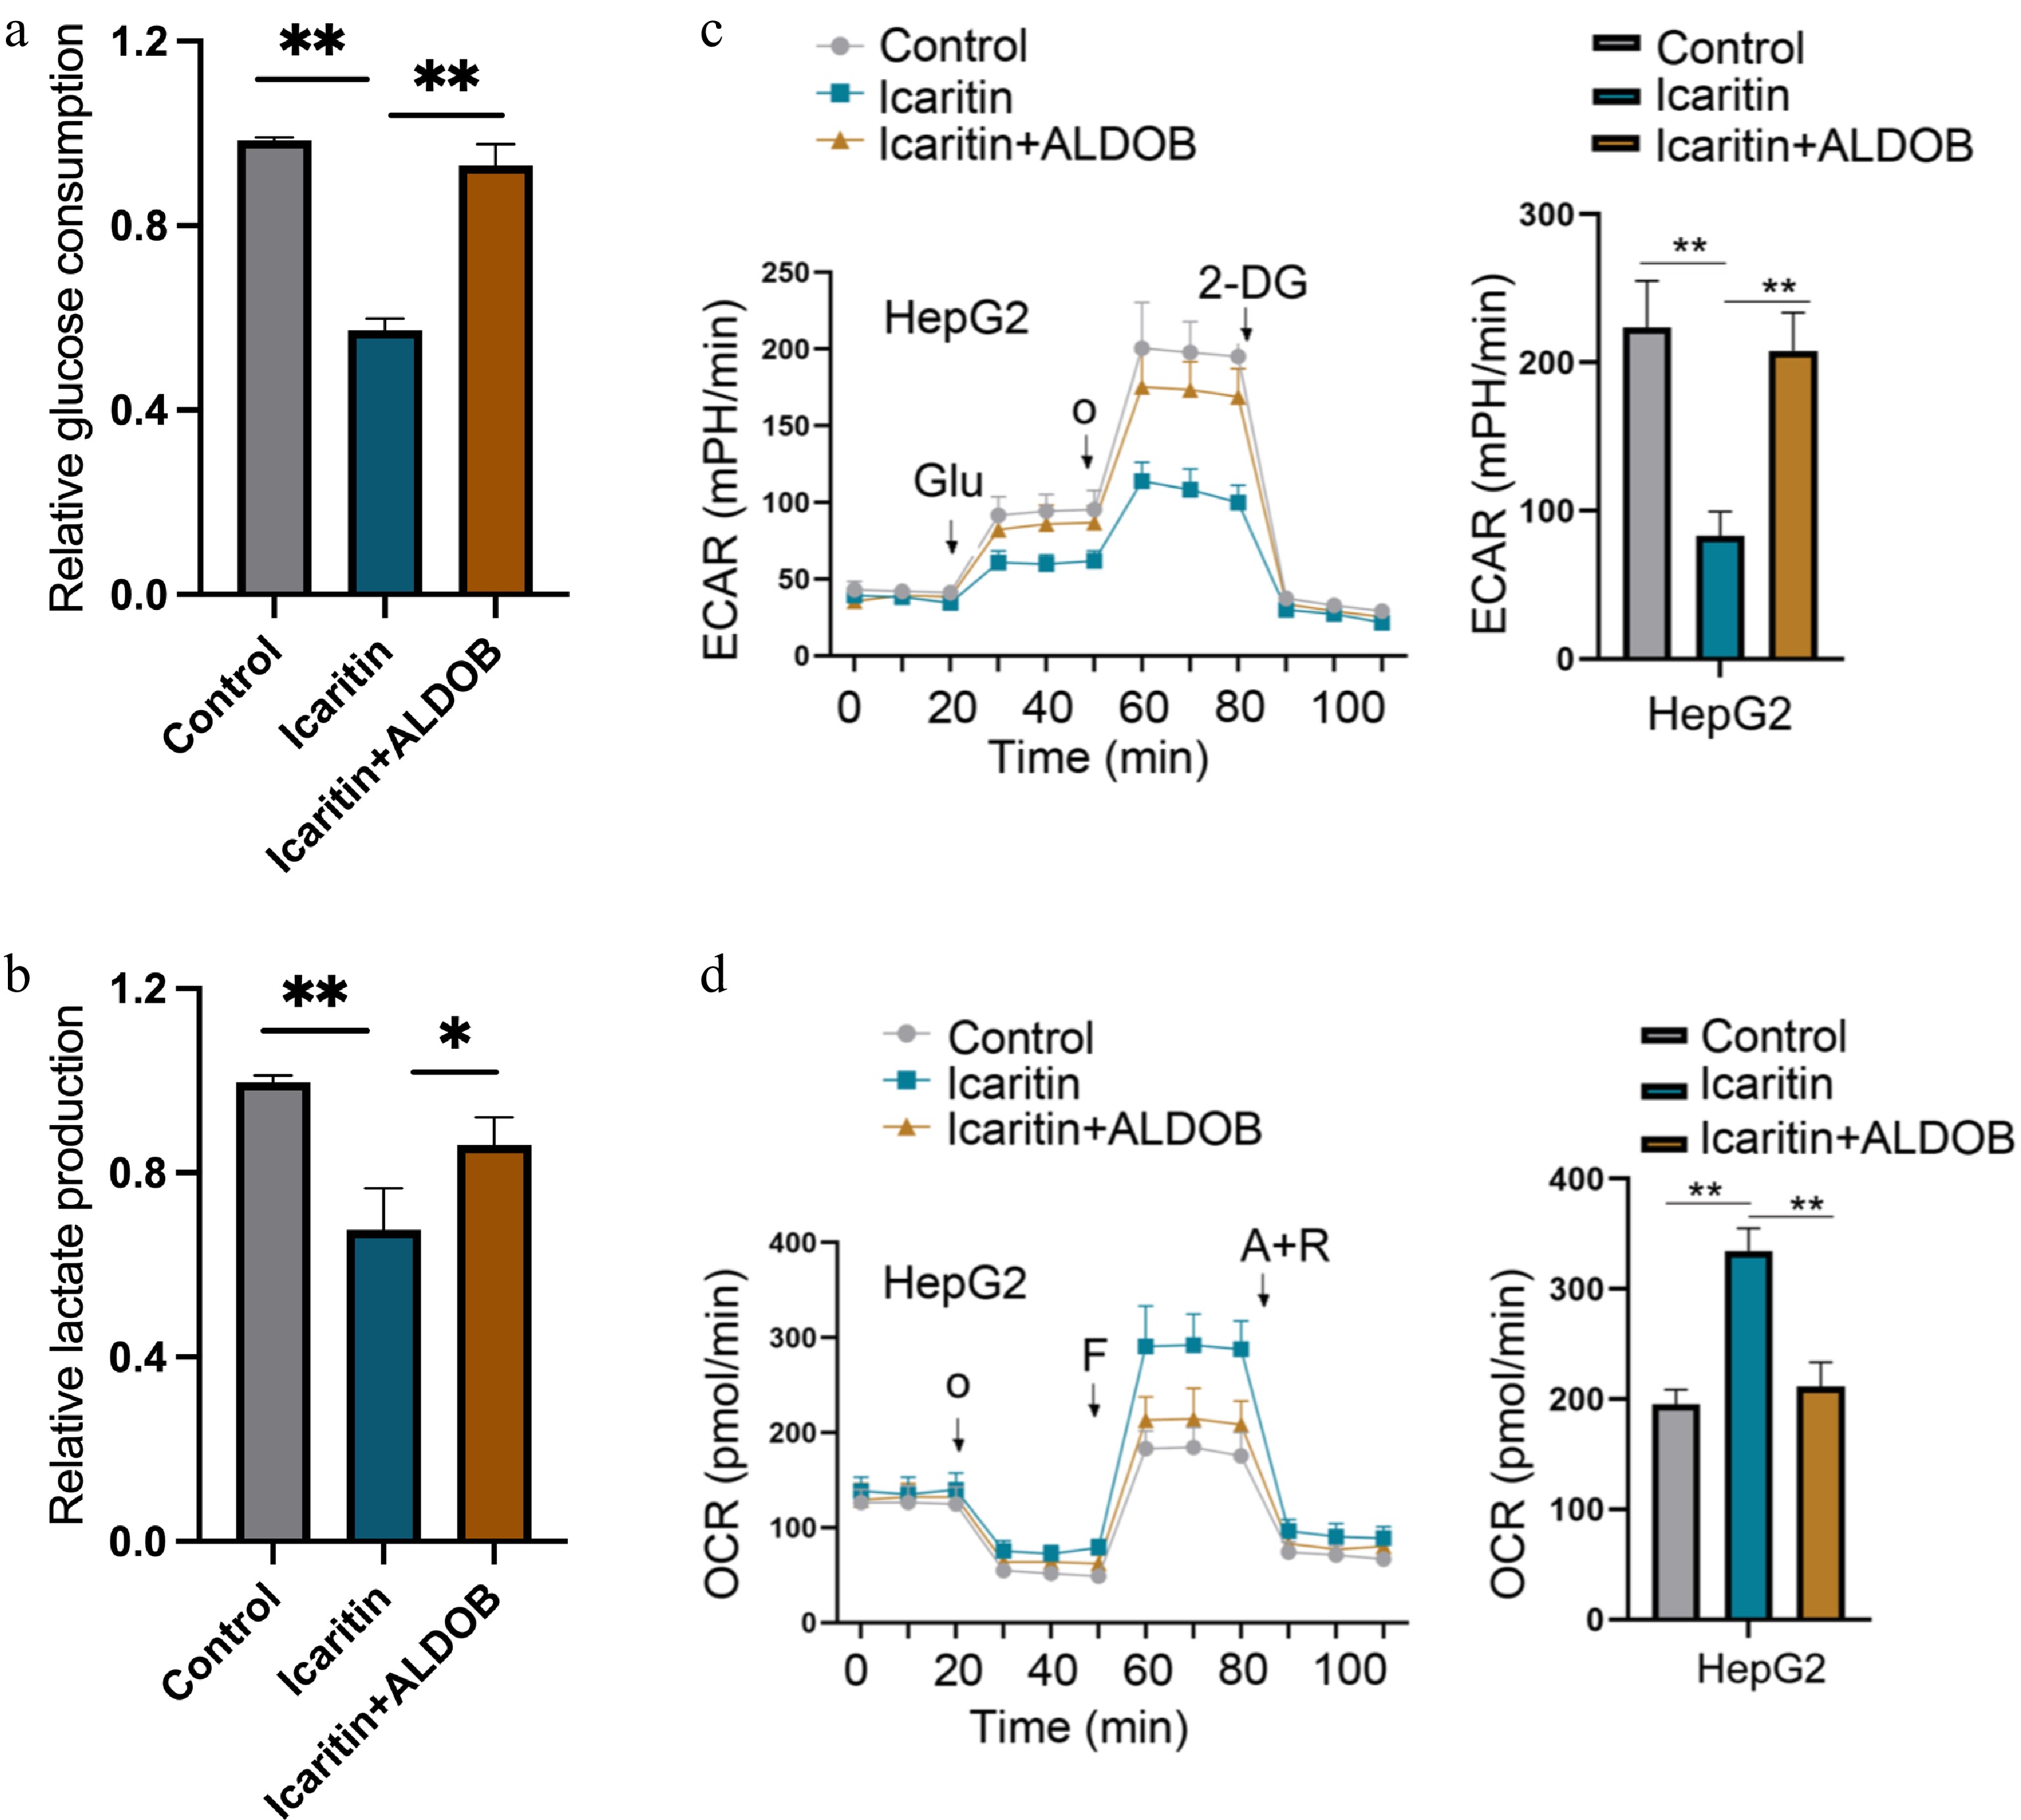
Figure 3.
ALDOB overexpression reverses the icaritin-induced suppression of glycolysis in HCC cells. (a) Glucose uptake was measured in control and ALDOB-overexpressing HCC cells treated with or without icaritin. (b) Intracellular lactate production was assessed under the same conditions. (c) Glycolytic function was analyzed by measuring the extracellular acidification rate (ECAR) using the Seahorse XF Analyzer. (d) Mitochondrial respiration was assessed by measuring the oxygen consumption rate (OCR) under the same conditions. * p < 0.05, ** p < 0.01, *** p < 0.001; n = 4.
-

Figure 4.
Icaritin suppresses STAT3 signaling in an ALDOB-dependent manner. (a) The mRNA expression level of STAT3 was determined by qPCR in HCC cells with or without ALDOB overexpression following icaritin treatment. (b) Representative Western blot images showing the protein levels of ALDOB, STAT3, phosphorylated STAT3 (p-STAT3), and the loading control Actin under the same conditions. * p < 0.05, ** p < 0.01, *** p < 0.001; n = 3.
-
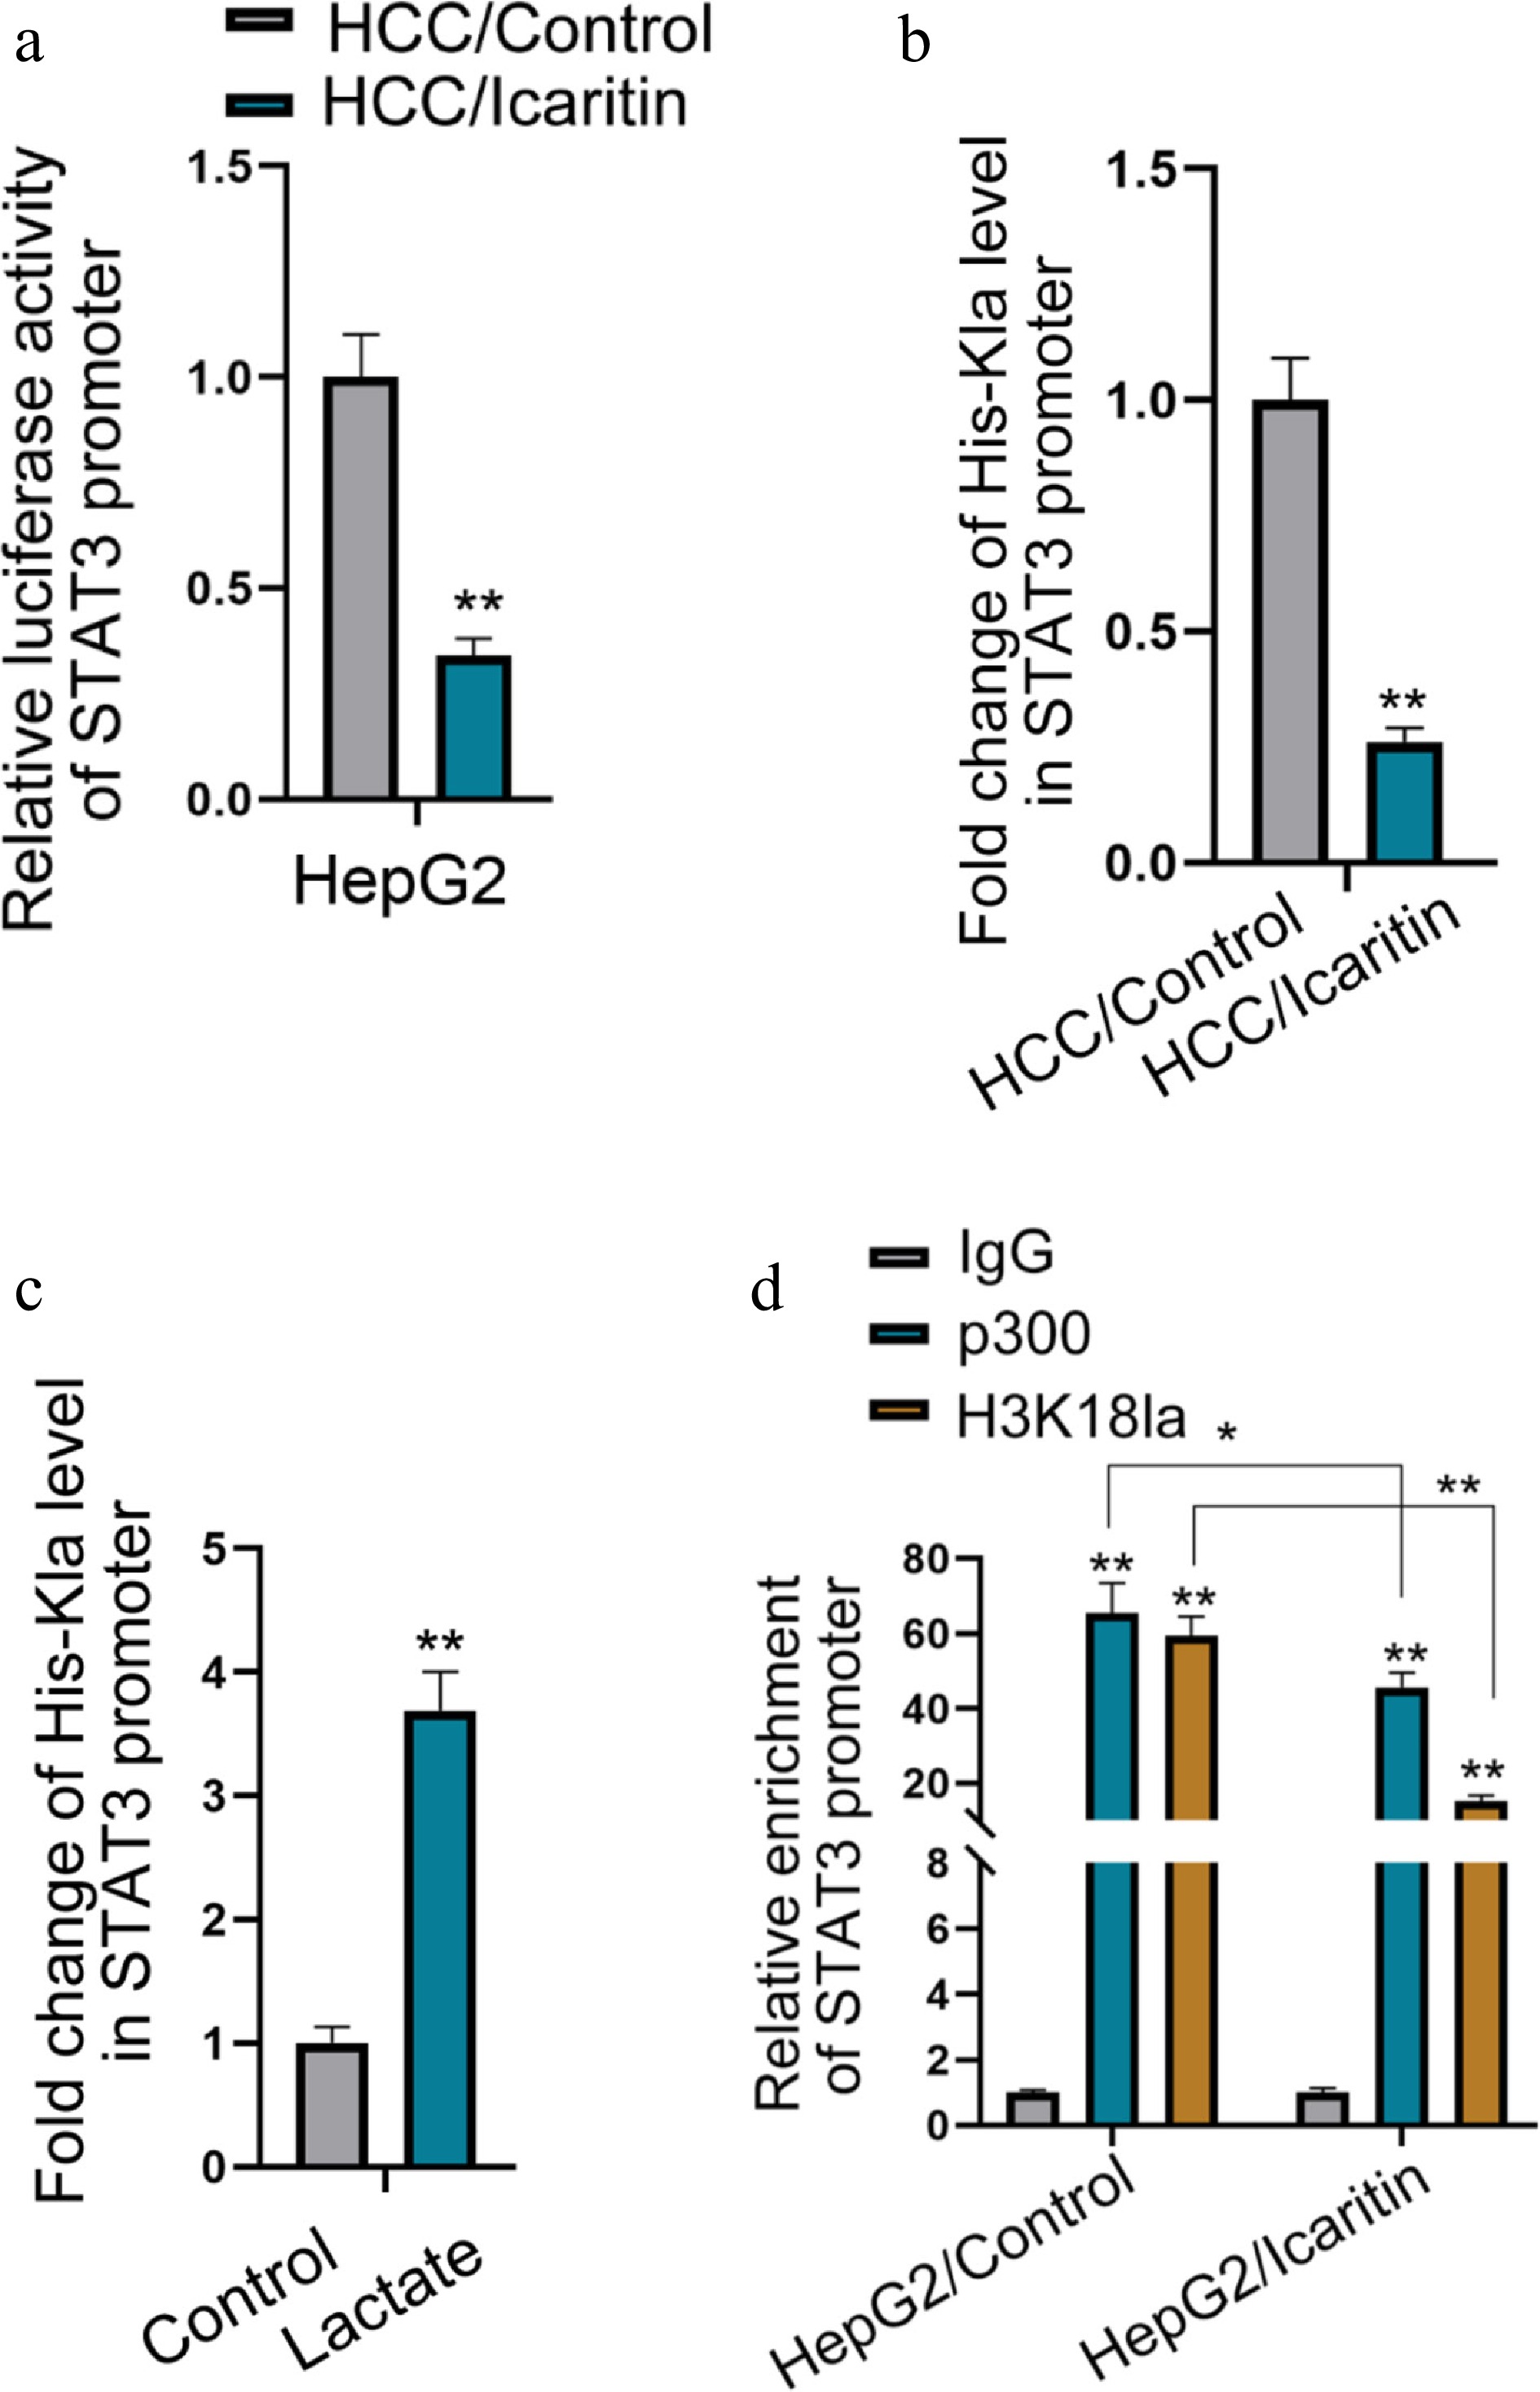
Figure 5.
Icaritin represses STAT3 transcription by modulating H3K18la modification on its promoter. (a) STAT3 promoter activity was measured by a dual-luciferase reporter assay in HCC cells treated with icaritin. (b) ChIP assay quantifying the enrichment of H3K18la on the STAT3 promoter after icaritin treatment. (c) ChIP assay showing the enrichment of H3K18la on the STAT3 promoter in cells treated with icaritin in the presence or absence of exogenous sodium lactate. (d) ChIP assays analyzing the binding of p300 and the level of H3K18la on the STAT3 promoter under icaritin treatment. * p < 0.05, ** p < 0.01; n = 3.
Figures
(5)
Tables
(0)