-
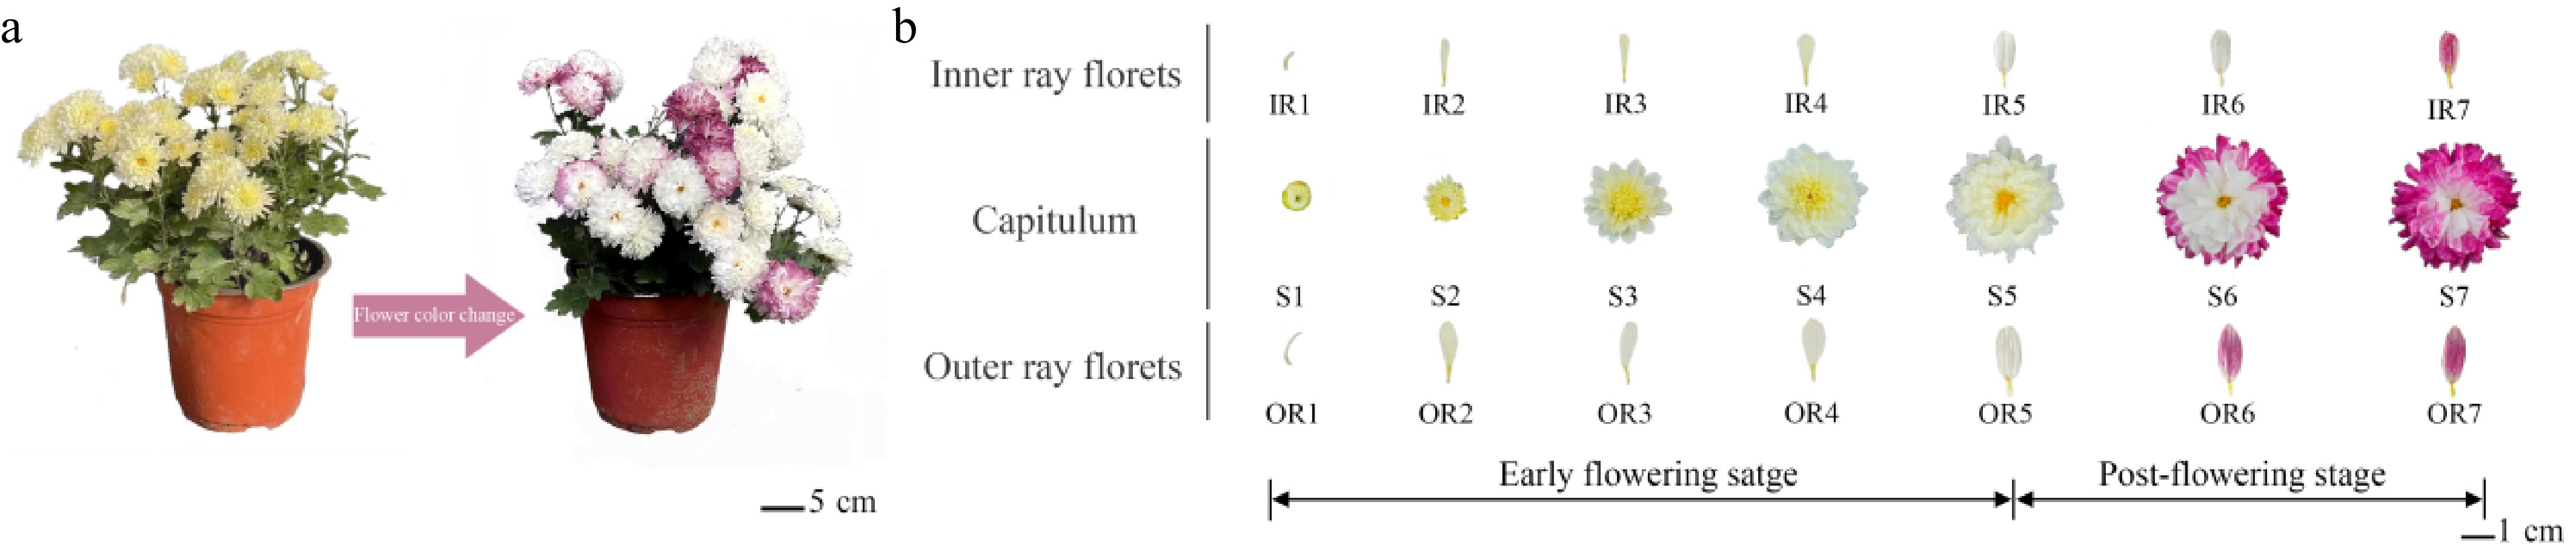
Figure 1.
The flower color change of cultivar chrysanthemum 'f23'. (a) The whole plants of 'f23' during flower phases (top view). (b) Flower color changes of inner and outer ray florets at different developmental stages in 'f23'.
-
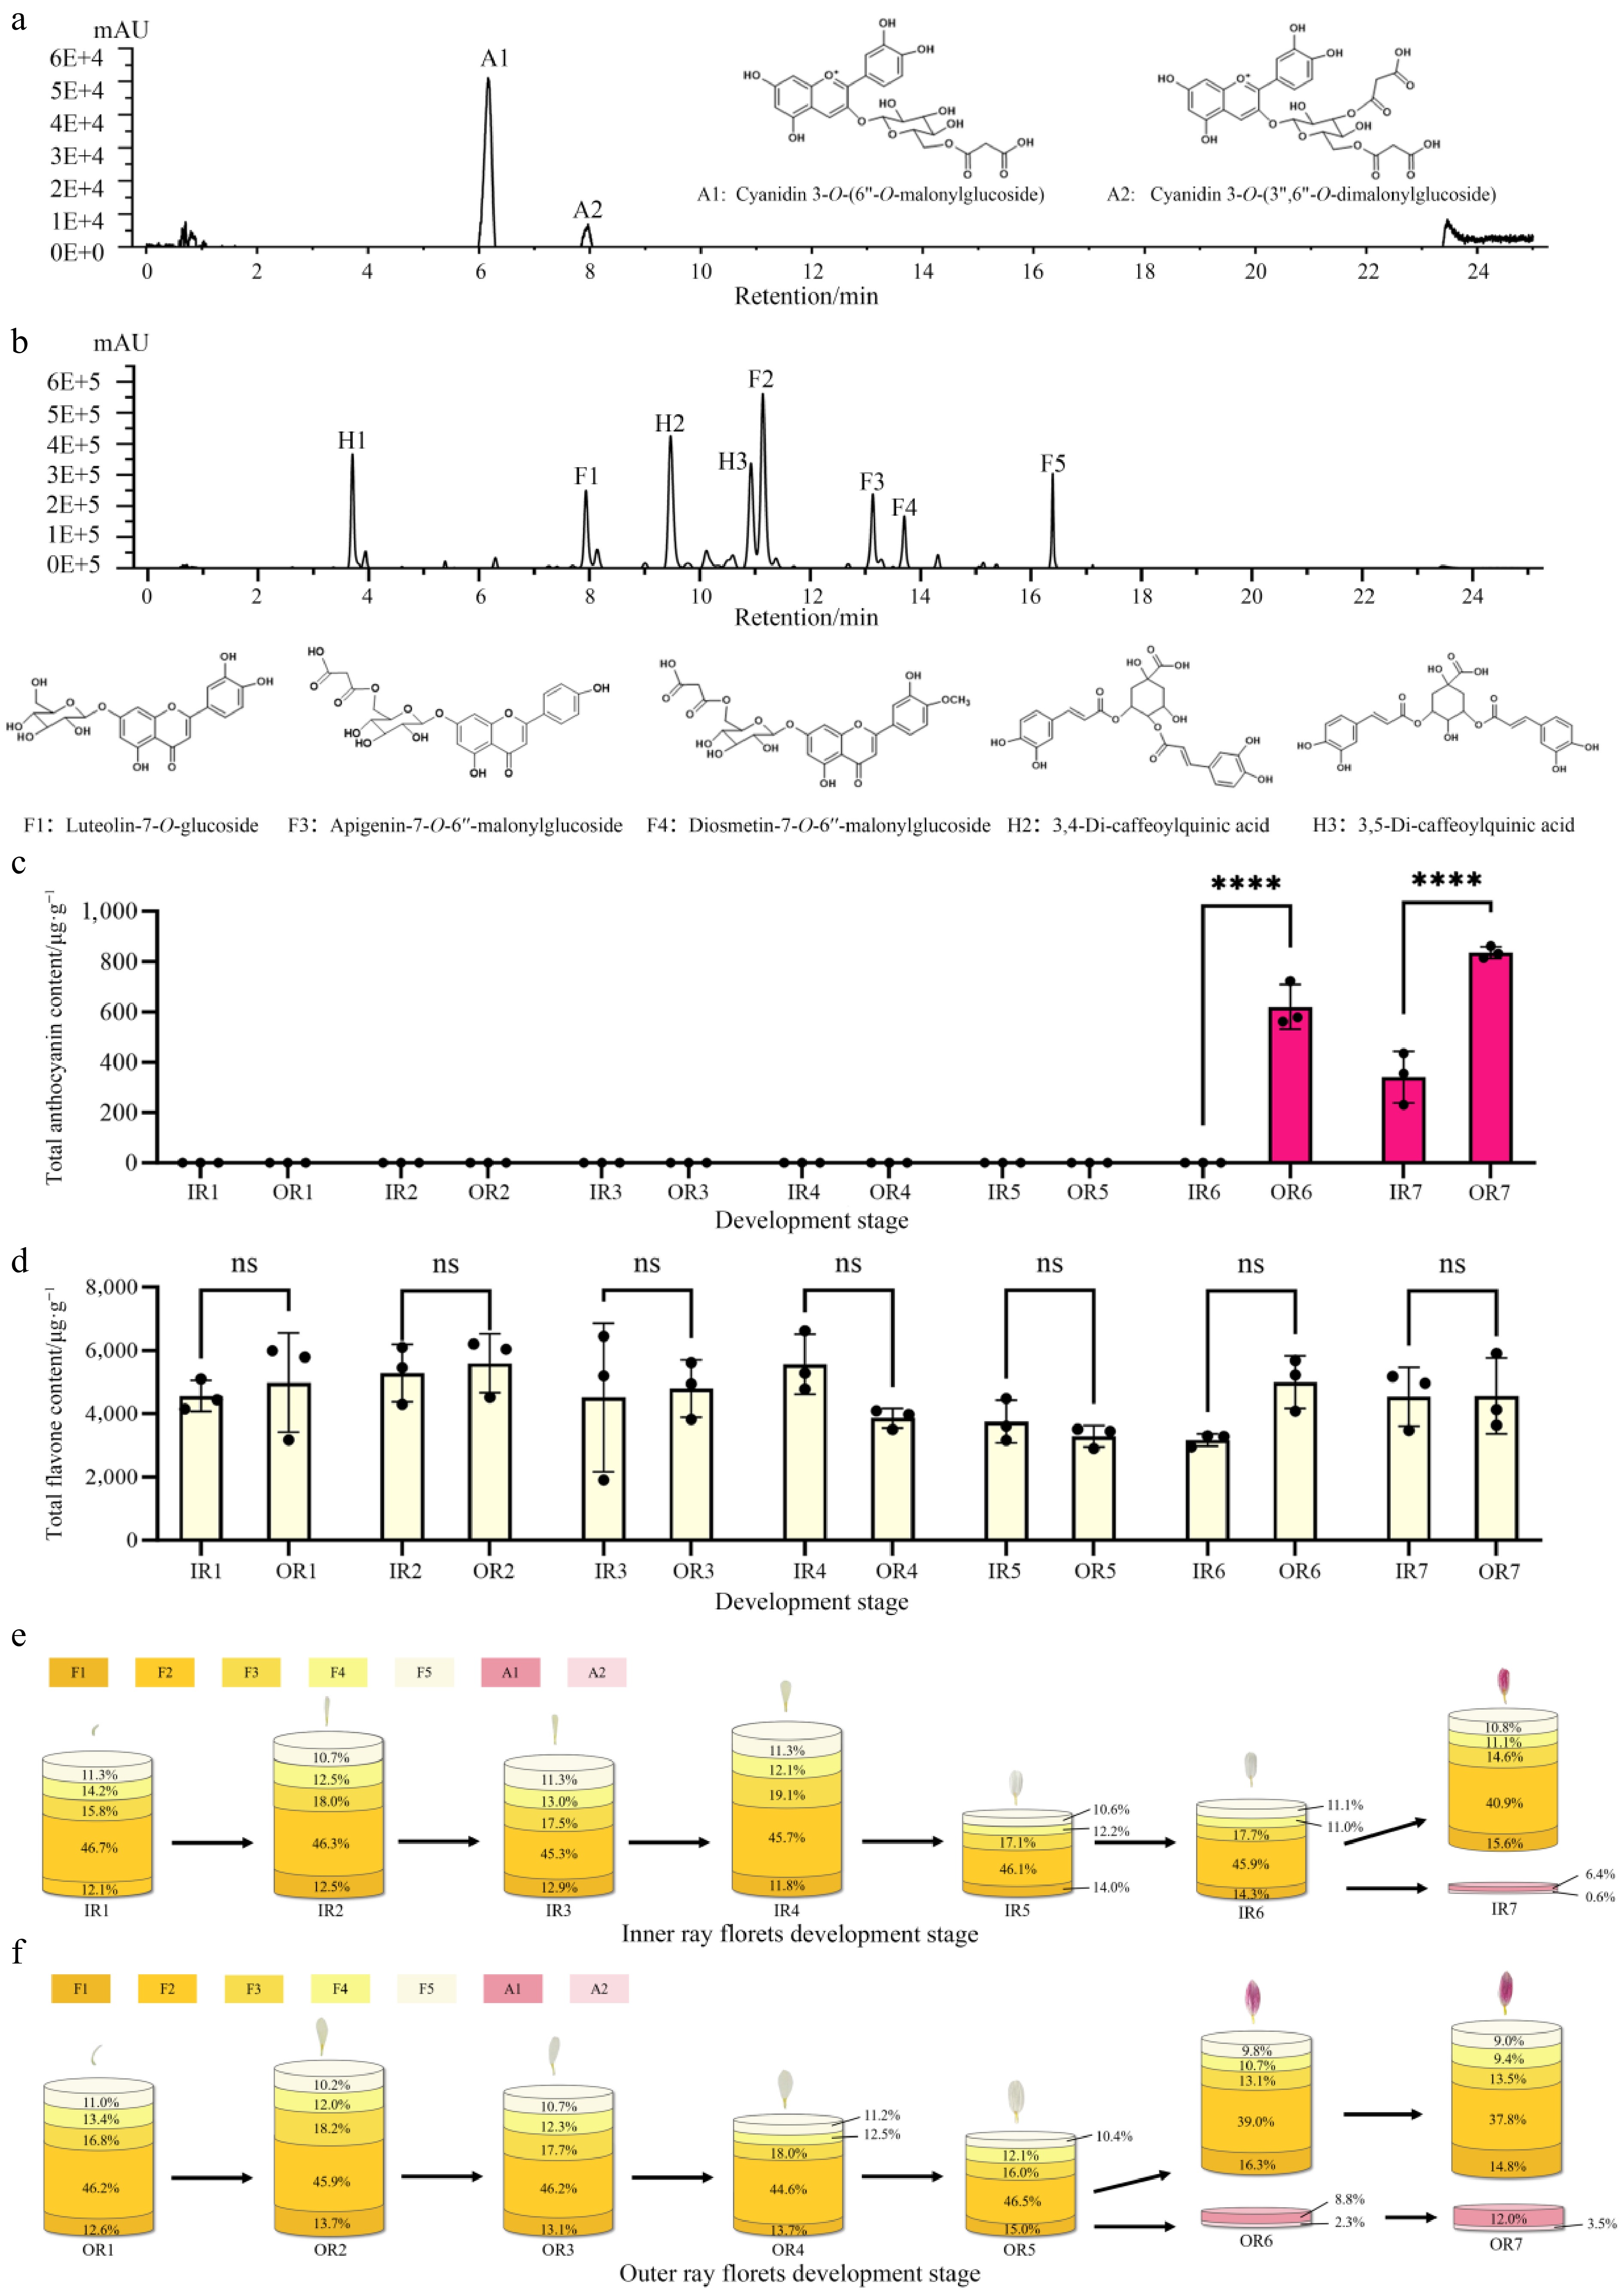
Figure 2.
Qualitative and quantitative analysis of ray floret pigments in 'f23'. (a) HPLC identification of anthocyanin glycoside components. (b) HPLC identification of accessory pigment components. (c) Anthocyanin content in inner and outer ray florets across seven capitulum developmental stages; **** p < 0.0001. (d) Total flavonoid content in inner and outer ray florets across seven capitulum developmental stages, ns = no significant difference. (e) Metabolic flux of anthocyanin and flavonoid contents in inner ray florets across seven stages. (f) Metabolic flux of anthocyanin and flavonoid contents in outer ray florets across seven stages.
-
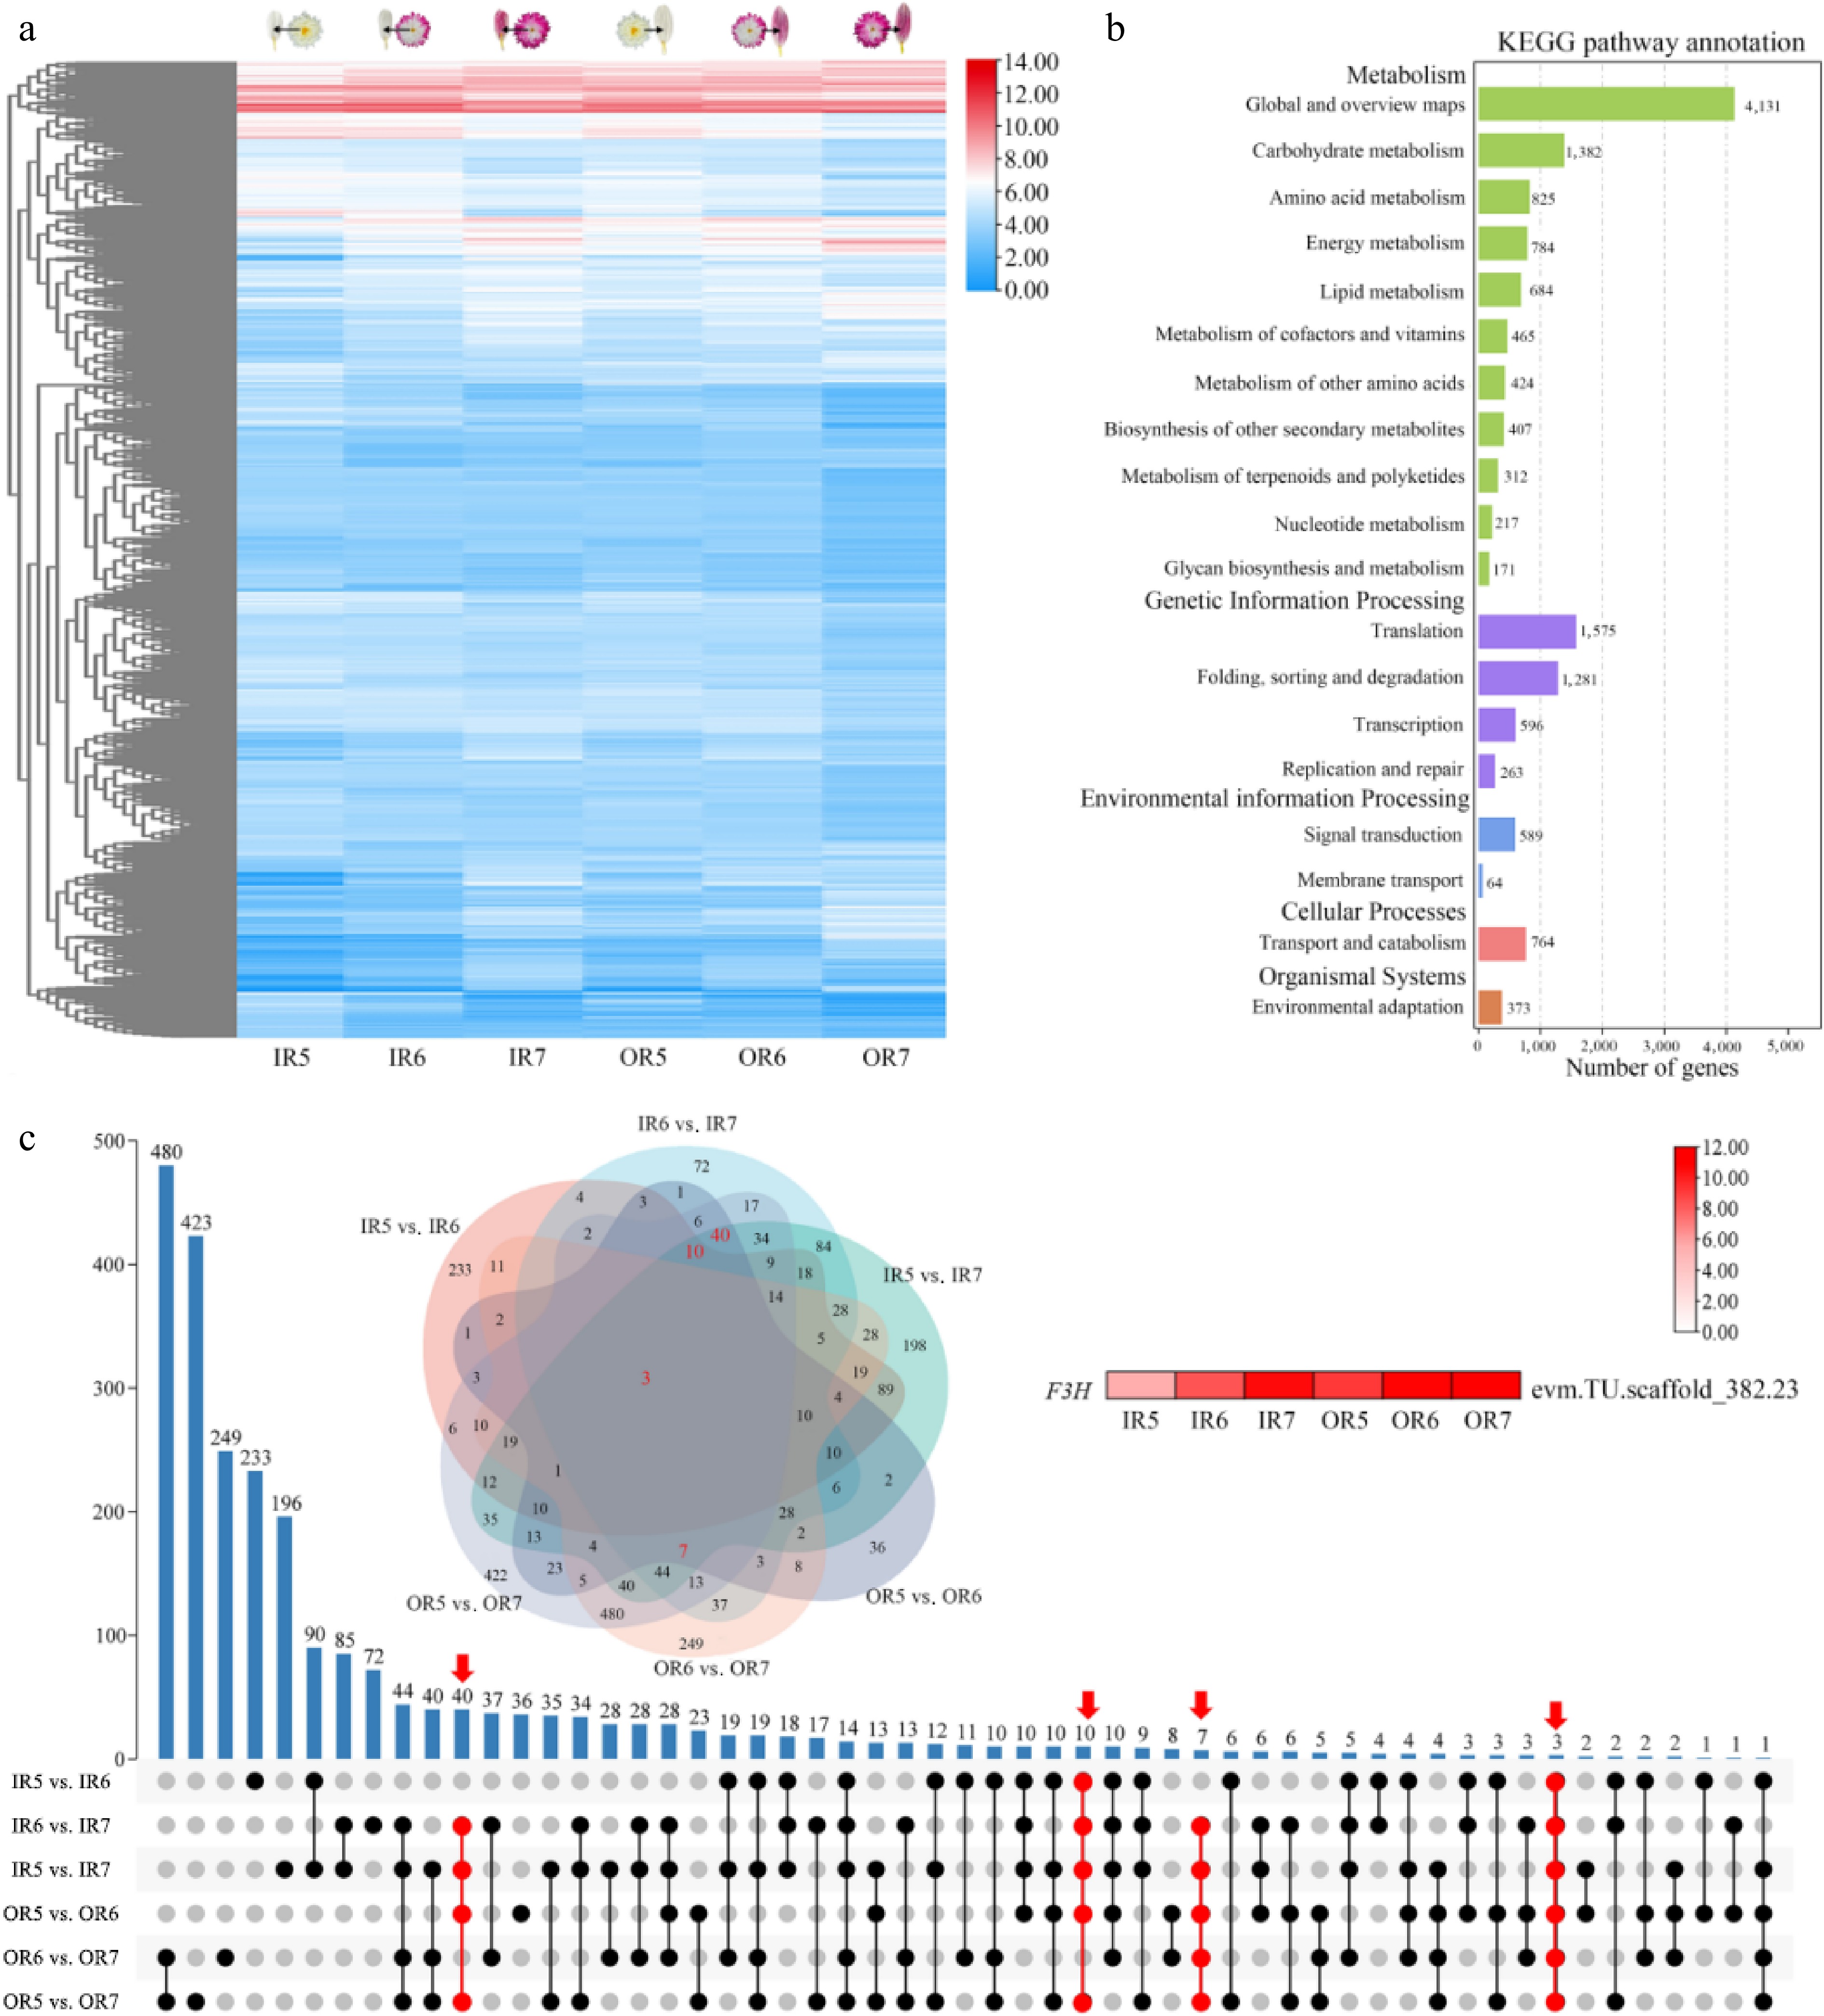
Figure 3.
Screening and functional enrichment analysis of DEGs in inner and outer ray florets during the post-flowering stage in 'f23'. (a) Expression heatmap of DEGs. (b) KEGG enrichment analysis of DEGs. (c) UPSET plot of DEGs.
-
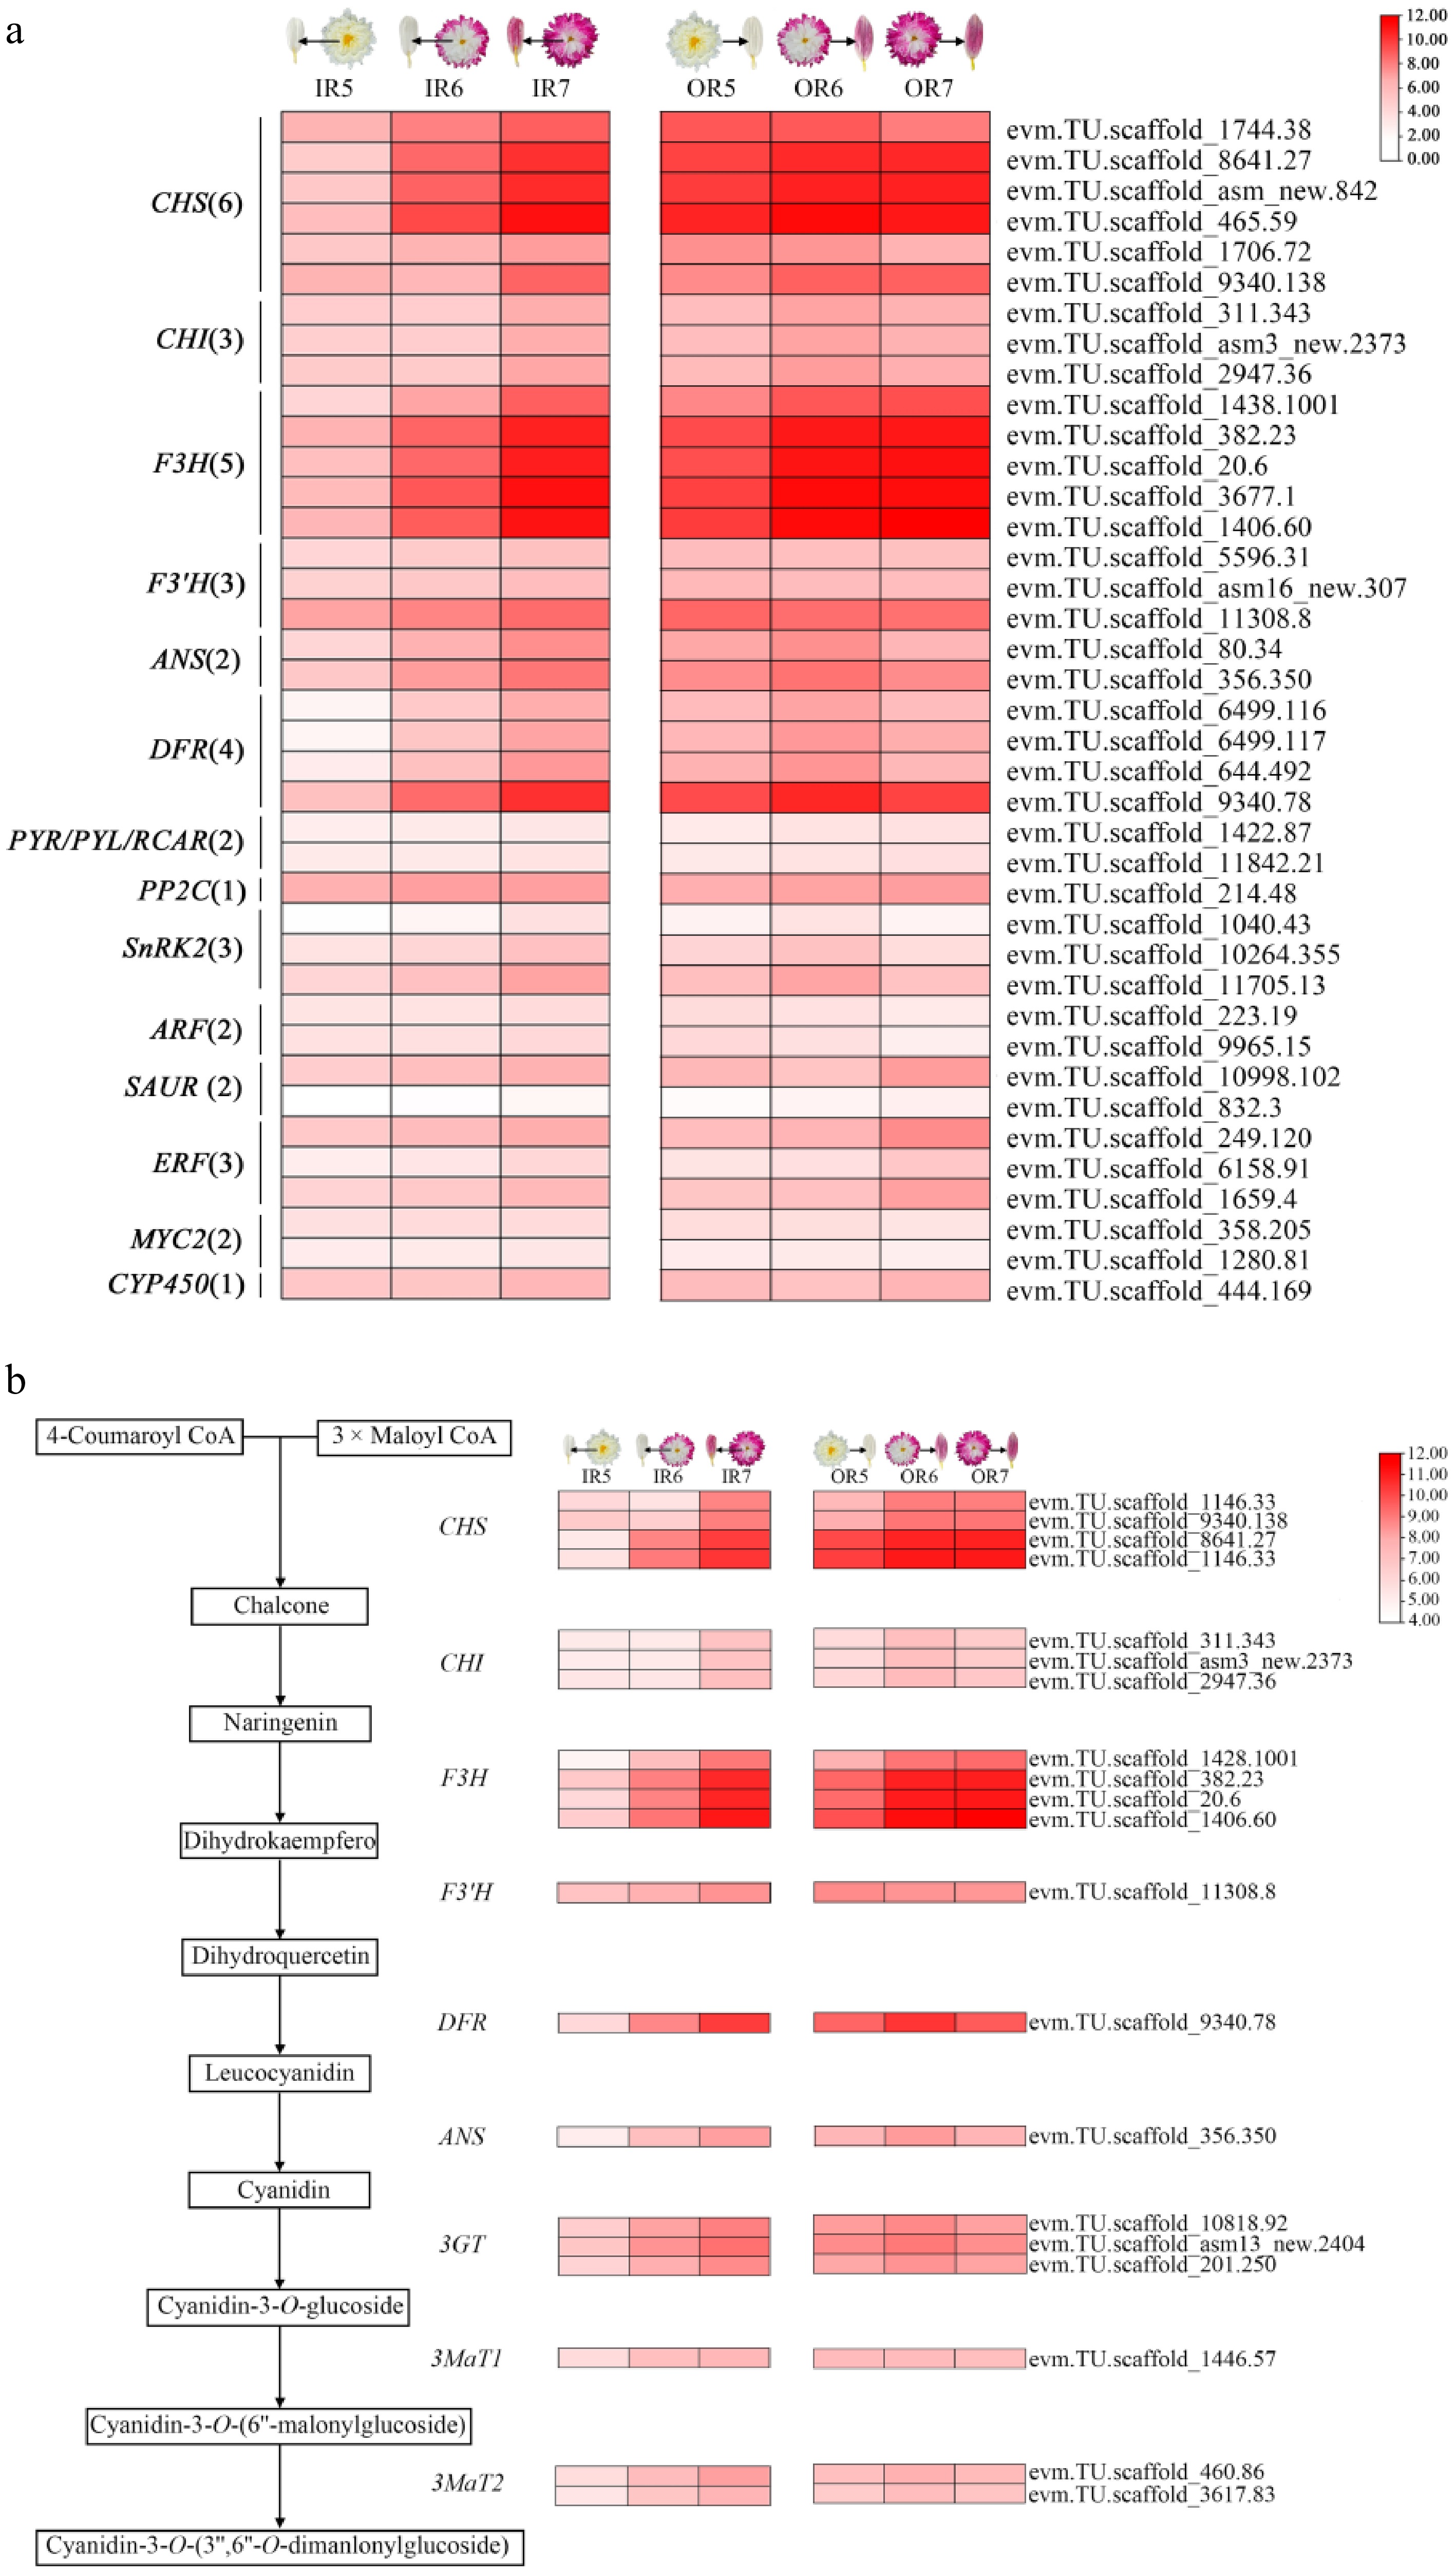
Figure 4.
Screening of DEGs in anthocyanin biosynthesis pathways in inner and outer ray florets during the post-flowering stage in 'f23'. (a) Screening of genes related to flavonoid biosynthesis and plant hormone signal transduction pathways. (b) Heatmap of DEGs in the anthocyanin biosynthesis pathway.
-
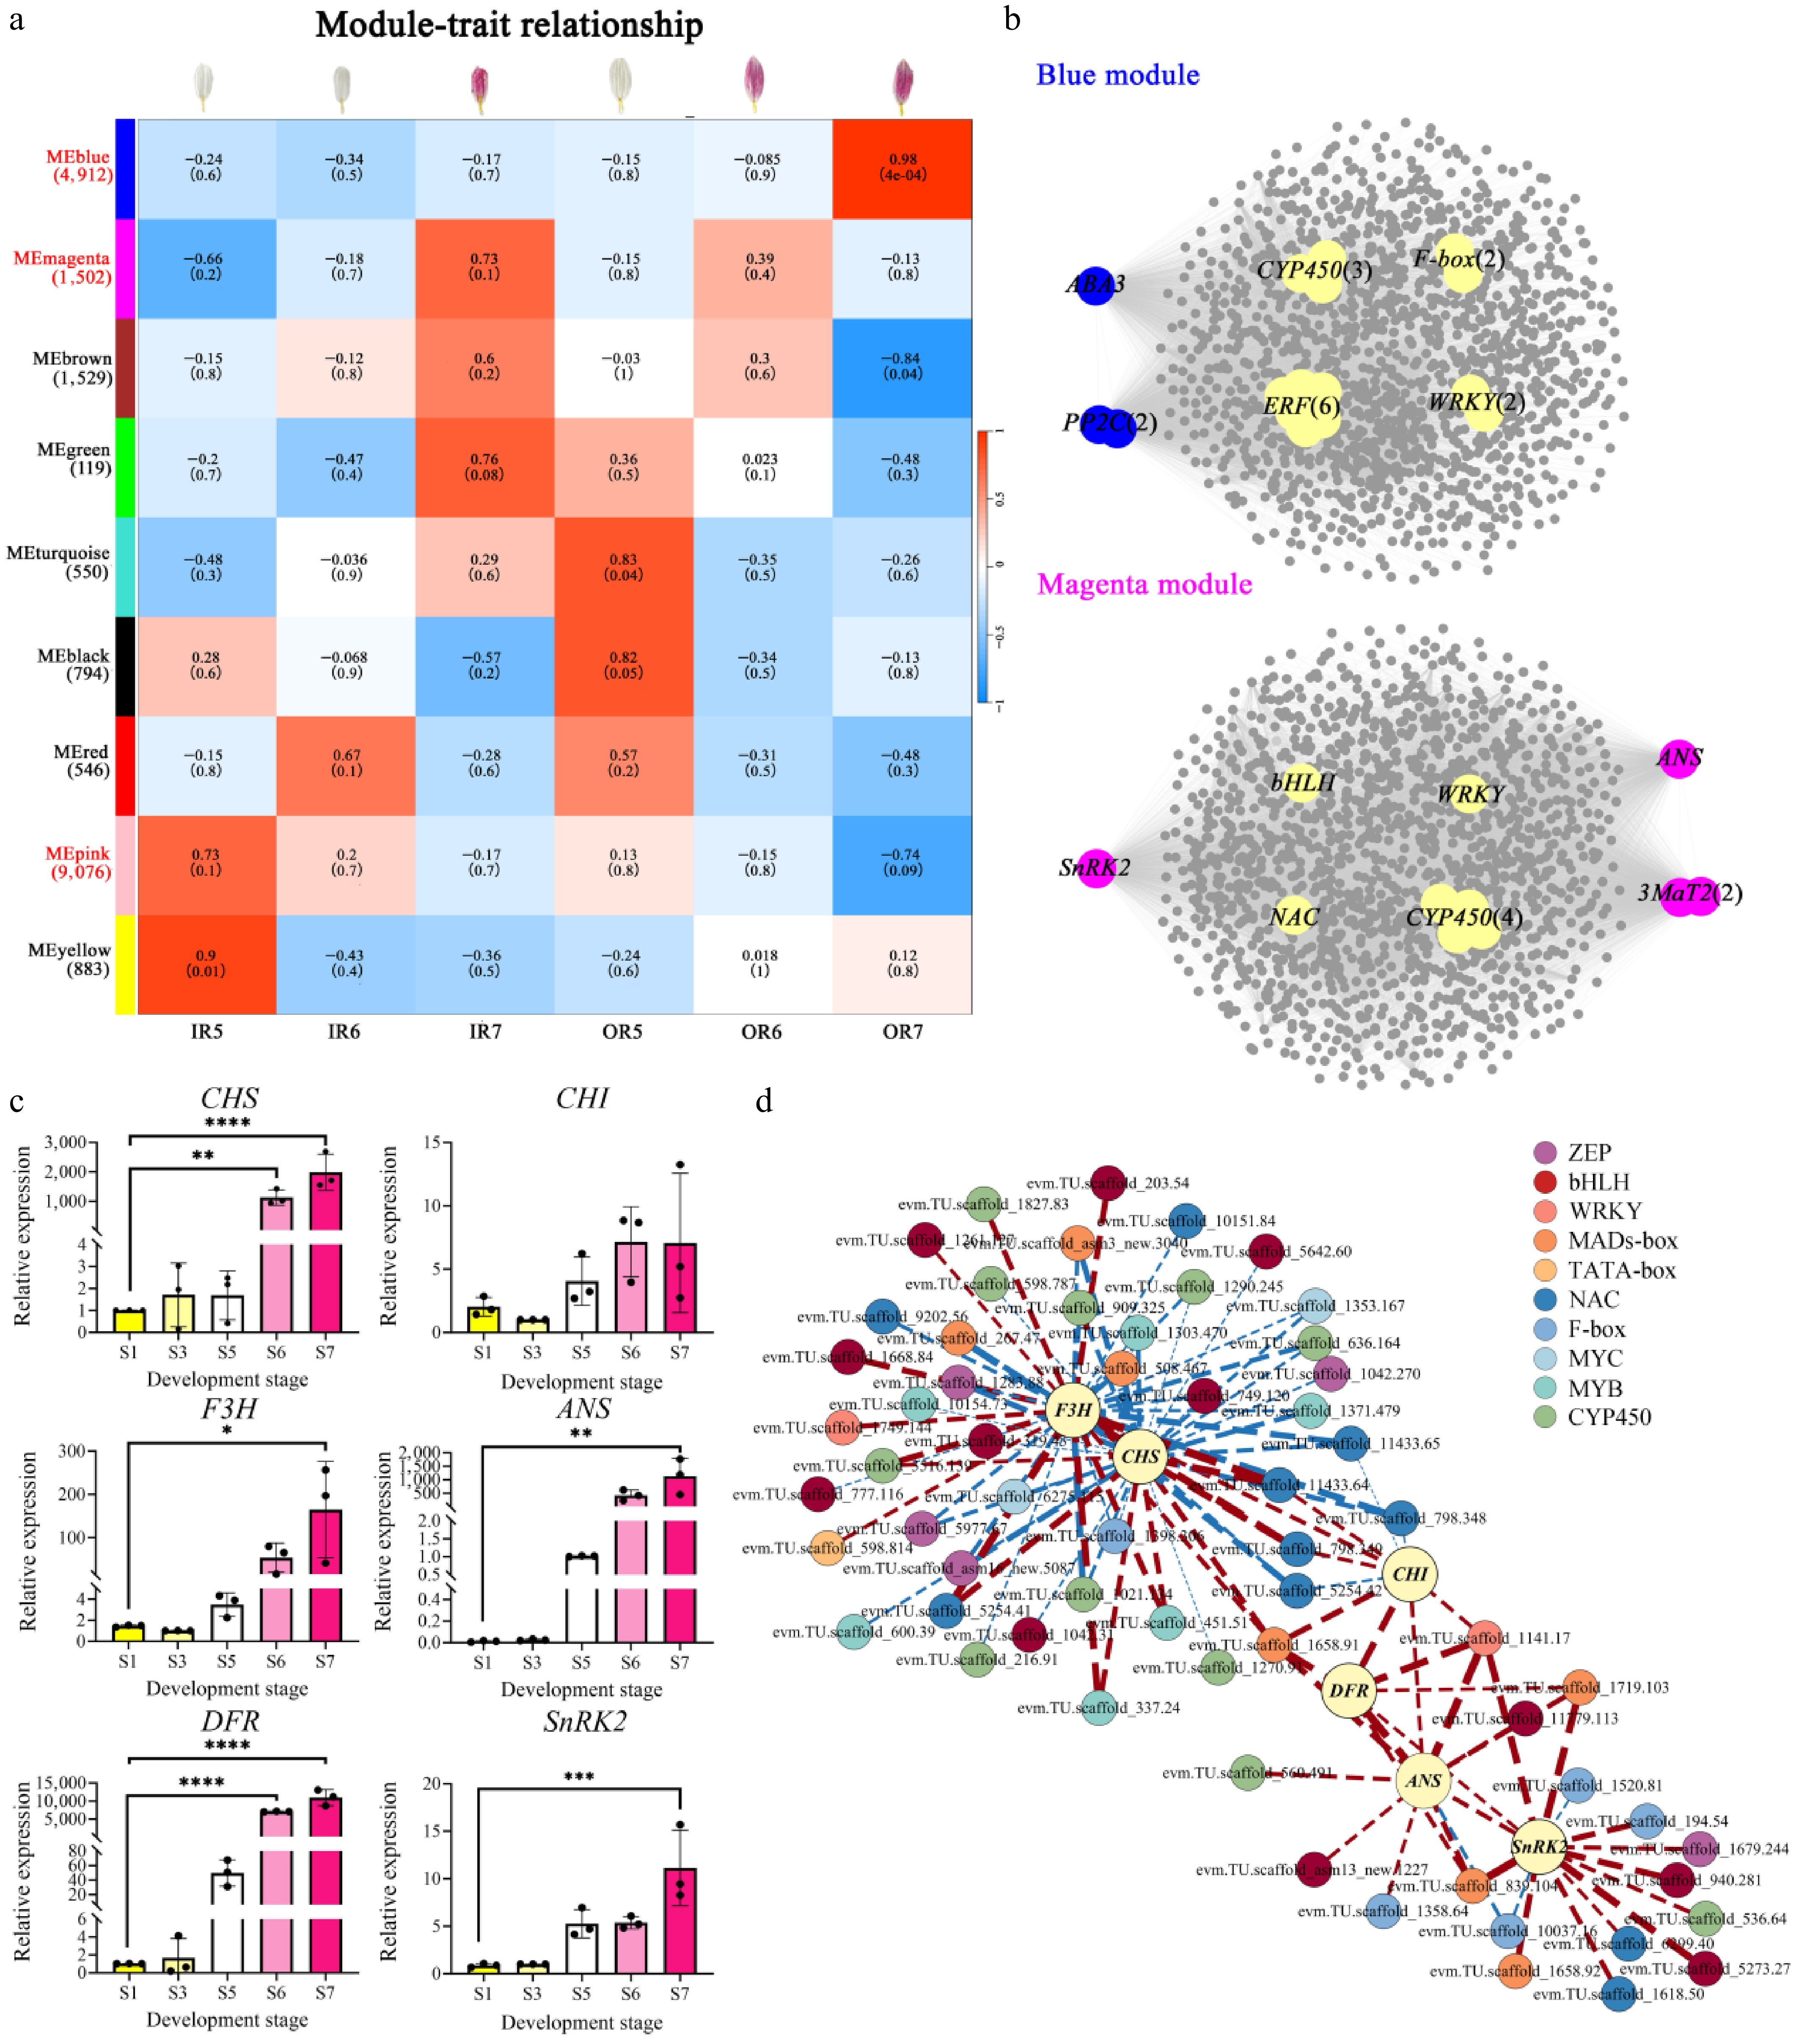
Figure 5.
WGCNA analysis of genes involved in flower color change during the post-flowering stage in 'f23'and validation of key gene expression patterns. (a) Module-trait correlation and corresponding p-values for WGCNA modules in inner and outer ray florets during the post-flowering stage. (b) Co-expression regulatory networks in the blue and magenta modules. (c) The validation of gene expression for key candidate genes by qRT-PCR, ** p < 0.01, *** p < 0.001, **** p < 0.0001. (d) The co-expression network analysis of TFs selected in WGCNA and the six genes screened in the ABA and anthocyanin biosynthesis pathways.
-
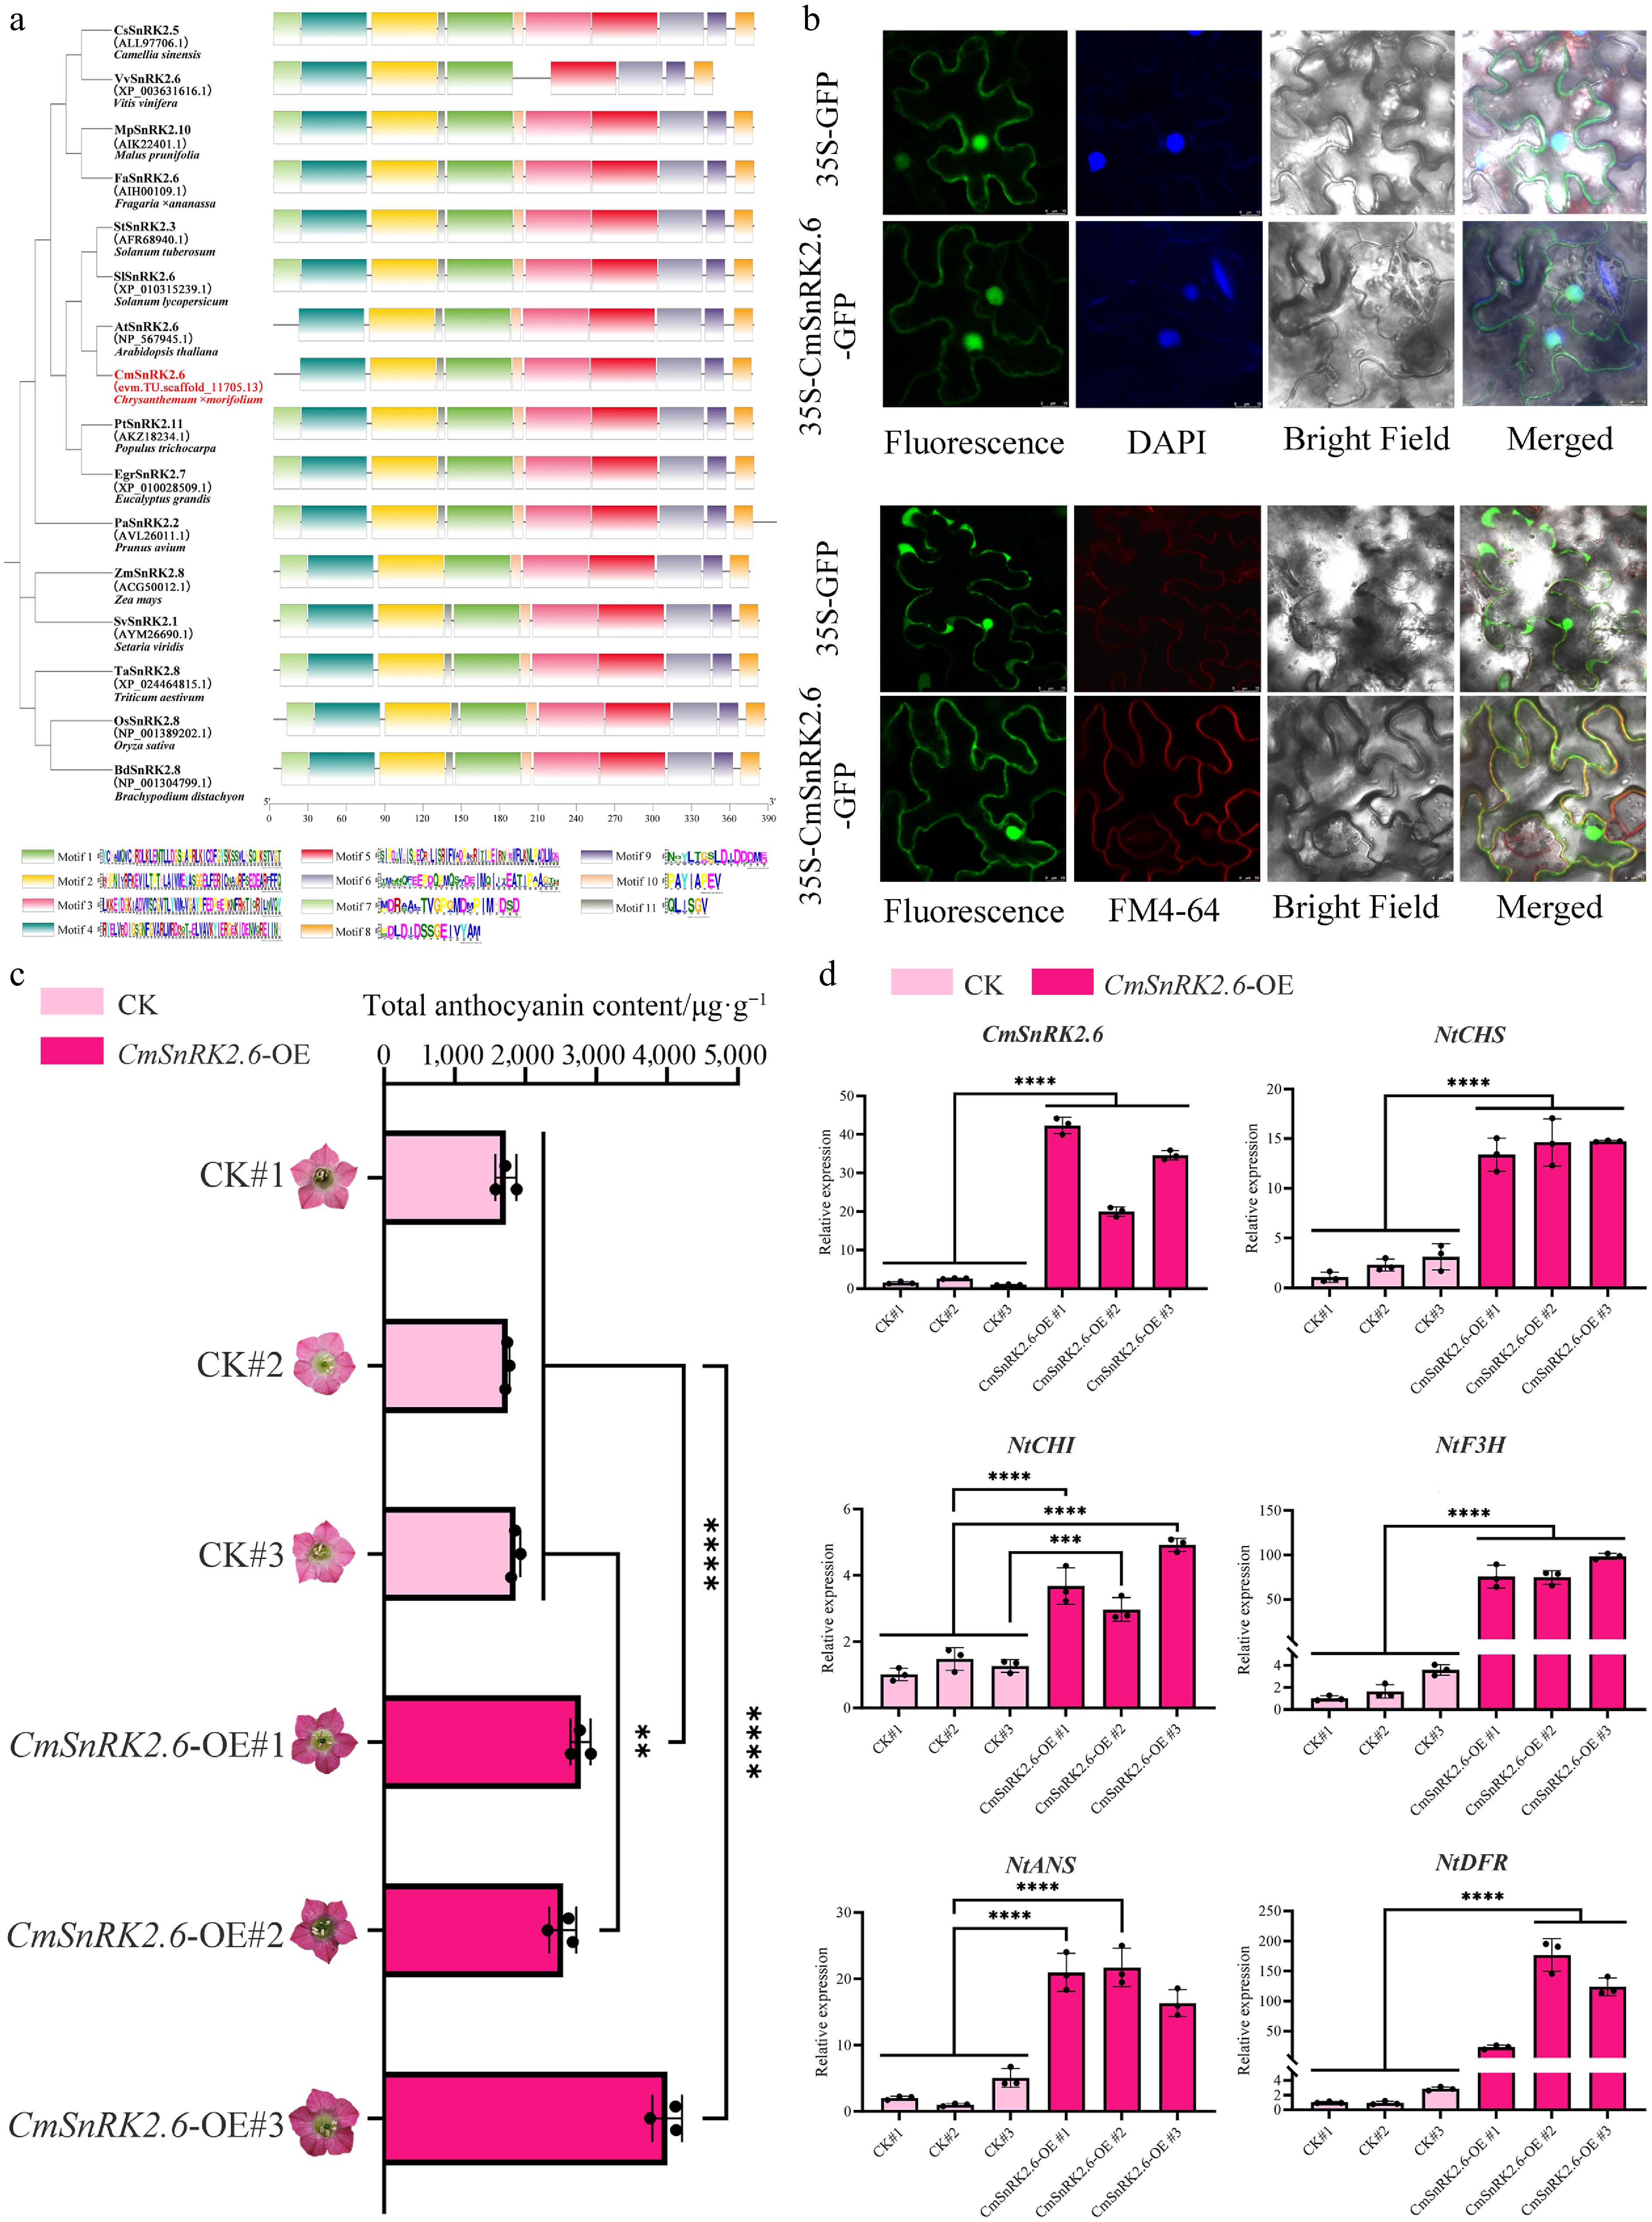
Figure 6.
Functional characterization of CmSnRK2.6 involved in anthocyanin biosynthesis. (a) Phylogenetic and conserved motif analysis of CmSnRK2.6 and homologous genes of AtSnRK2.6 from 14 species. (b) Subcellular localization analysis of CmSnRK2.6 in tobacco leaves. (c) Total anthocyanin content in CmSnRK2.6-overexpressing tobacco. (d) Expression pattern of CmSnRK2.6, CmbHLH2.1, and anthocyanin biosynthesis-related genes in transgenic tobacco.
-
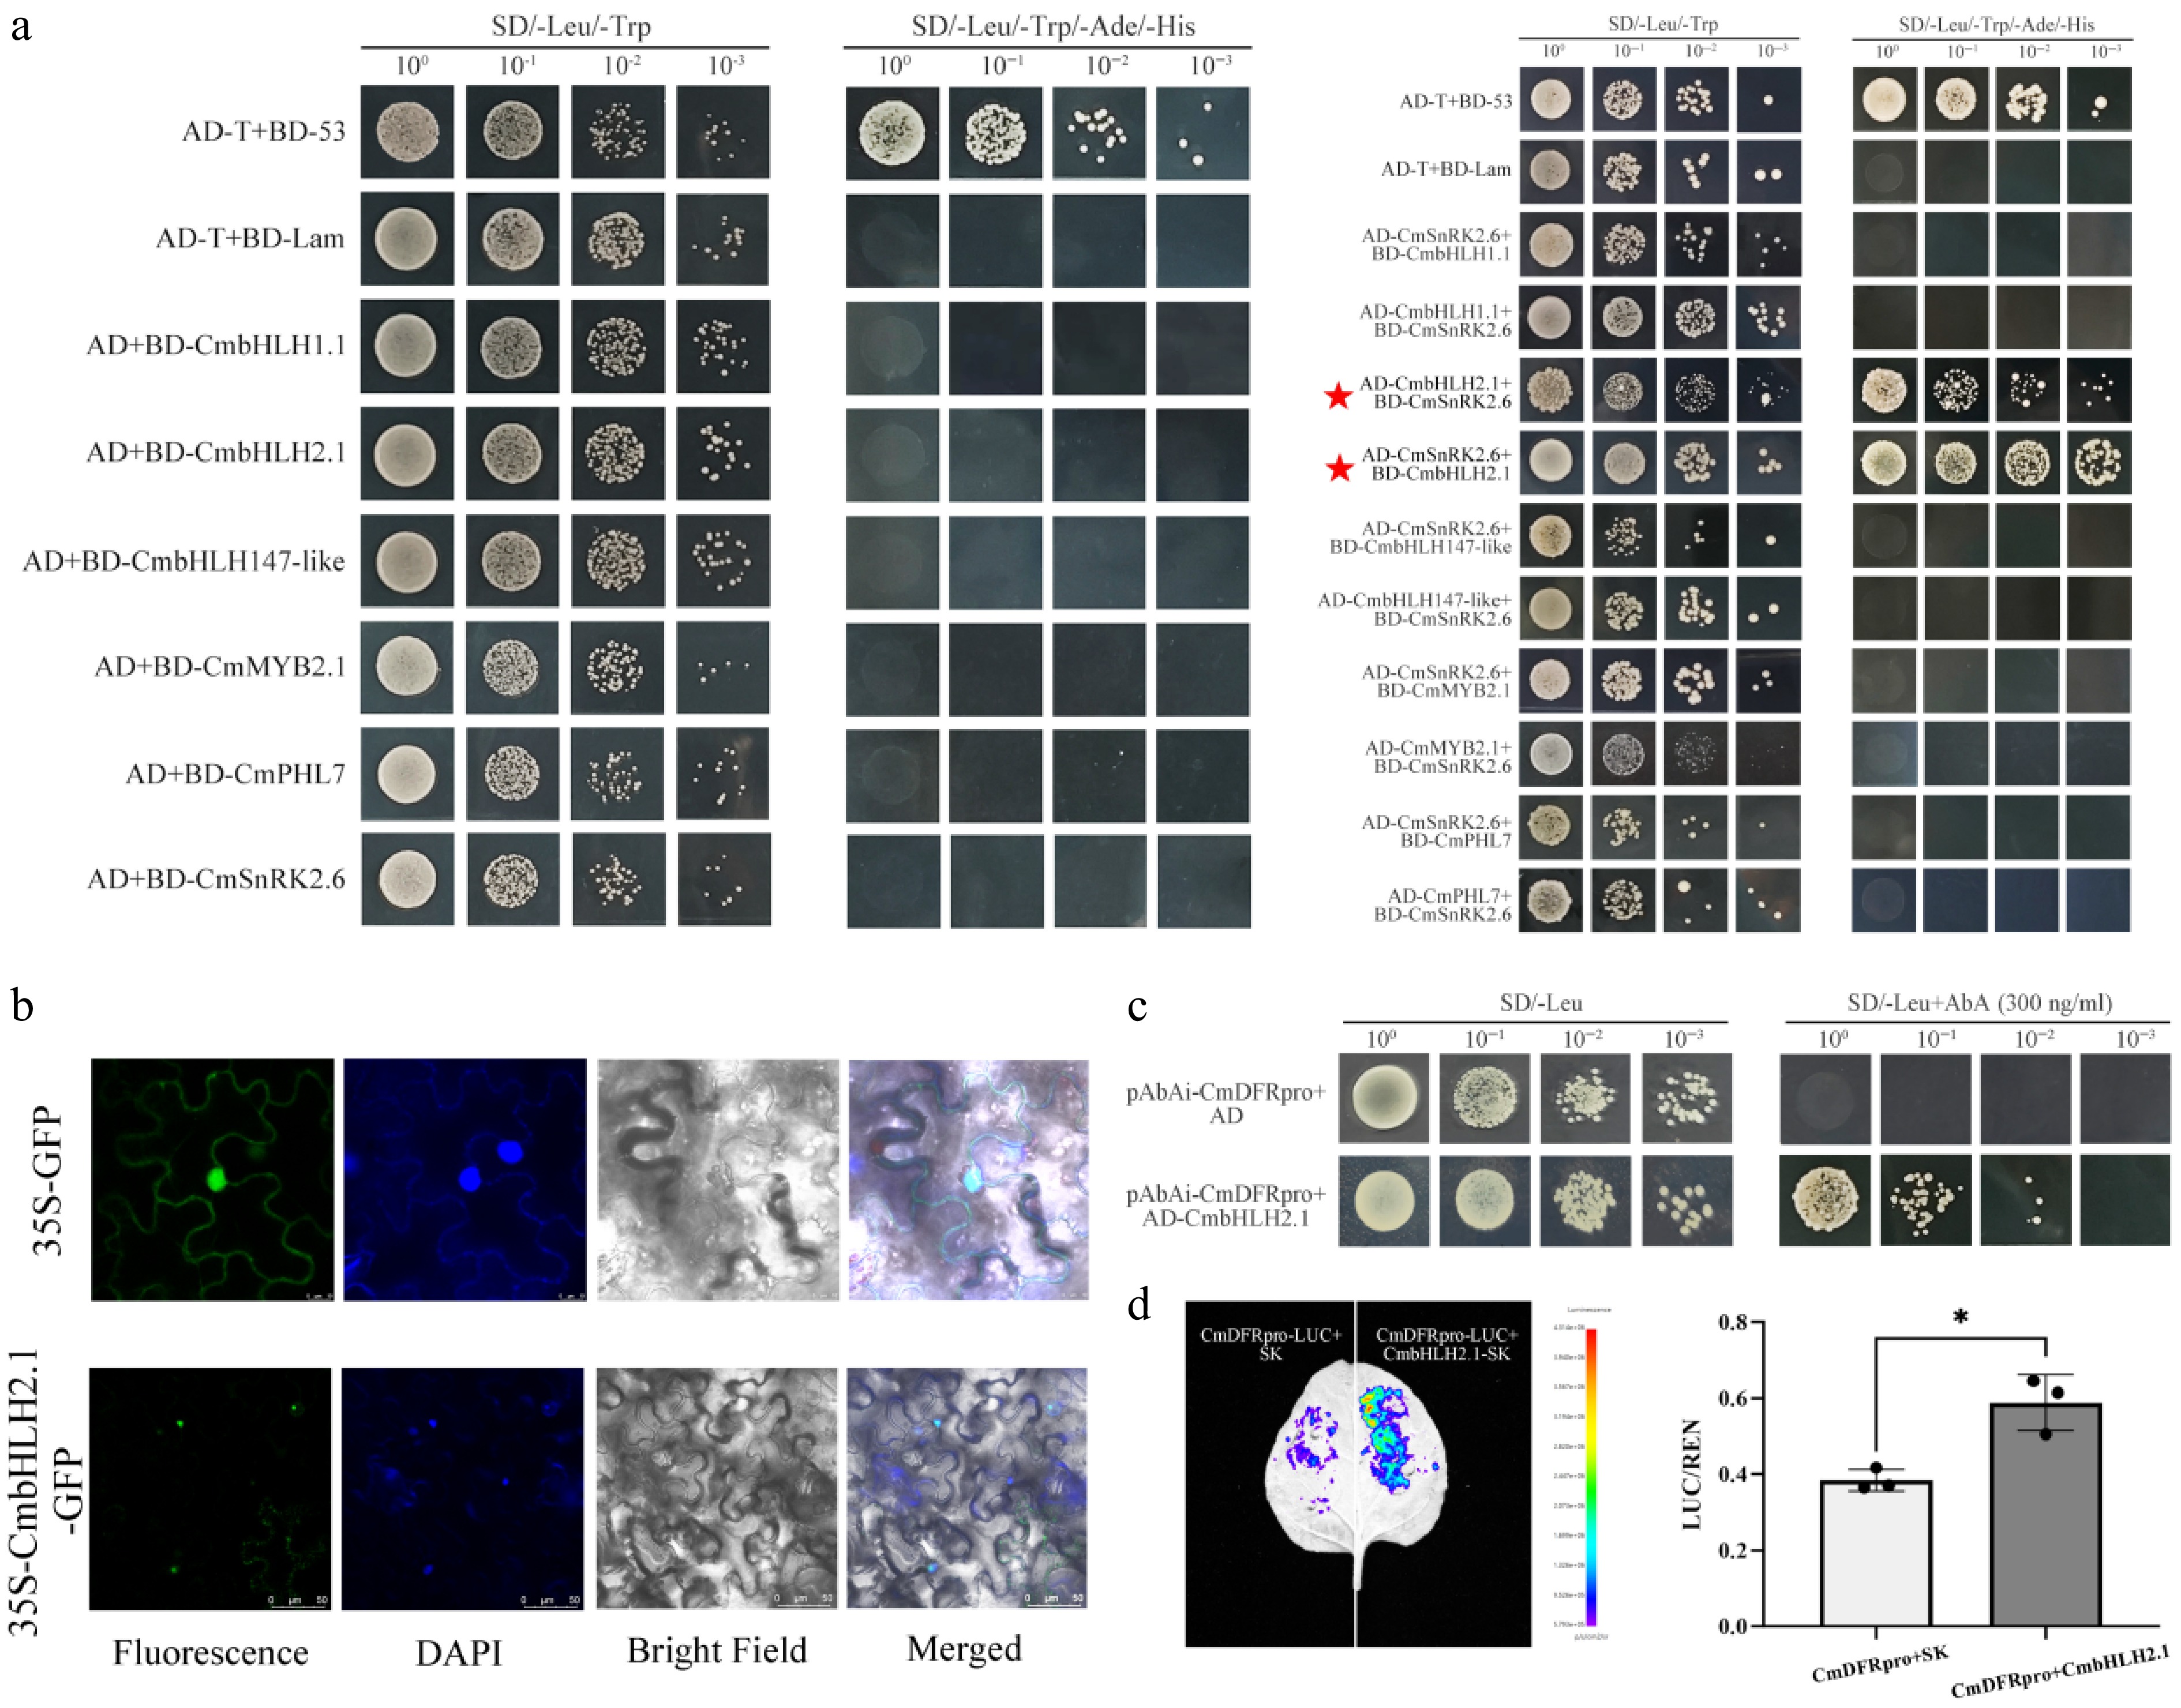
Figure 7.
Functional verification of the interaction between CmSnRK2.6 and CmbHLH2.1 and the transcriptional activation of the CmDFR promoter in chrysanthemum 'f23'. (a) Y2H assay verifying the protein–protein interaction between CmSnRK2.6 and CmbHLH2.1. (b) Subcellular localization analysis of CmbHLH2.1 in tobacco leaves. (c) Y1H assay confirming the direct binding of CmbHLH2.1 to the CmDFR promoter. (d) Dual-luciferase reporter assay verifying the transcriptional activation of the CmDFR promoter by CmbHLH2.1.
Figures
(7)
Tables
(0)