-
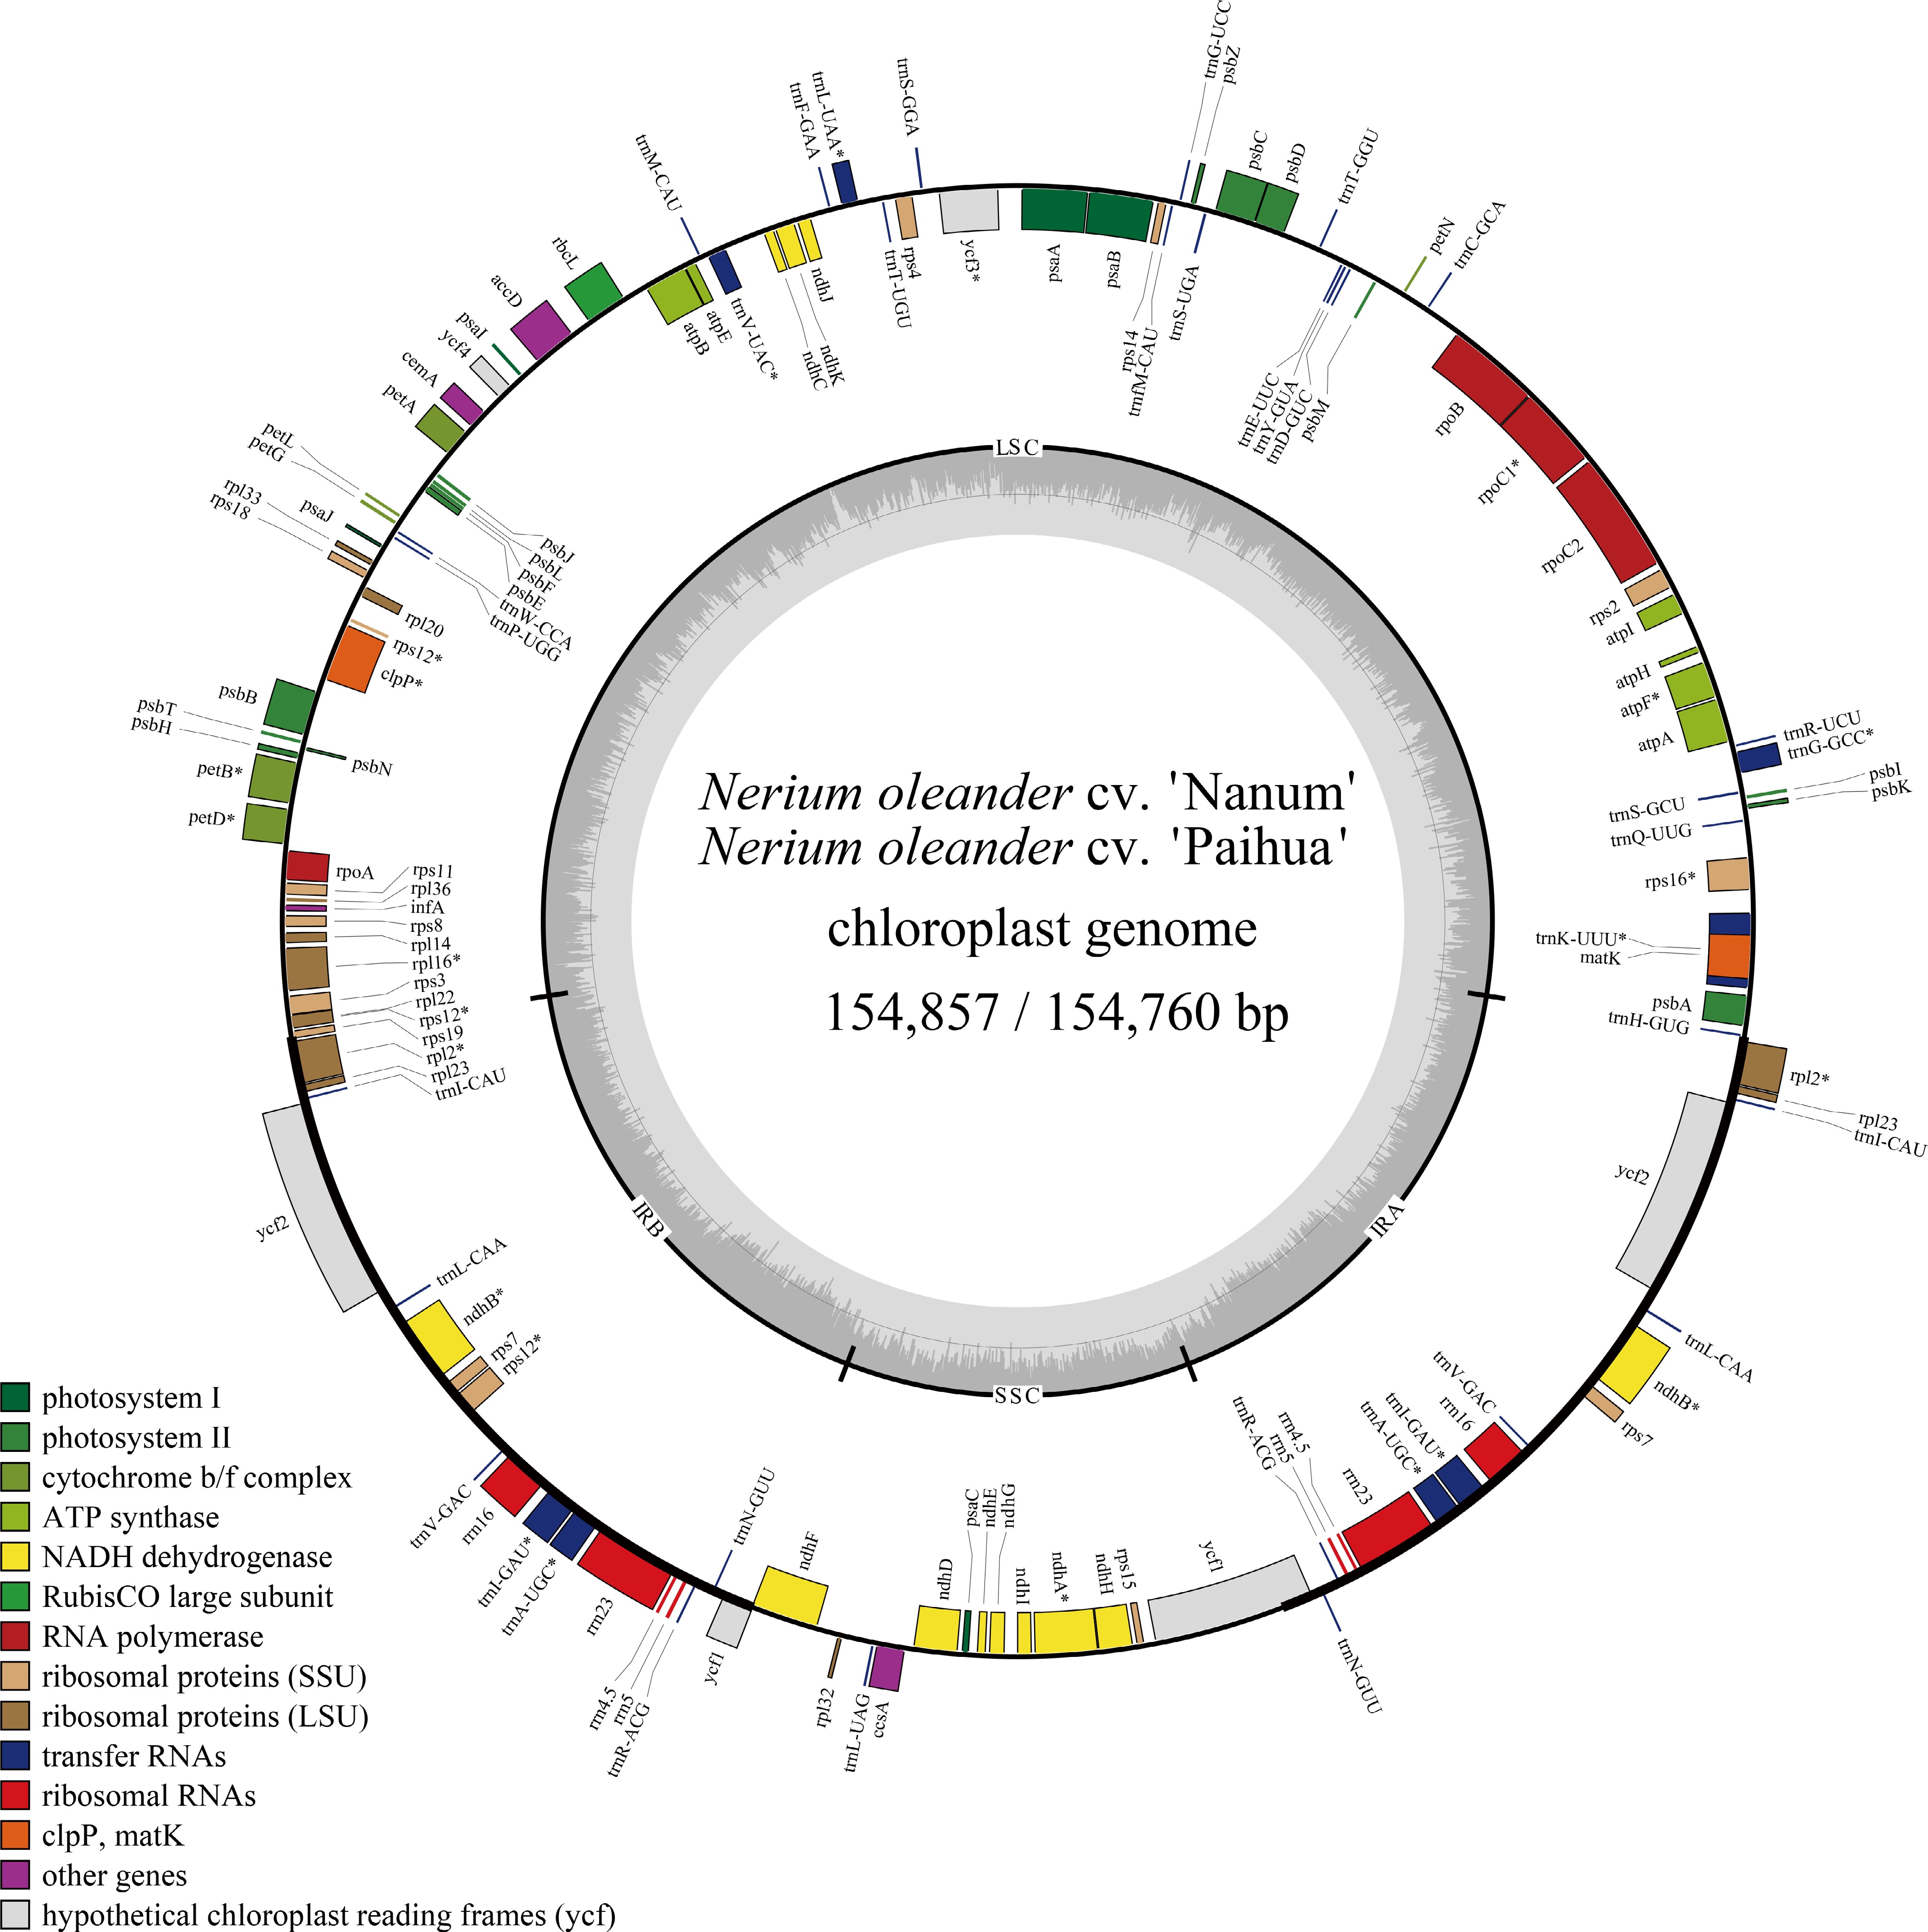
Figure 1.
Chloroplast genome map of N. oleander cultivars 'Paihua' and 'Nanum'. Genes located on the outer circle are transcribed in the clockwise direction, whereas those on the inner circle are transcribed counterclockwise. Different functional gene categories are indicated by distinct colors. The dashed region within the inner ring denotes the GC content of the chloroplast genome.
-
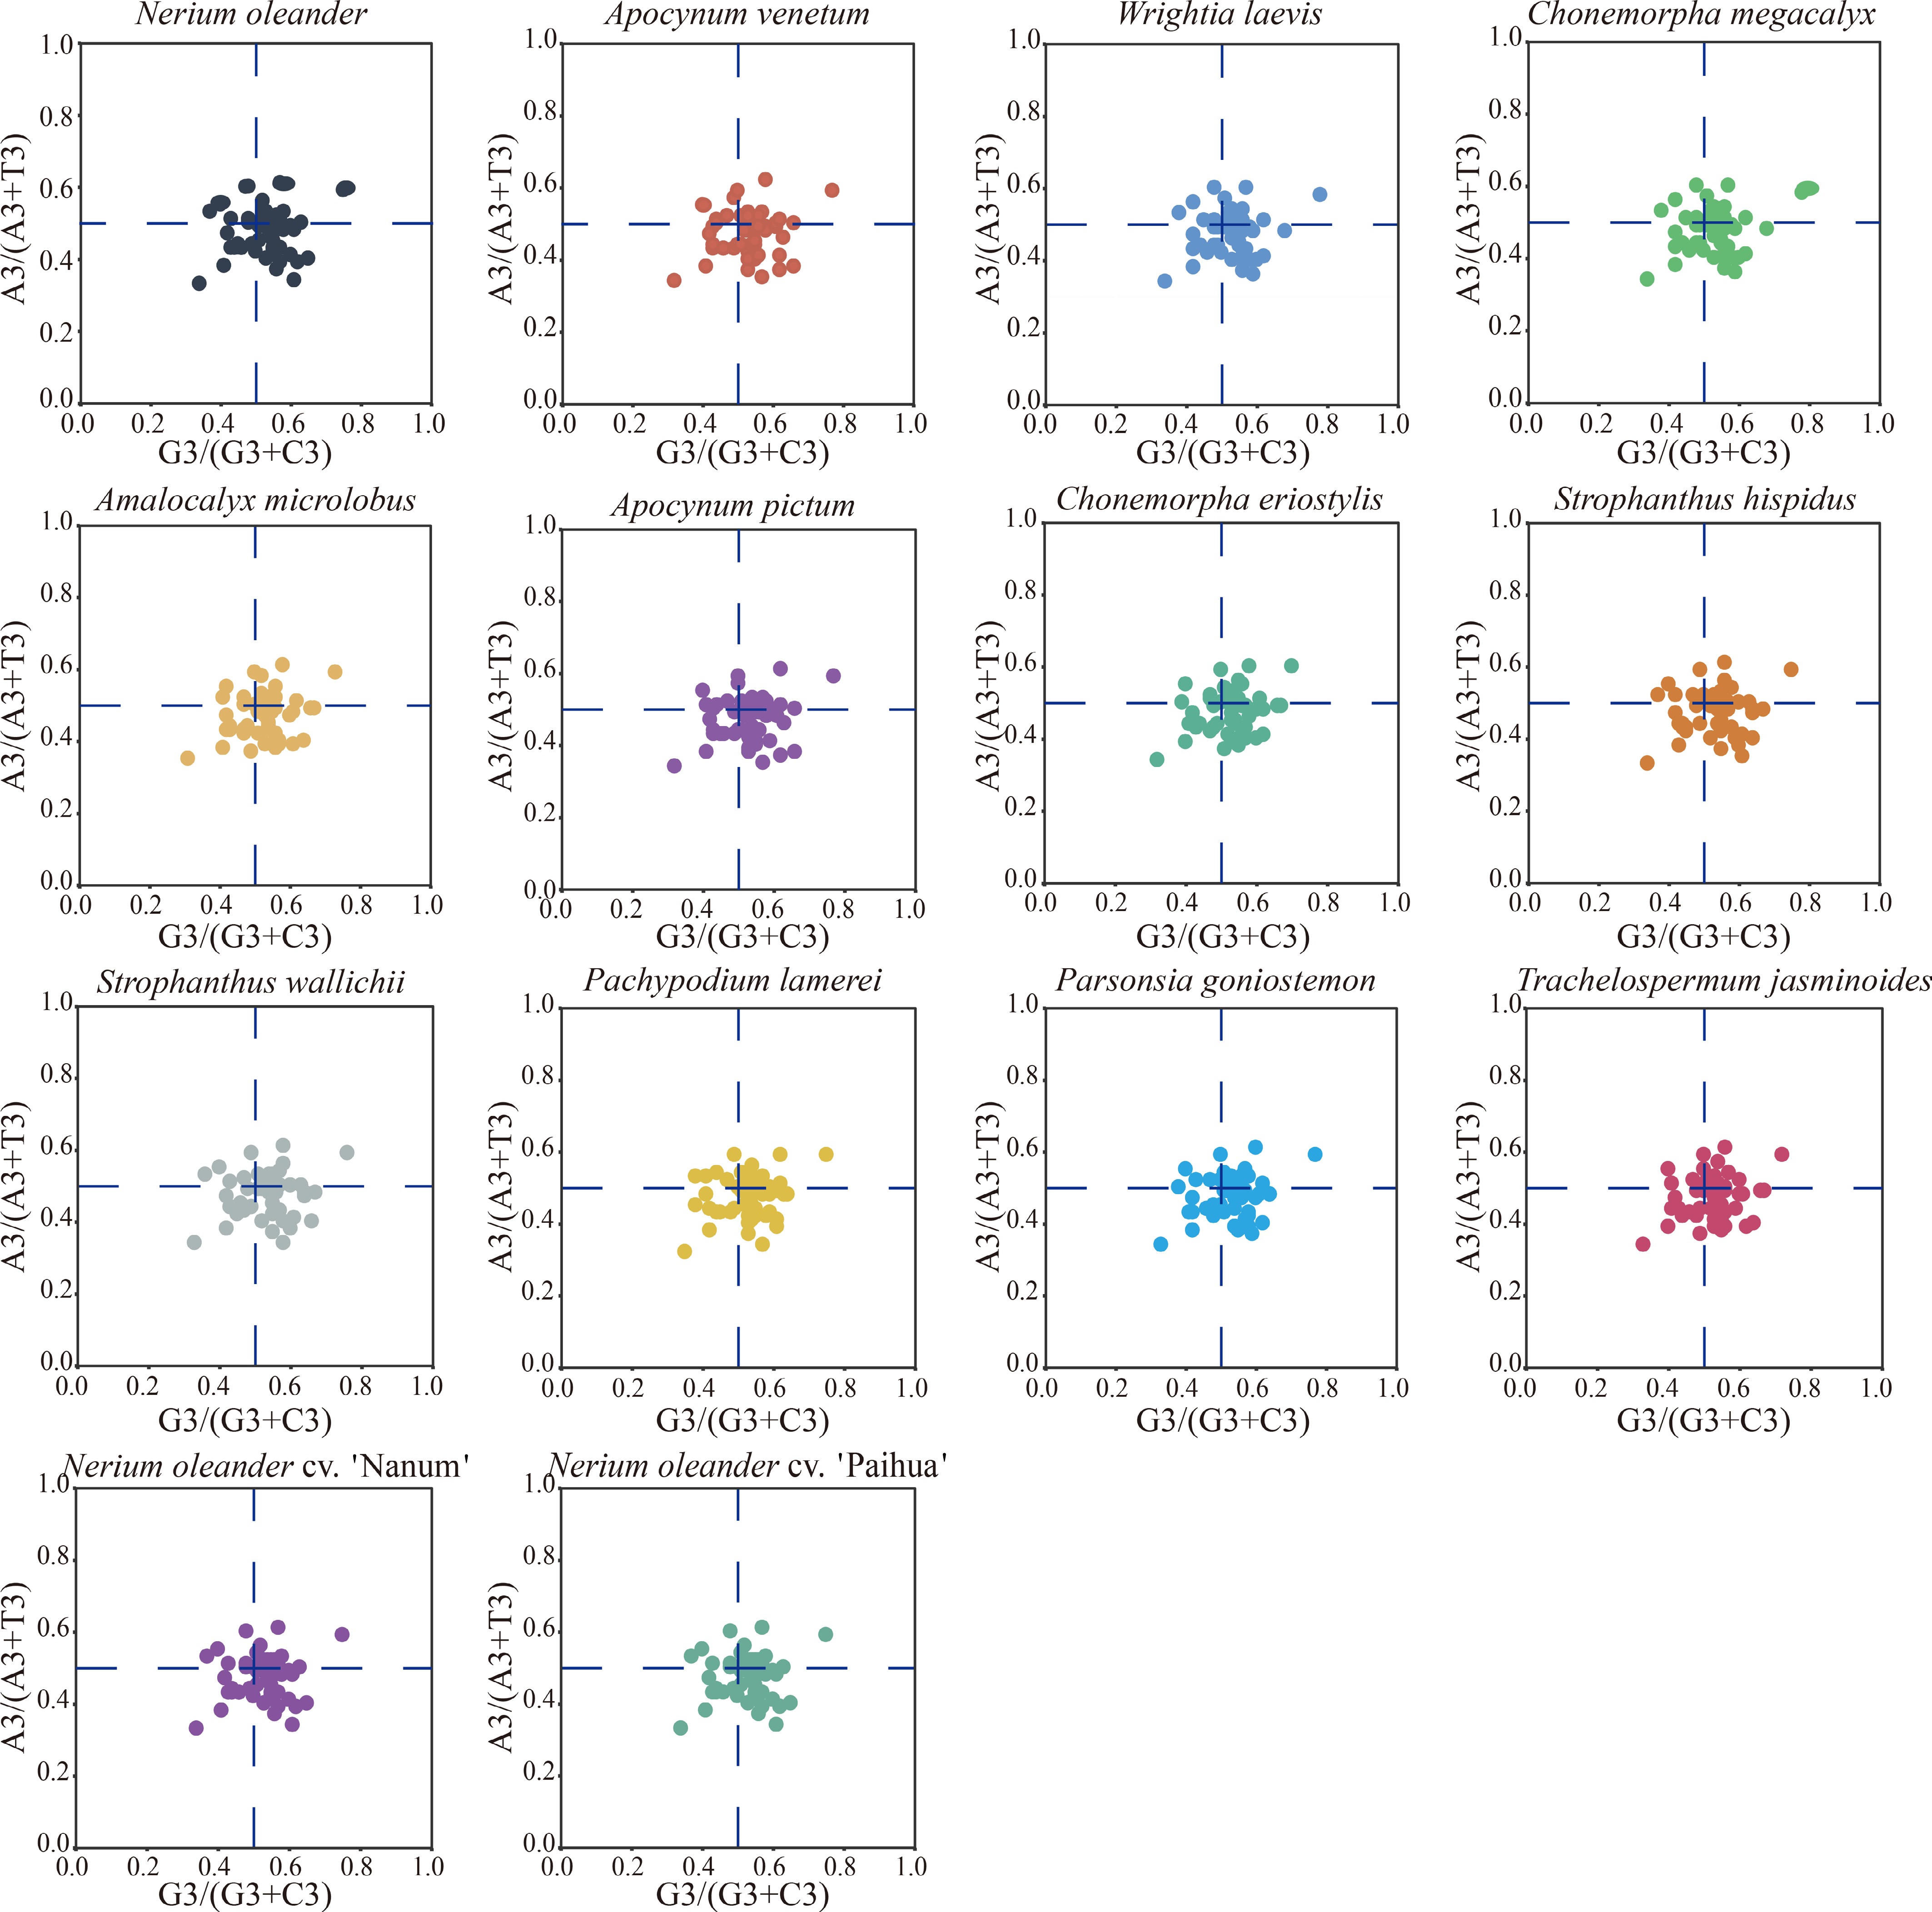
Figure 2.
PR2 analysis was conducted on protein-coding genes from 14 Apocynoideae chloroplast genomes. Each subplot illustrates the relationship between G3/(G3 + C3) and A3/(A3 + T3) for genes within a given genome. Individual points represent genes, and their sizes are scaled according to ENC values. The blue dashed lines denote the theoretical PR2 expectation, with the intersection at (0.5, 0.5) reflecting the neutral assumption that complementary bases (A = T, G = C) are used at equal frequencies at the third codon position.
-
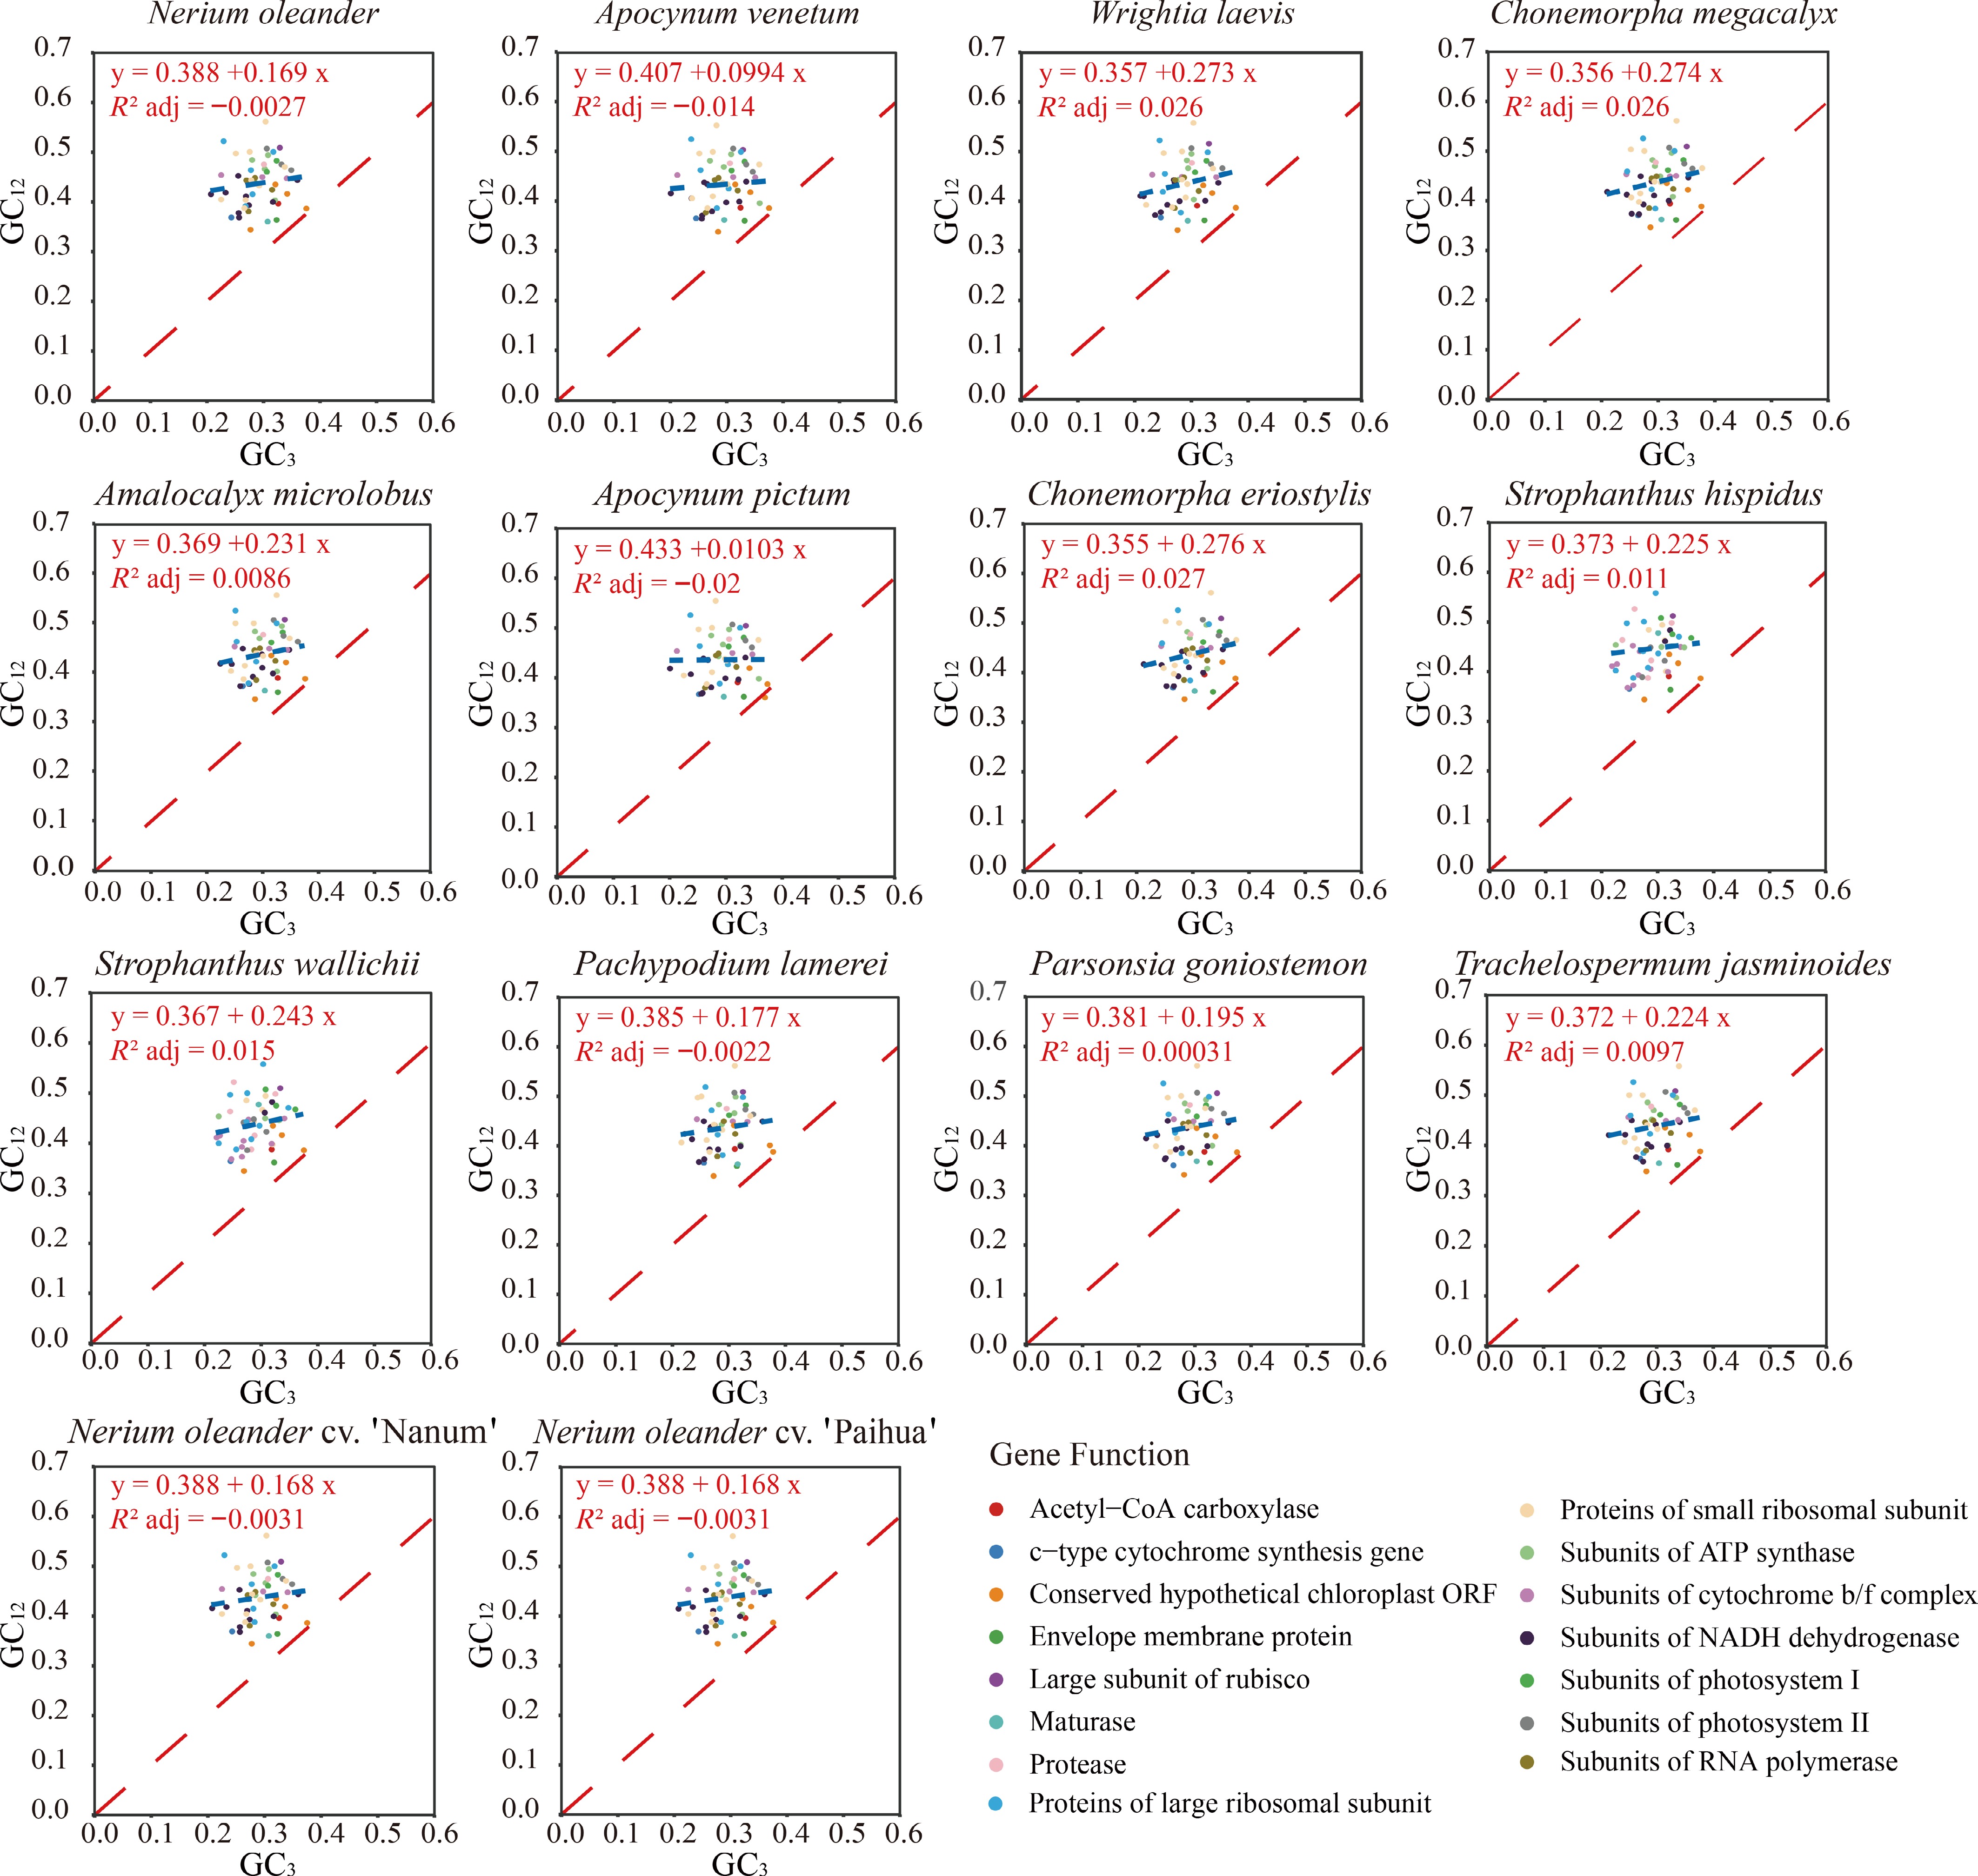
Figure 3.
Neutrality plot analysis was performed on codon usage in protein-coding genes from 14 Apocynoideae chloroplast genomes. Each subplot depicts the relationship between GC3 and GC12 for a given genome. Individual points correspond to genes, with their sizes scaled according to ENC values. The blue dashed line represents the fitted regression, whereas the red dashed line denotes the theoretical neutral expectation (GC12 = GC3). The regression equation and adjusted R2 value indicate the strength of the association between GC3 and GC12.
-
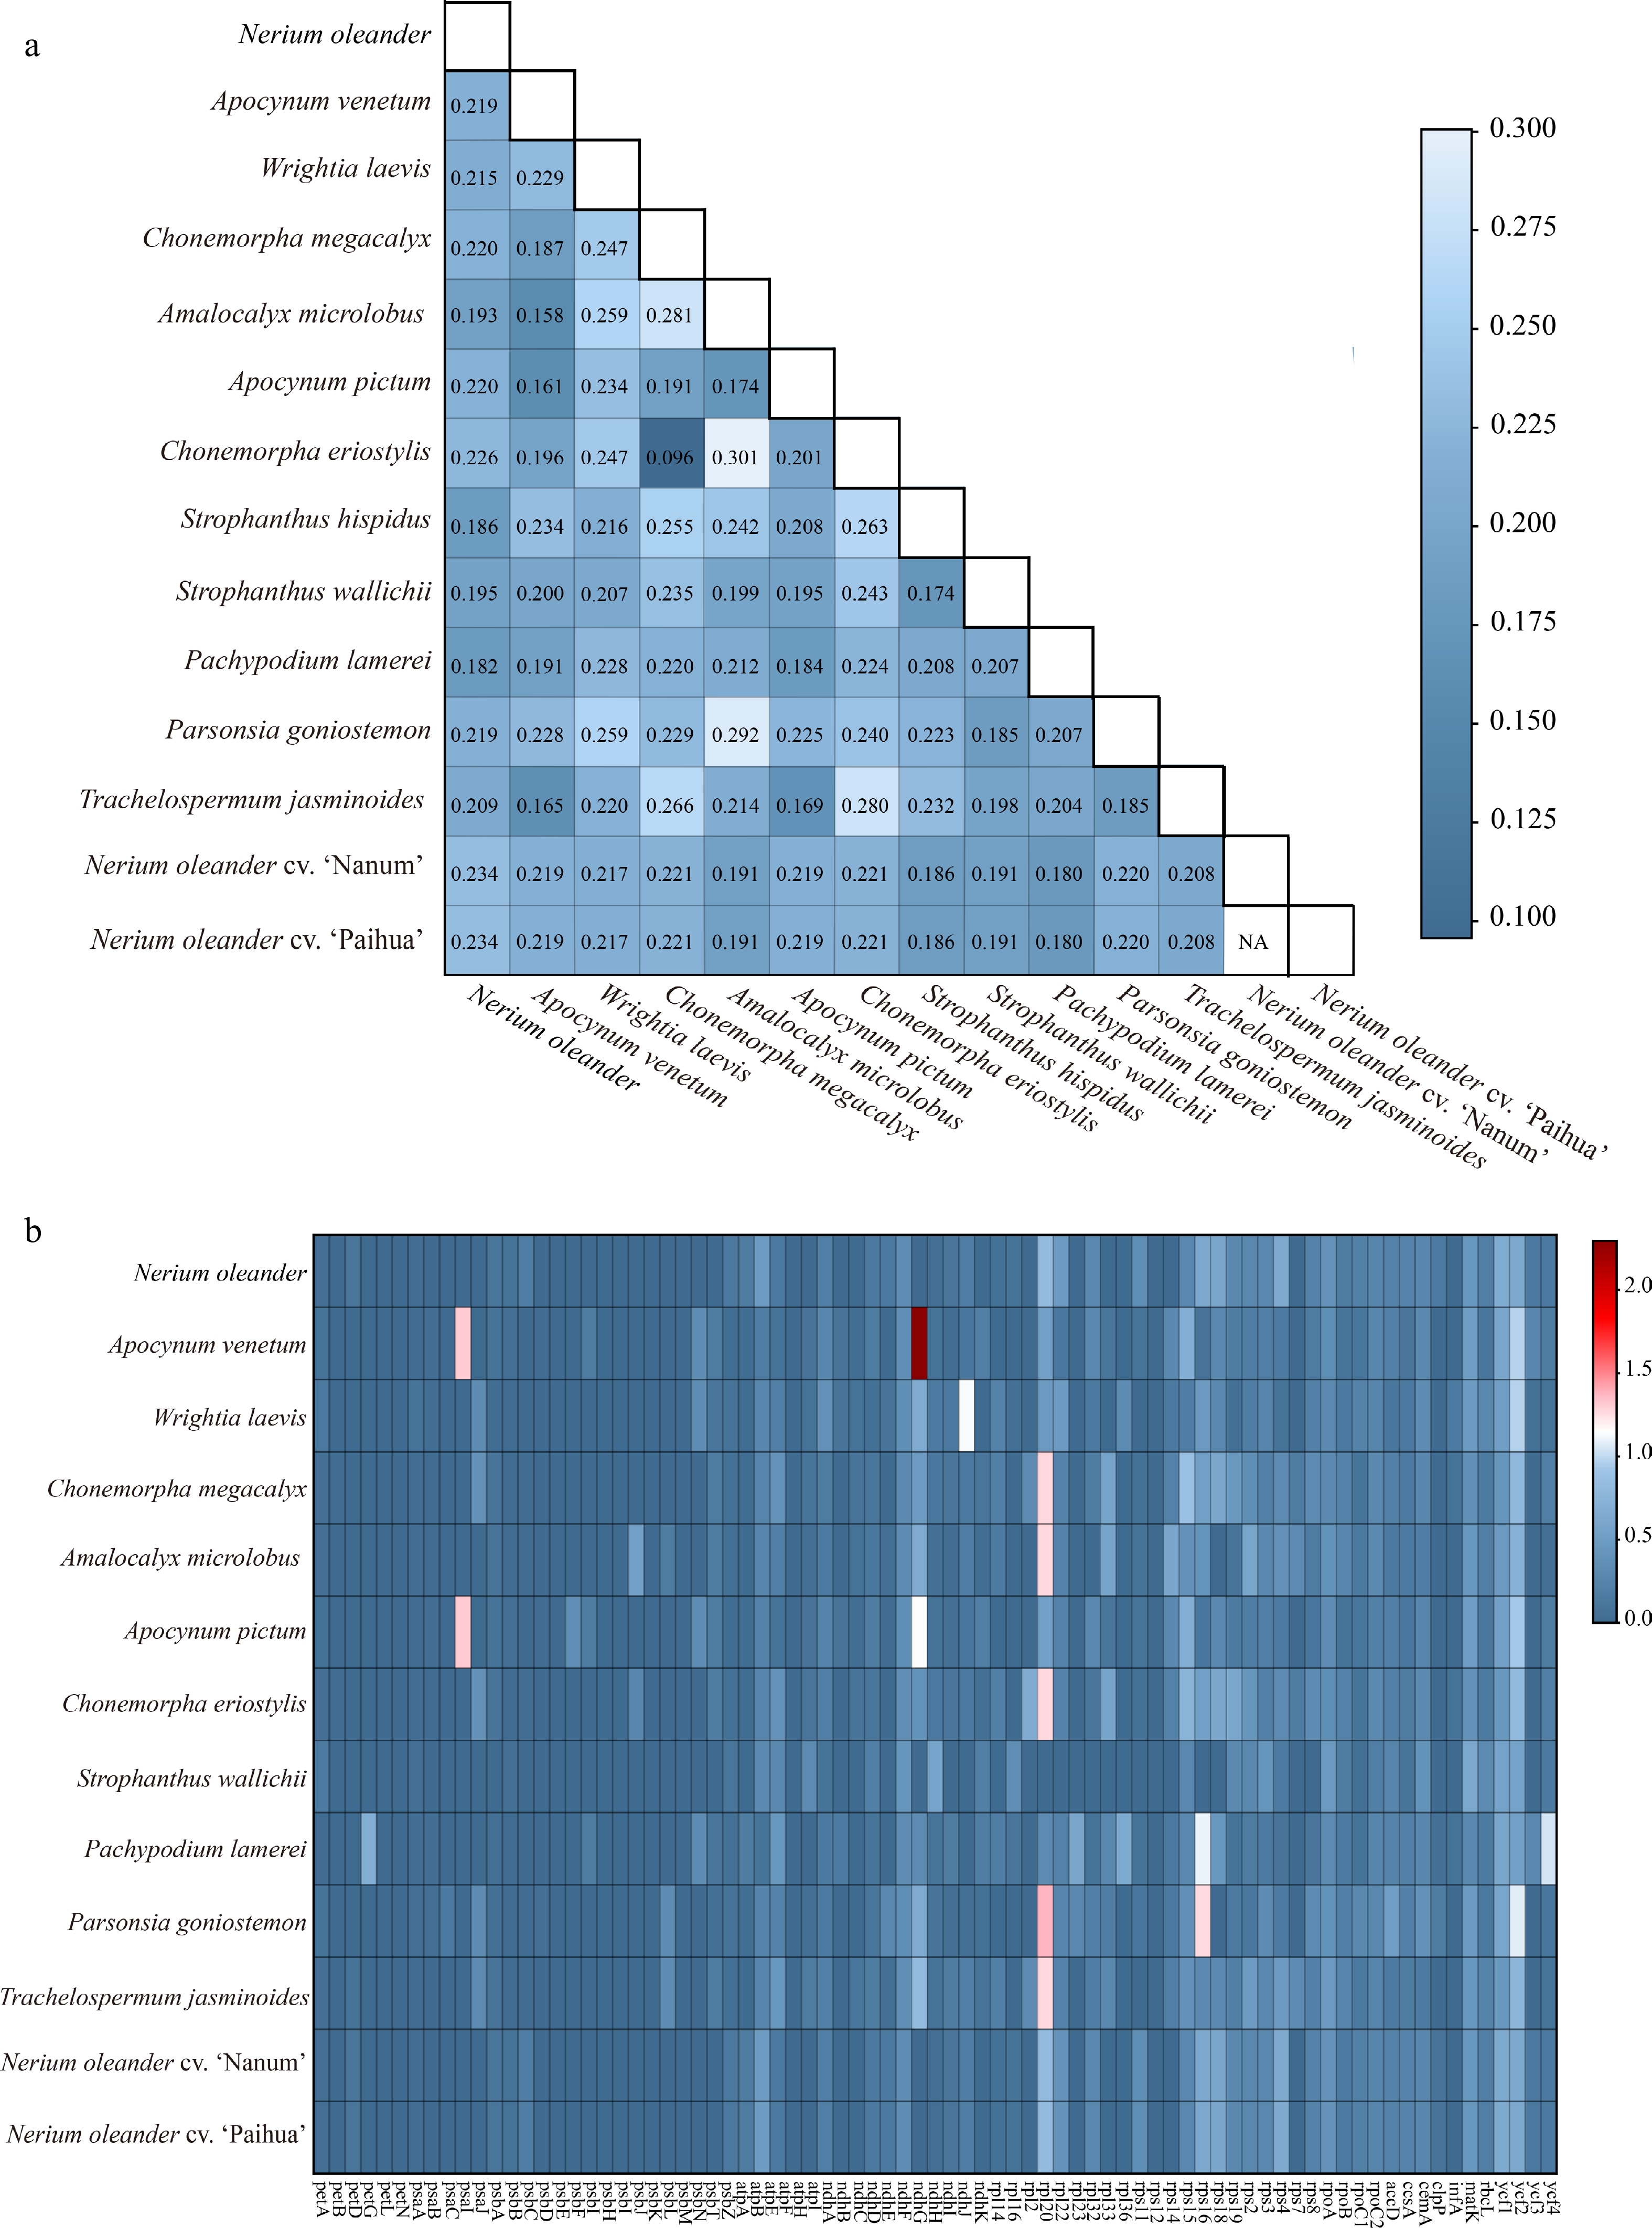
Figure 4.
Ka/Ks ratio patterns among 14 Apocynoideae chloroplast genomes. (a) Distribution of pairwise Ka/Ks ratios among species. (b) The Ka/Ks ratios of homologous genes.
-
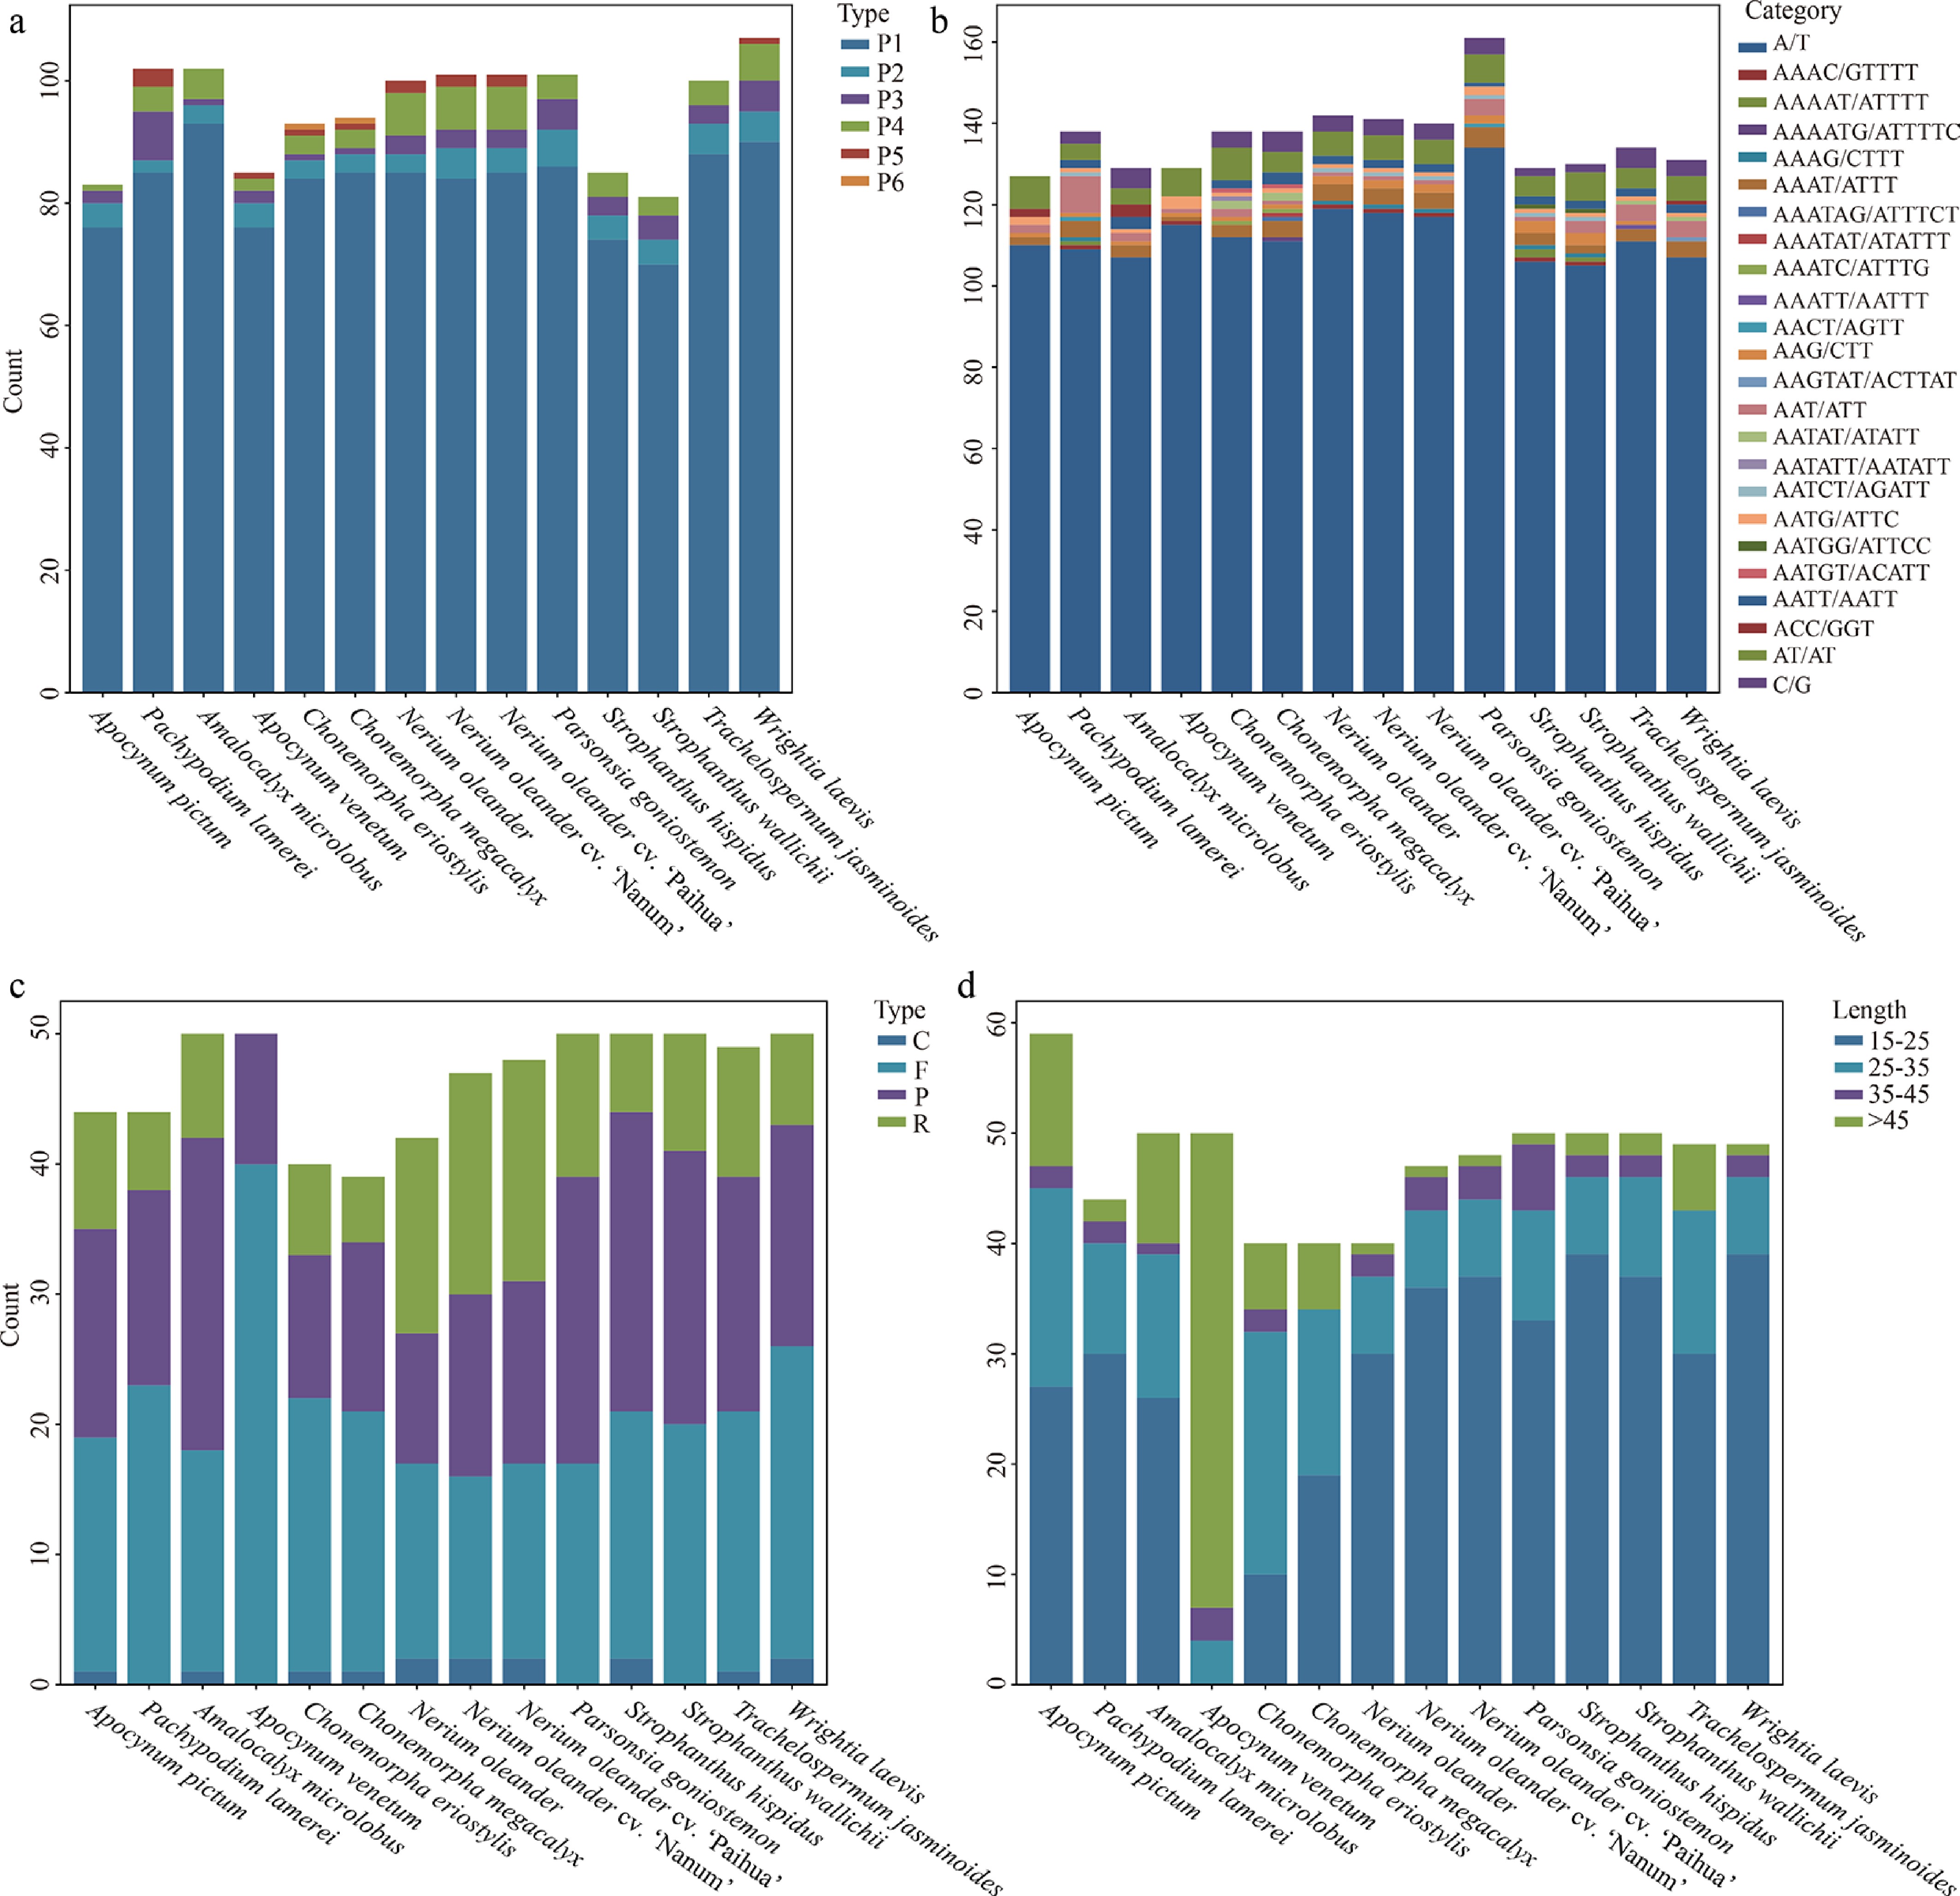
Figure 5.
Comparative analysis of repetitive sequences across 14 Apocynoideae chloroplast genomes. (a) Distribution of six SSR repeat unit types. (b) Count of each SSR repeat type. (c) Count of four long repeat categories. (d) Count of long repeats by length.
-
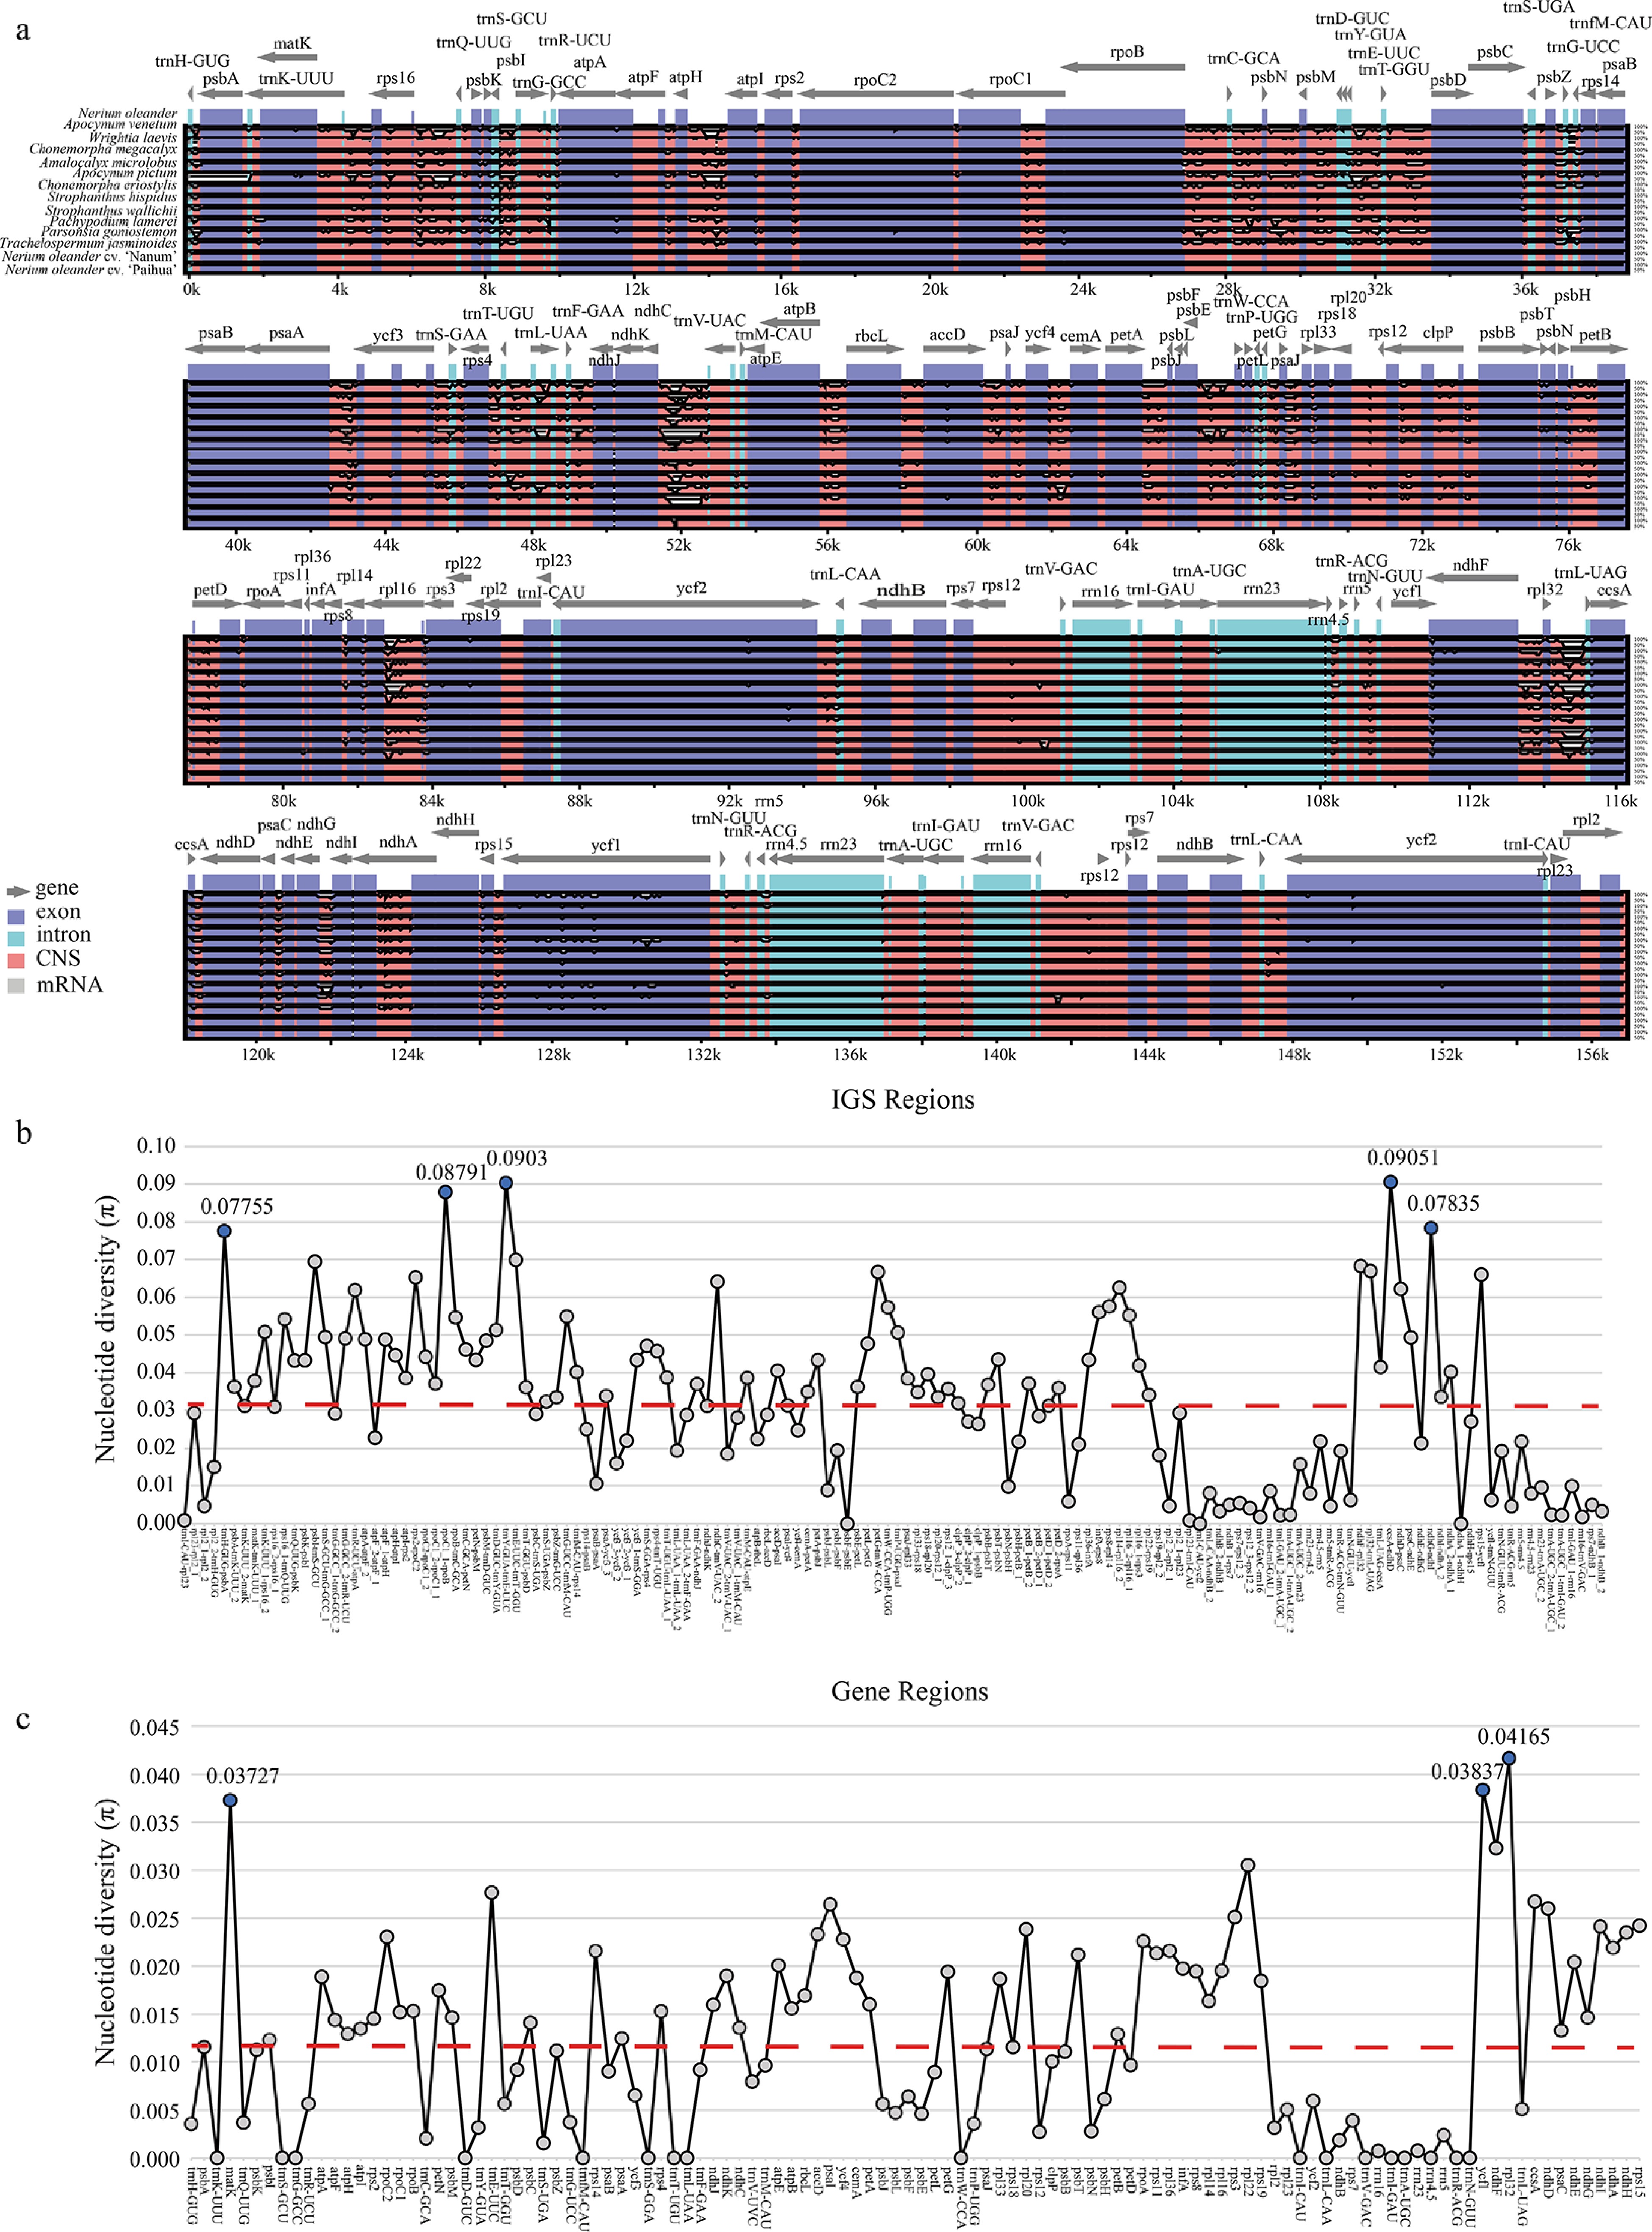
Figure 6.
Comparative analysis of 14 Apocynoideae chloroplast genomes. (a) Sequence identity with N. oleander as the reference. Gray arrows indicate gene orientation, red bars represent non-coding sequences, purple bars denote exons, and blue bars signify introns. (b) Nucleotide variability comparison in intergenic regions. (c) Nucleotide variation comparison in coding regions. Red dashed line represents the average value.
-
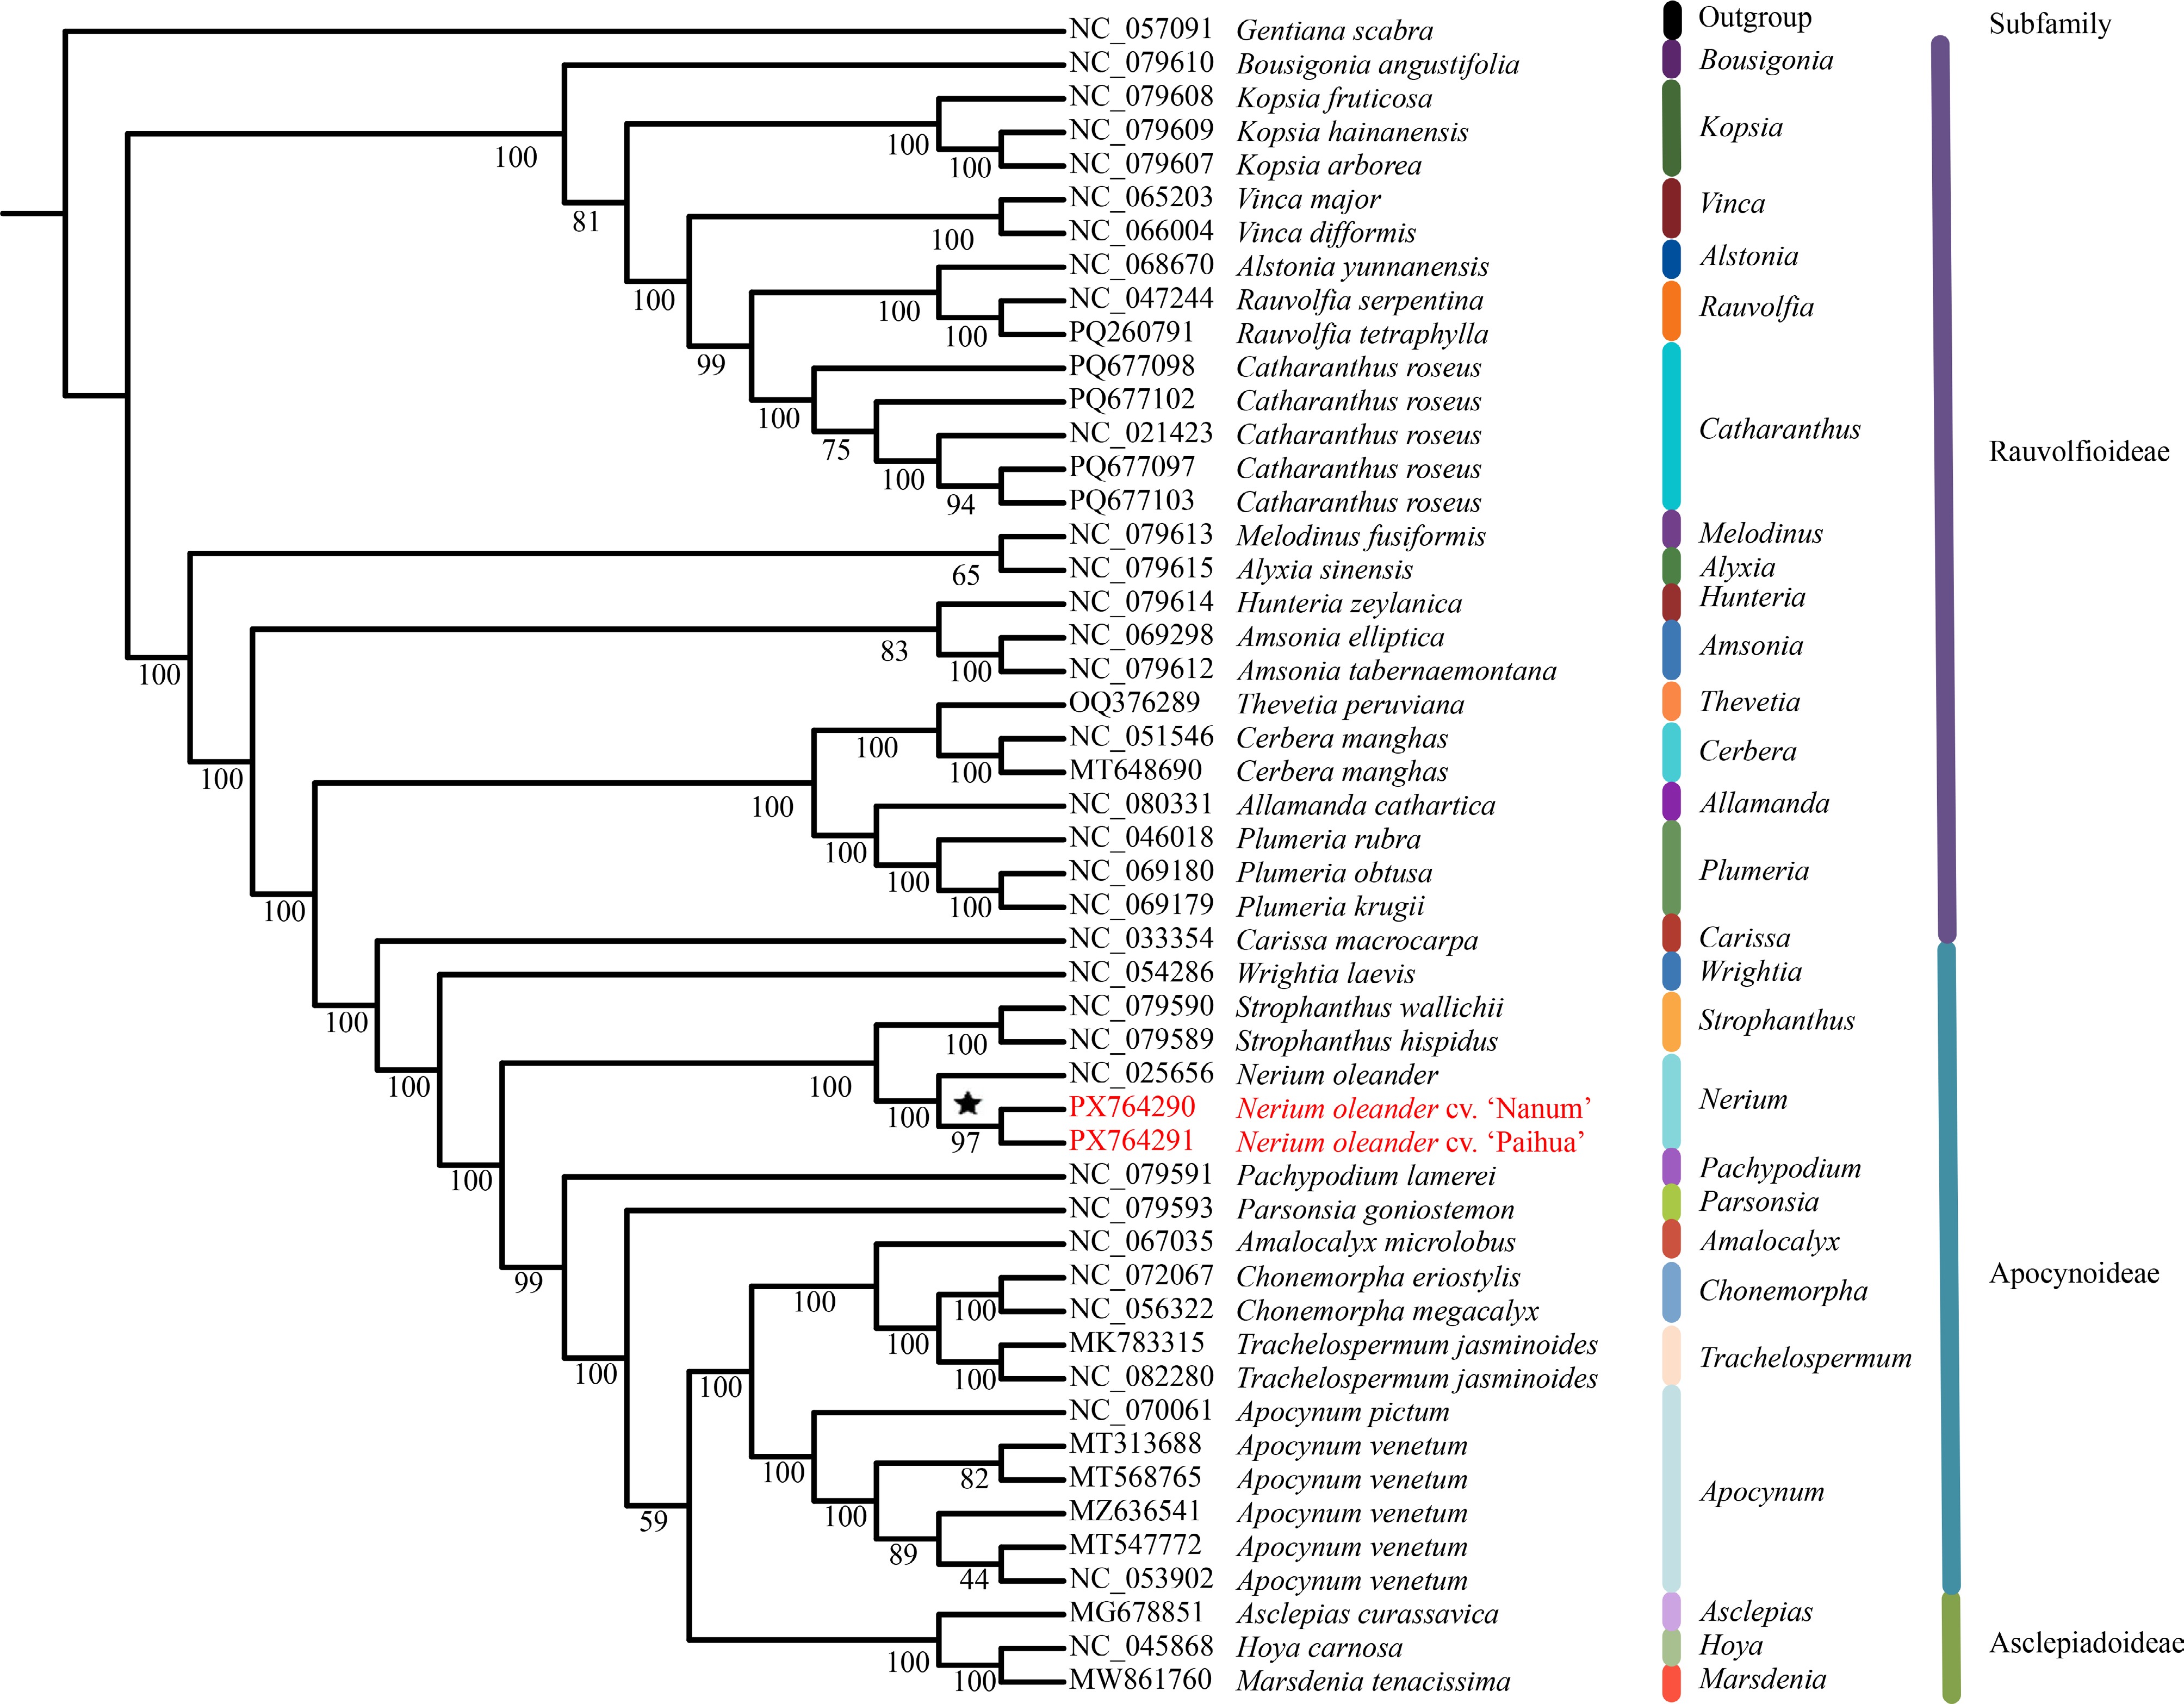
Figure 7.
Phylogenetic tree constructed using concatenated CDS of 50 chloroplast genomes.
-
Species Gene bank ID GCall GC1 GC2 GC3 GC3S ENC Nerium oleander NC_025656 38.06 46.01 37.71 31.45 38.40 50.12 Apocynum venetum NC_053902 38.15 46.52 38.30 32.62 38.50 50.09 Wrightia laevis NC_094286 38.45 46.15 38.48 30.71 38.40 50.19 Chonemorpha megacalyx NC_056322 38.33 46.46 38.60 31.94 39.00 50.01 Amalocalyx microlobus NC_067035 38.34 46.56 39.72 30.73 37.70 50.49 Apocynum pictum NC_070061 38.36 47.54 38.14 31.41 38.36 50.60 Chonemorpha eriostylis NC_072067 38.32 46.18 37.93 30.84 38.80 50.04 Strophanthus hispidus NC_079589 38.06 46.60 38.11 30.47 37.47 50.46 Strophanthus wallichii NC_079590 37.93 46.21 39.00 31.58 37.60 50.22 Pachypodium lamerei NC_075951 38.46 46.01 38.61 30.76 37.90 50.27 Parsonsia goniostemon NC_079593 38.51 46.11 38.56 30.86 37.90 50.30 Trachelospermum jasminoides NC_082280 38.43 46.13 38.48 30.68 38.60 50.01 Nerium oleander cv. 'Nanum' PX764290 38.06 46.66 37.92 30.60 38.60 51.00 Nerium oleander cv. 'Paihua' PX764291 38.08 46.41 39.29 30.55 37.50 51.39 Table 1.
Codon usage characteristics of 14 chloroplast genomes in Apocynoideae.
Figures
(7)
Tables
(1)