-
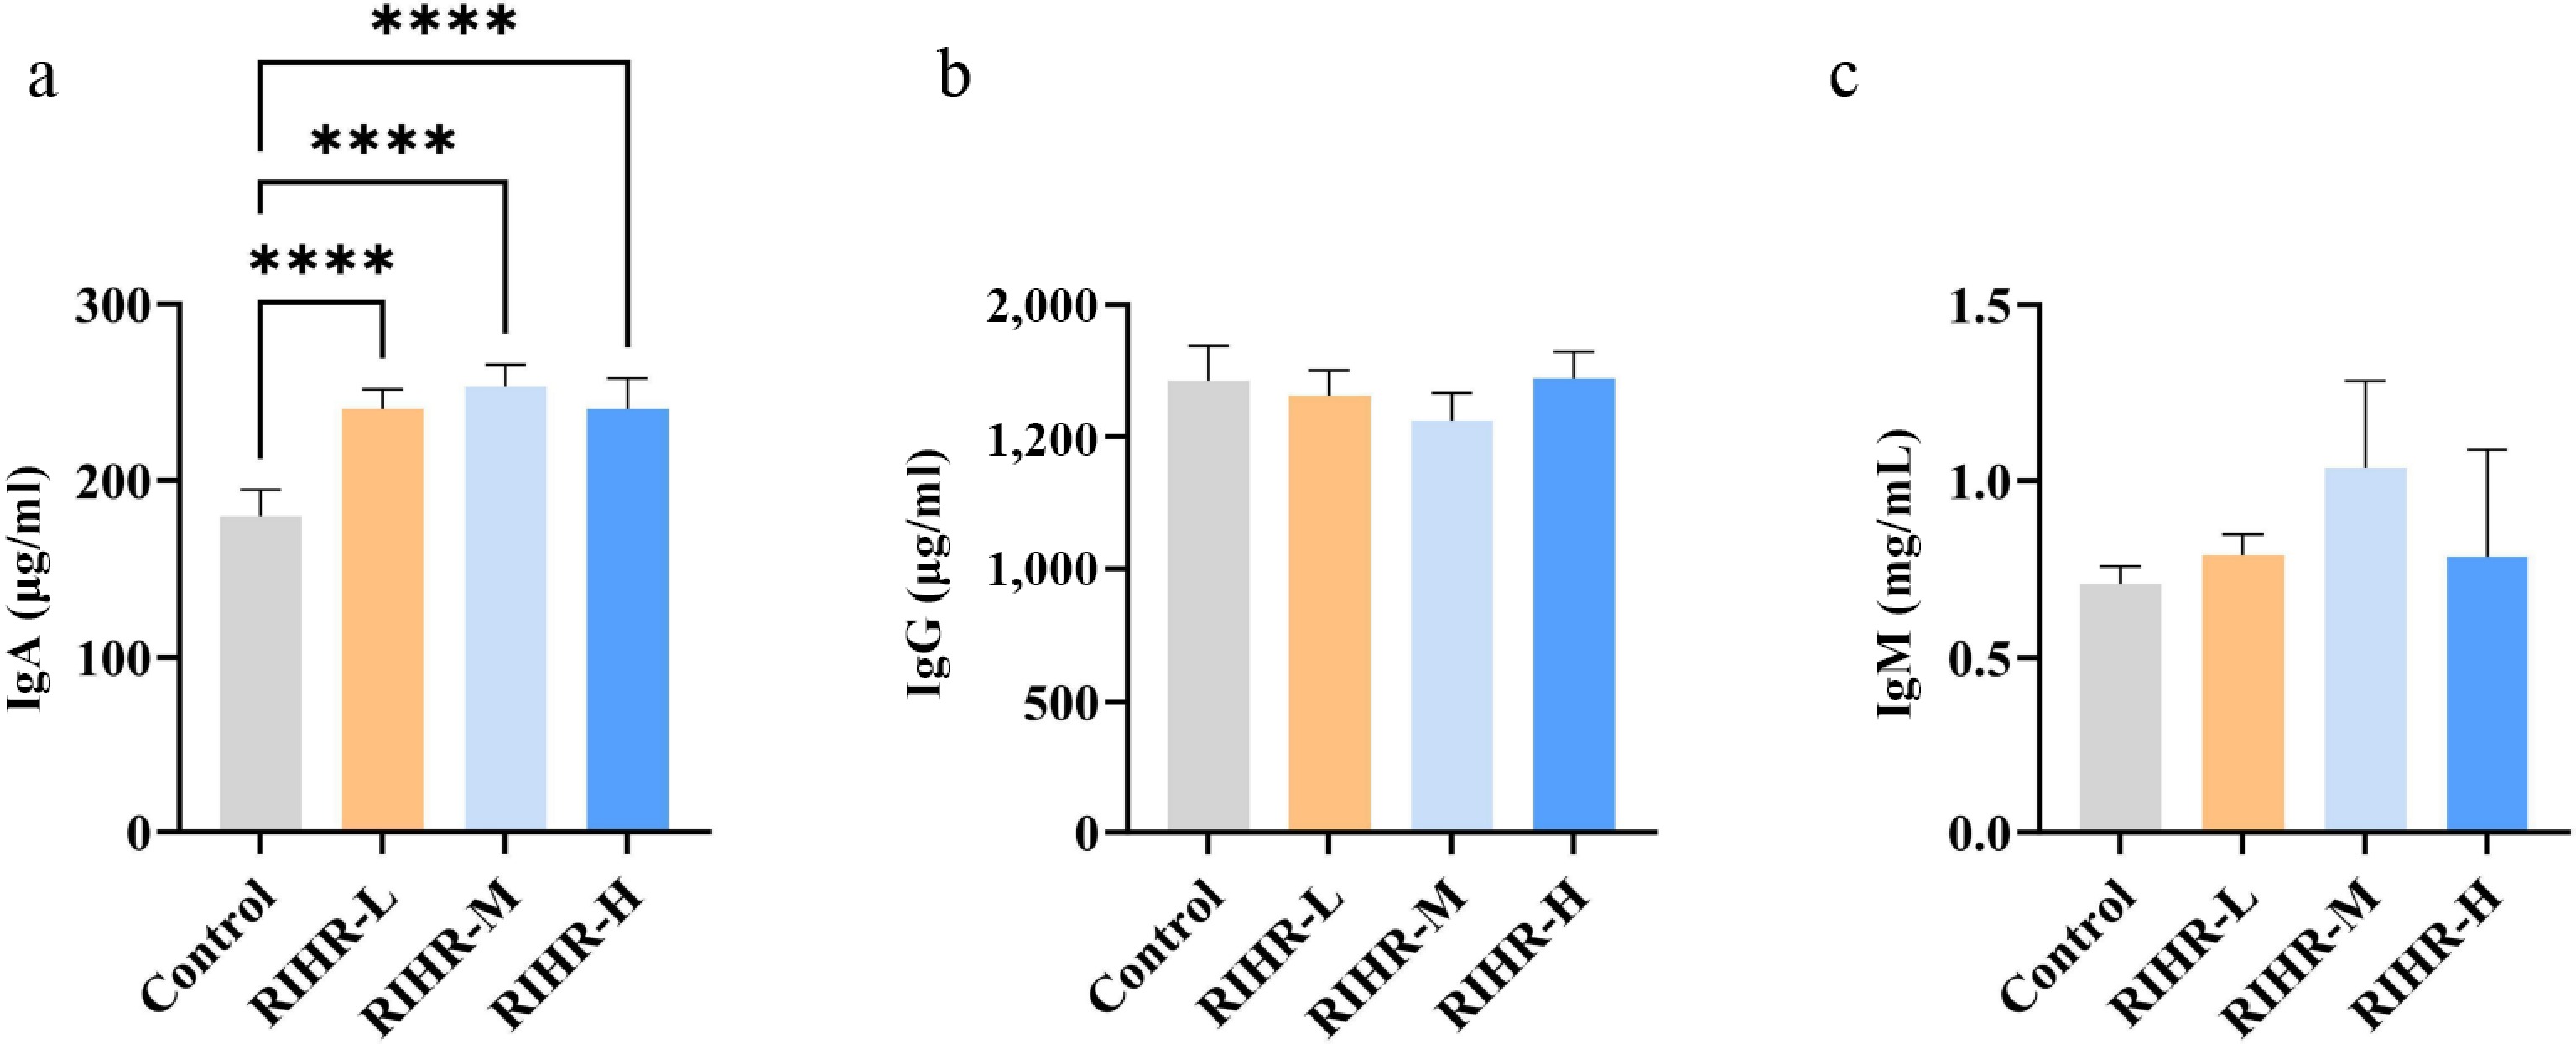
Figure 1.
Effects of RIHR on Immunity. (a)–(c) Measurement of IgA, IgM, and IgG in serum using ELISA. * Indicates significant difference (p < 0.05), **, *** and **** indicate extremely significant differences (p < 0.01), and no * indicates no significant difference (p > 0.05).
-
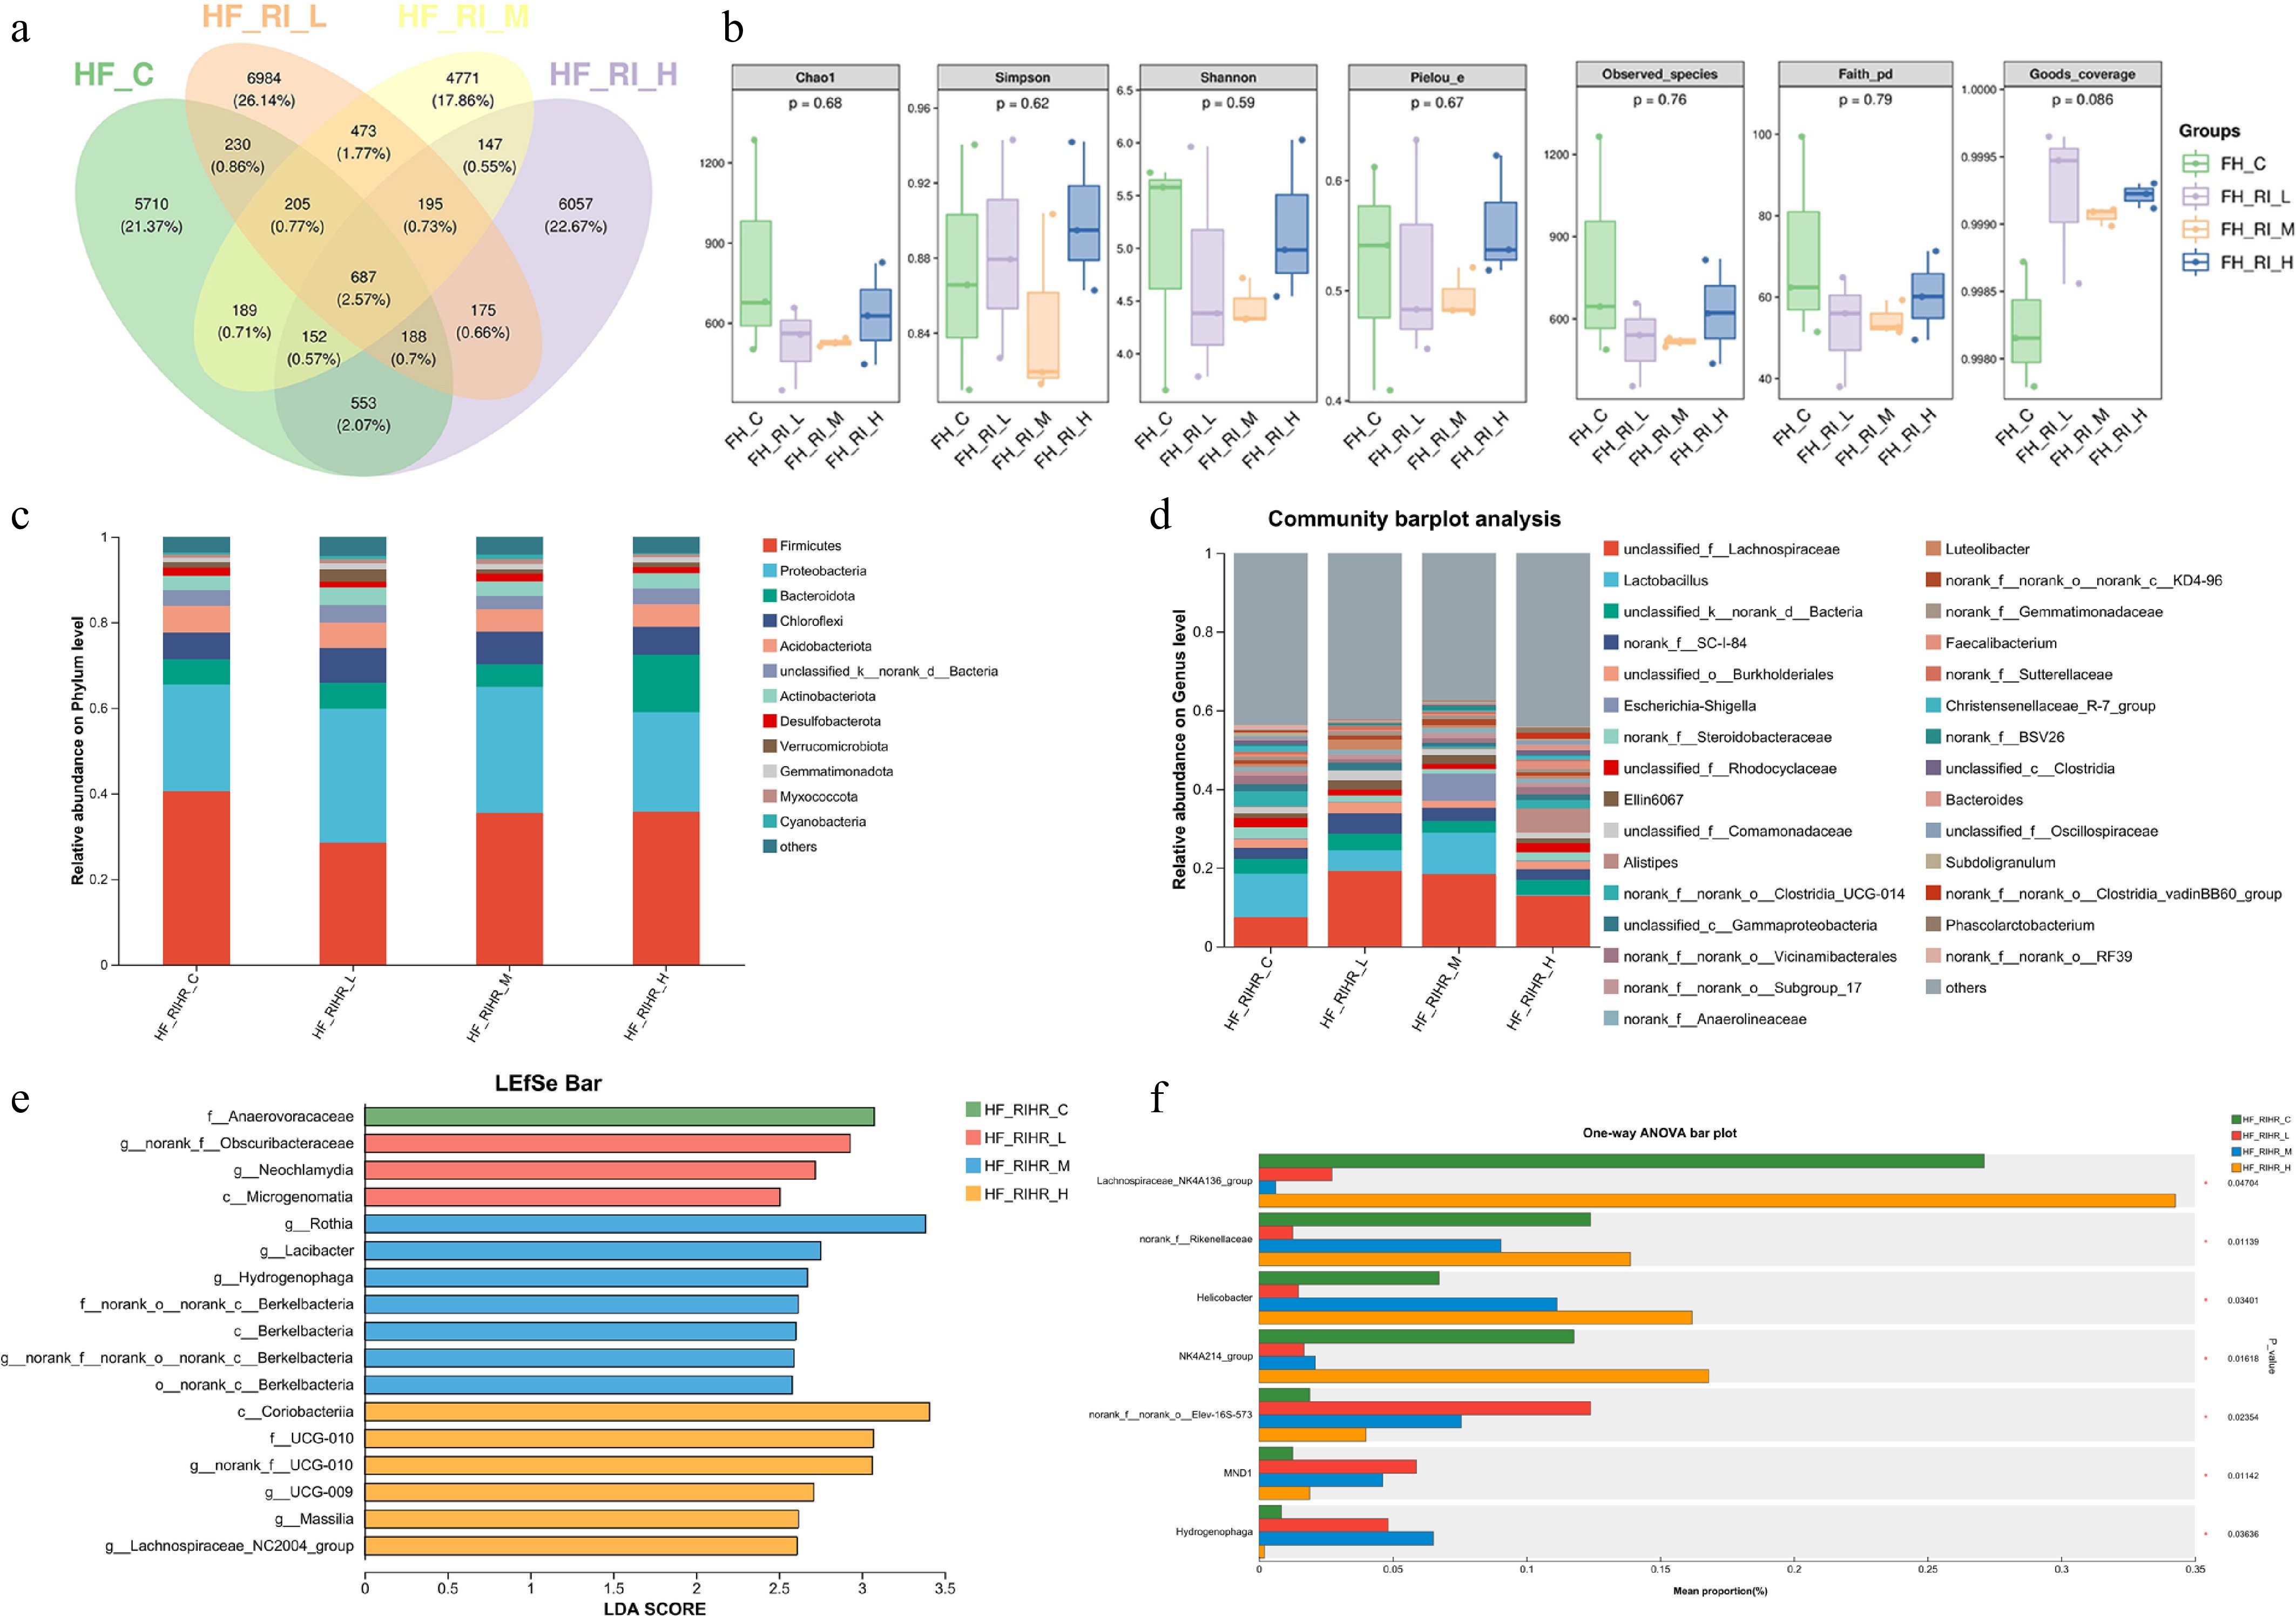
Figure 2.
Effect of RIHR on foregut microflora of 42-day-old broilers. (a) Venn diagram community analysis of foregut microbiota. (b) Analysis of differences in alpha diversity indices among foregut microbiota. (c) Bar chart showing species composition at the phylum level for each group. (d) Bar chart showing species composition at the genus level for each group. (e) LEfSe analysis for multilayer species differentiation. (f) Inter-group species difference analysis. * In the figure indicates a significant difference (p < 0.05), while no * indicates no significant difference (p > 0.05).
-
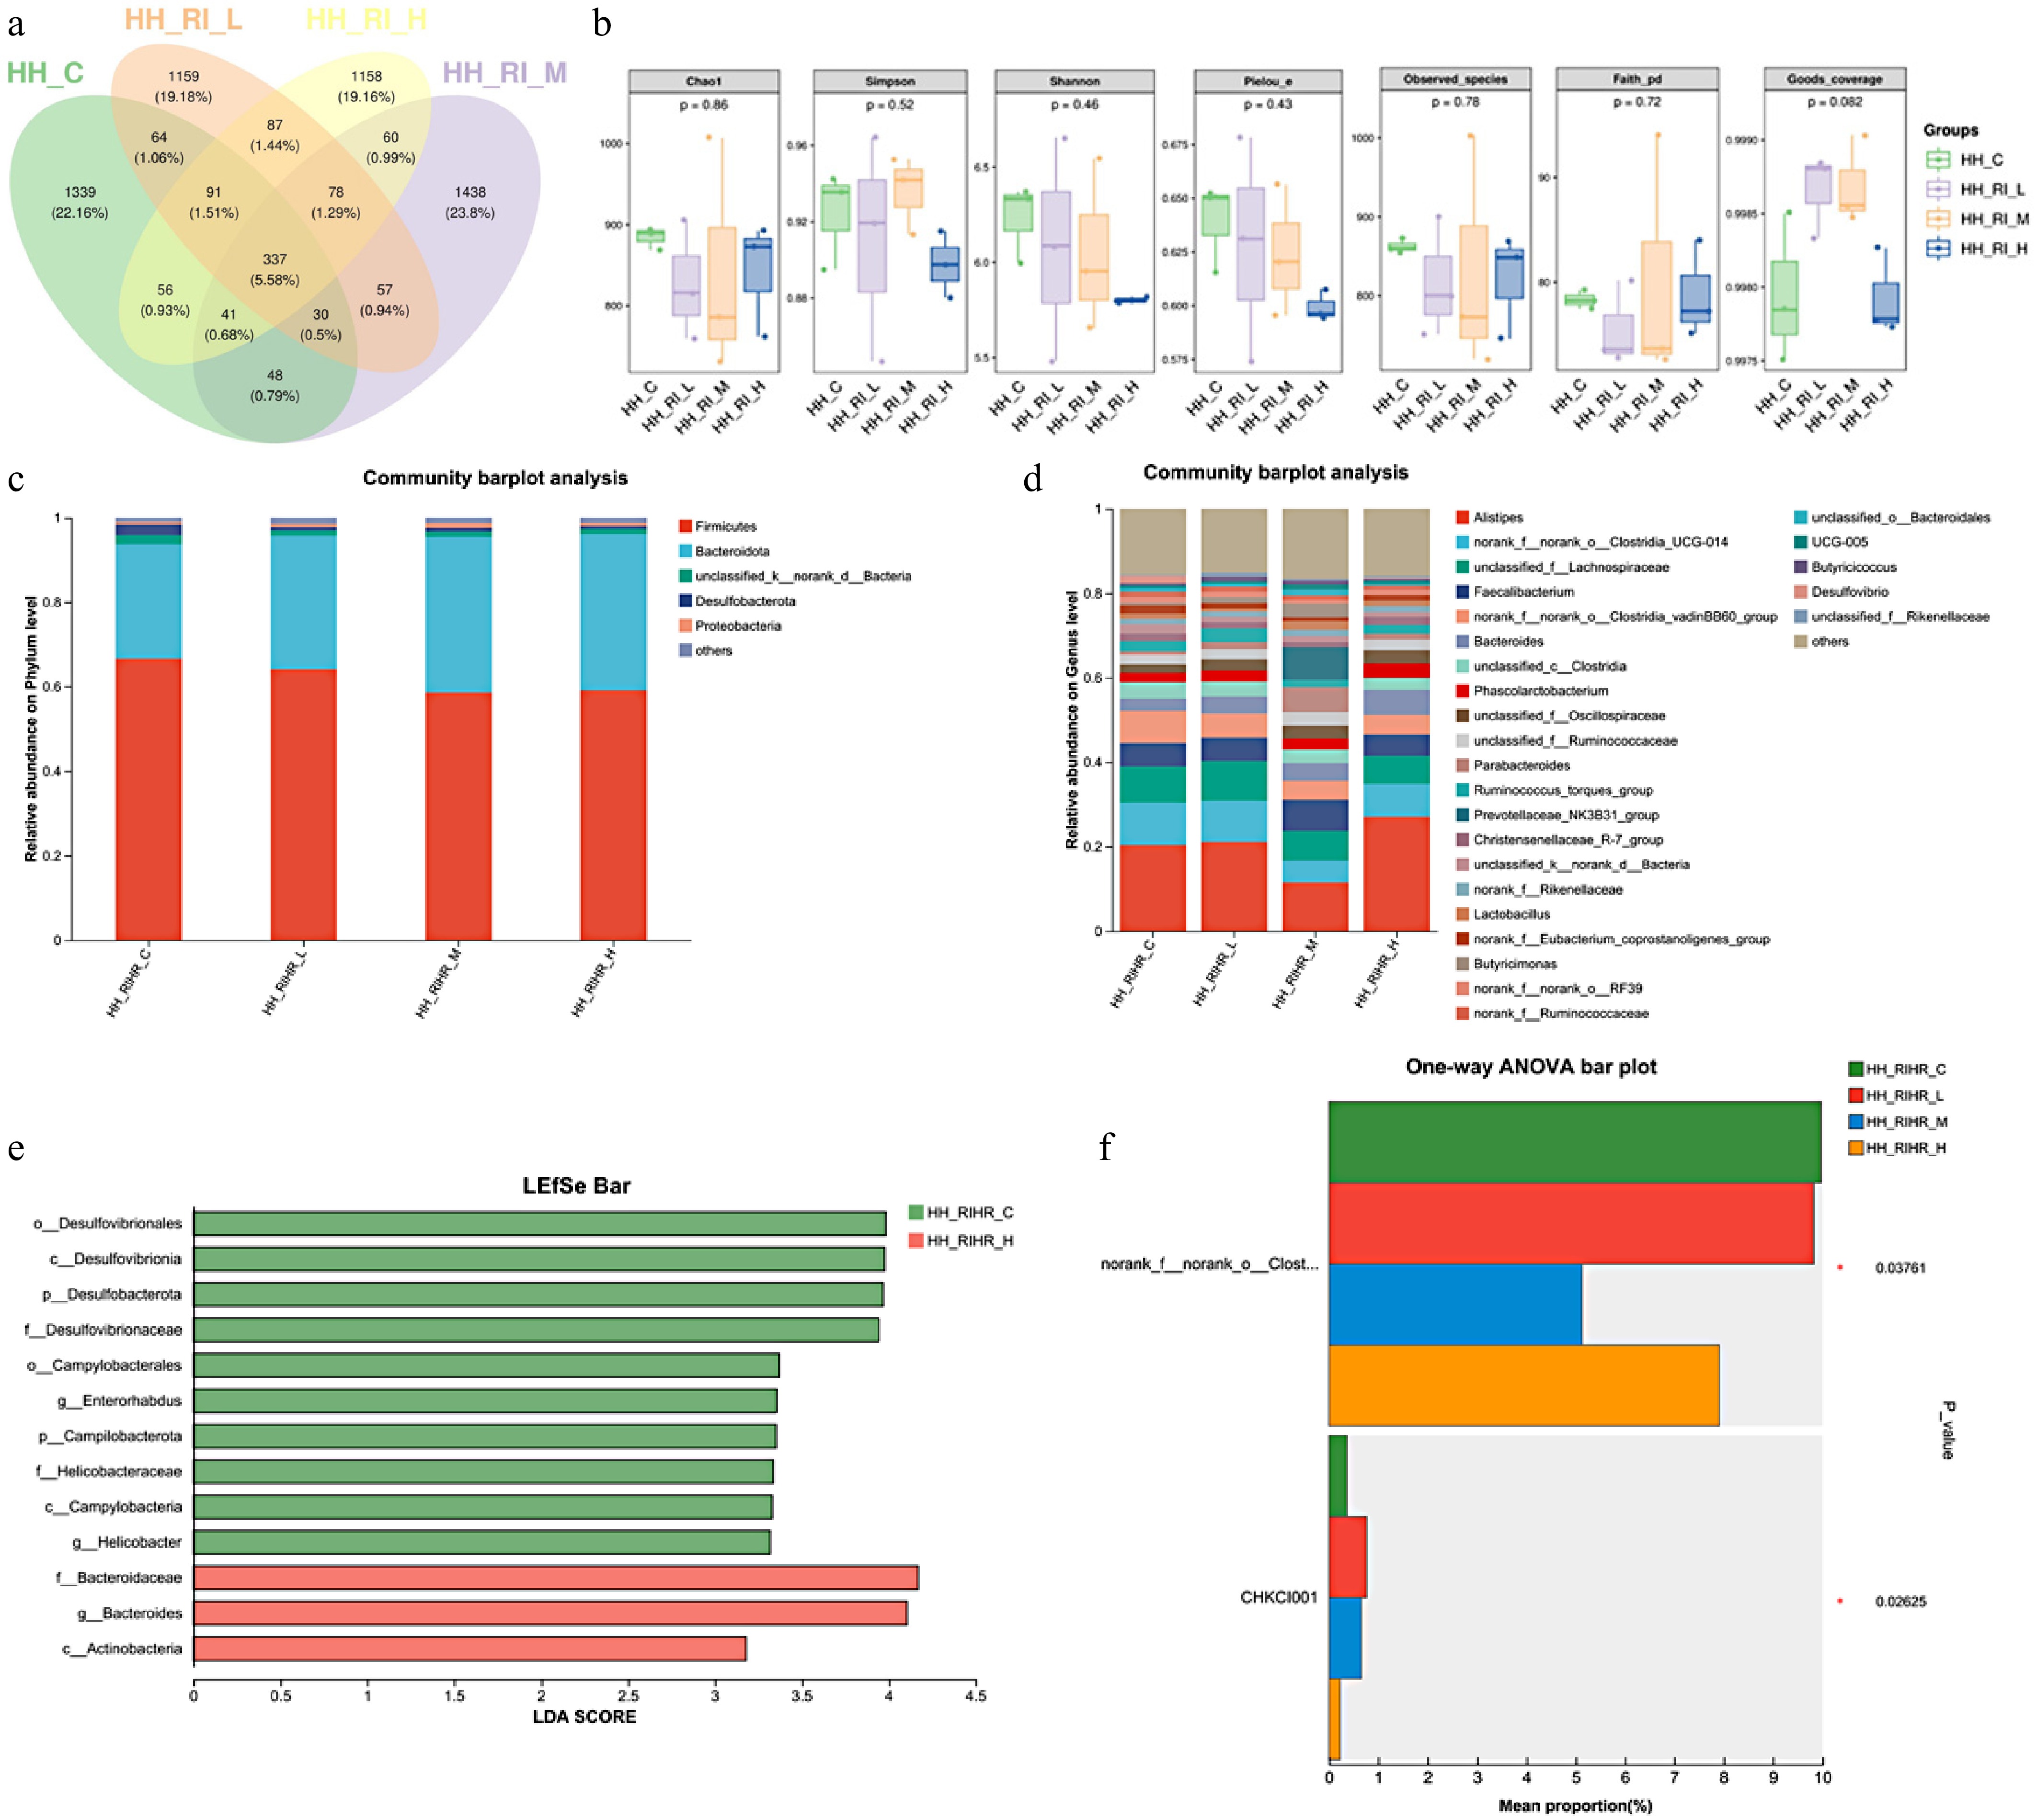
Figure 3.
Effect of RIHR on hindgut microflora of 42-day-old broilers. (a) Venn diagram community analysis of hindgut microbiota. (b) Alpha diversity index analysis of hindgut microbiota among groups. (c) Bar chart of species composition at the phylum level for each group. (d) Bar chart of species composition at the genus level for each group. (e) LEfSe multi-level species differential discrimination analysis. (f) Inter-group species differential analysis. * In the figure indicates a significant difference (p < 0.05), while no * indicates no significant difference (p > 0.05).
-
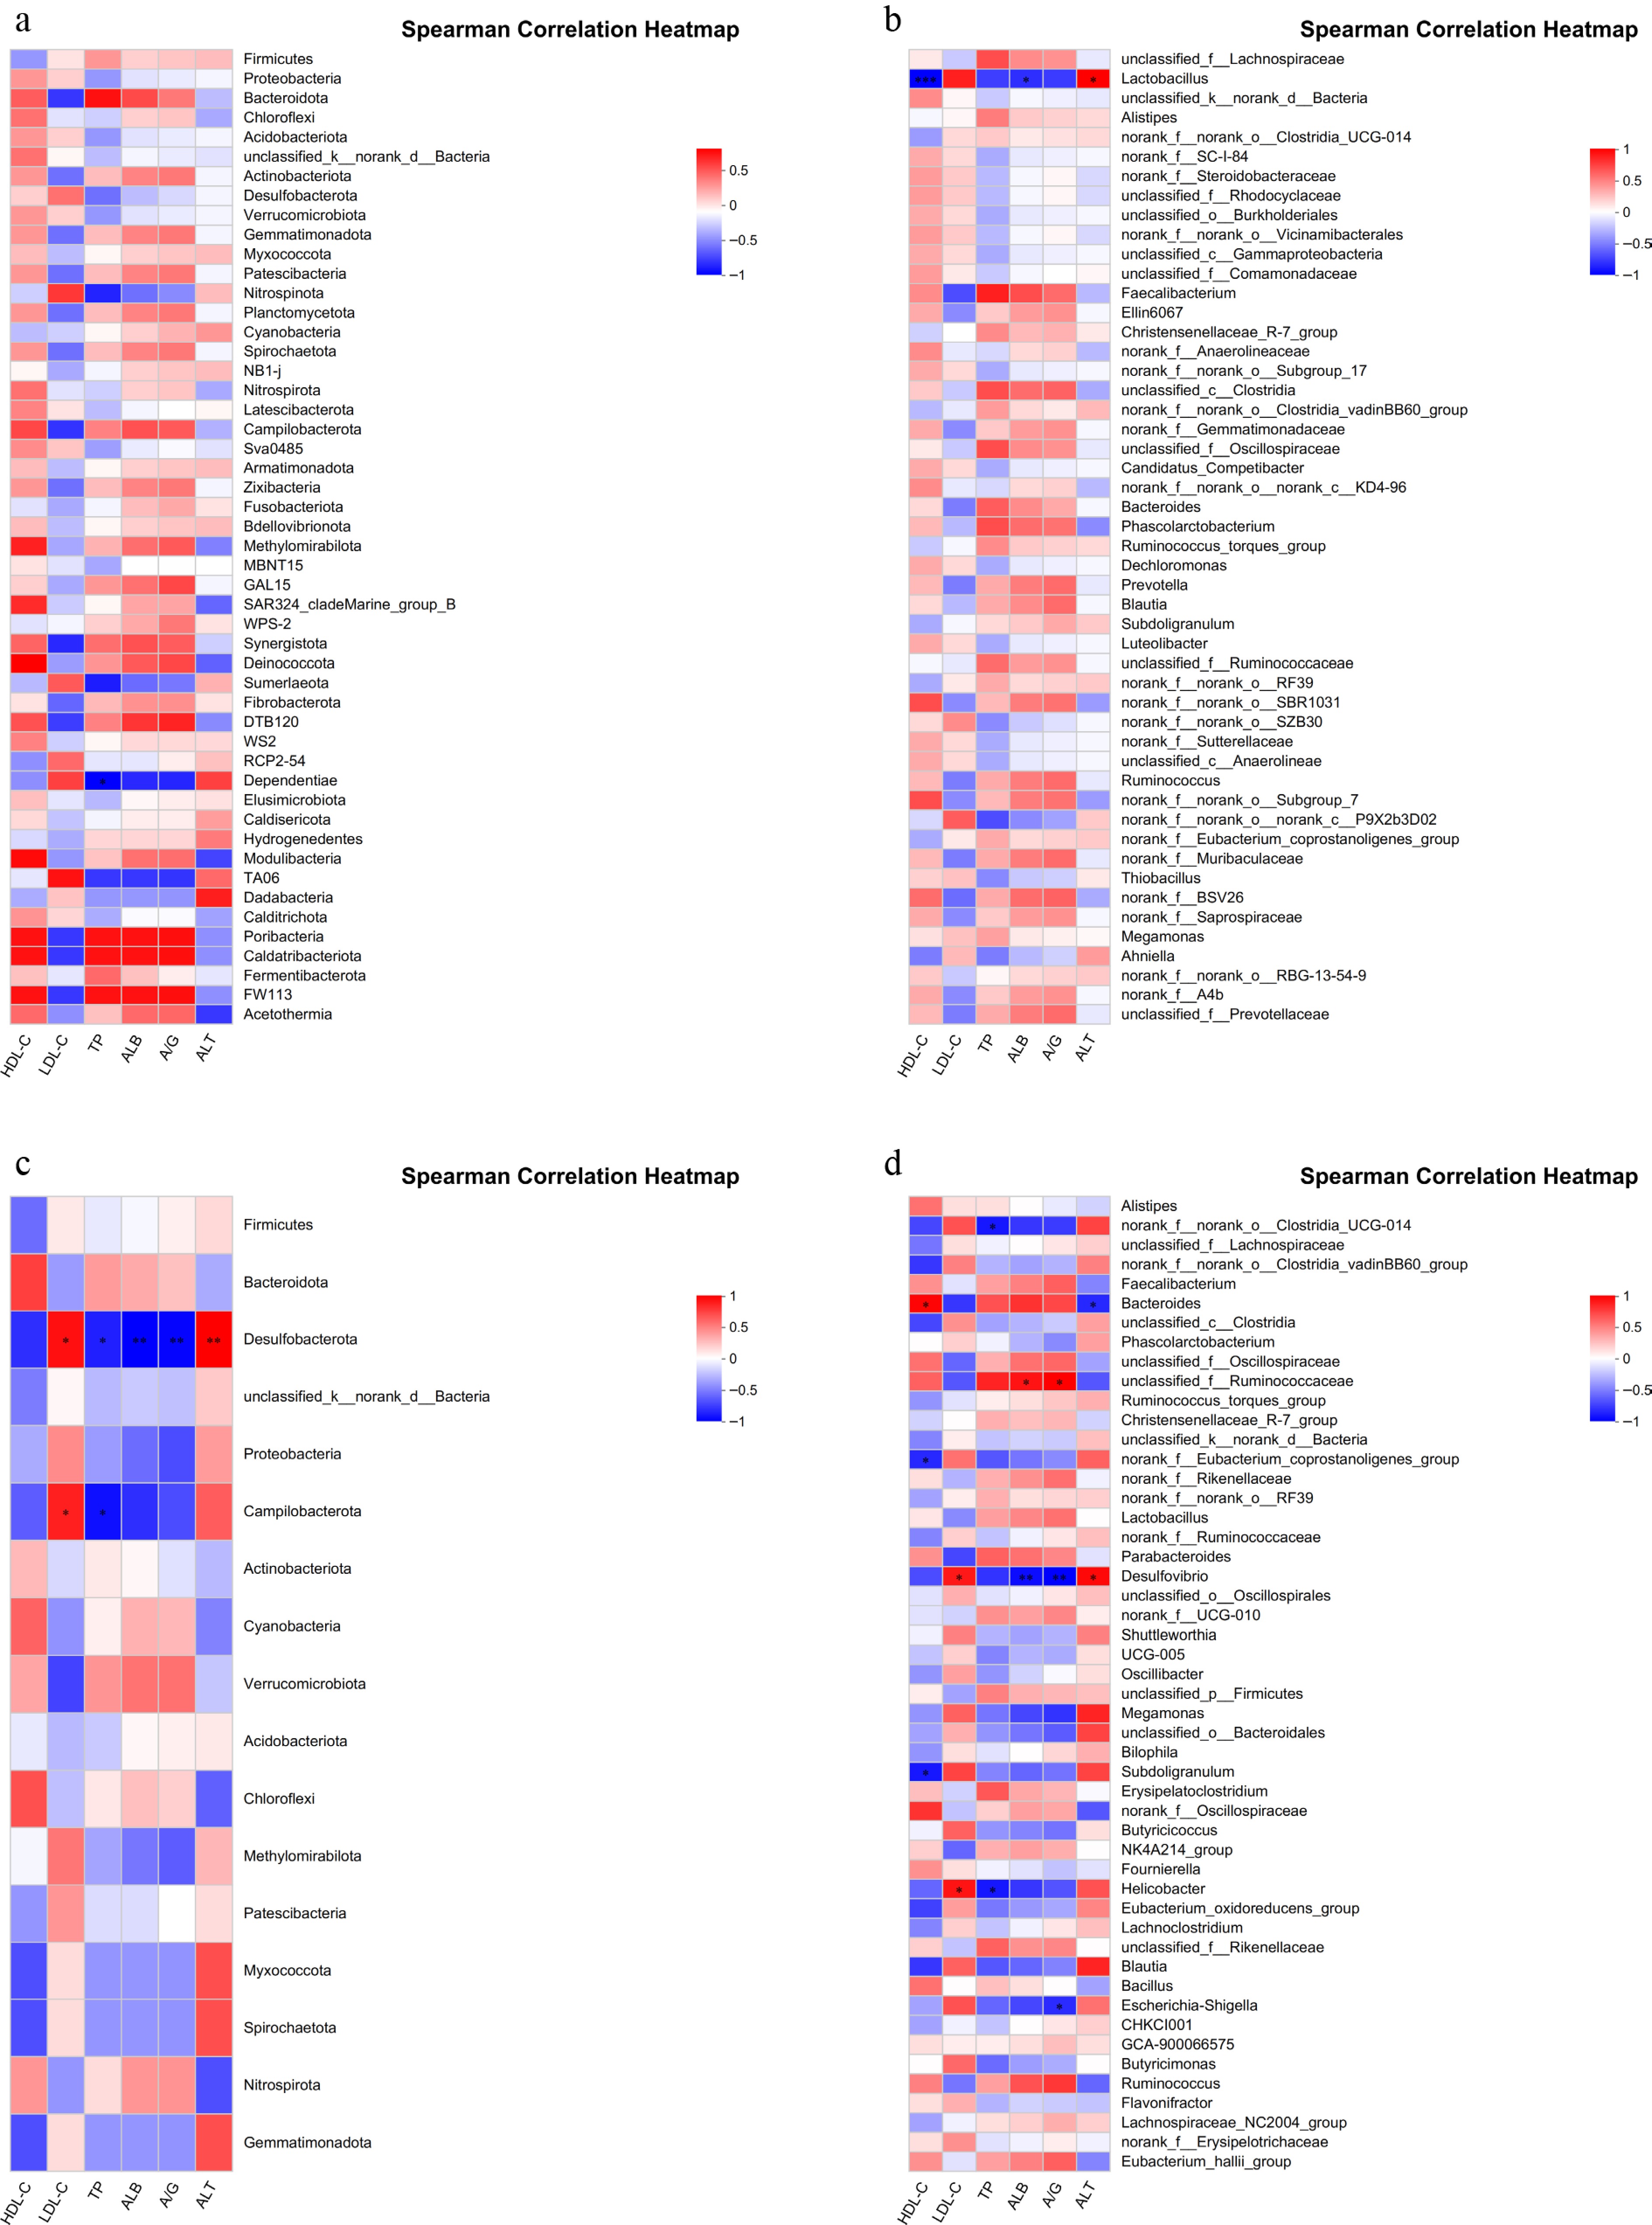
Figure 4.
Correlation analysis of gut microbes with metabolome. (a) Correlation analysis between foregut microbiota at the phylum level and serum biochemistry. (b) Correlation analysis between foregut microbiota at the genus level and serum biochemistry. (c) Correlation analysis between hindgut microbiota at the phylum level and serum biochemistry. (d) Correlation analysis between hindgut microbiota at the genus level and serum biochemistry. * Indicates significant difference (p < 0.05), ** and *** indicate extremely significant differences (p < 0.01).
-
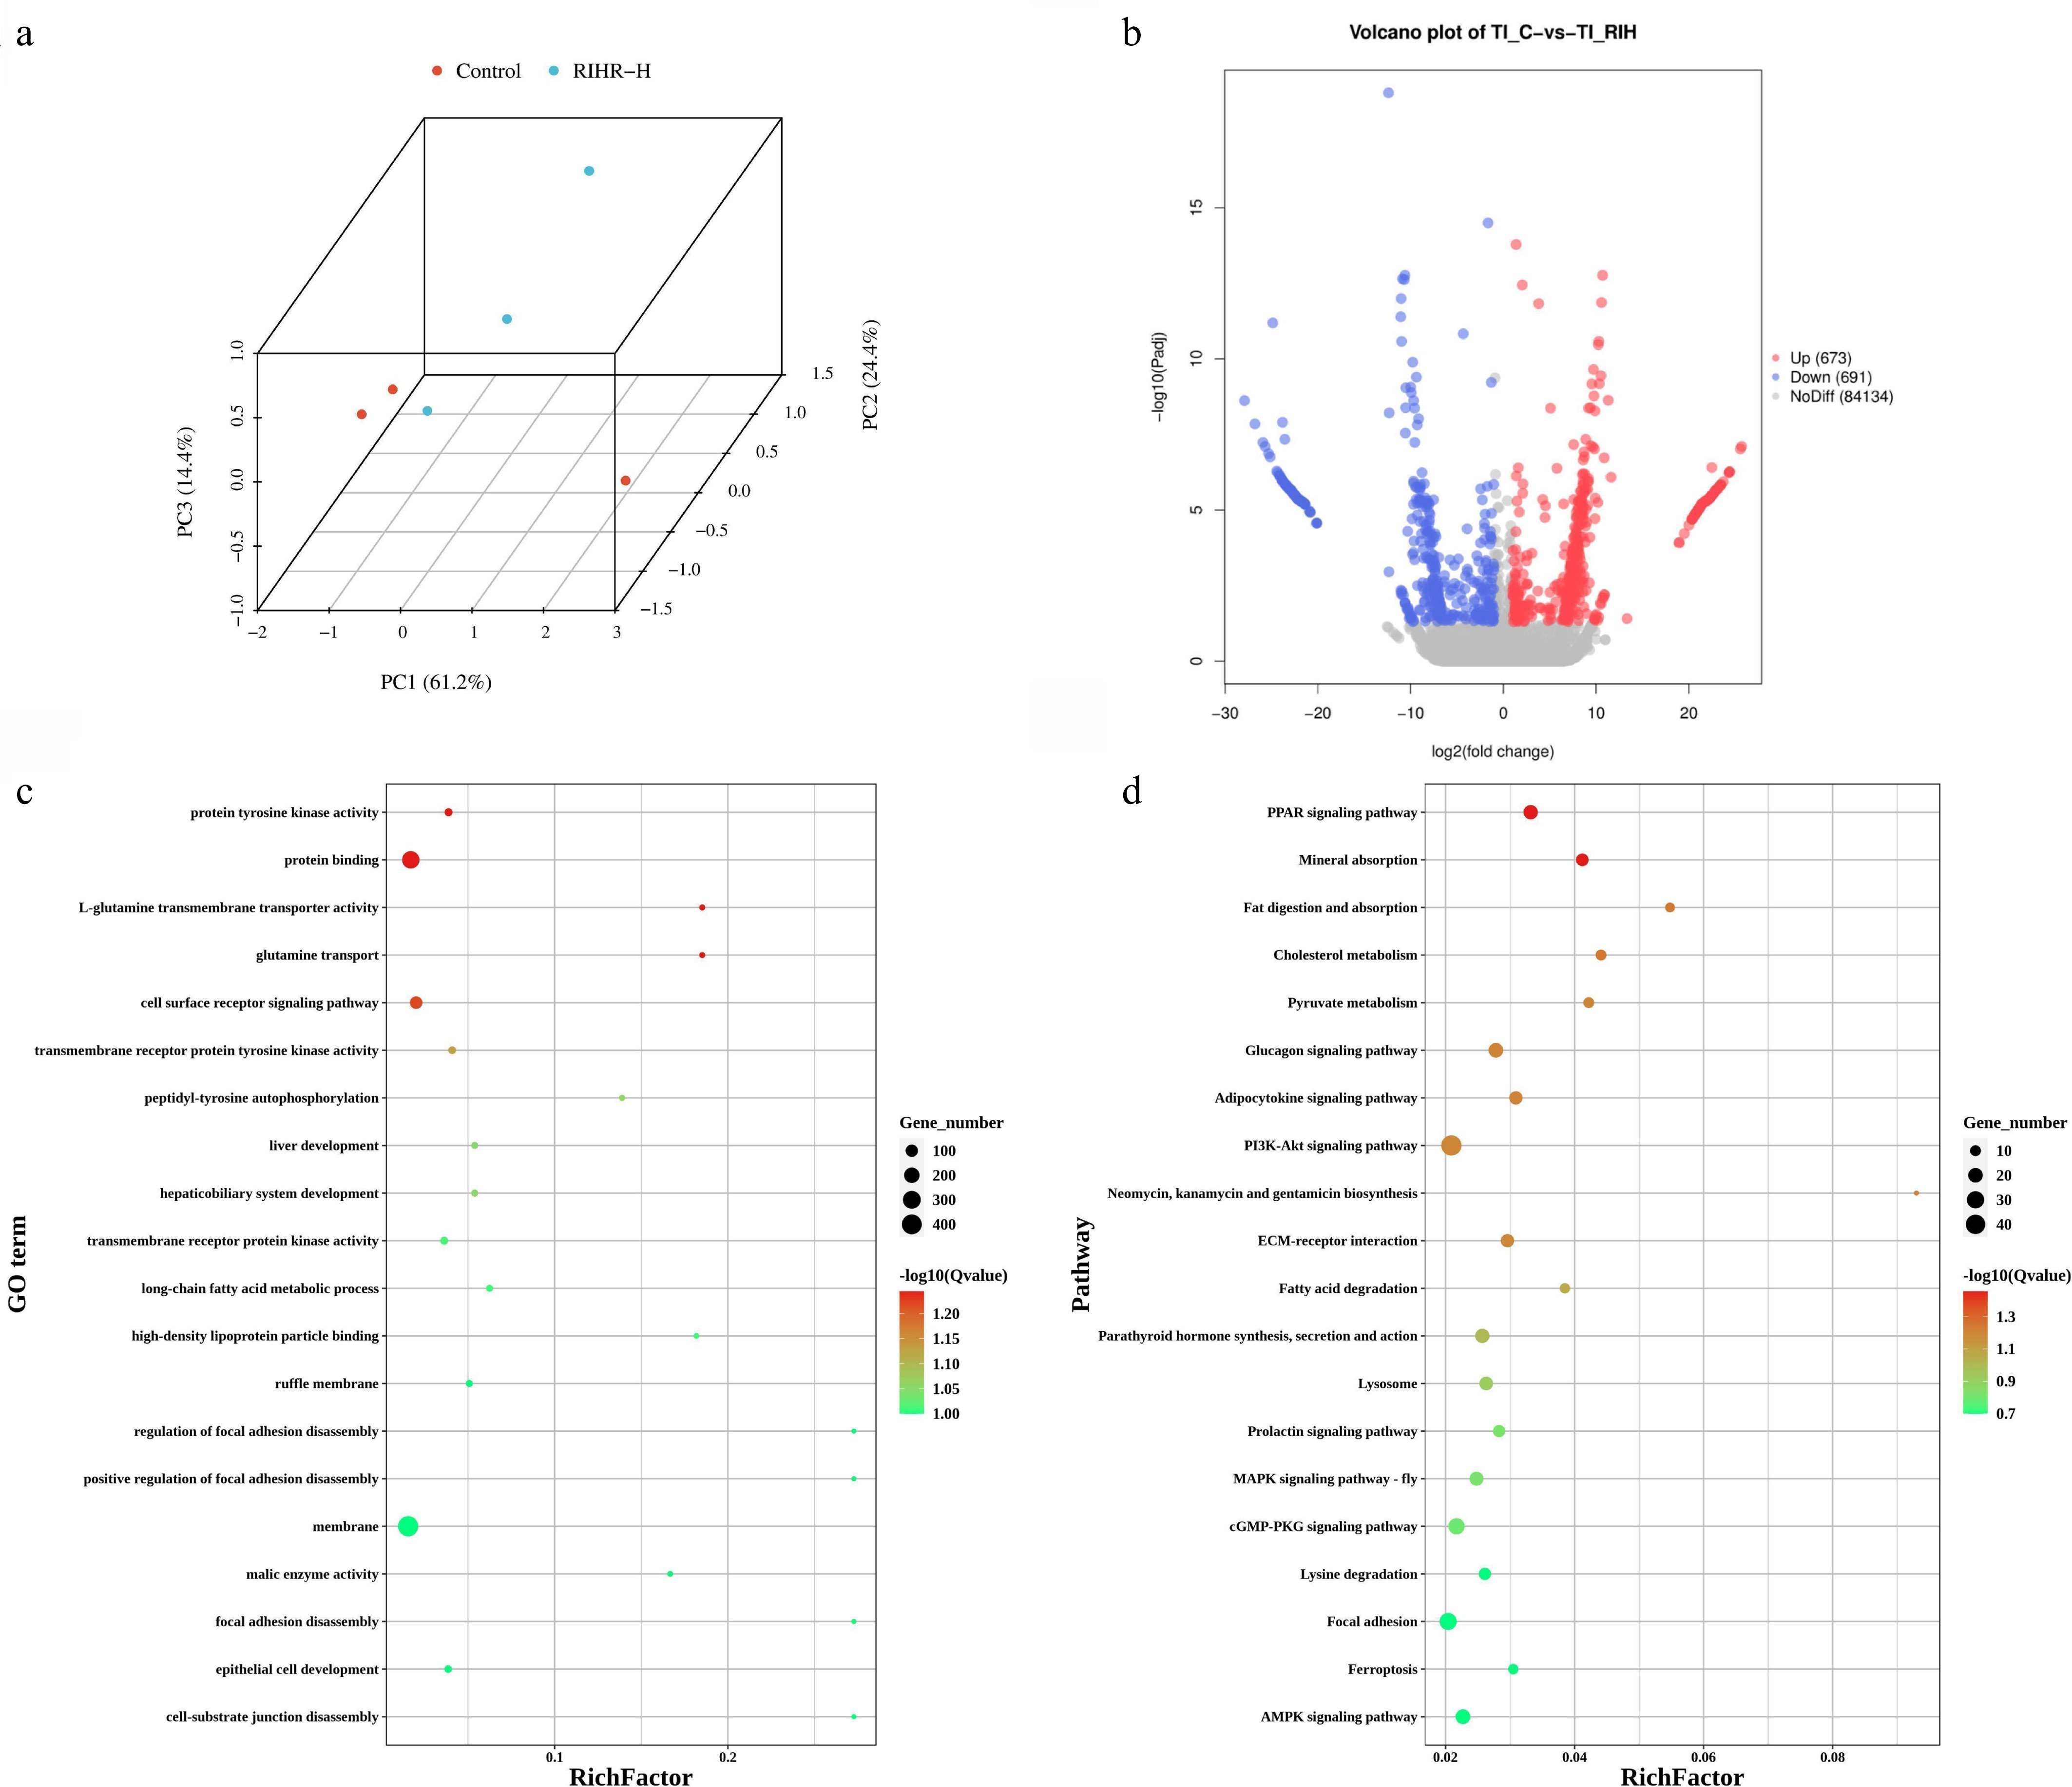
Figure 5.
Transcriptomic analysis of the intestine from 42-day-old broiler chickens. (a) 3D PCA of the ileum from the control (TI-C) and RIHR-H (TI-RIHR) groups. (b) Volcano plot analysis of DEGs isoforms in the ileum from the control (TI-C) and RIHR-H (TI-RIHR) groups. Each point in the volcano plot represents a gene isoform, with blue points indicating downregulated genes, red points indicating upregulated genes, and gray points representing genes with no significant differences. (c) GO enrichment analysis of DEGs in the ileum from the control (TI-C) and RIHR-H (TI-RIHR) groups. (d) KEGG pathway enrichment analysis of DEGs in the ileum from the control (TI-C) and RIHR-H (TI-RIHR) groups.
-
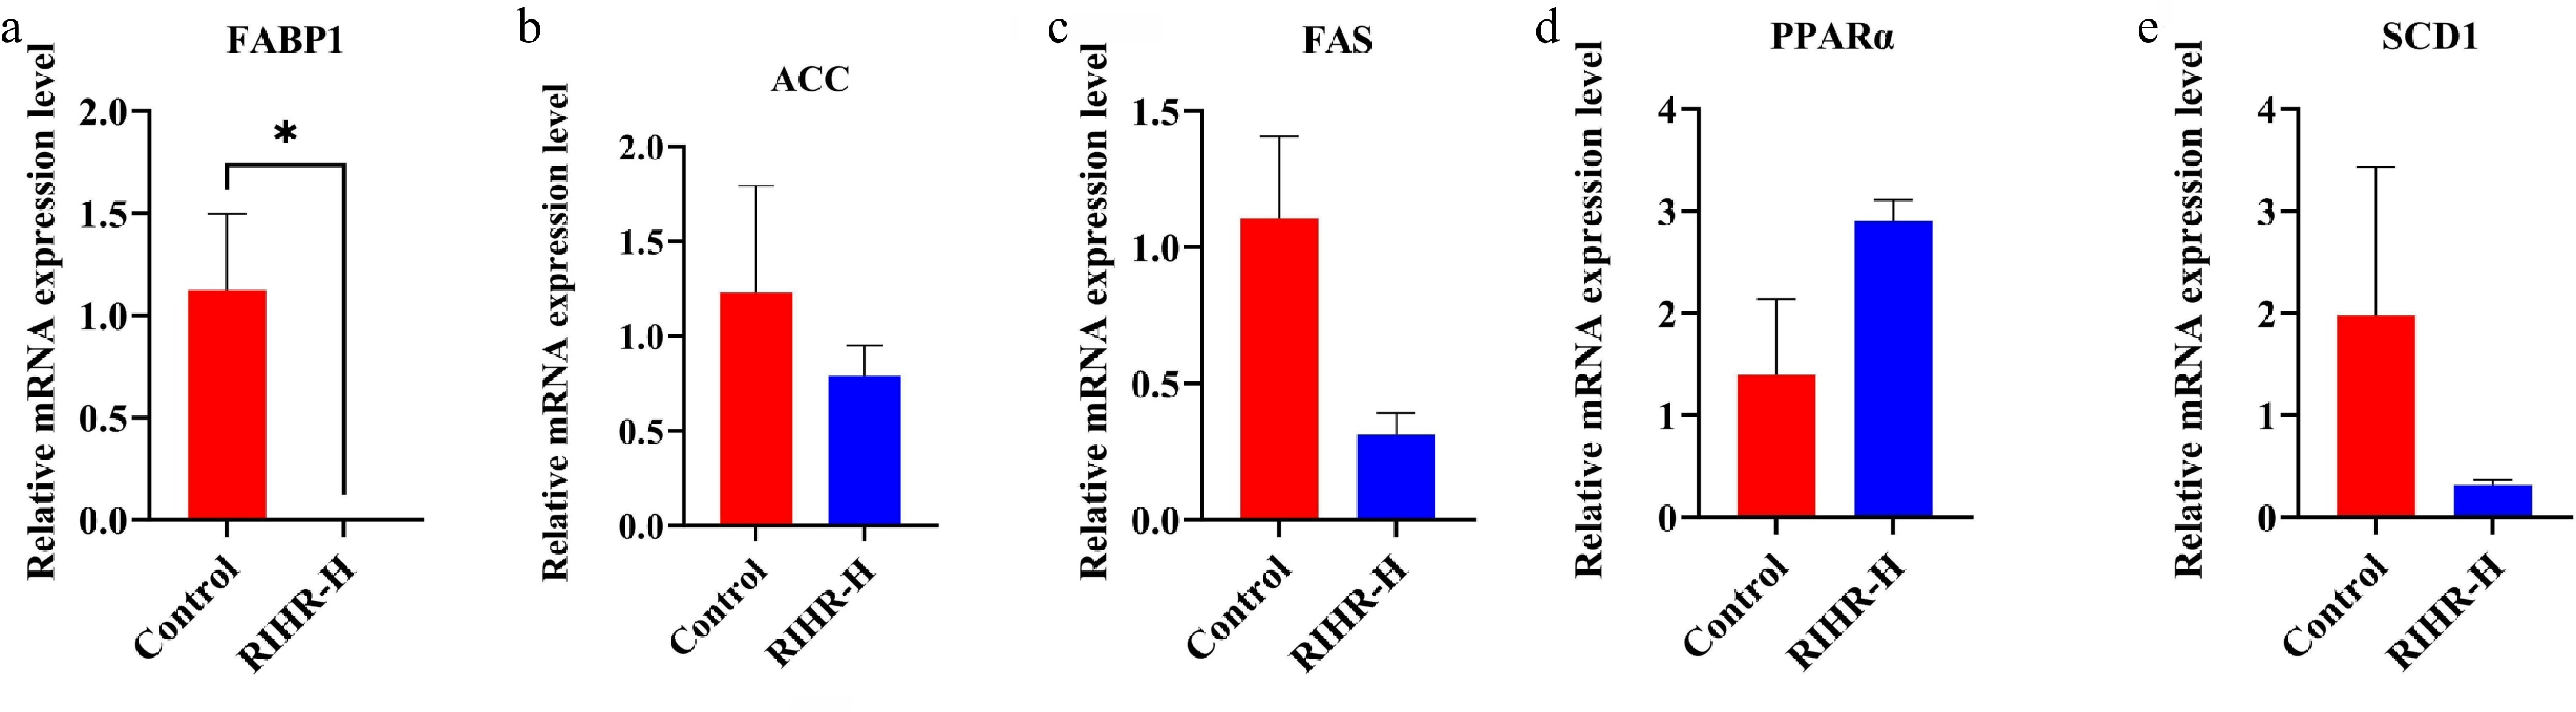
Figure 6.
RT-PCR validation of RIHR on PPAR expression in ileum. (a) FABP1, (b) ACC, (c) FAS, (d) PPARα, and (e) SCD1. * In the figure indicates a significant difference (p < 0.05), while no * indicates no significant difference (p > 0.05).
-
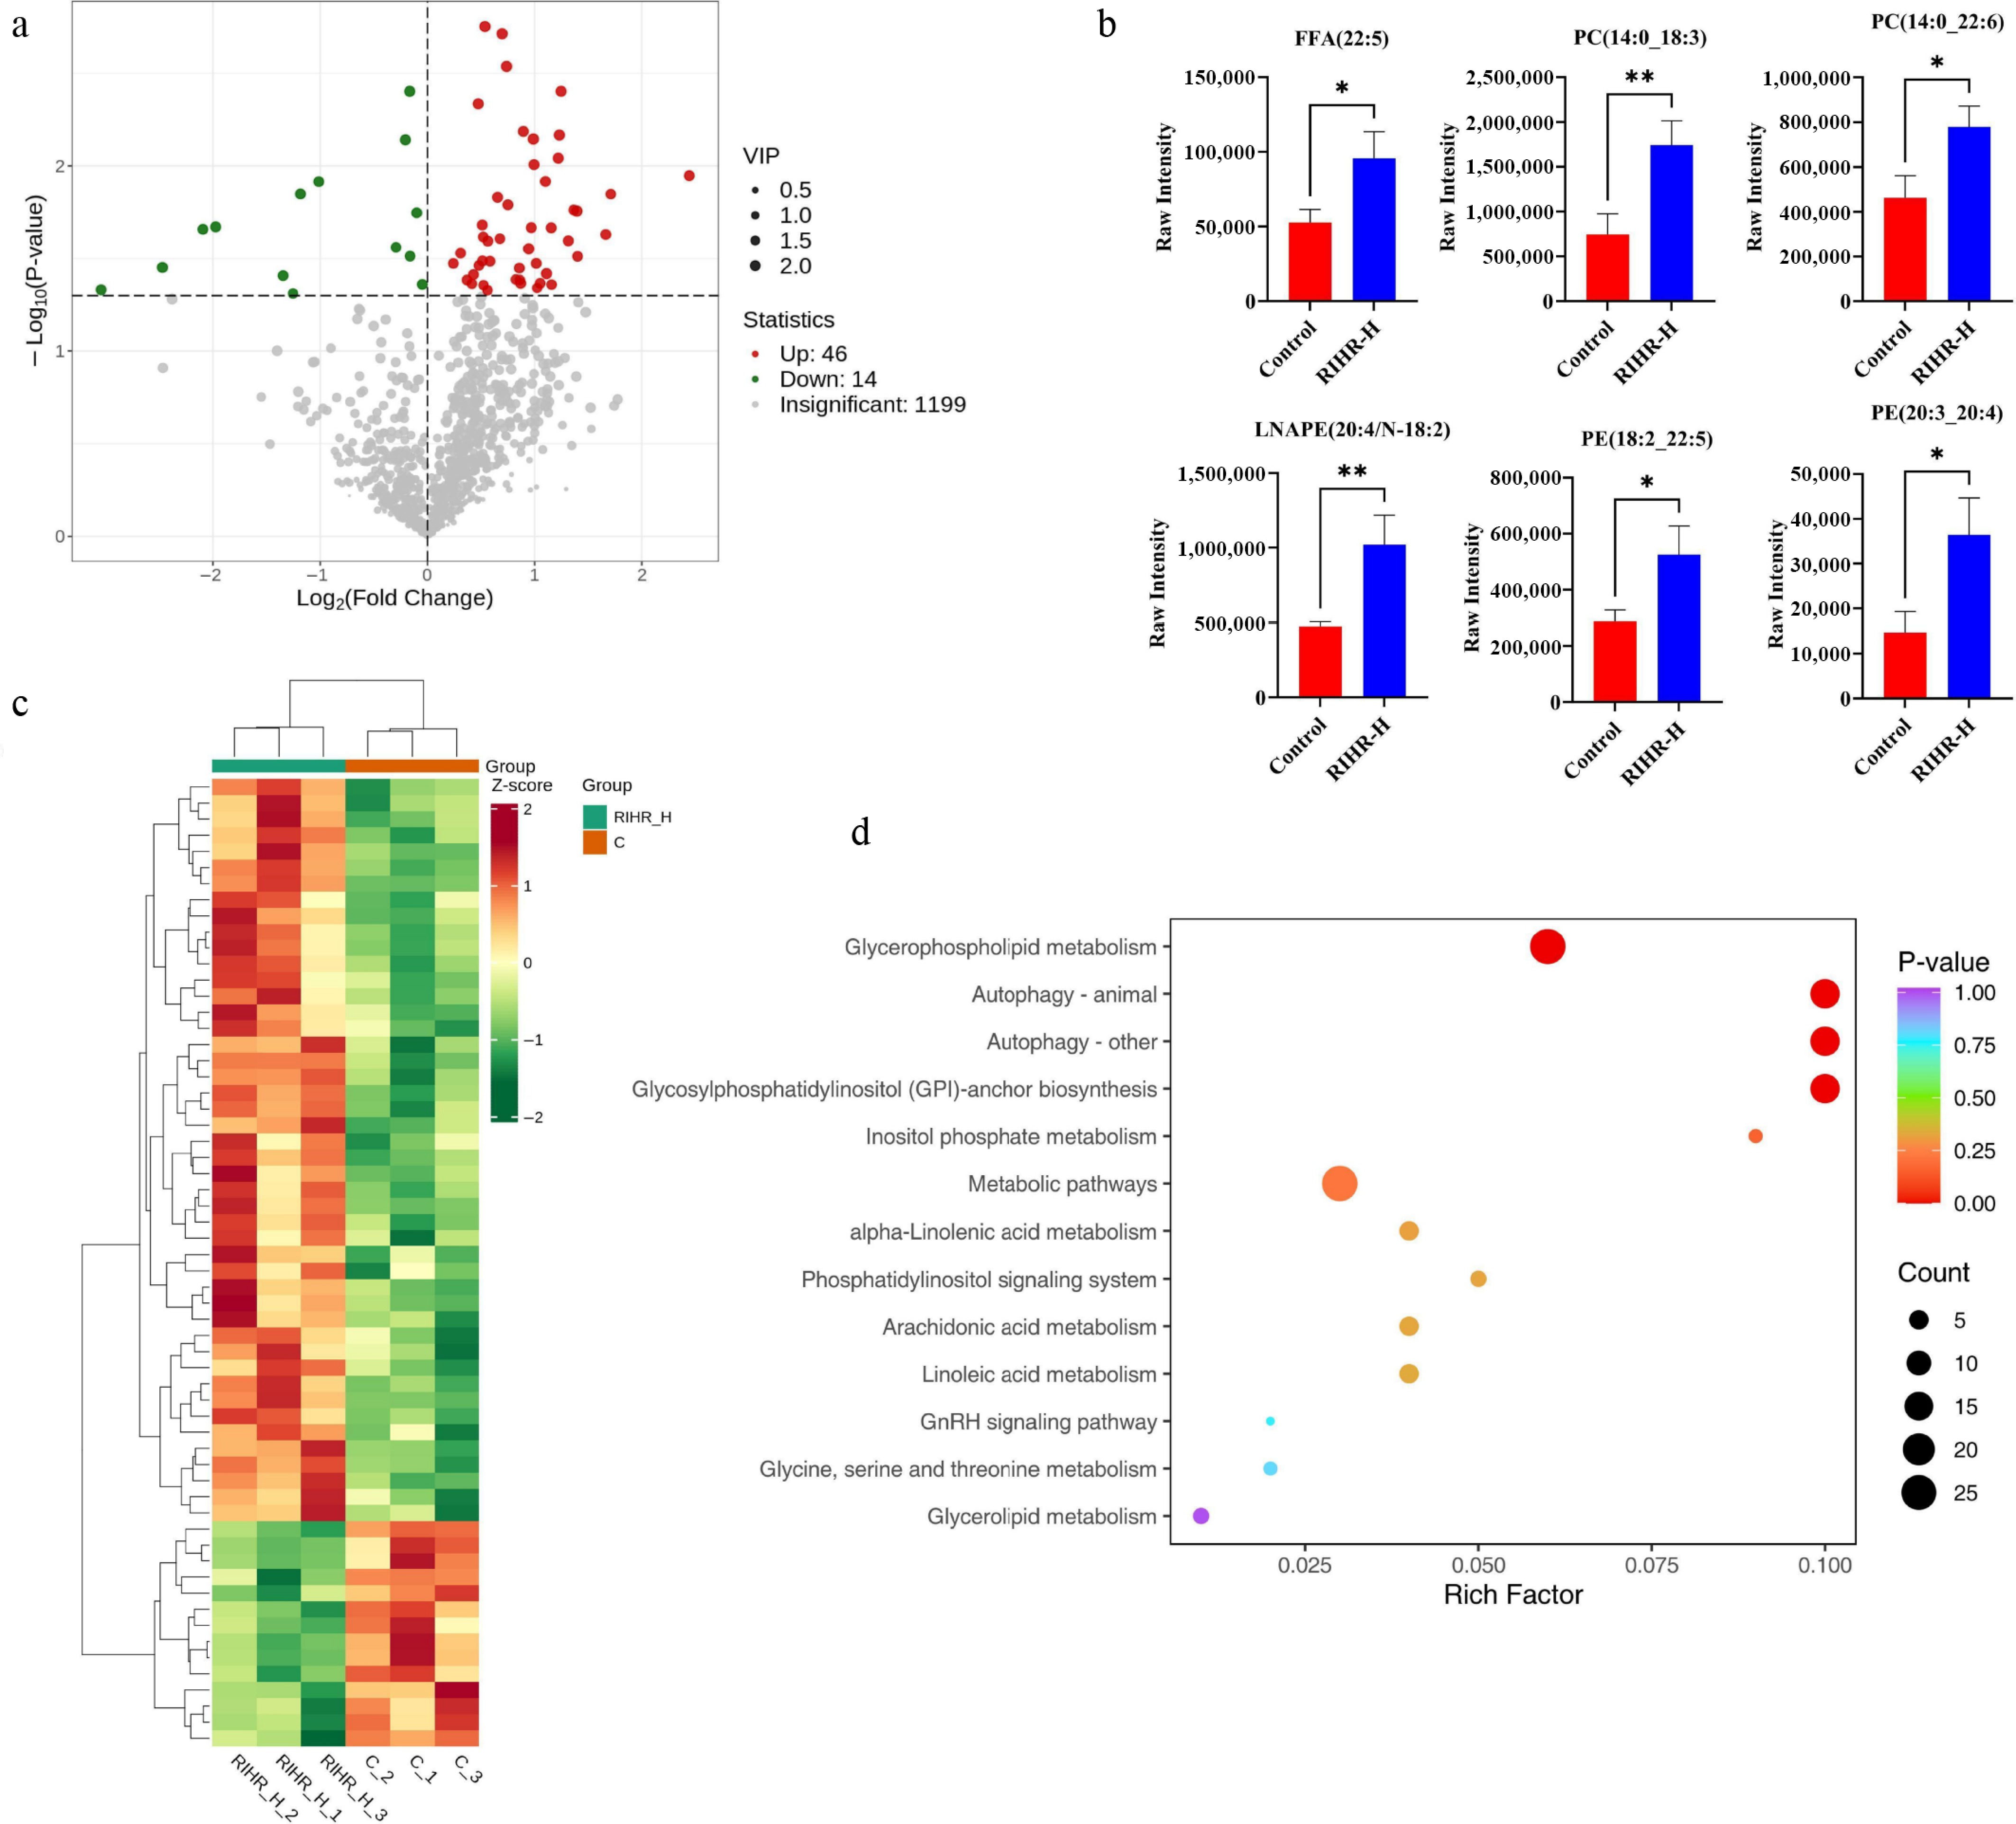
Figure 7.
Metabolomic analysis of breast muscle of broiler chickens at 42 d of age. (a) Volcano plot of differential lipids in breast muscle between the control and RIHR-H groups; green points represent downregulated differential lipids, red points represent upregulated differential lipids, and gray points indicate lipids that were detected but not significantly different. (b) Bar chart of DMs in breast muscle. (c) Cluster heatmap of DMs in breast muscle.(d) KEGG enrichment analysis of DMs in breast muscle.
-
Items Diets Phase 1
(d 1−21)Phase 2
(d 22−42)Ingredients Wheat middling and reddog 11.20 10.00 Corn protein powder 4.30 3.00 Soybean oil 2.00 4.95 DL- Met 0.19 0.15 Soybean meal 30.35 27.77 Corn 47.25 49.90 Limestone 1.62 1.49 CaHPO4·2H2O 1.44 1.24 NaCl 0.30 0.30 L- Lys 0.35 0.20 Premix1 1.00 1.00 Total 100.00 100.00 Nutrient levels2 Crude fiber (CF) 3.82 3.60 Met + Cys 0.89 0.79 Calcium (Ca) 1.00 0.90 Crude protion(CP) 21.01 19.01 Metabolizable energy (ME, MJ/kg) 12.14 12.96 Methionine (Met) 0.55 0.47 Lysine (Lys) 1.33 1.13 Total P 0.70 0.65 Available P 0.43 0.38 1 The premix was formulated to supply the complete diet with the following levels of micronutrients (per kg of feed): 12,000 IU of vitamin A, 2,500 IU of vitamin D3, 20 mg of vitamin E, 3 mg of vitamin K3, 3 mg of vitamin B1, 8 mg of vitamin B2, 7 mg of vitamin B6, 0.03 mg of vitamin B12, 20 mg of D-pantothenic acid, 50 mg of nicotinic acid, 0.1 mg of biotin, 1.5 mg of folic acid, 9 mg of copper (from copper sulfate), 110 mg of zinc (from zinc sulfate), 100 mg of iron (from ferrous sulfate), 100 mg of manganese (from manganese sulfate), 0.16 mg of selenium (from sodium selenite), and 0.6 mg of iodine (from potassium iodide). 2 The nutritional level is a calculated value. Table 1.
Ingredients and nutrient levels of the experimental basal diets (on an air-dried basis, %).
-
Gene name Sequence Accession number β-actin F: ATGATGATATTGCTGCGCTCGT NM_205518.2 R: CCCATACCAACCATCACACCCT FABP1 F: AGAGAGCTTTCCATCATGAGC NM_204192.4 R: TTATAGCAACAGCAAAGAGGTTT ACC F: TCCAGCAGAACCGCATTGACAC NM_205505.2 R: GTATGAGCAGGCAGGACTTGGC SCD1 F: GCCTTCCAGAATGACATCTATG XM_010889078.5 R: AAATCACTCAGGTCCAGCTTC FAS F: AATCTGCCGTCTGGAACTGAATGG XM_032706323. 1 R: CATCCTGTGACTGGTCGTGTTCTC PPARα F: ACCAGCATCCAGTCCTTCATCC XM_063395323.1 R: TTCACAAGCATGTACTCCGTAATGG Table 2.
Primer sequence information.
-
Items Group p-value Control RIHR-L RIHR-M RIHR-H ADG (g/d) 43.38 ± 3.15 45.71 ± 0.83 44.42 ± 2.58 47.93 ± 2.47 0.596 ADFI (g/d) 62.12 ± 3.4 68.34 ± 1.26 72.60 ± 3.71 69.29 ± 1.64 0.126 FCR 1.44 ± 0.04 1.50 ± 0.05 1.64 ± 0.09 1.45 ± 0.04 0.149 Values marked with different lowercase letters within a row differ significantly (p < 0.05), while sharing a letter or having no mark denotes a lack of significant difference (p > 0.05). Table 3.
Effects of RIHR on the growth performance.
-
Items Group p-value Control RIHR-L RIHR-M RIHR-H Slaughter rate (%) 92.35 ± 2.13 94.33 ± 0.40 94.51 ± 0.84 93.92 ± 0.68 0.594 Eviscerated rate (%) 74.86 ± 2.48 76.62 ± 0.99 75.13 ± 0.31 75.05 ± 0.90 0.805 Semi-eviscerated rate (%) 86.40 ± 2.18 88.46 ± 0.78 88.20 ± 0.61 87.58 ± 0.34 0.639 Abdominal fat rate (%) 1.22 ± 0.47 1.33 ± 0.32 0.79 ± 0.25 1.37 ± 0.10 0.185 Table 4.
Effect of RIHR on the slaughter performance.
-
Items Group p-value Control RIHR-L RIHR-M RIHR-H Shear force (N) 21.47 ± 1.46 26.24 ± 2.47 22.07 ± 5.38 20.64 ± 0.86 0.602 Cooking loss rate (%) 12.48 ± 1.76 12.55 ± 1.64 11.64 ± 1.56 10.26 ± 1.29 0.718 Drip loss rate (%) 0.13 ± 0.10 0.12 ± 0.03 0.12 ± 0.21 0.76 ± 0.19 0.316 pH45min 6.53 ± 0.21 6.21 ± 0.08 6.19 ± 0.11 6.67 ± 0.11 0.127 pH24h 5.71 ± 0.13 5.77 ± 0.99 5.83 ± 0.12 5.80 ± 0.04 0.815 Lightness (L*) 41.13 ± 2.47 41.59 ± 2.79 42.06 ± 0.52 39.85 ± 3.47 0.935 Redness (a*) 2.40 ± 0.36 2.22 ± 1.14 3.38 ± 1.71 3.89 ± 1.71 0.815 Yellowness (b*) 2.83 ± 0.28 2.81 ± 0.38 3.47 ± 0.25 4.00 ± 0.99 0.423 Springiness (mm) 1.89 ± 0.09 1.72 ± 0.11 2.33 ± 0.43 2.19 ± 0.18 0.310 Gumminess (N) 6.27 ± 1.87 6.77 ± 0.98 8.06 ± 1.05 17.01 ± 6.59 0.181 Chewiness (mj) 12.17 ± 3.93 11.40 ± 0.93 18.10 ± 2.40 36.87 ± 14.81 0.150 Table 5.
Effect of RIHR on the meat quality.
-
Items Group p-value Control RIHR-L RIHR-M RIHR-H IP (mmol/L) 3.15 ± 0.19 3.15 ± 0.98 3.06 ± 0.14 2.91 ± 0.15 0.626 Ca (mmol/L) 2.75 ± 0.10 2.49 ± 0.32 2.64 ± 0.11 2.55 ± 0.99 0.230 ALT (U/L) 4.84 ± 0.97 5.79 ± 1.92 3.35 ± 0.44 3.33 ± 0.56 0.226 AST (U/L) 511.98 ± 44.30 480.54 ± 36.14 510.48 ± 51.33 463.13 ± 36.15 0.814 TP (g/L) 34.65 ±
2.89b43.43 ±
1.08a45.07 ±
3.23a37.87 ±
1.84ab0.019 ALB (g/L) 9.05 ± 2.09b 18.02 ± 0.47a 19.15 ± 0.74a 17.41 ± 0.85a < 0.001 GLB (g/L) 25.43 ± 3.44 25.14 ± 1.06 25.86 ± 2.46 20.57 ± 1.15 0.331 A/G 0.42 ± 0.11b 0.72 ± 0.39a 0.76 ± 0.43a 0.86 ± 0.11a 0.001 GLU (mmol/L) 9.90 ± 0.41b 10.61 ± 0.91b 13.96 ± 0.77a 14.94 ± 0.94a < 0.001 UA(μmol/L) 318.00 ± 24.13 333.71 ± 28.85 422.43 ± 56.35 376.14 ± 61.89 0.392 TC (mmol/L) 3.56 ± 0.13 3.71 ± 0.32 4.43 ± 0.22 3.99 ± 0.23 0.071 TG (mmol/L) 0.81 ± 0.10 0.49 ± 0.05 0.52 ± 0.26 1.45 ± 0.98 0.489 HDL-C (mmol/L) 2.00 ± 0.16 2.40 ± 0.26 2.74 ± 0.22 2.28 ± 0.22 0.154 LDL-C (mmol/L) 2.43 ± 0.32a 0.50 ± 0.67b 0.83 ± 0.52b 0.71 ± 0.73b < 0.001 Note: Different lowercase letters in the same row indicate significant differences (p < 0.05), while the same letters or no letters indicate no significant differences (p > 0.05), the same below. Table 6.
Effect of RIHR on the serum biochemistry.
Figures
(7)
Tables
(6)