-
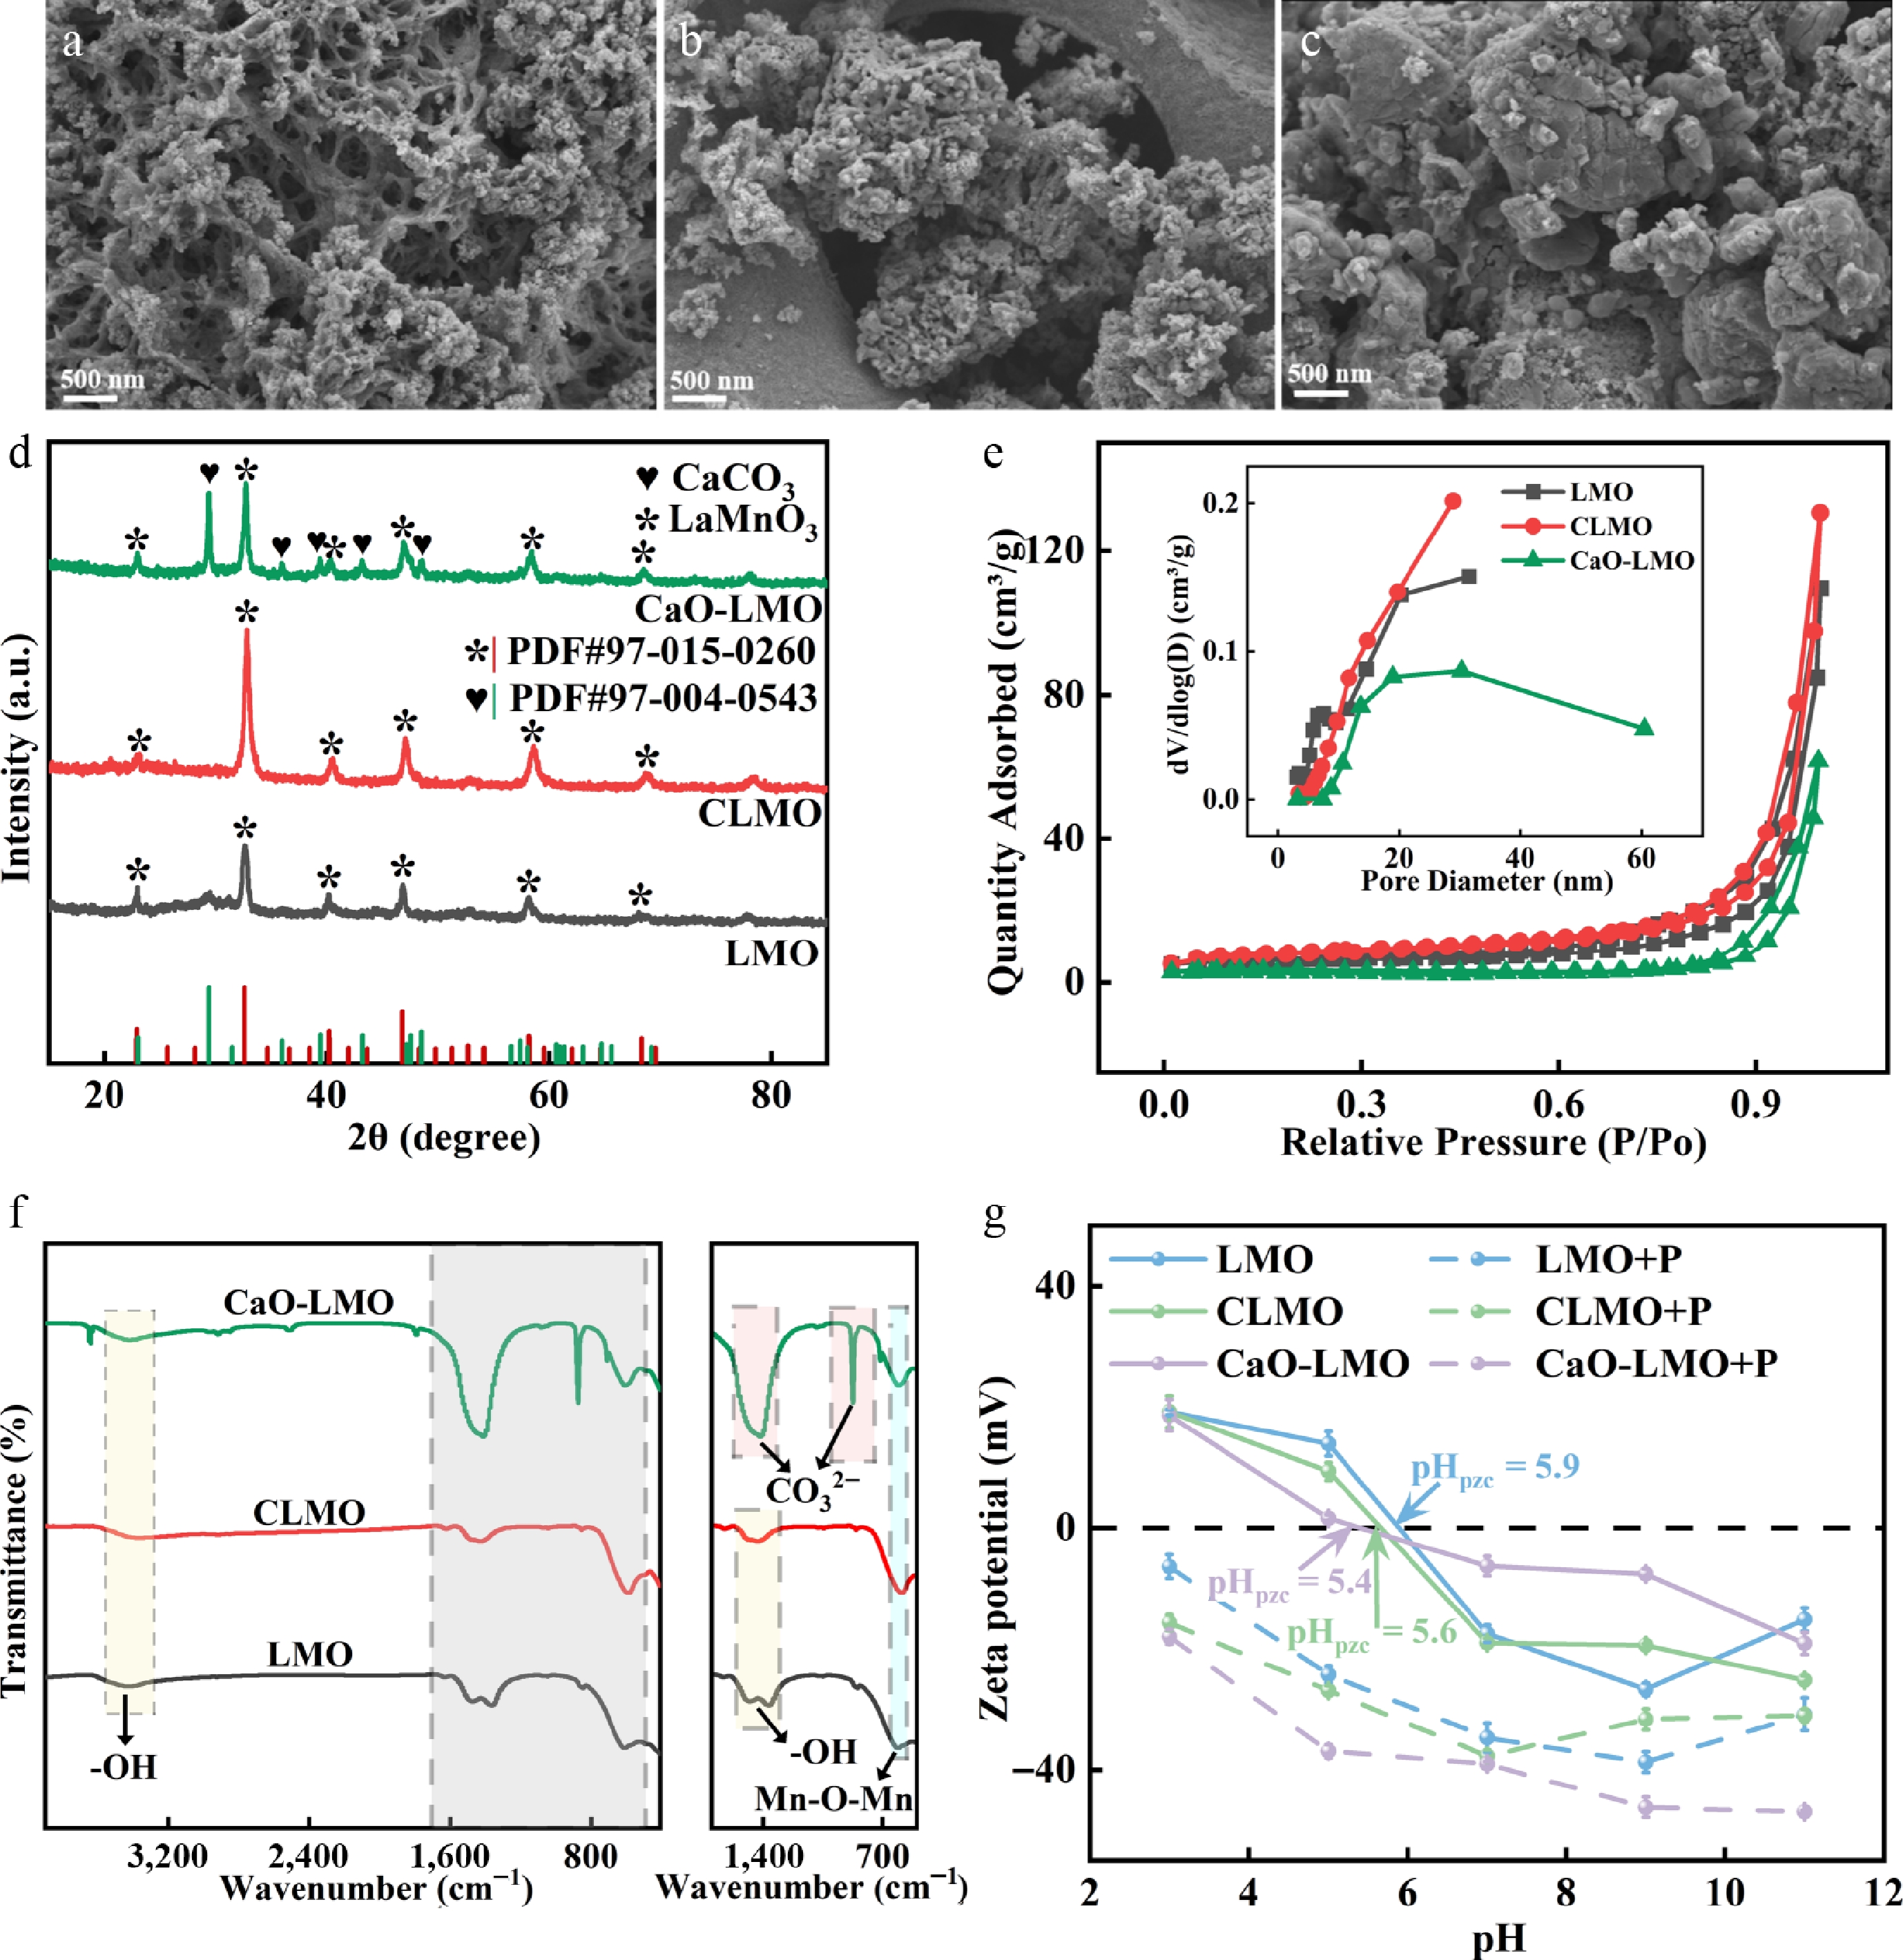
Figure 1.
Scanning electron microscopy patterns of (a) LMO, (b) CLMO, and (c) CaO-LMO. (d) XRD patterns of materials in the 2θ range from 15° to 85°. (e) N2 adsorption–desorption isotherm. (f) FTIR images covering the full range from 410 to 3,900 cm−1; the magnified view on the right-hand side ranges from 500 to 1,700 cm−1. (g) Zeta potential, for which the measurement points were set at pH 3, 5, 7, 9, and 11 (the solid line is the zeta potential before adsorption of phytic acid, and the dashed line is the zeta potential after adsorption of phytic acid).
-
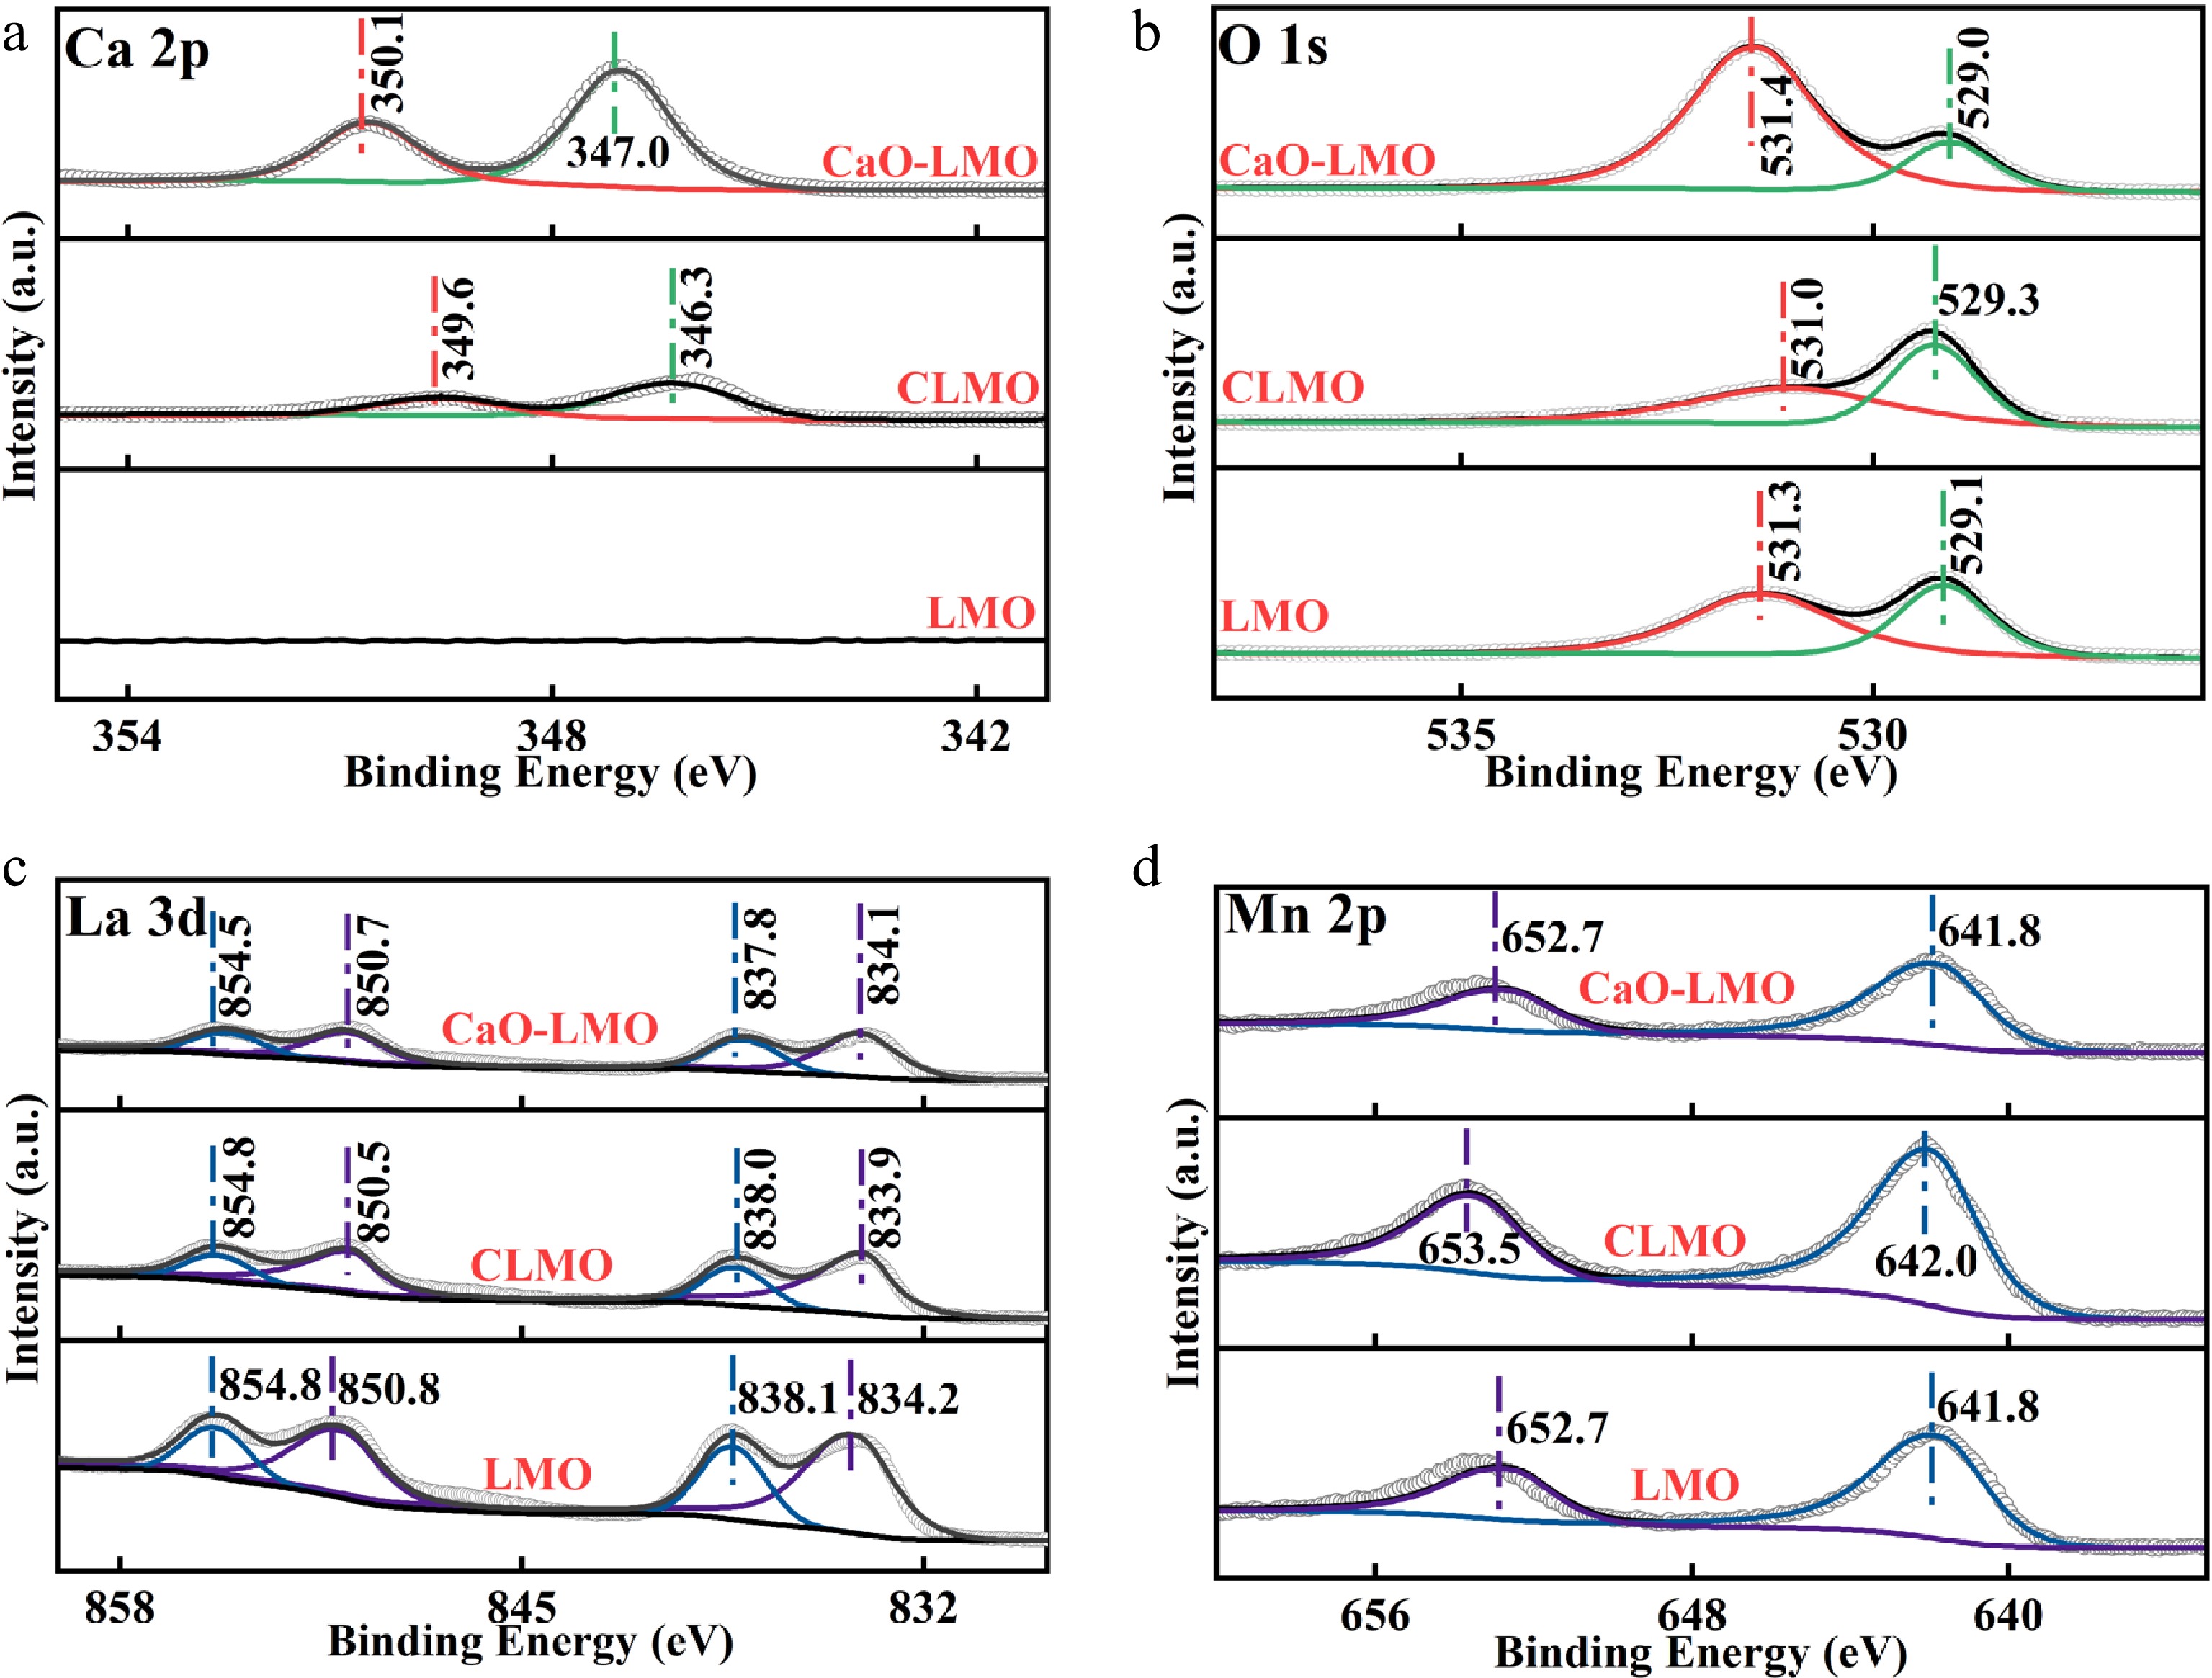
Figure 2.
XPS results for (a) Ca 2p, (b) La 3d, (c) Mn 2p, and (d) O 1s of the materials. All peaks were corrected by the C 1s peak (284.8 eV) and subjected to deconvolution.
-
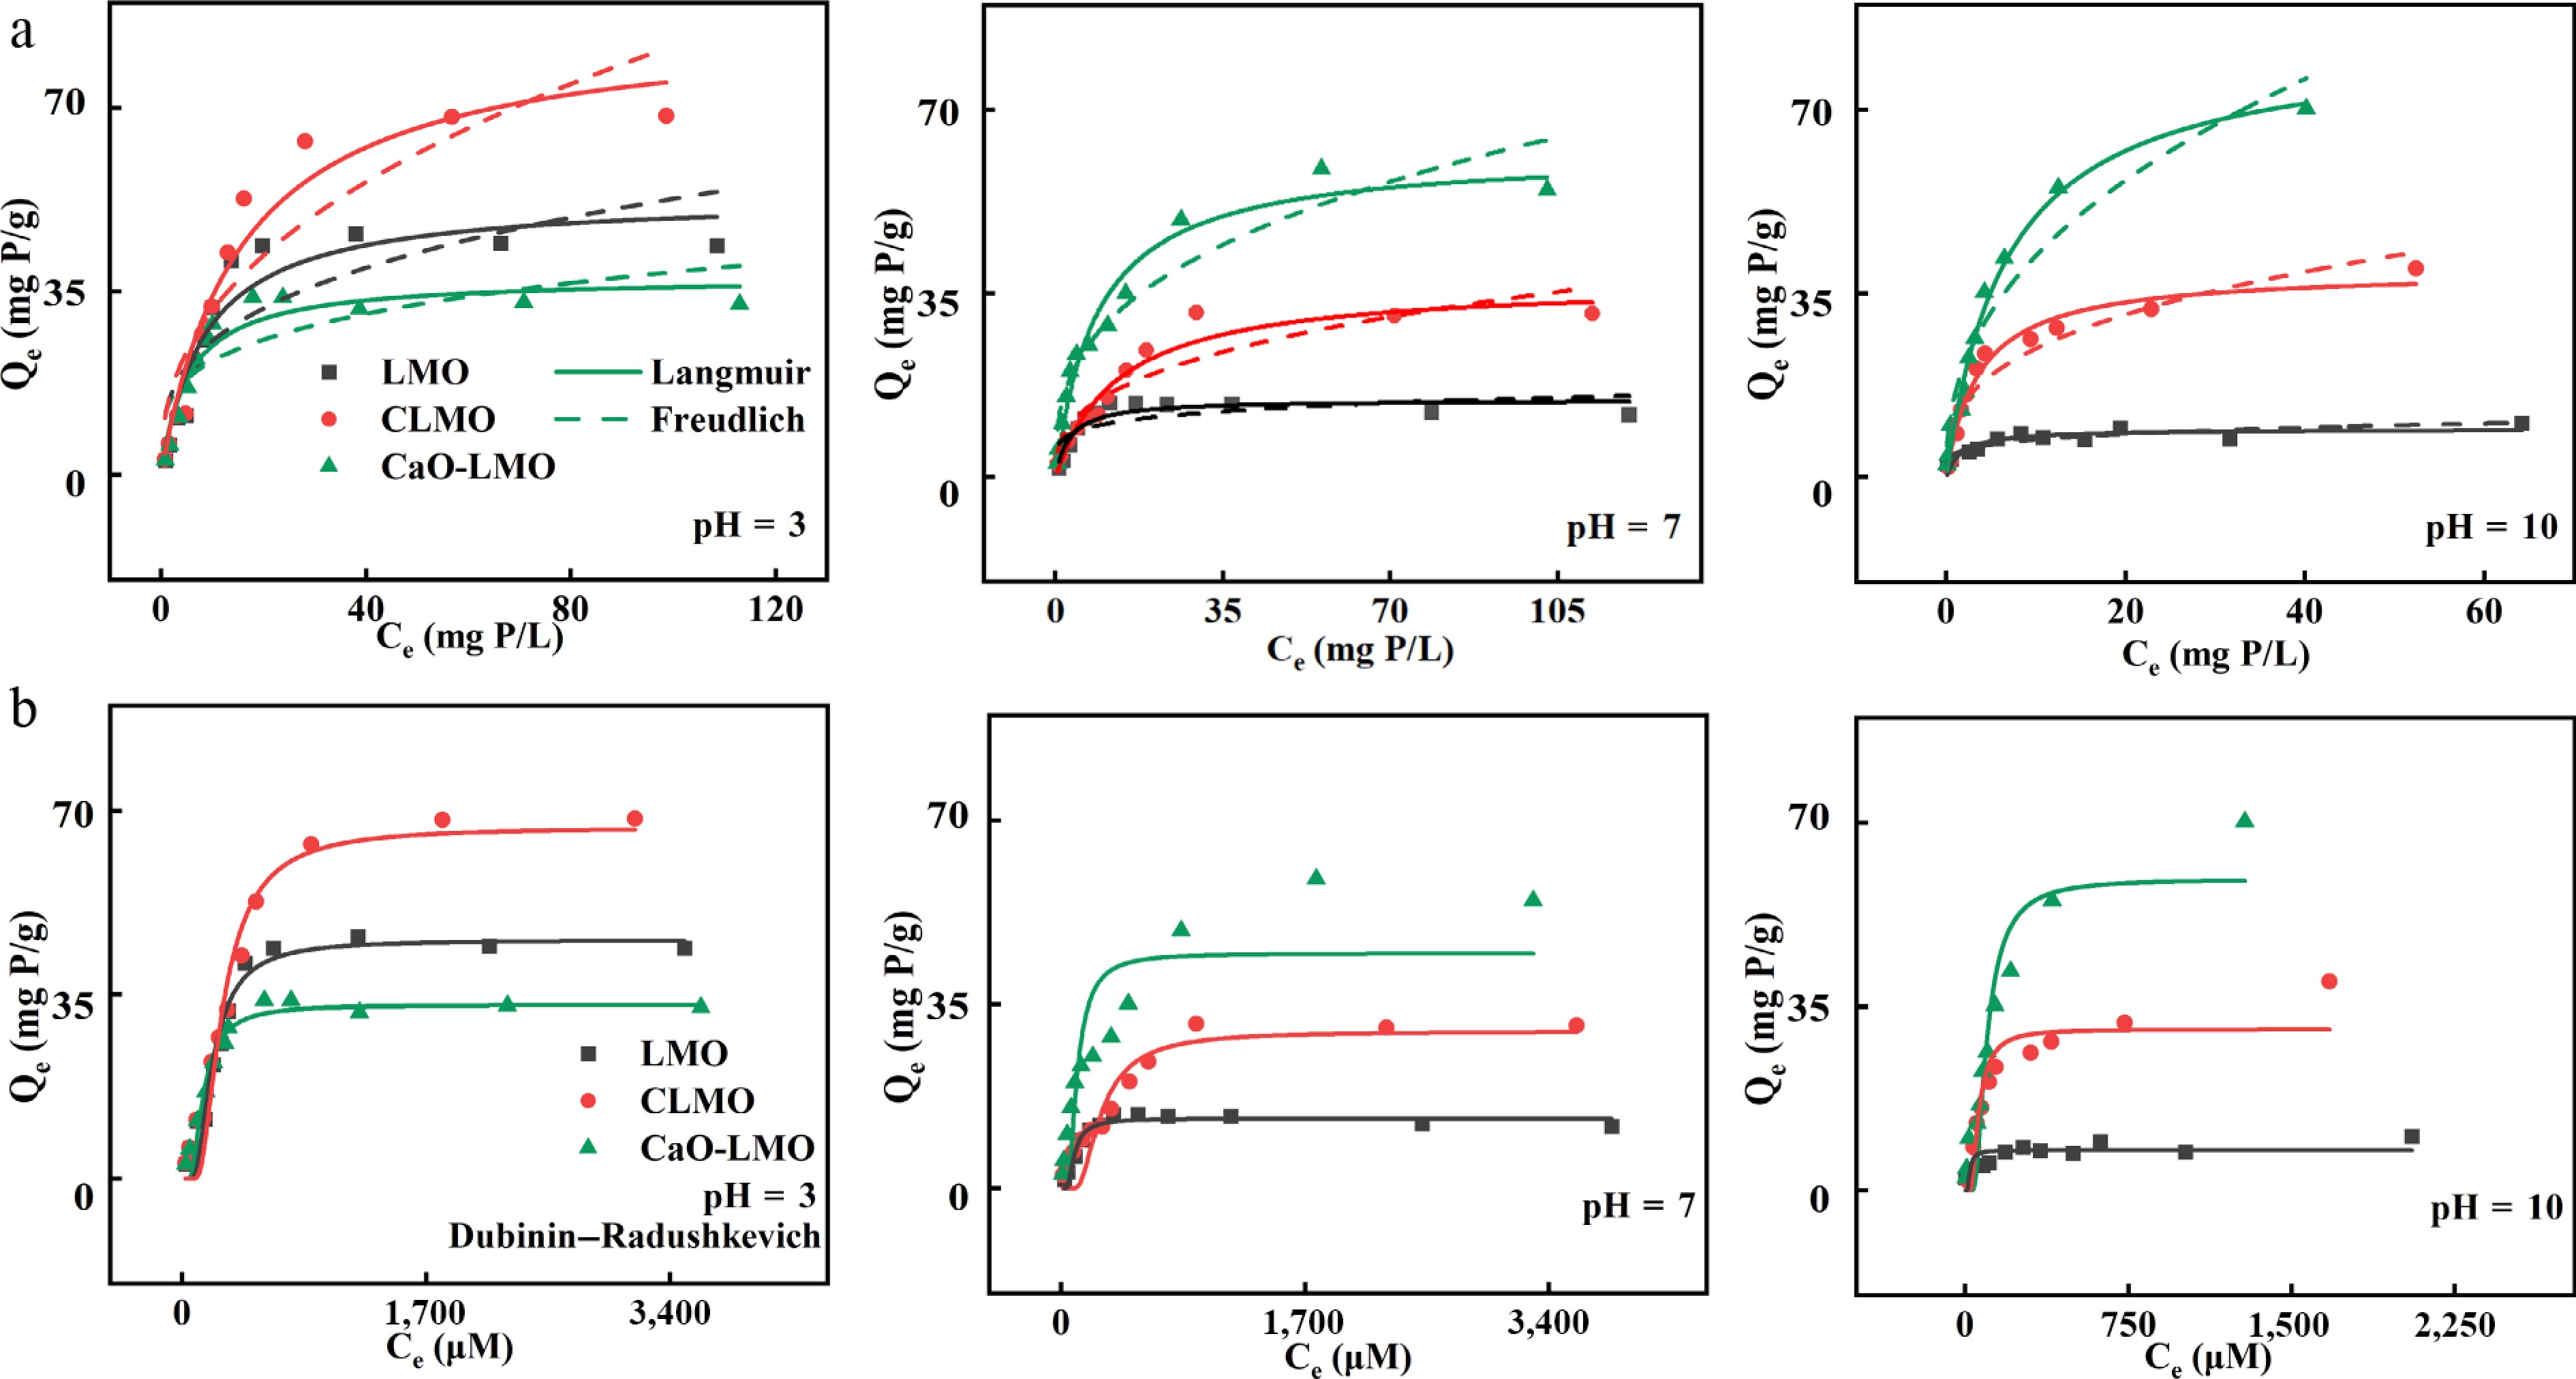
Figure 3.
(a) Langmuir, Freundlich, and (b) Dubinin–Radushkevich adsorption isotherm models of the adsorbents at pH = 3, 7, 1 and 0 (dosage: 20 mg, V = 50 mL, T = 298 K).
-
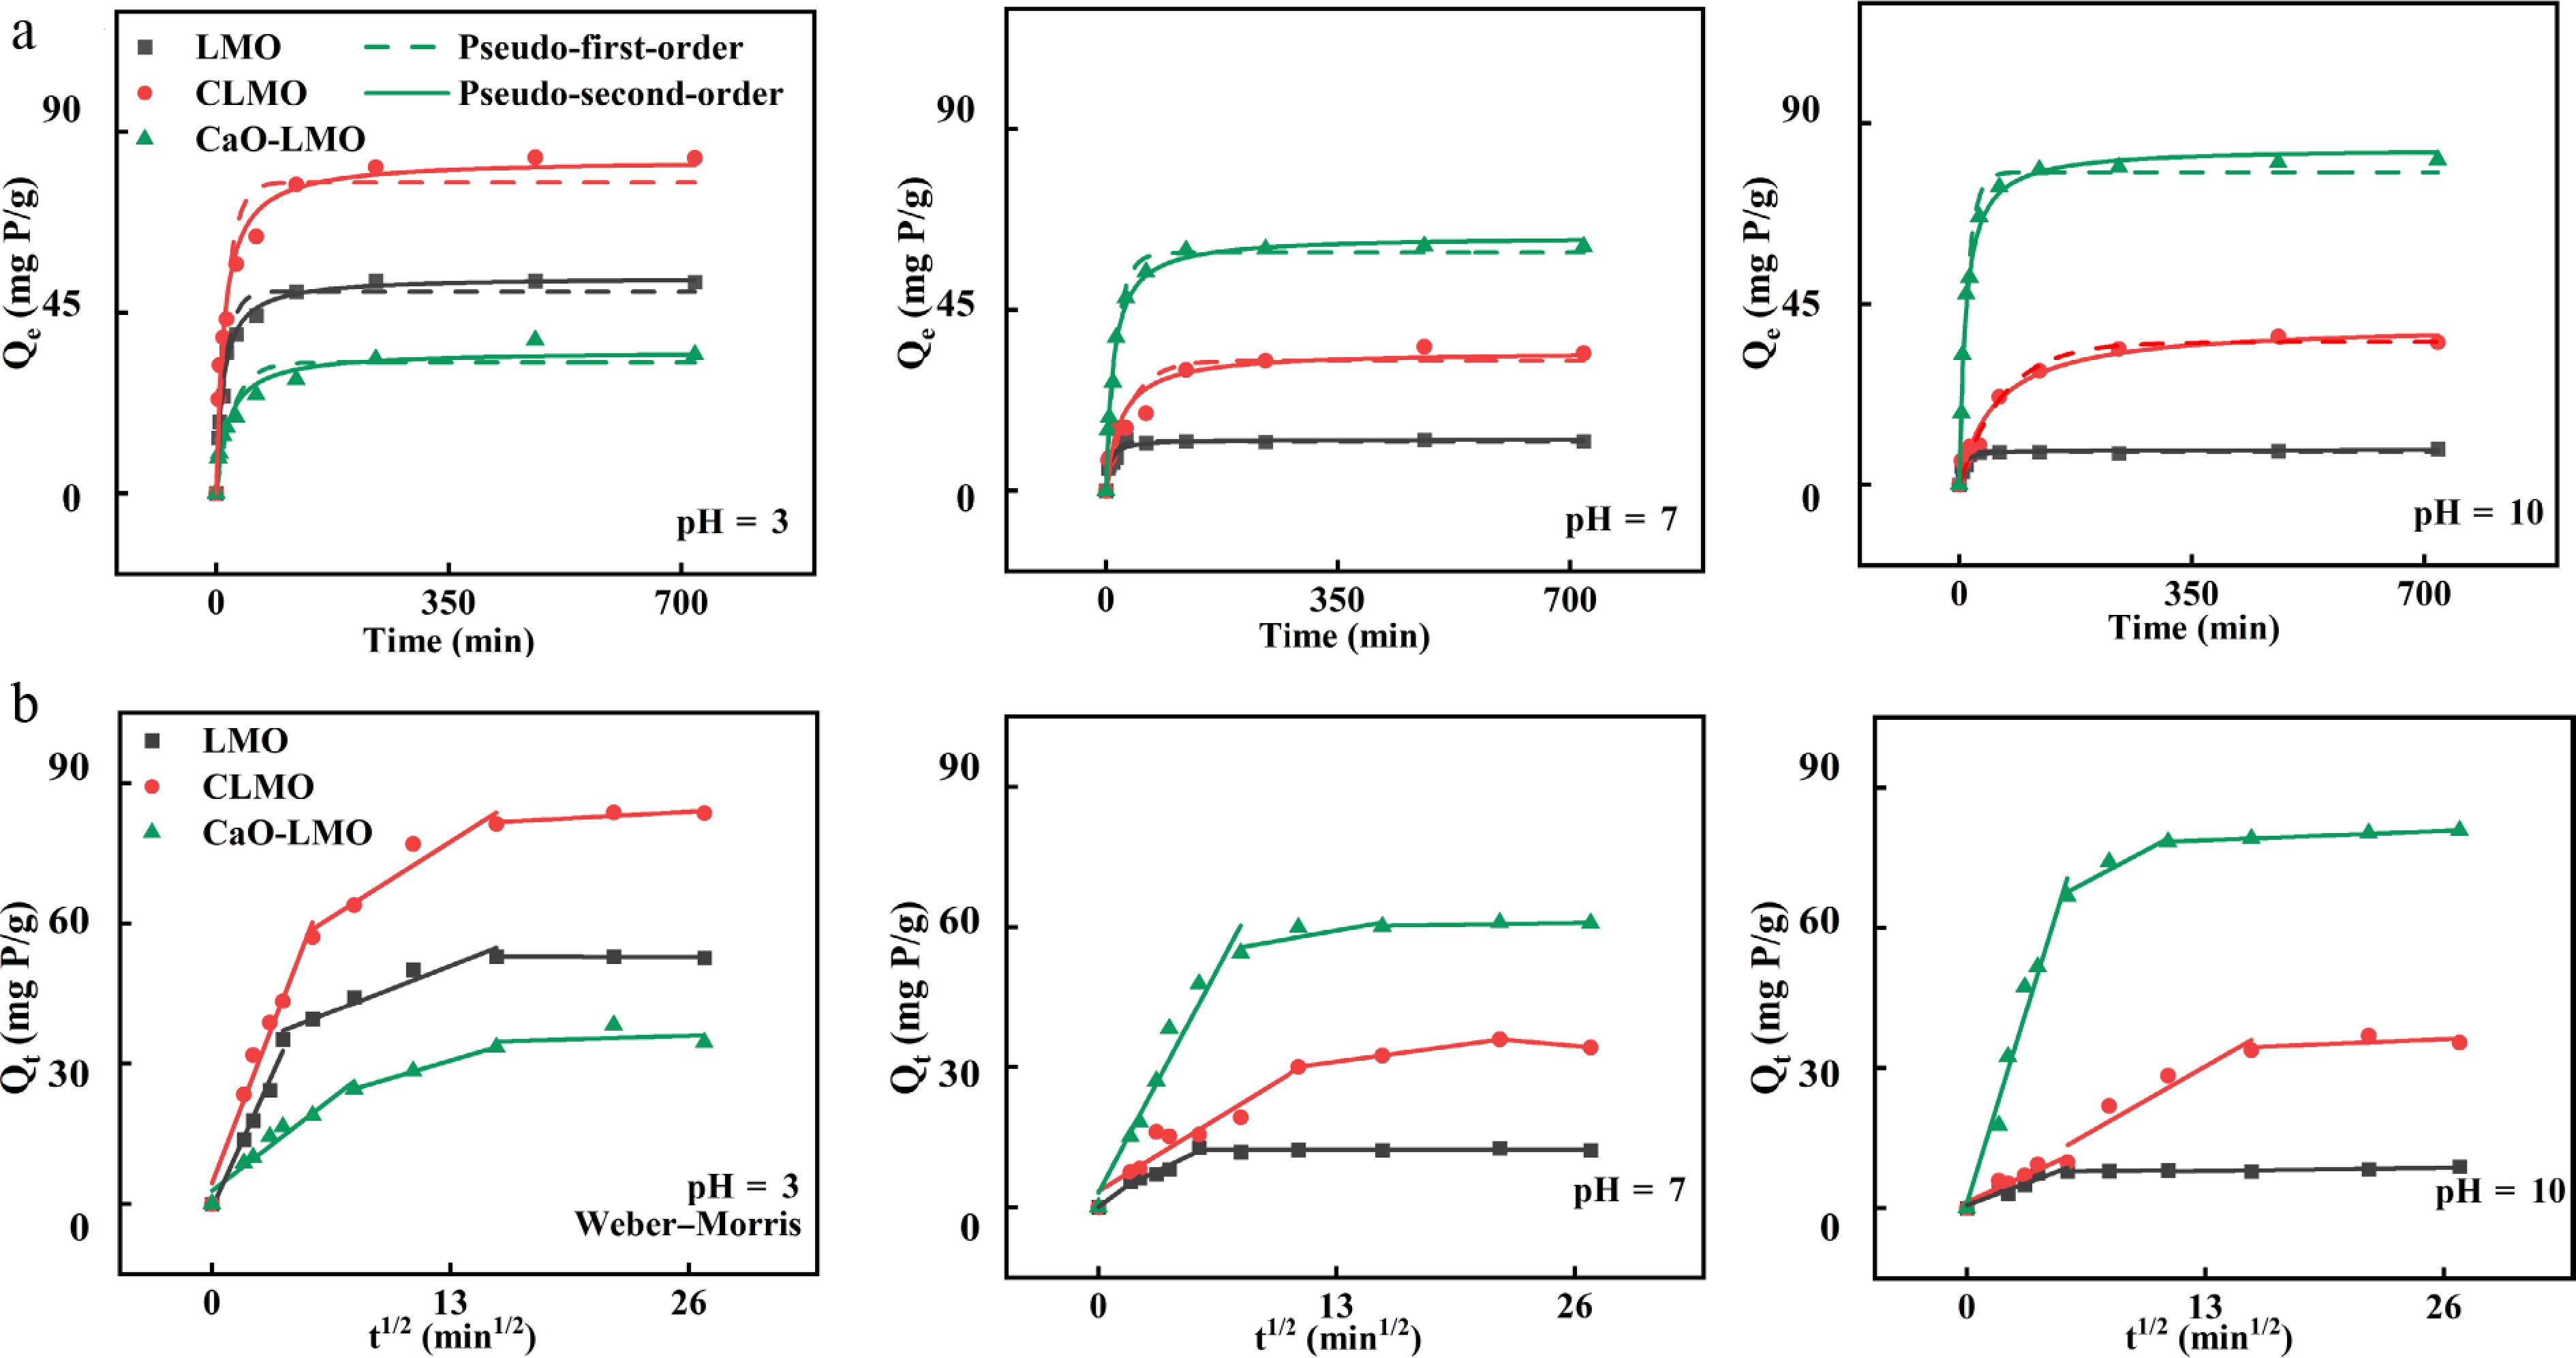
Figure 4.
(a) Pseudo-first-order, pseudo-second-order, and (b) Weber–Morris adsorption kinetic models of the adsorbents at pH = 3, 7, and 10 (dosage: 20 mg, V = 50 mL, C0 = 150 mg/L, T = 298 K).
-
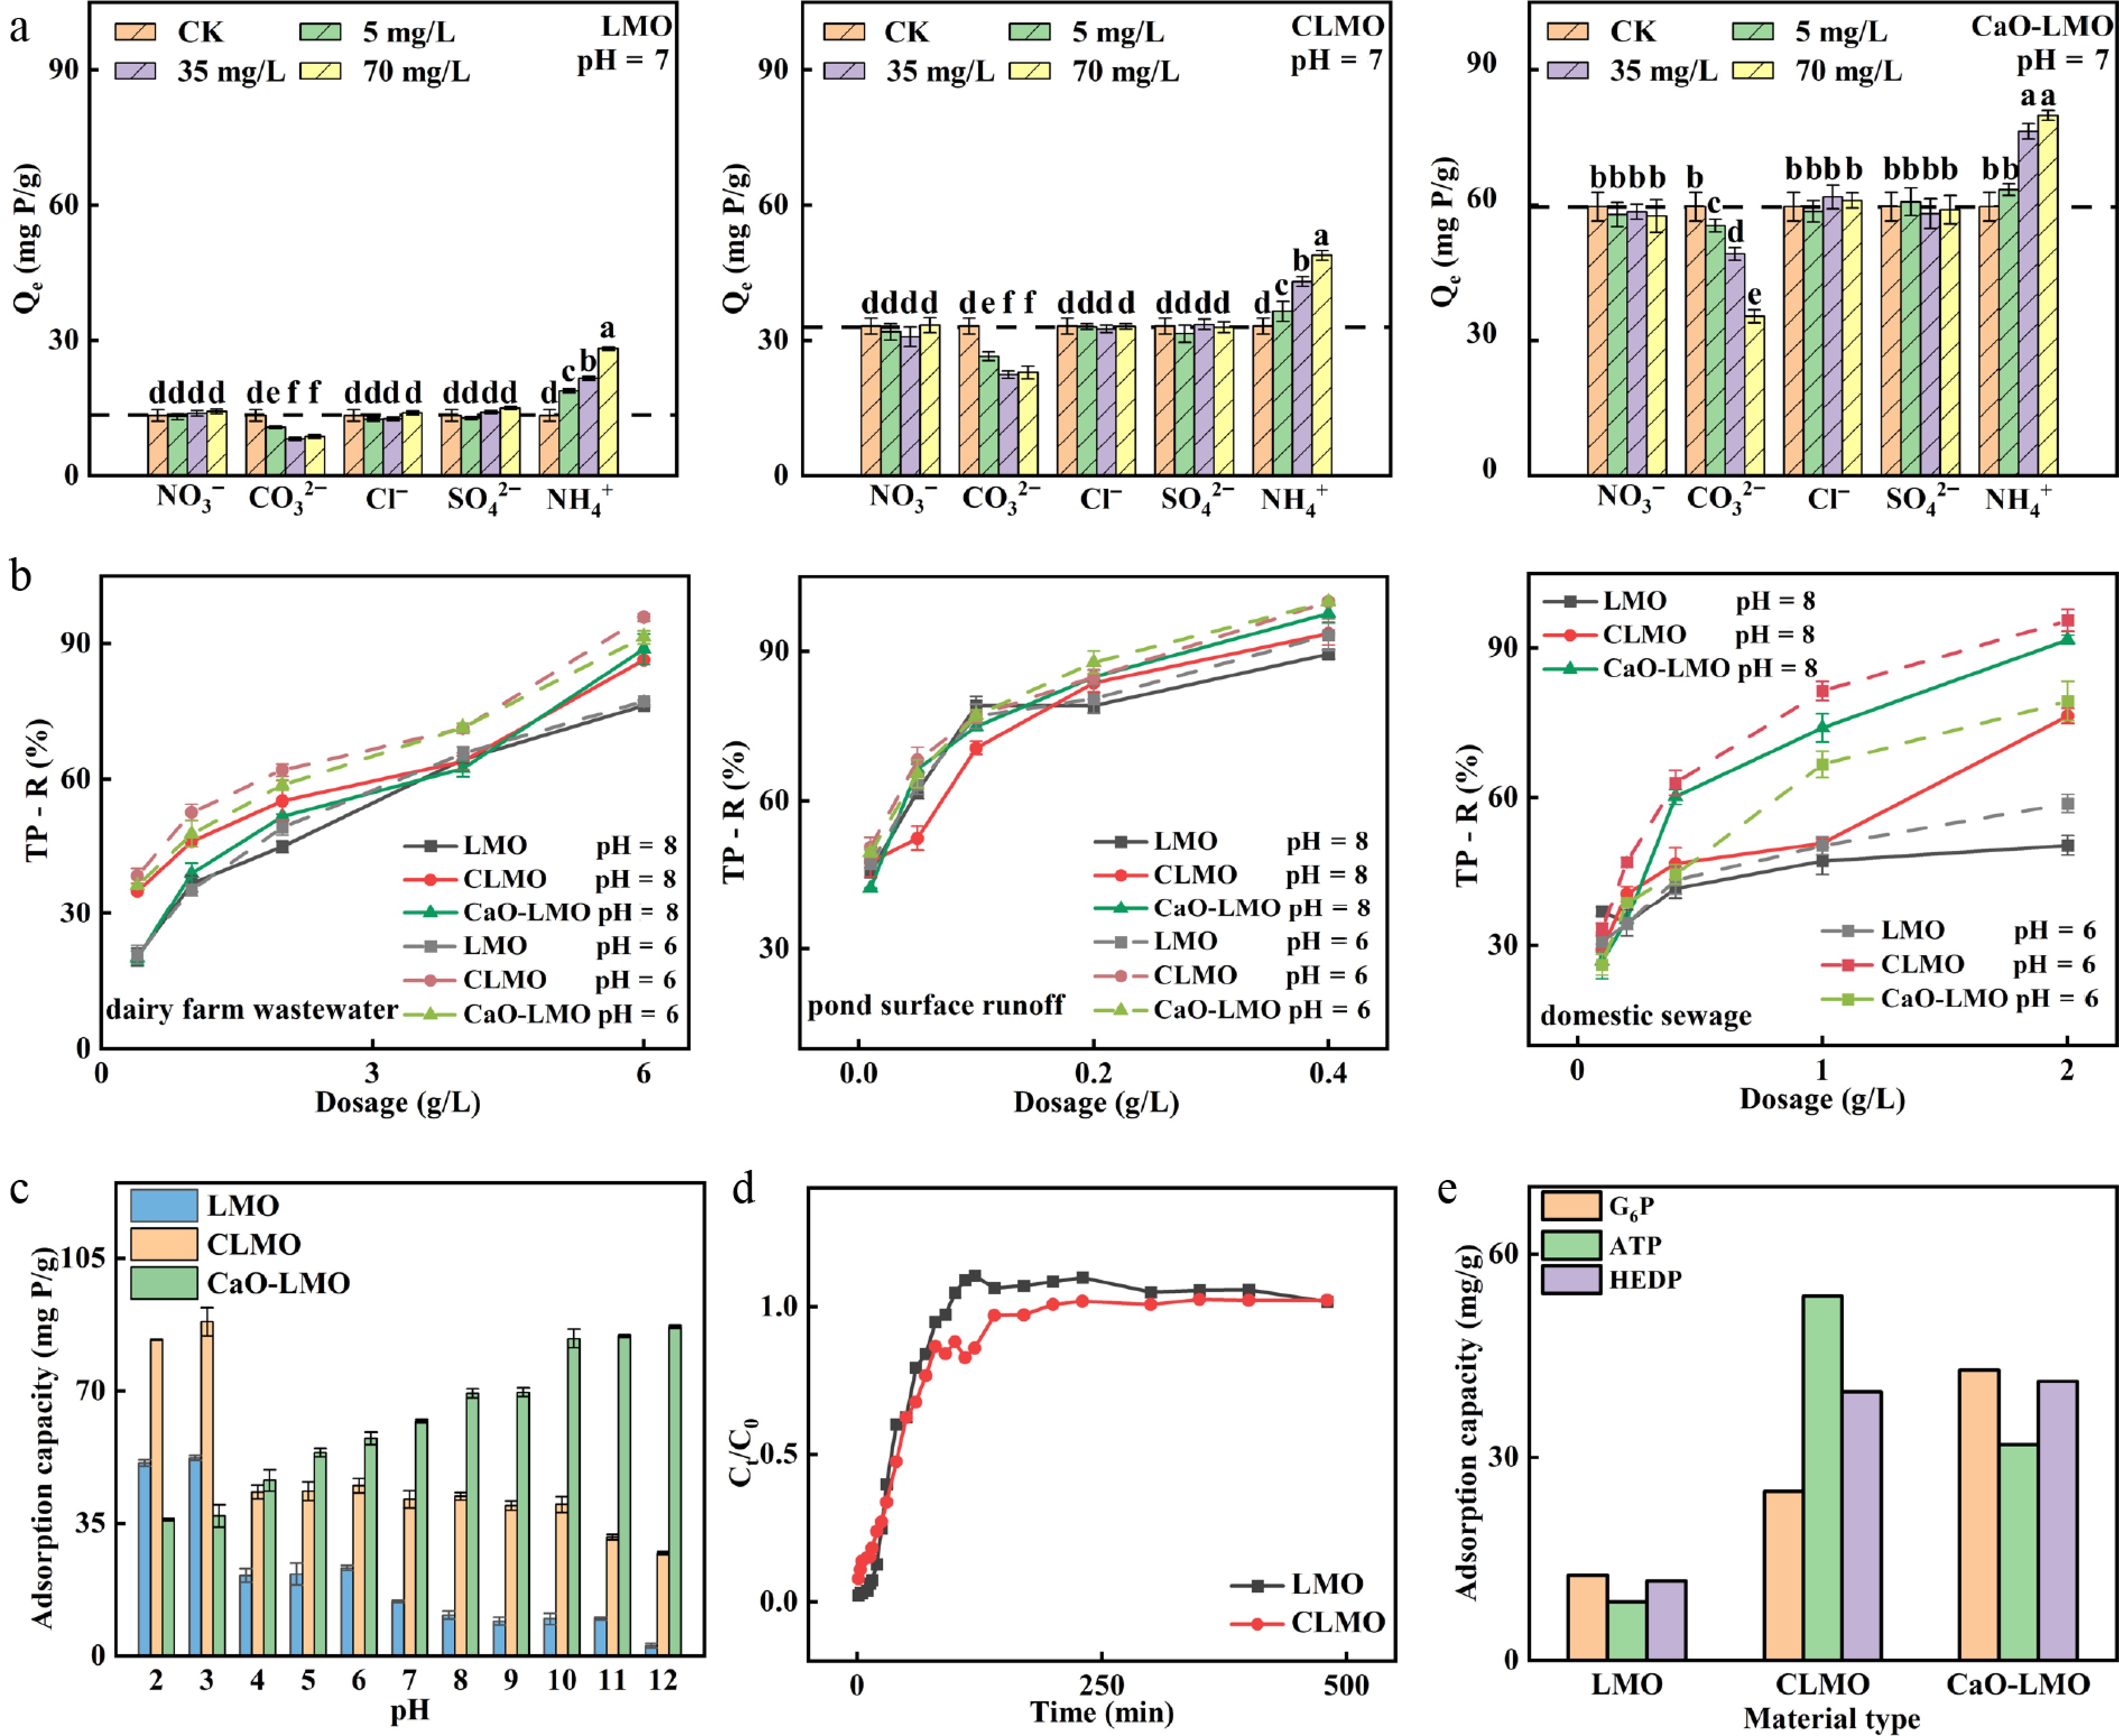
Figure 5.
(a) Adsorption performance of phytic acid by LMO, CLMO, and CaO-LMO under different coexisting ion concentrations (5, 35, and 70 mg/L) and various types of coexisting ions (NO3−, CO32−, Cl−, SO42−, and NH4+), arranged from left to right (dosage: 20 mg, volume [V] = 50 mL, C0 = 150 mg/L, time [t] = 24 h, temperature [T] = 298 K). (b) Properties of the adsorbents used to remove total phosphorus from actual wastewater (dairy farm wastewater, pond surface runoff, and domestic sewage). (c) Effect of pH on the adsorption of phytic acid. (d) Adsorption of phytic acid on a fixed-bed column (mass [m] = 0.5 g, V = 1 L, C0 = 100 mg/L, pH = 3, flow rate = 2 mL/min). (e) Adsorption properties of materials in different kinds of organophosphorus (m = 20 mg, pH = 7, and C0 = 100 mg/L).
-
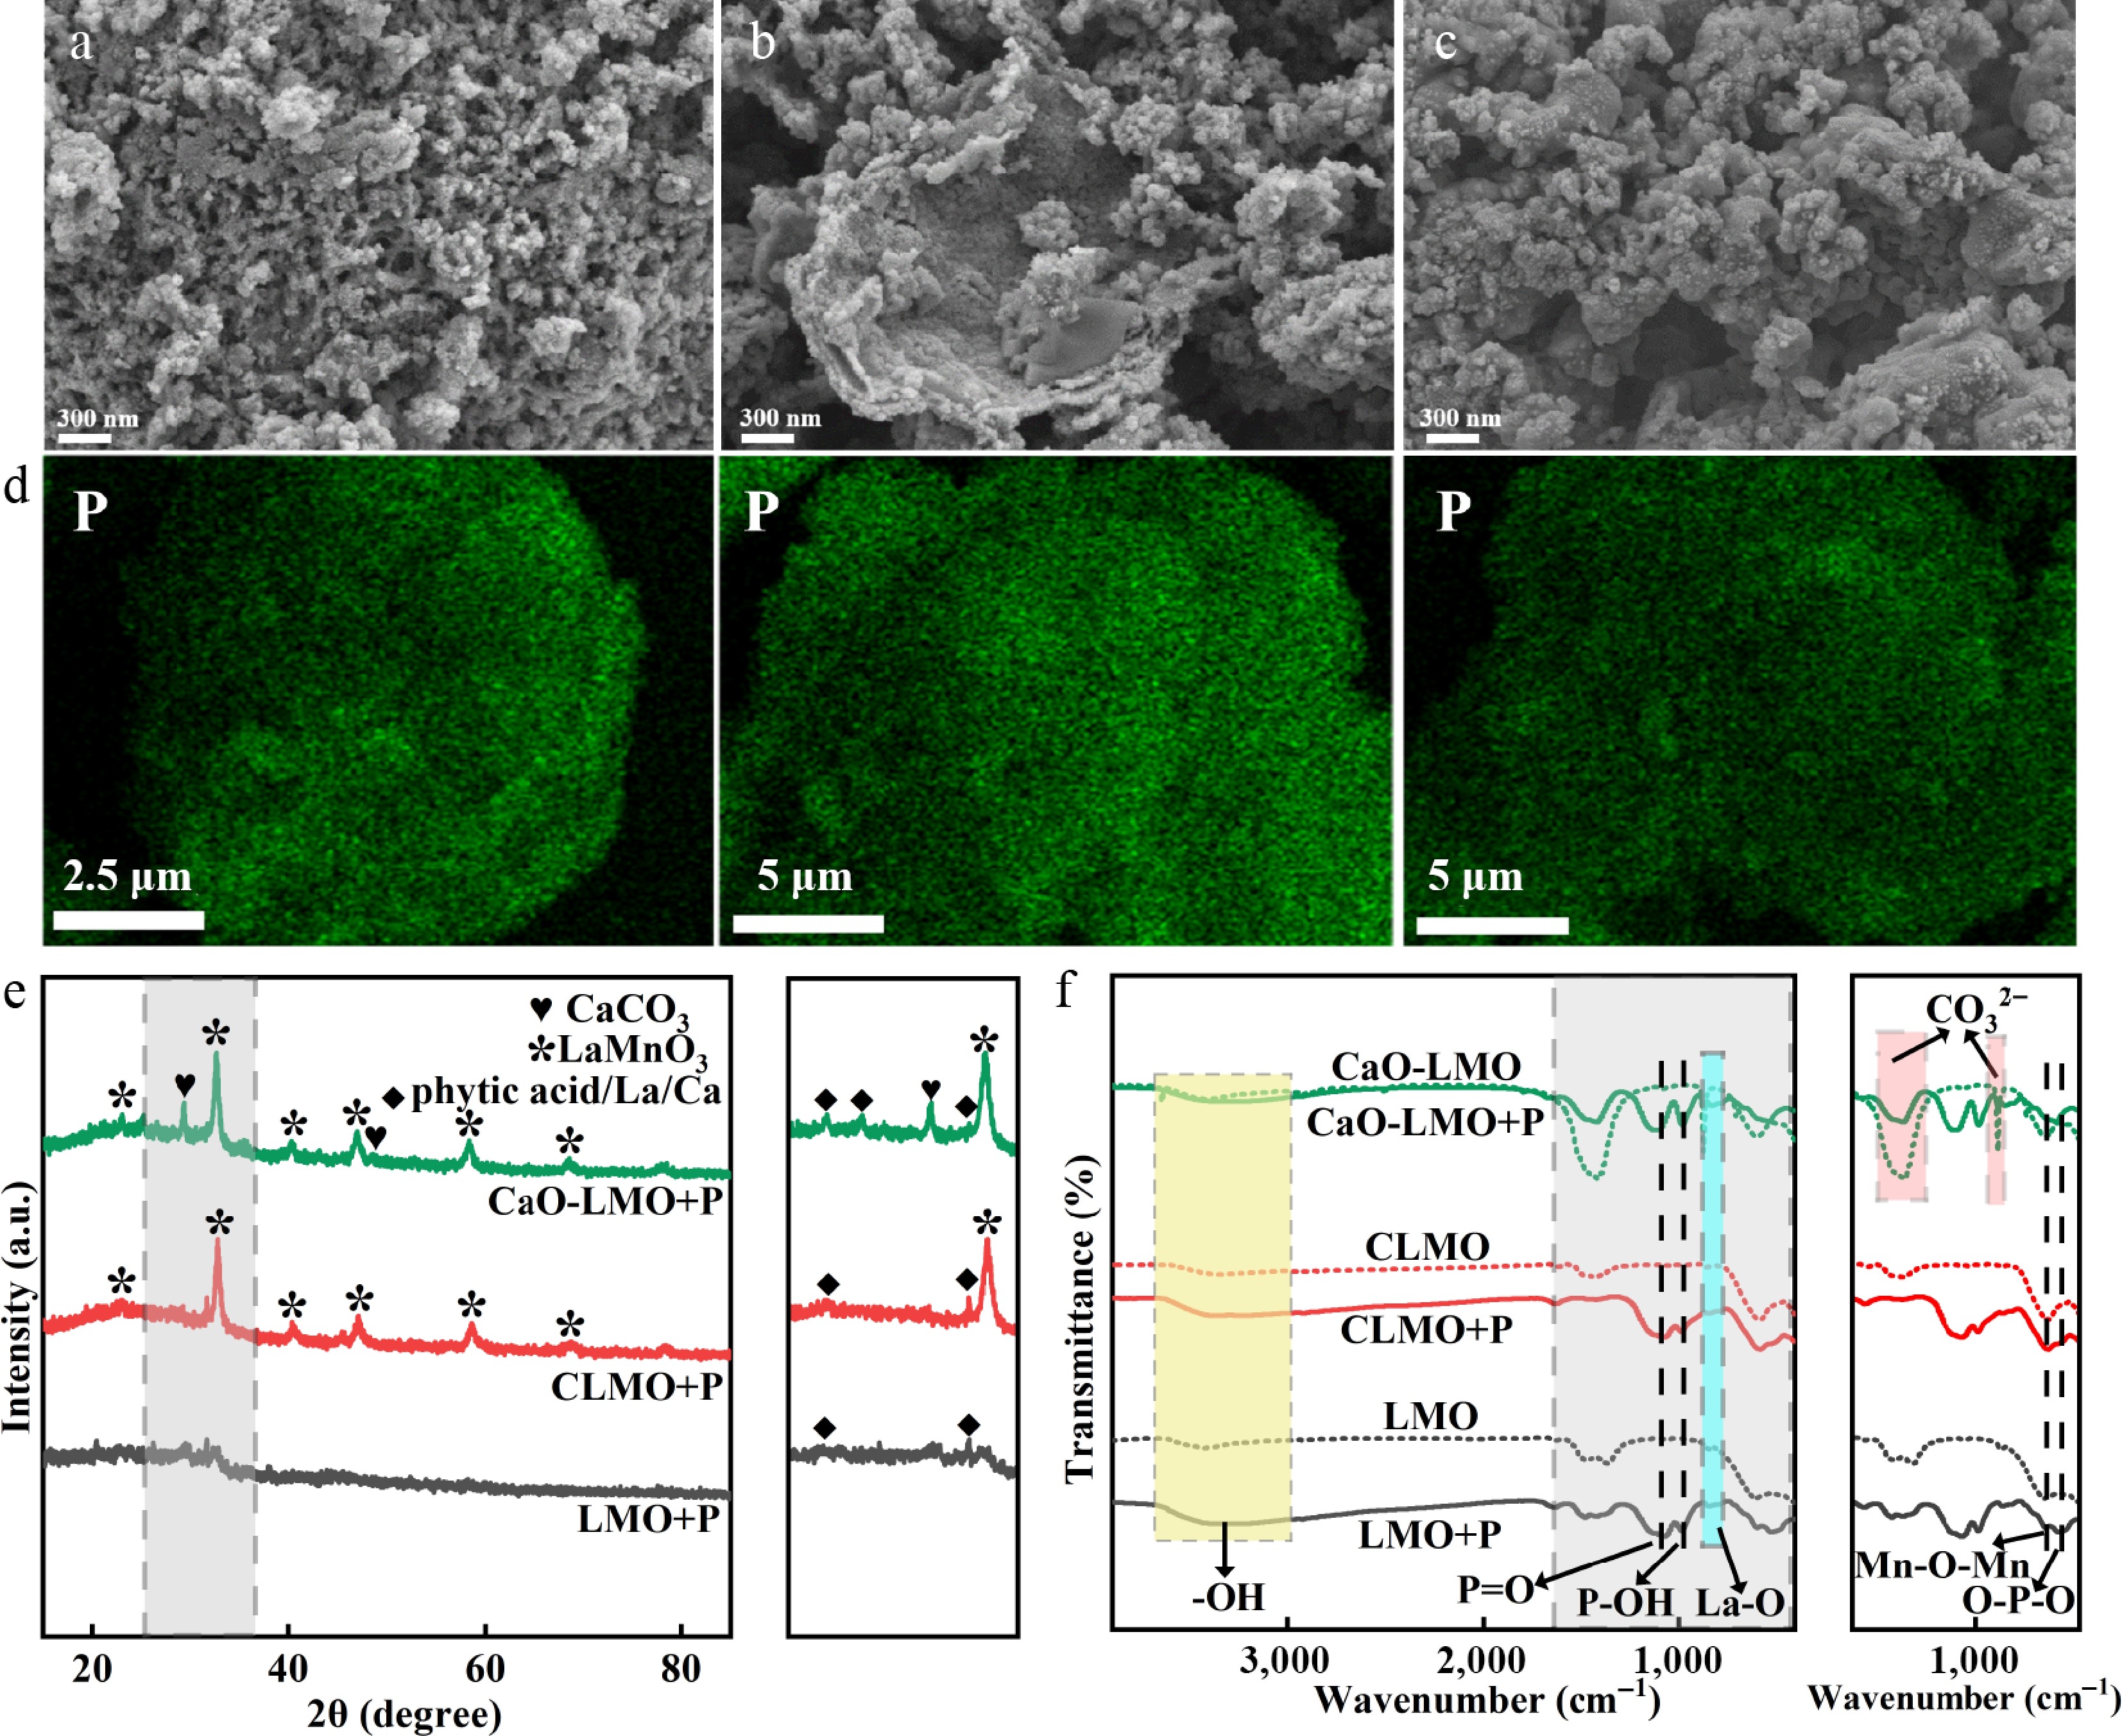
Figure 6.
SEM of samples after adsorbing phytic acid: (a) LMO, (b) CLMO, and (c) CaO-LMO. (d) Distribution of P element (pH = 3). (e) XRD spectra (please refer to Supplementary Figs. S1, S2 for enlarged images) and (f) FTIR images (the dashed and solid lines represent values before and after the adsorption of phytic acid, respectively; please refer to Supplementary Figures S3, S4 for enlarged images).
-
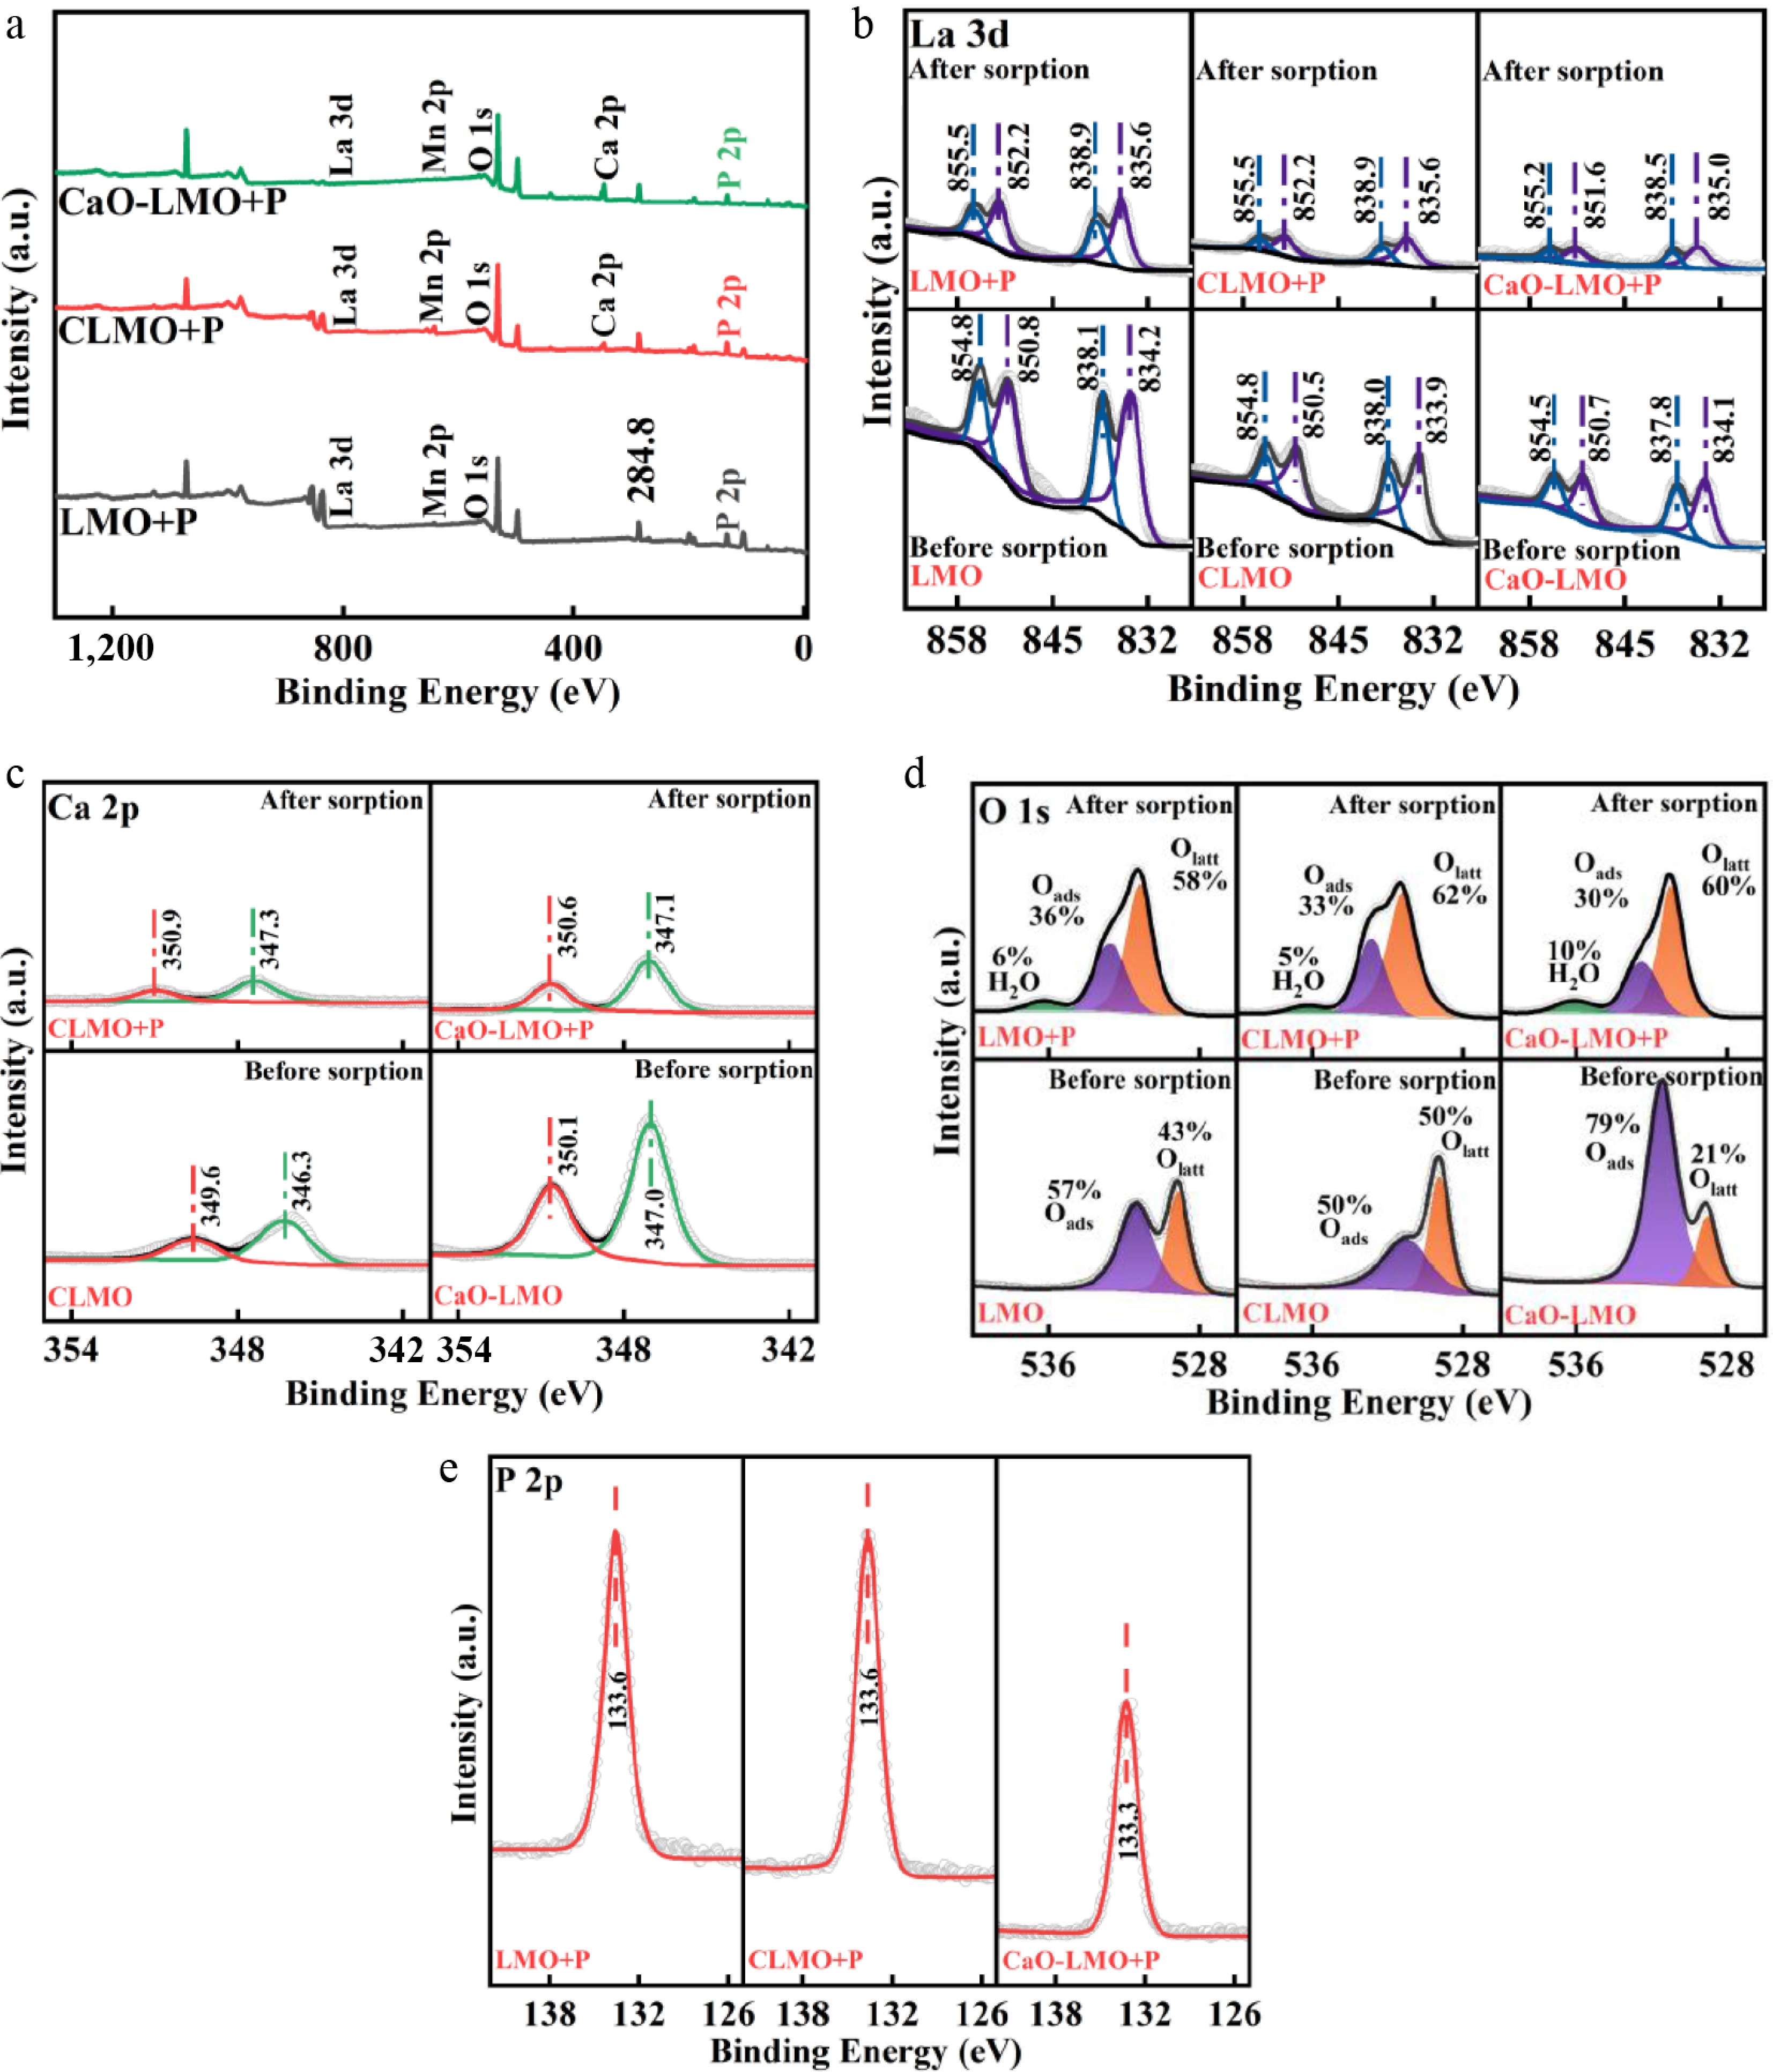
Figure 7.
XPS spectra before and after adsorption of phytic acid by the adsorbents: (a) Full spectra, (b) La 3d, (c) Ca 2p (only CLMO and CaO-LMO are presented), (d) O 1s, and (e) P 2p. All peaks were corrected by the C 1s peak (284.8 eV) and subjected to deconvolution.
Figures
(7)
Tables
(0)