-
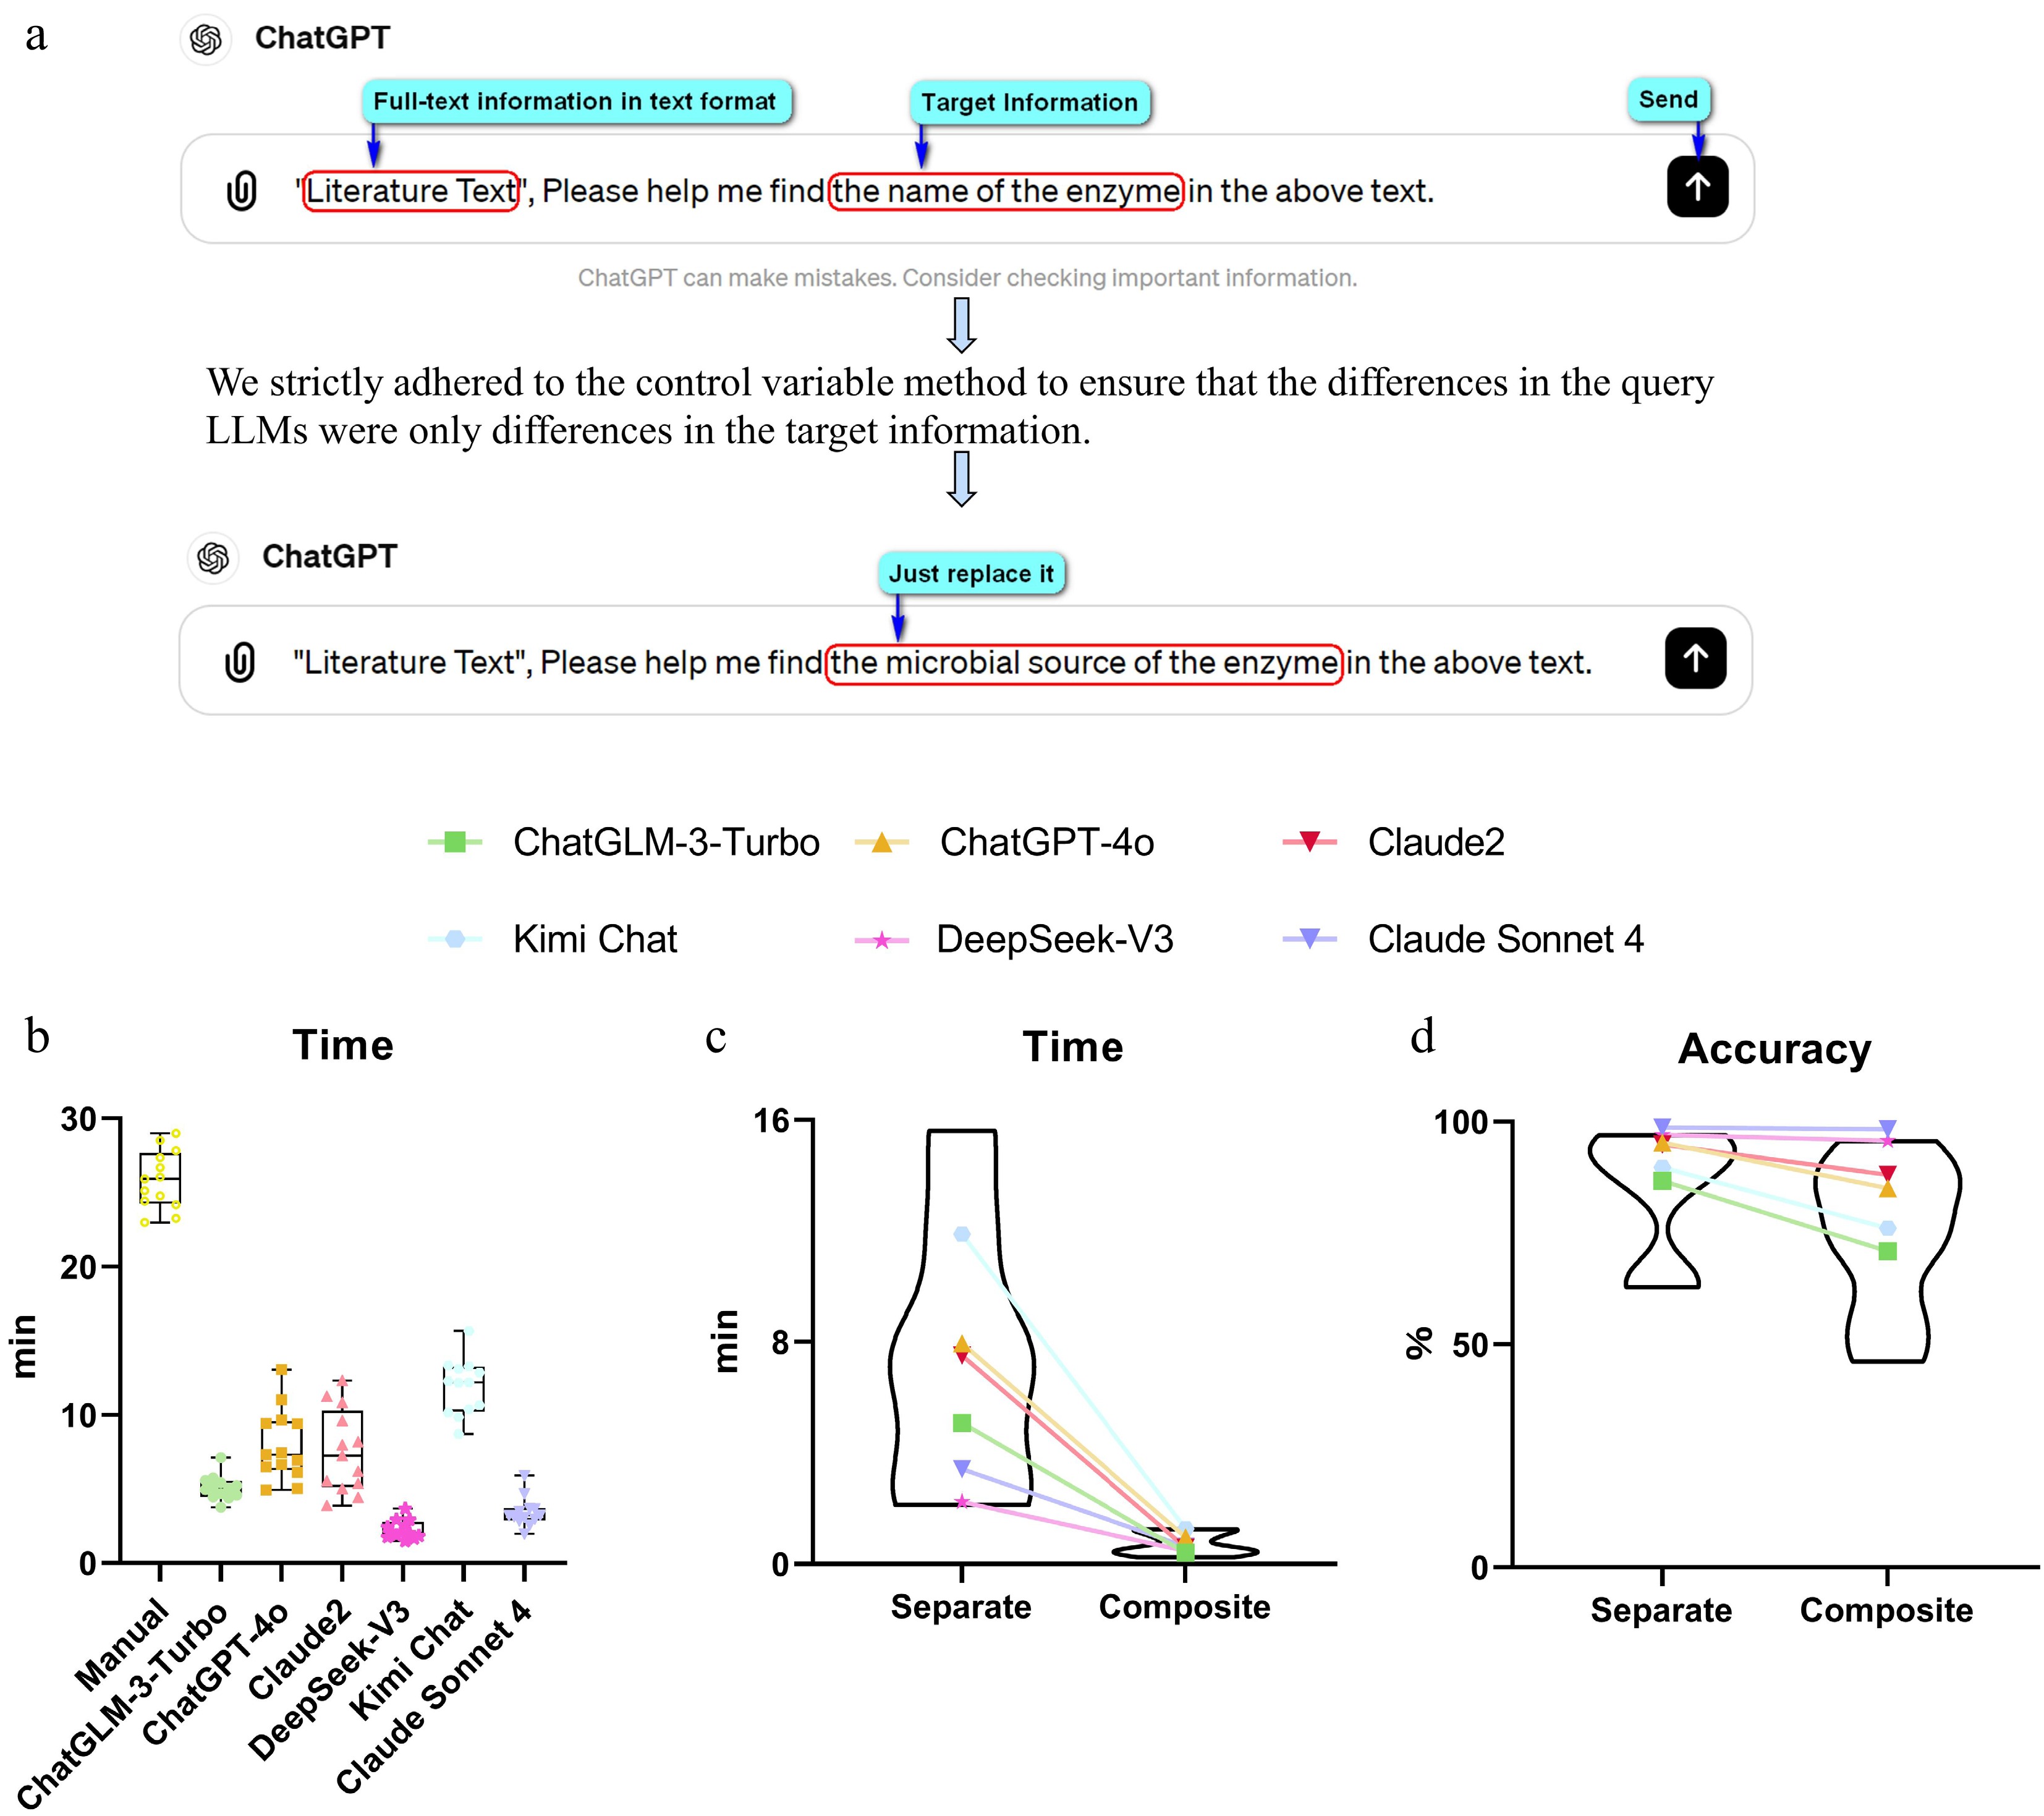
Figure 1.
Evaluation of LLM querying strategy and extraction performance. (a) Schematic of the standardized separate questioning approach, in which the target information term is systematically replaced across otherwise identical queries. (b) Box plots comparing processing time (min) between manual extraction and six LLMs under separate questioning modes. (c) Connected dot plot comparing processing time (min) for each LLM between separate and composite questioning modes, with violin plots showing the overall distribution. (d) Connected dot plot comparing overall extraction accuracy (%) for each LLM between separate and composite questioning modes, with violin plots showing the overall distribution. Statistical differences between models were assessed using the Friedman test followed by the Nemenyi post hoc test (p < 0.05).
-
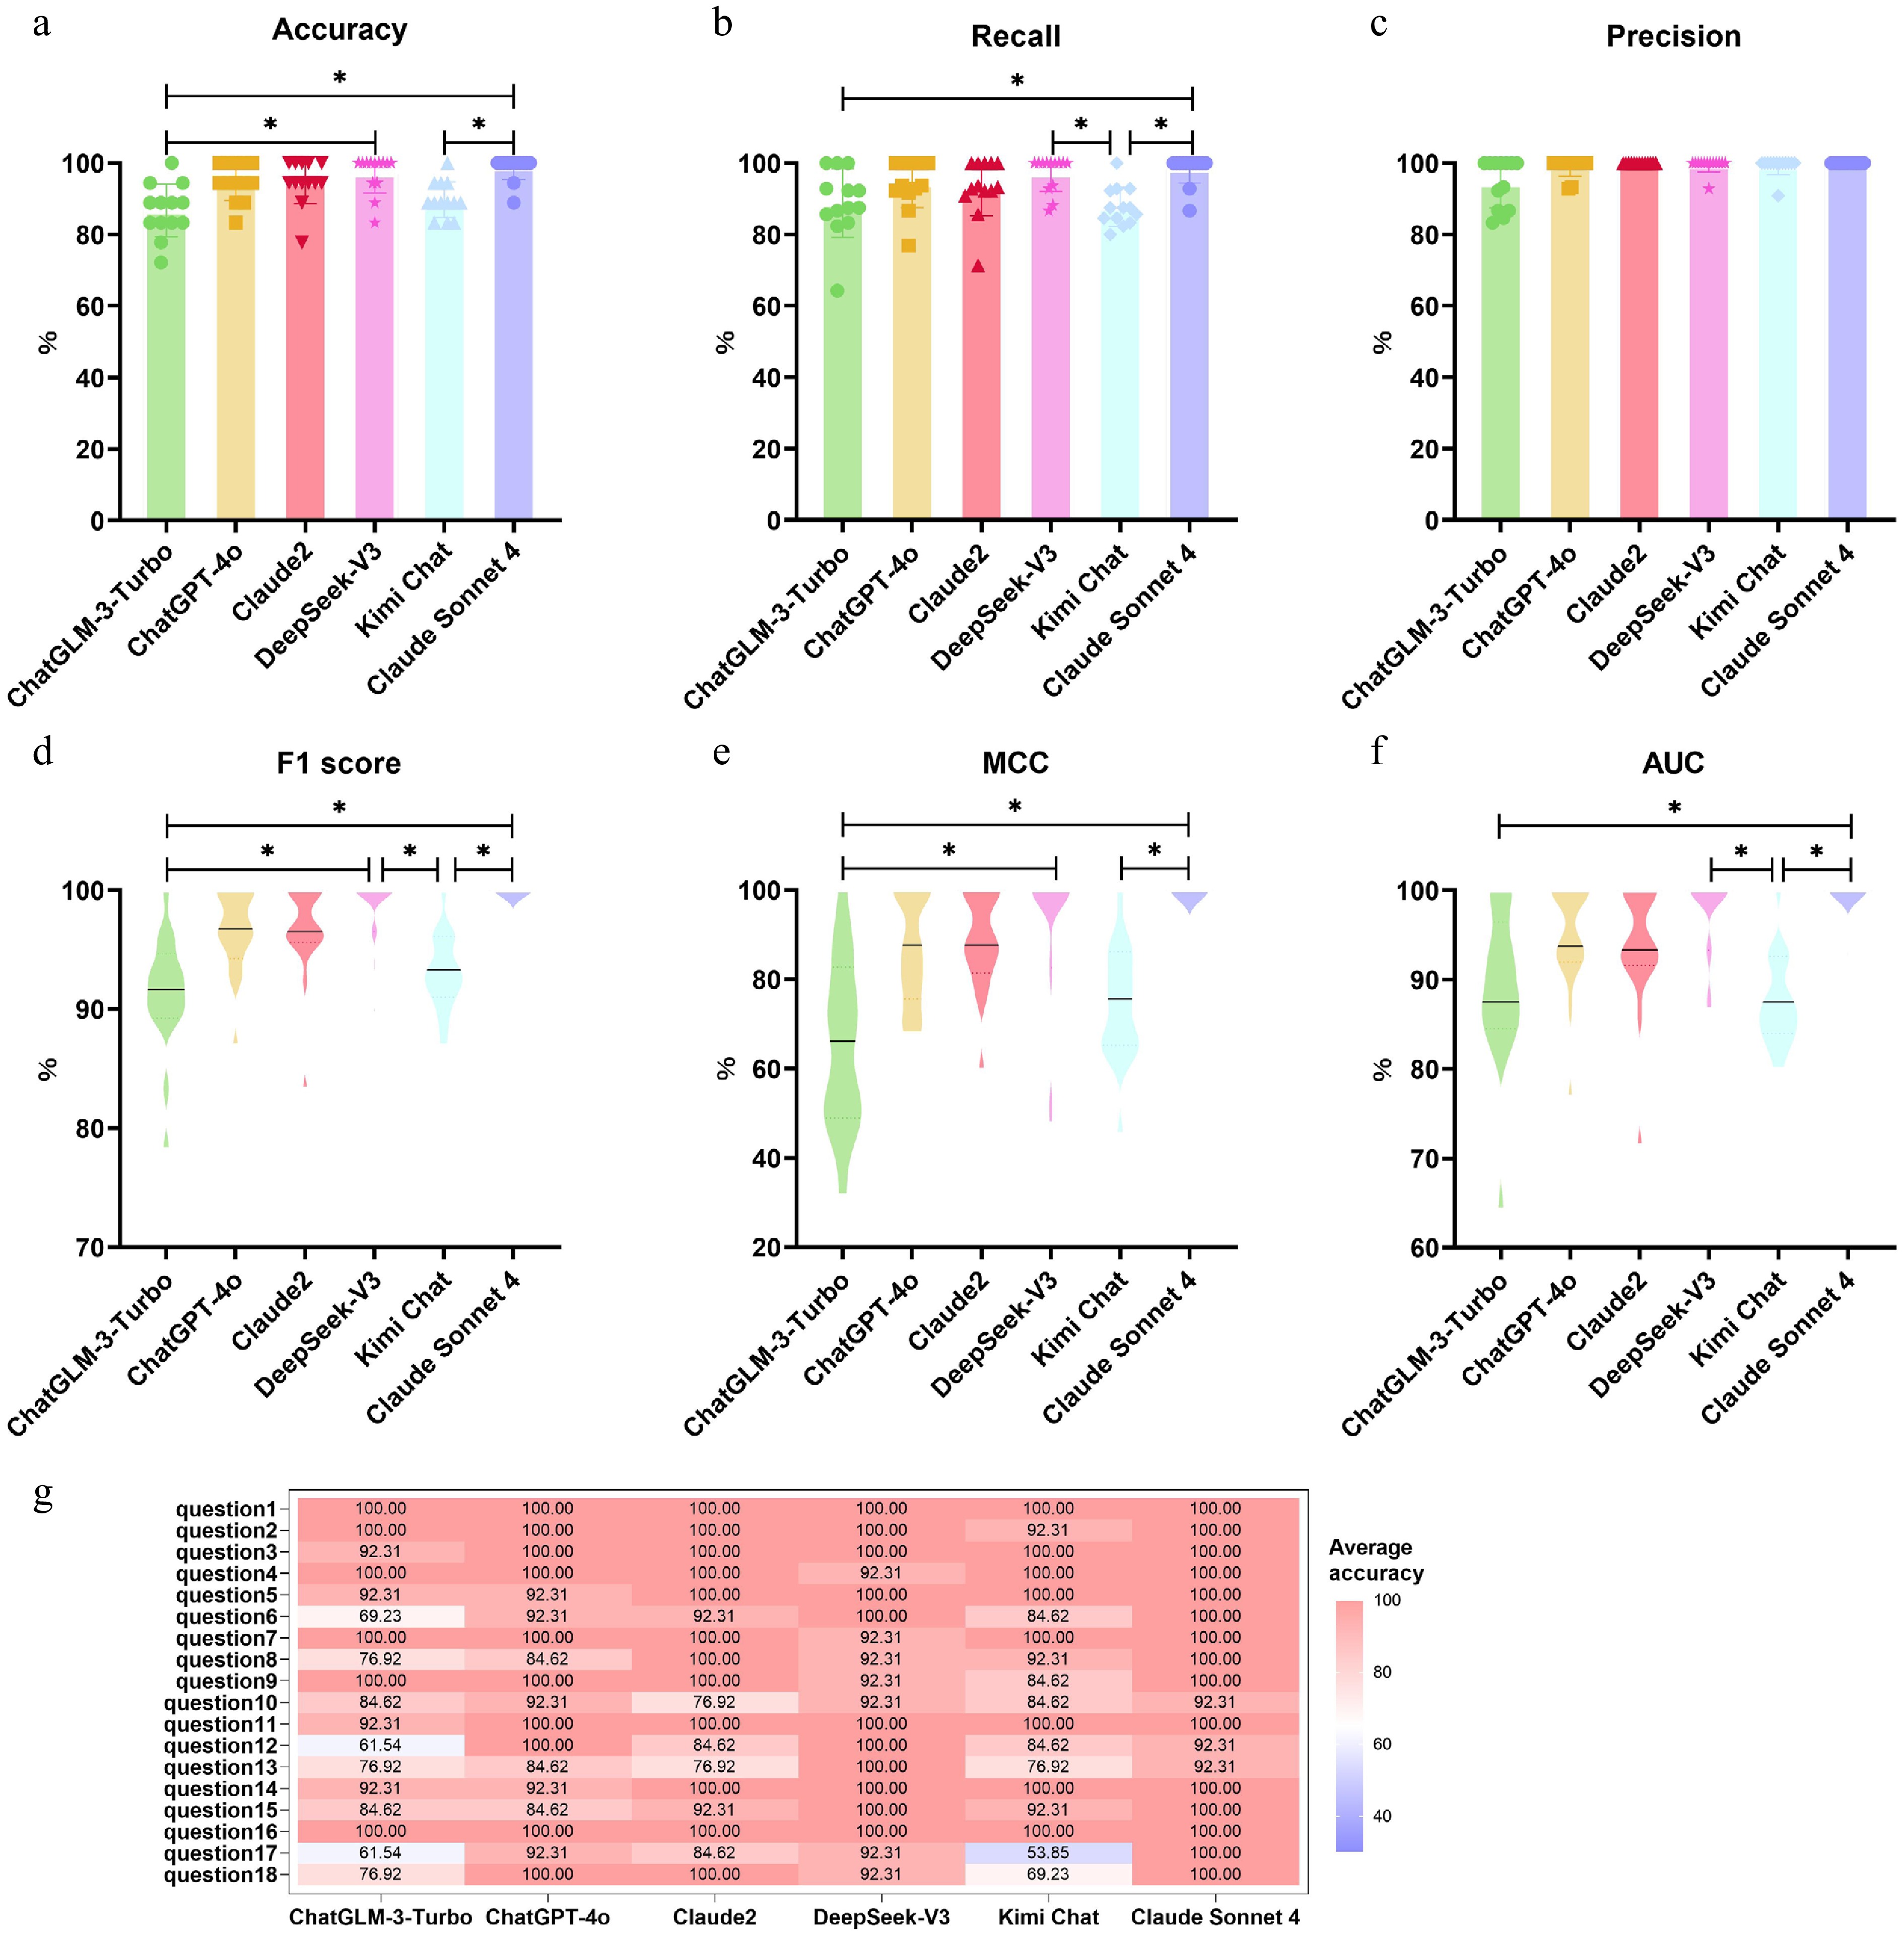
Figure 2.
Performance comparison of six large language models (ChatGLM-3-Turbo, ChatGPT-4o, Claude2, Claude Sonnet 4, DeepSeek-V3, and Kimi Chat) across six evaluation metrics: (a) accuracy, (b) recall, (c) precision, (d) F1 score, (e) Matthews correlation coefficient (MCC), and (f) area under the ROC curve (AUC). Each data point represents the mean score of a model on 18 targeted information categories for 1 of the 13 literature sources; the central line within each violin plot indicates the median. Significant differences between models were assessed using the Friedman test followed by the Nemenyi post hoc test; * indicates p < 0.05. (g) Heatmap showing the mean extraction accuracy (%) of each model across the 18 individual targeted information categories, averaged over all 13 literature sources. Color intensity reflects accuracy level as indicated in the scale bar on the right.
-
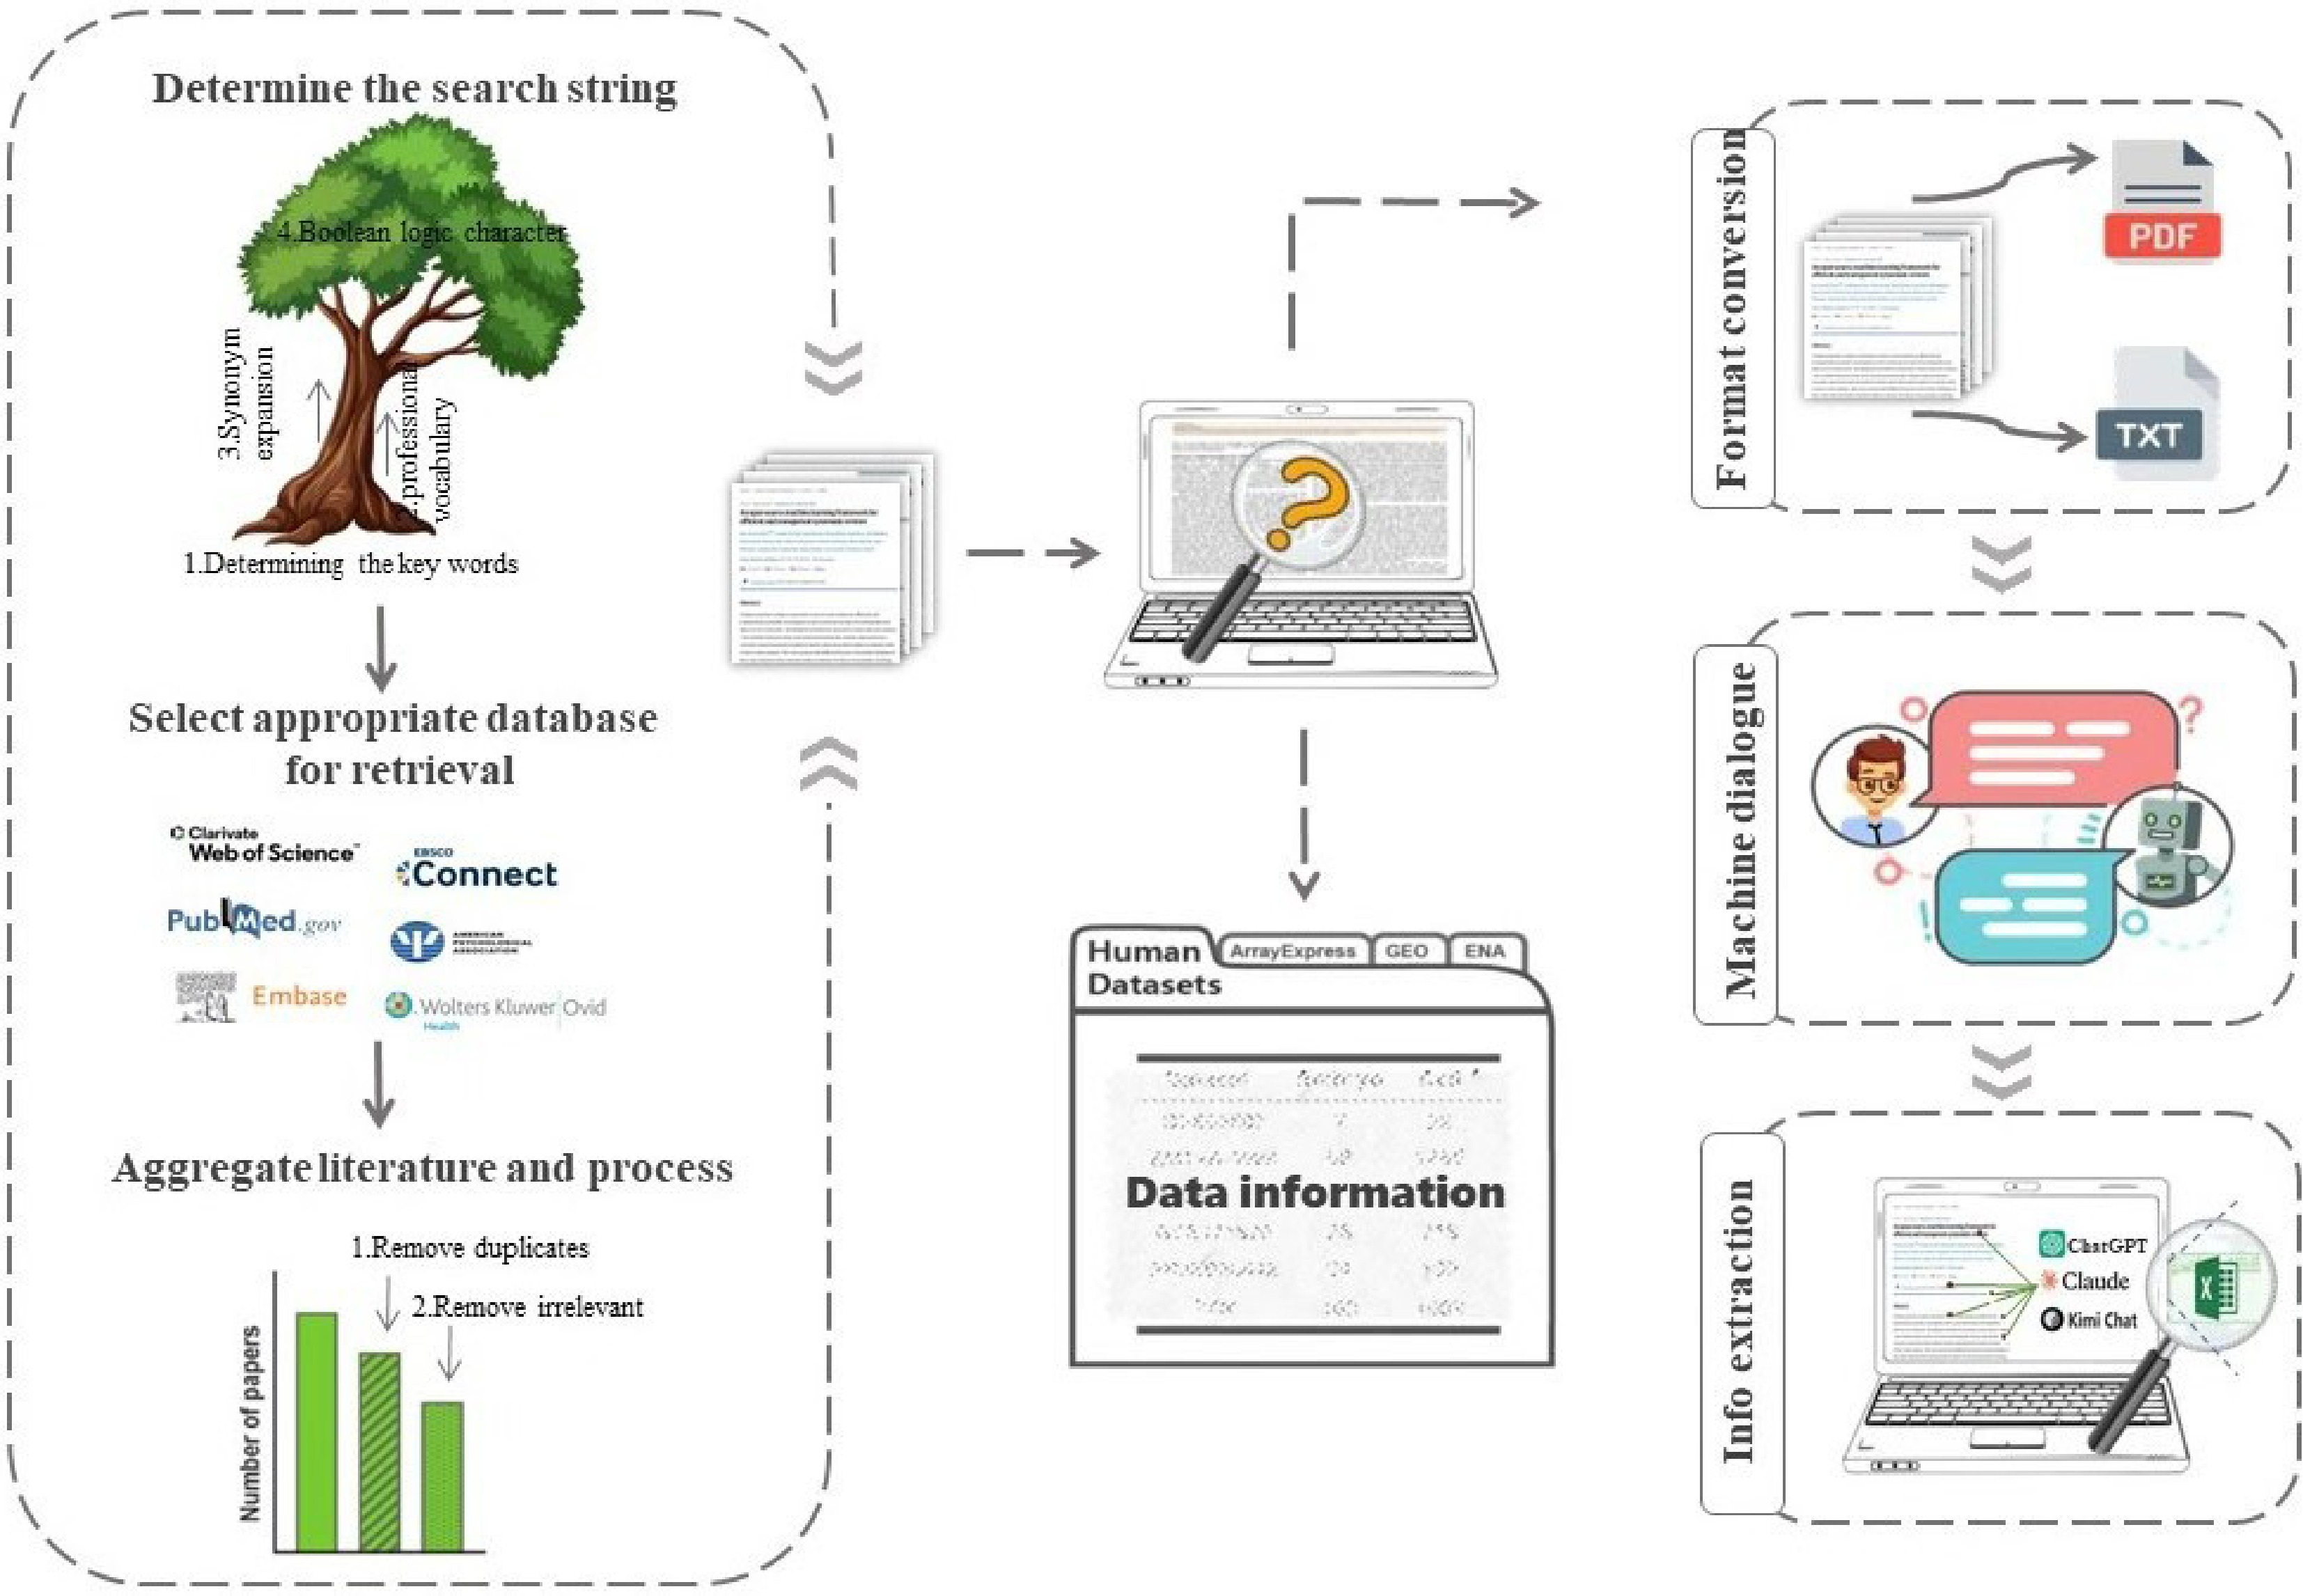
Figure 3.
Workflow for extracting information from scientific literature using large language models. The left panel illustrates the literature retrieval stage, comprising search string construction (including keyword identification, professional vocabulary, synonym expansion, and Boolean logic), database selection, and literature aggregation with duplicate and irrelevant paper removal. The center panel represents the screening and data organization stage, in which retrieved literature is reviewed and structured into a dataset. The right panel illustrates the information extraction stage, in which documents are converted into a format compatible with the target large language model (PDF or plain text), submitted via machine dialogue, and processed for structured information extraction using ChatGPT, Claude, or Kimi Chat. Arrows indicate the sequential flow between stages.
-
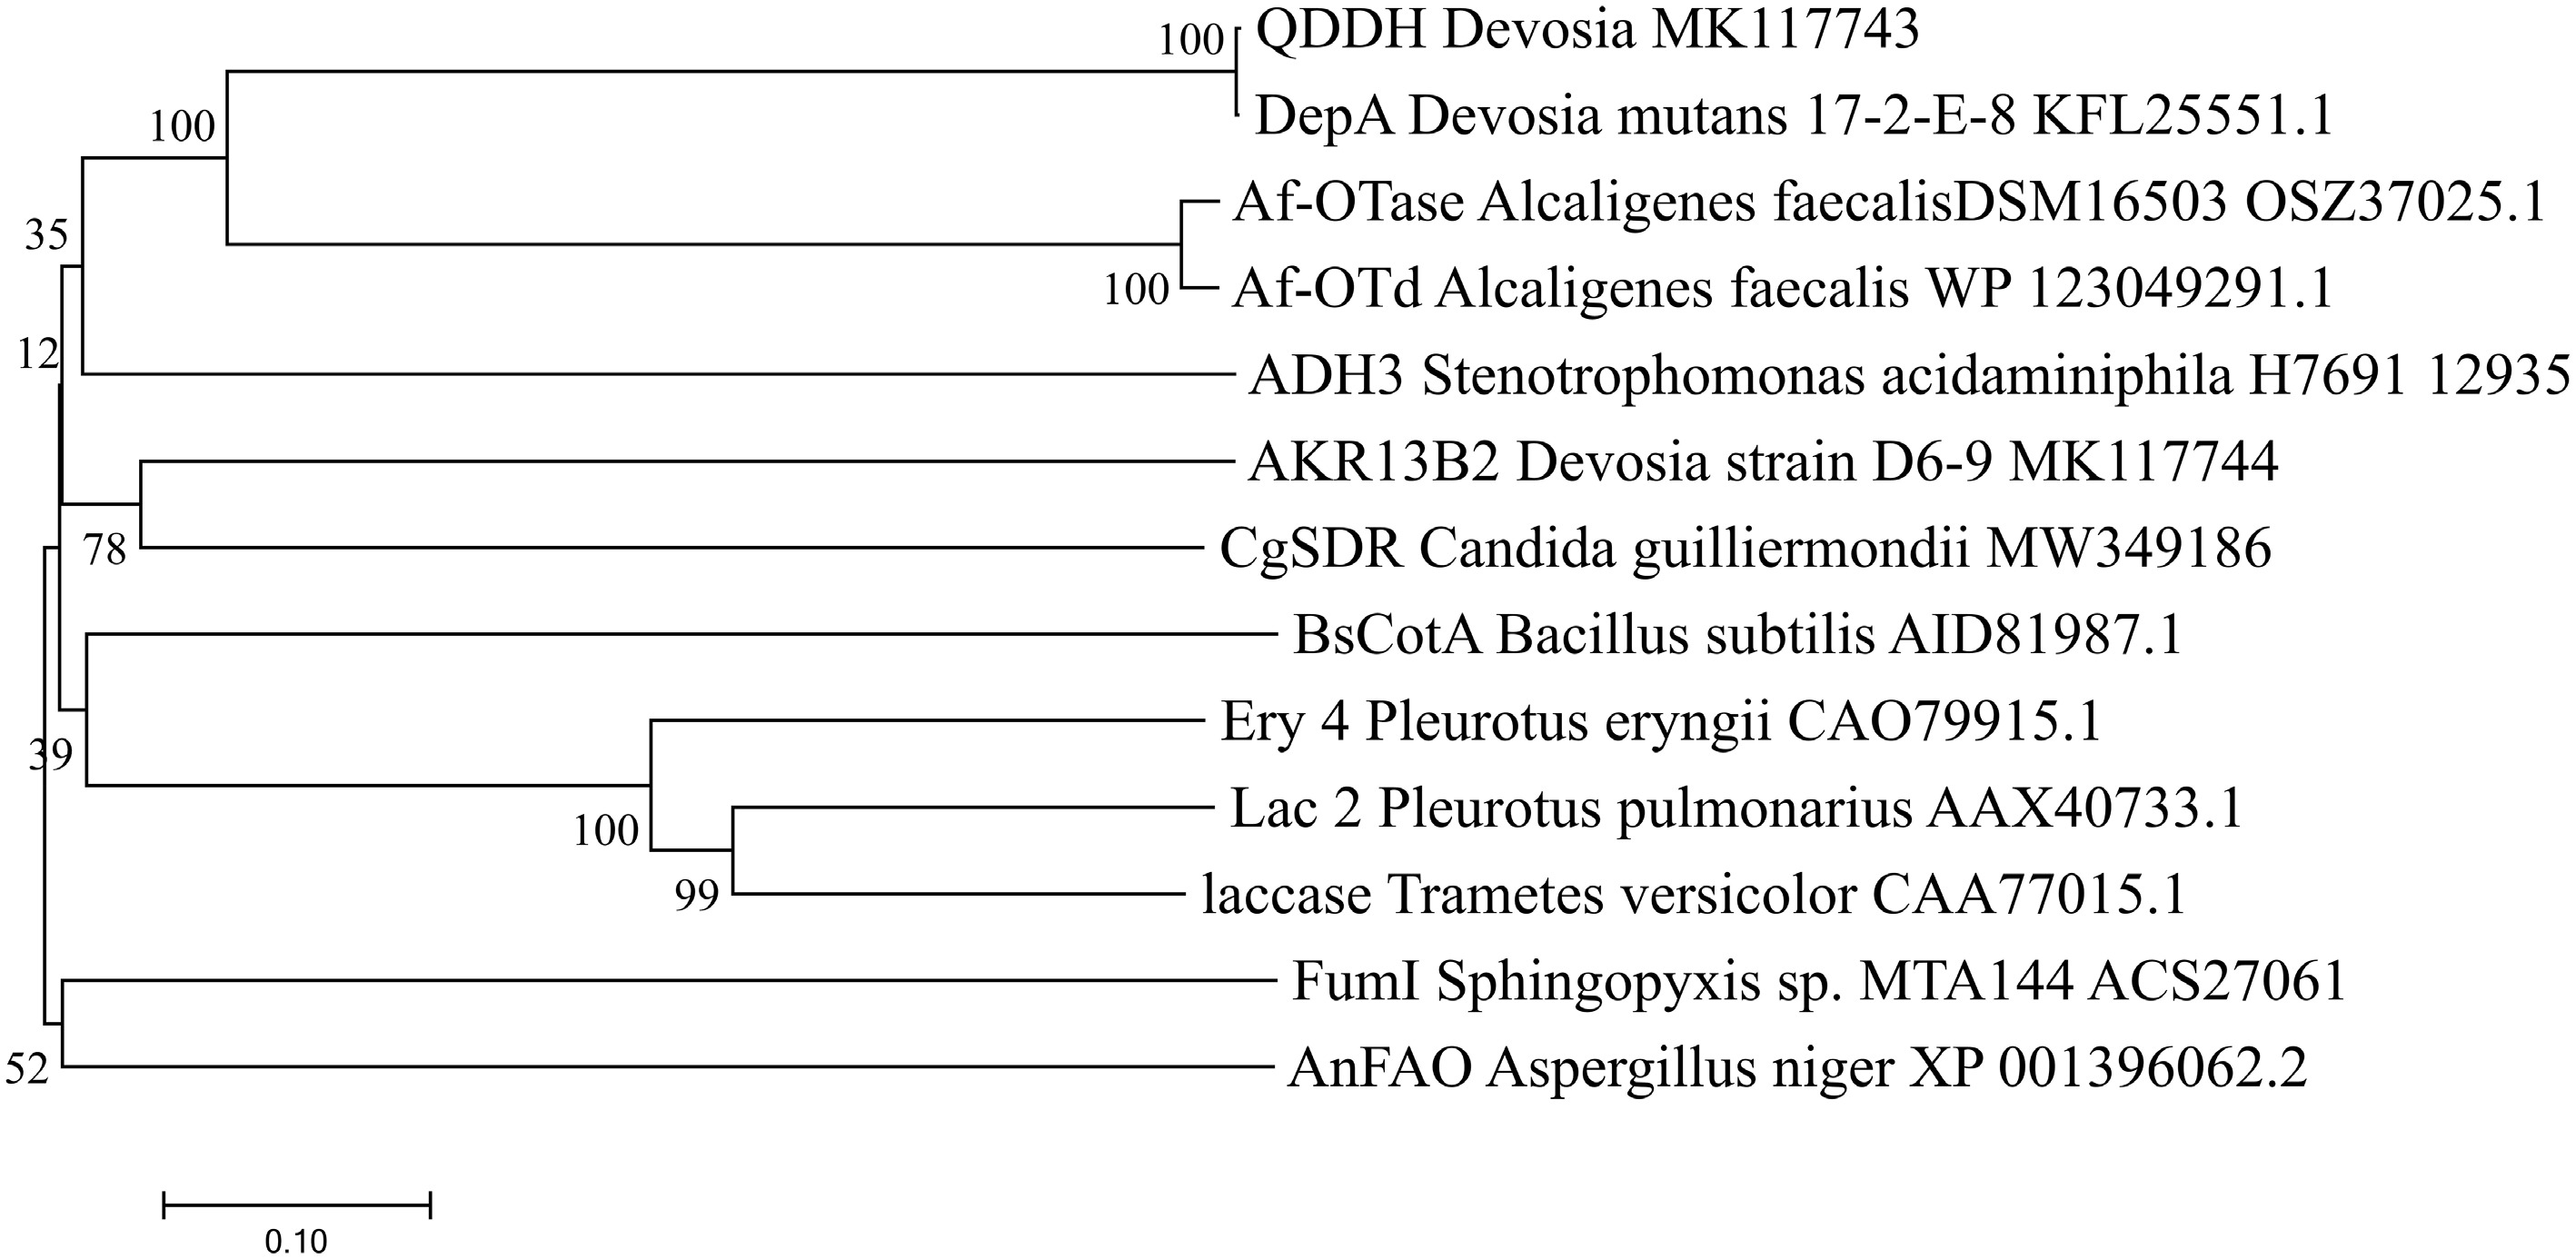
Figure 4.
Phylogenetic tree of the 13 mycotoxin-degrading enzyme candidates. The tree was constructed using the neighbor-joining (NJ) method based on multiple sequence alignment generated by ClustalW in MEGA 7.0.26. Bootstrap values from 1,000 replicates are shown at each branch node. Scale bar represents 0.10 substitutions per site.
-
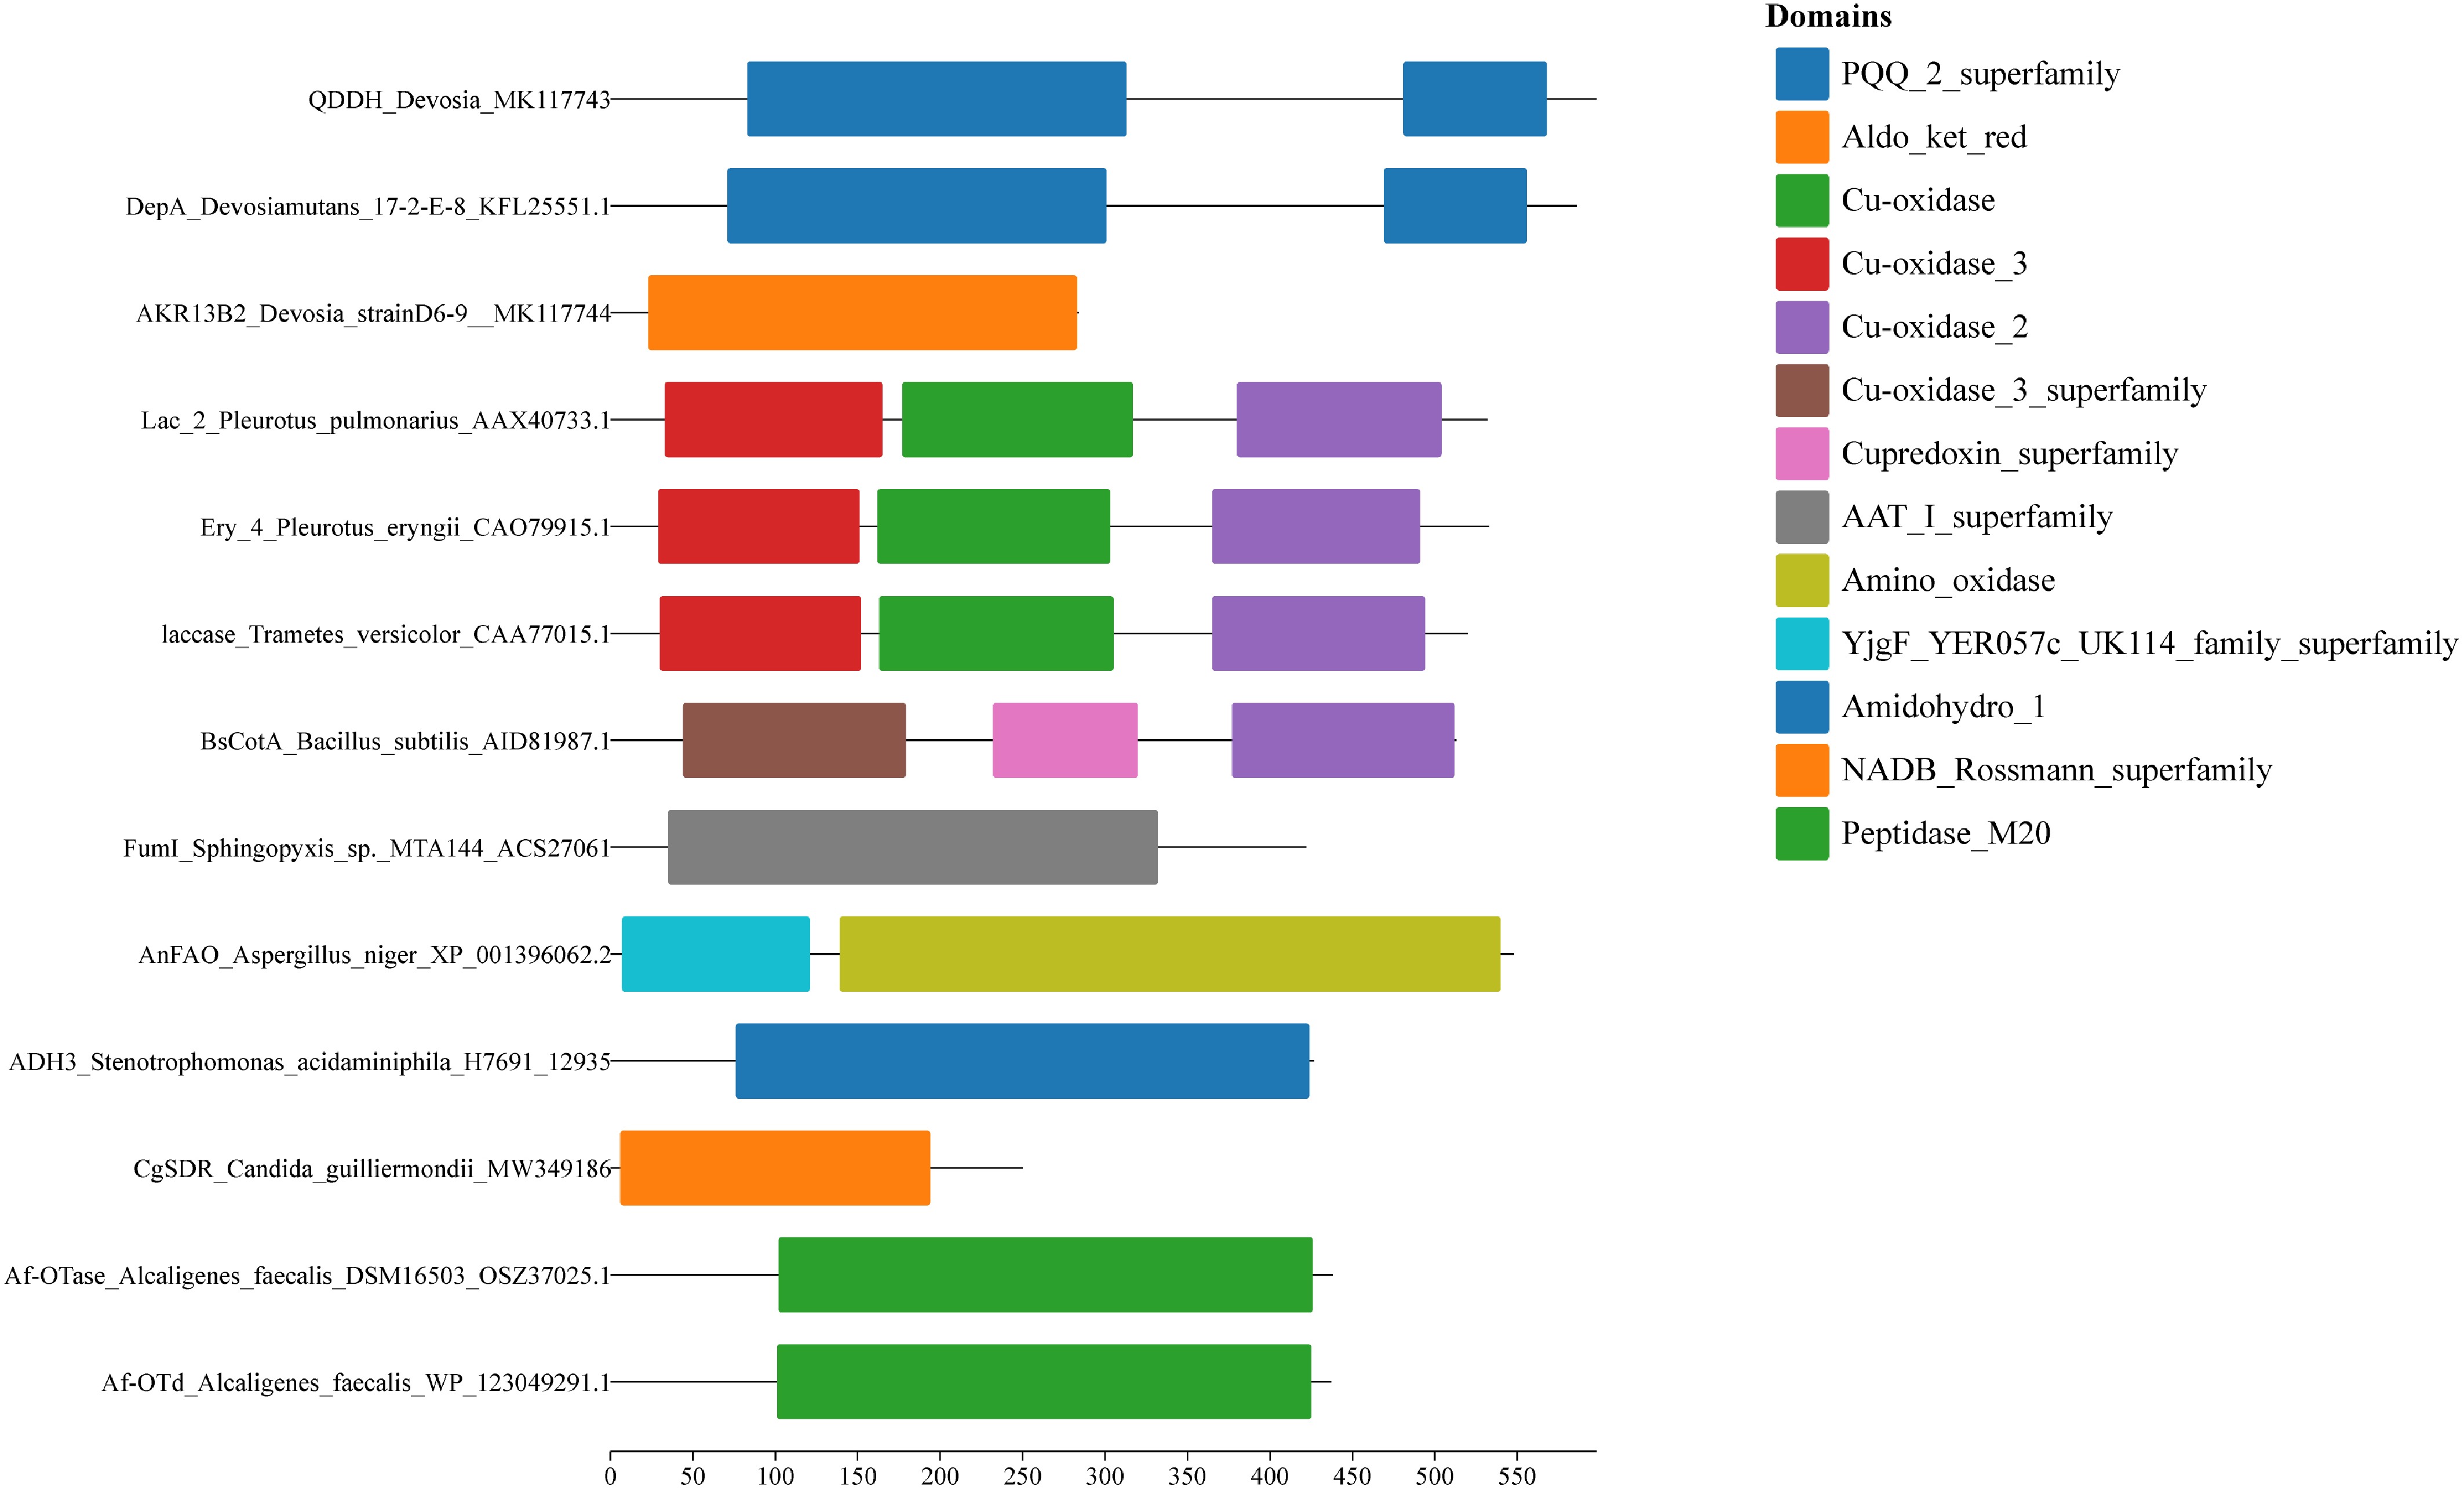
Figure 5.
Domain architecture diagrams of the 13 mycotoxin-degrading enzyme candidates. Domain predictions were obtained from the NCBI Conserved Domain Database (CDD) and visualized using Chiplot. Each colored block represents a conserved domain, with domain types indicated in the legend on the right. The x-axis represents amino acid position, and domain lengths are shown to scale.
-
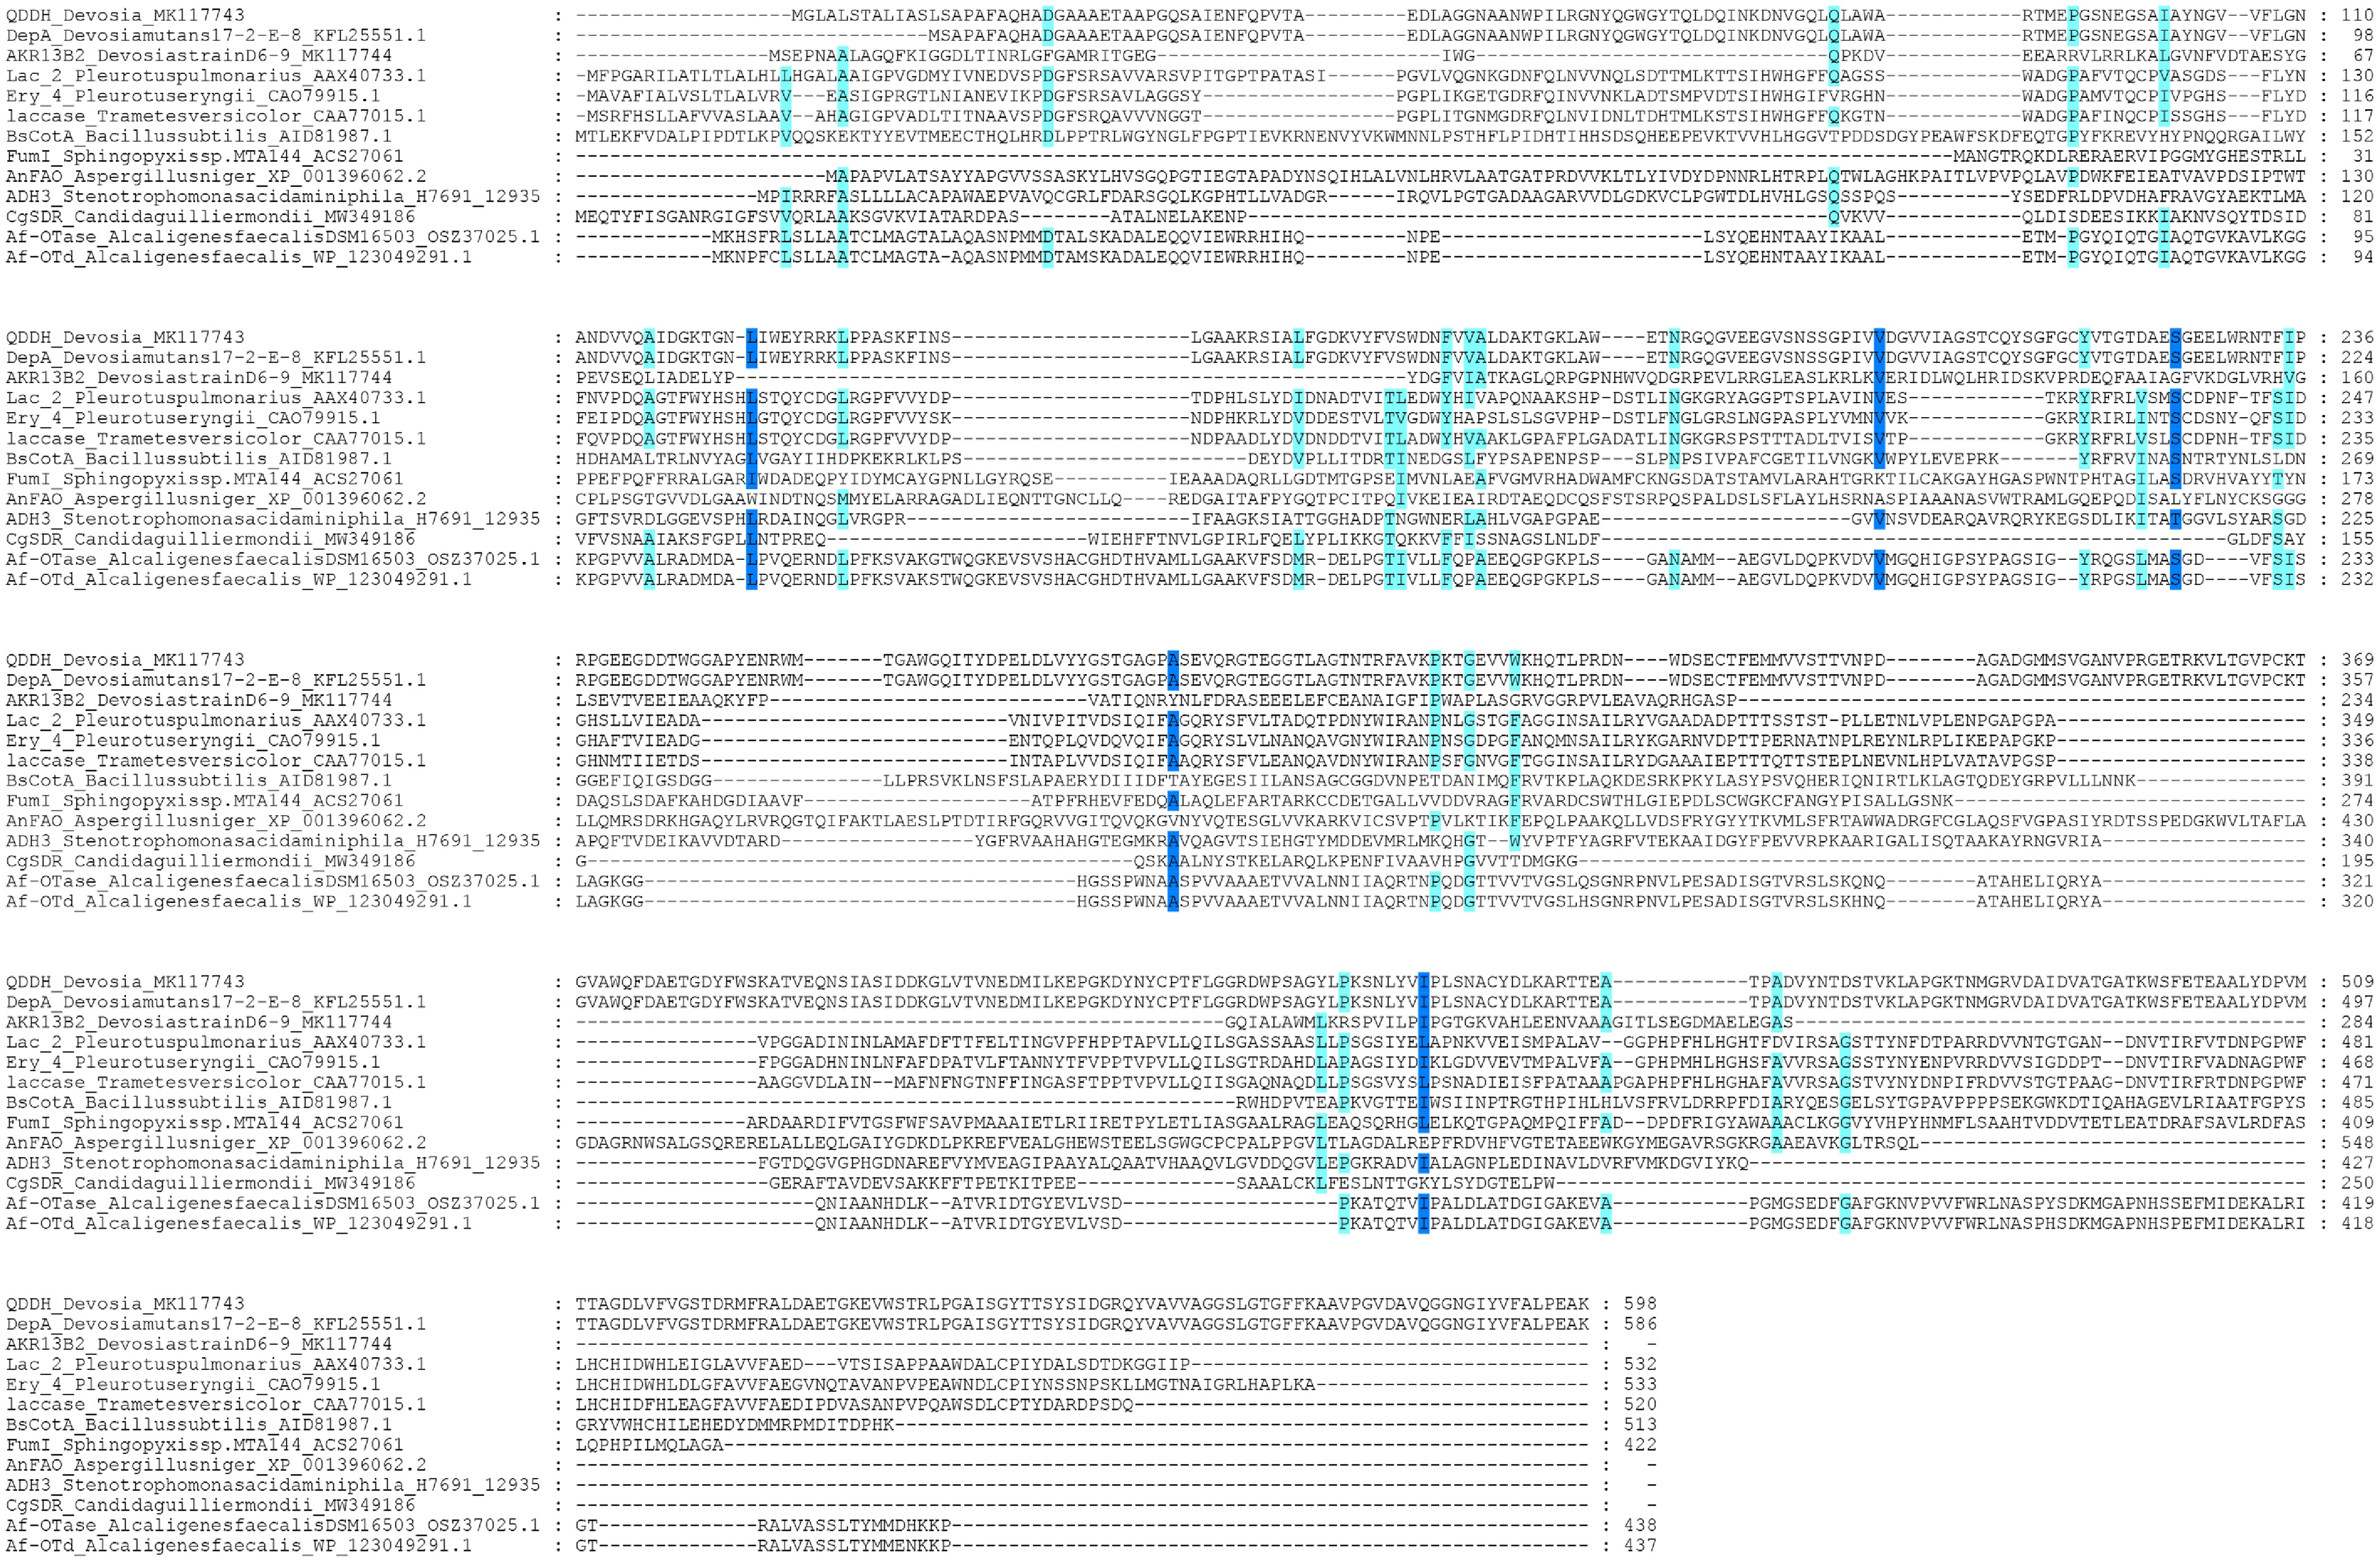
Figure 6.
Multiple sequence alignment of the 13 mycotoxin-degrading enzyme candidates. Sequences were aligned using ClustalW in MEGA 7.0.26 and visualized using Genedoc. Conserved residues are highlighted with shading, with darker shading indicating higher conservation across sequences. Gaps represent insertions or deletions relative to the consensus alignment.
-
Pipeline Ours Ref. [28] Ref. [29] Ref. [11] Ref. [30] Ref. [14] Ref. [27] Ref. [31] Ref. [32] Ref. [33] Ref. [34] Ref. [35] Ref. [36] Determining the
key words√ √ √ √ √ Term validation √ √ √ √ √ Semantic enrichment √ √ √ √ √ √ Applying boolean
operators√ √ √ √ Utilizing truncation
and wildcards√ √ √ Selecting appropriate
databases√ √ √ √ √ Compiling databases √ √ Removing duplicate
literature√ √ Excluding irrelevant
literature√ √ √ Information extraction √ √ √ √ √ Model evaluation √ √ √ √ √ √ √ Information retrieval
techniques√ Note: √ indicates that the proposed pipeline has this property. Table 1.
Comparison of existing pipelines.
Figures
(6)
Tables
(1)