-
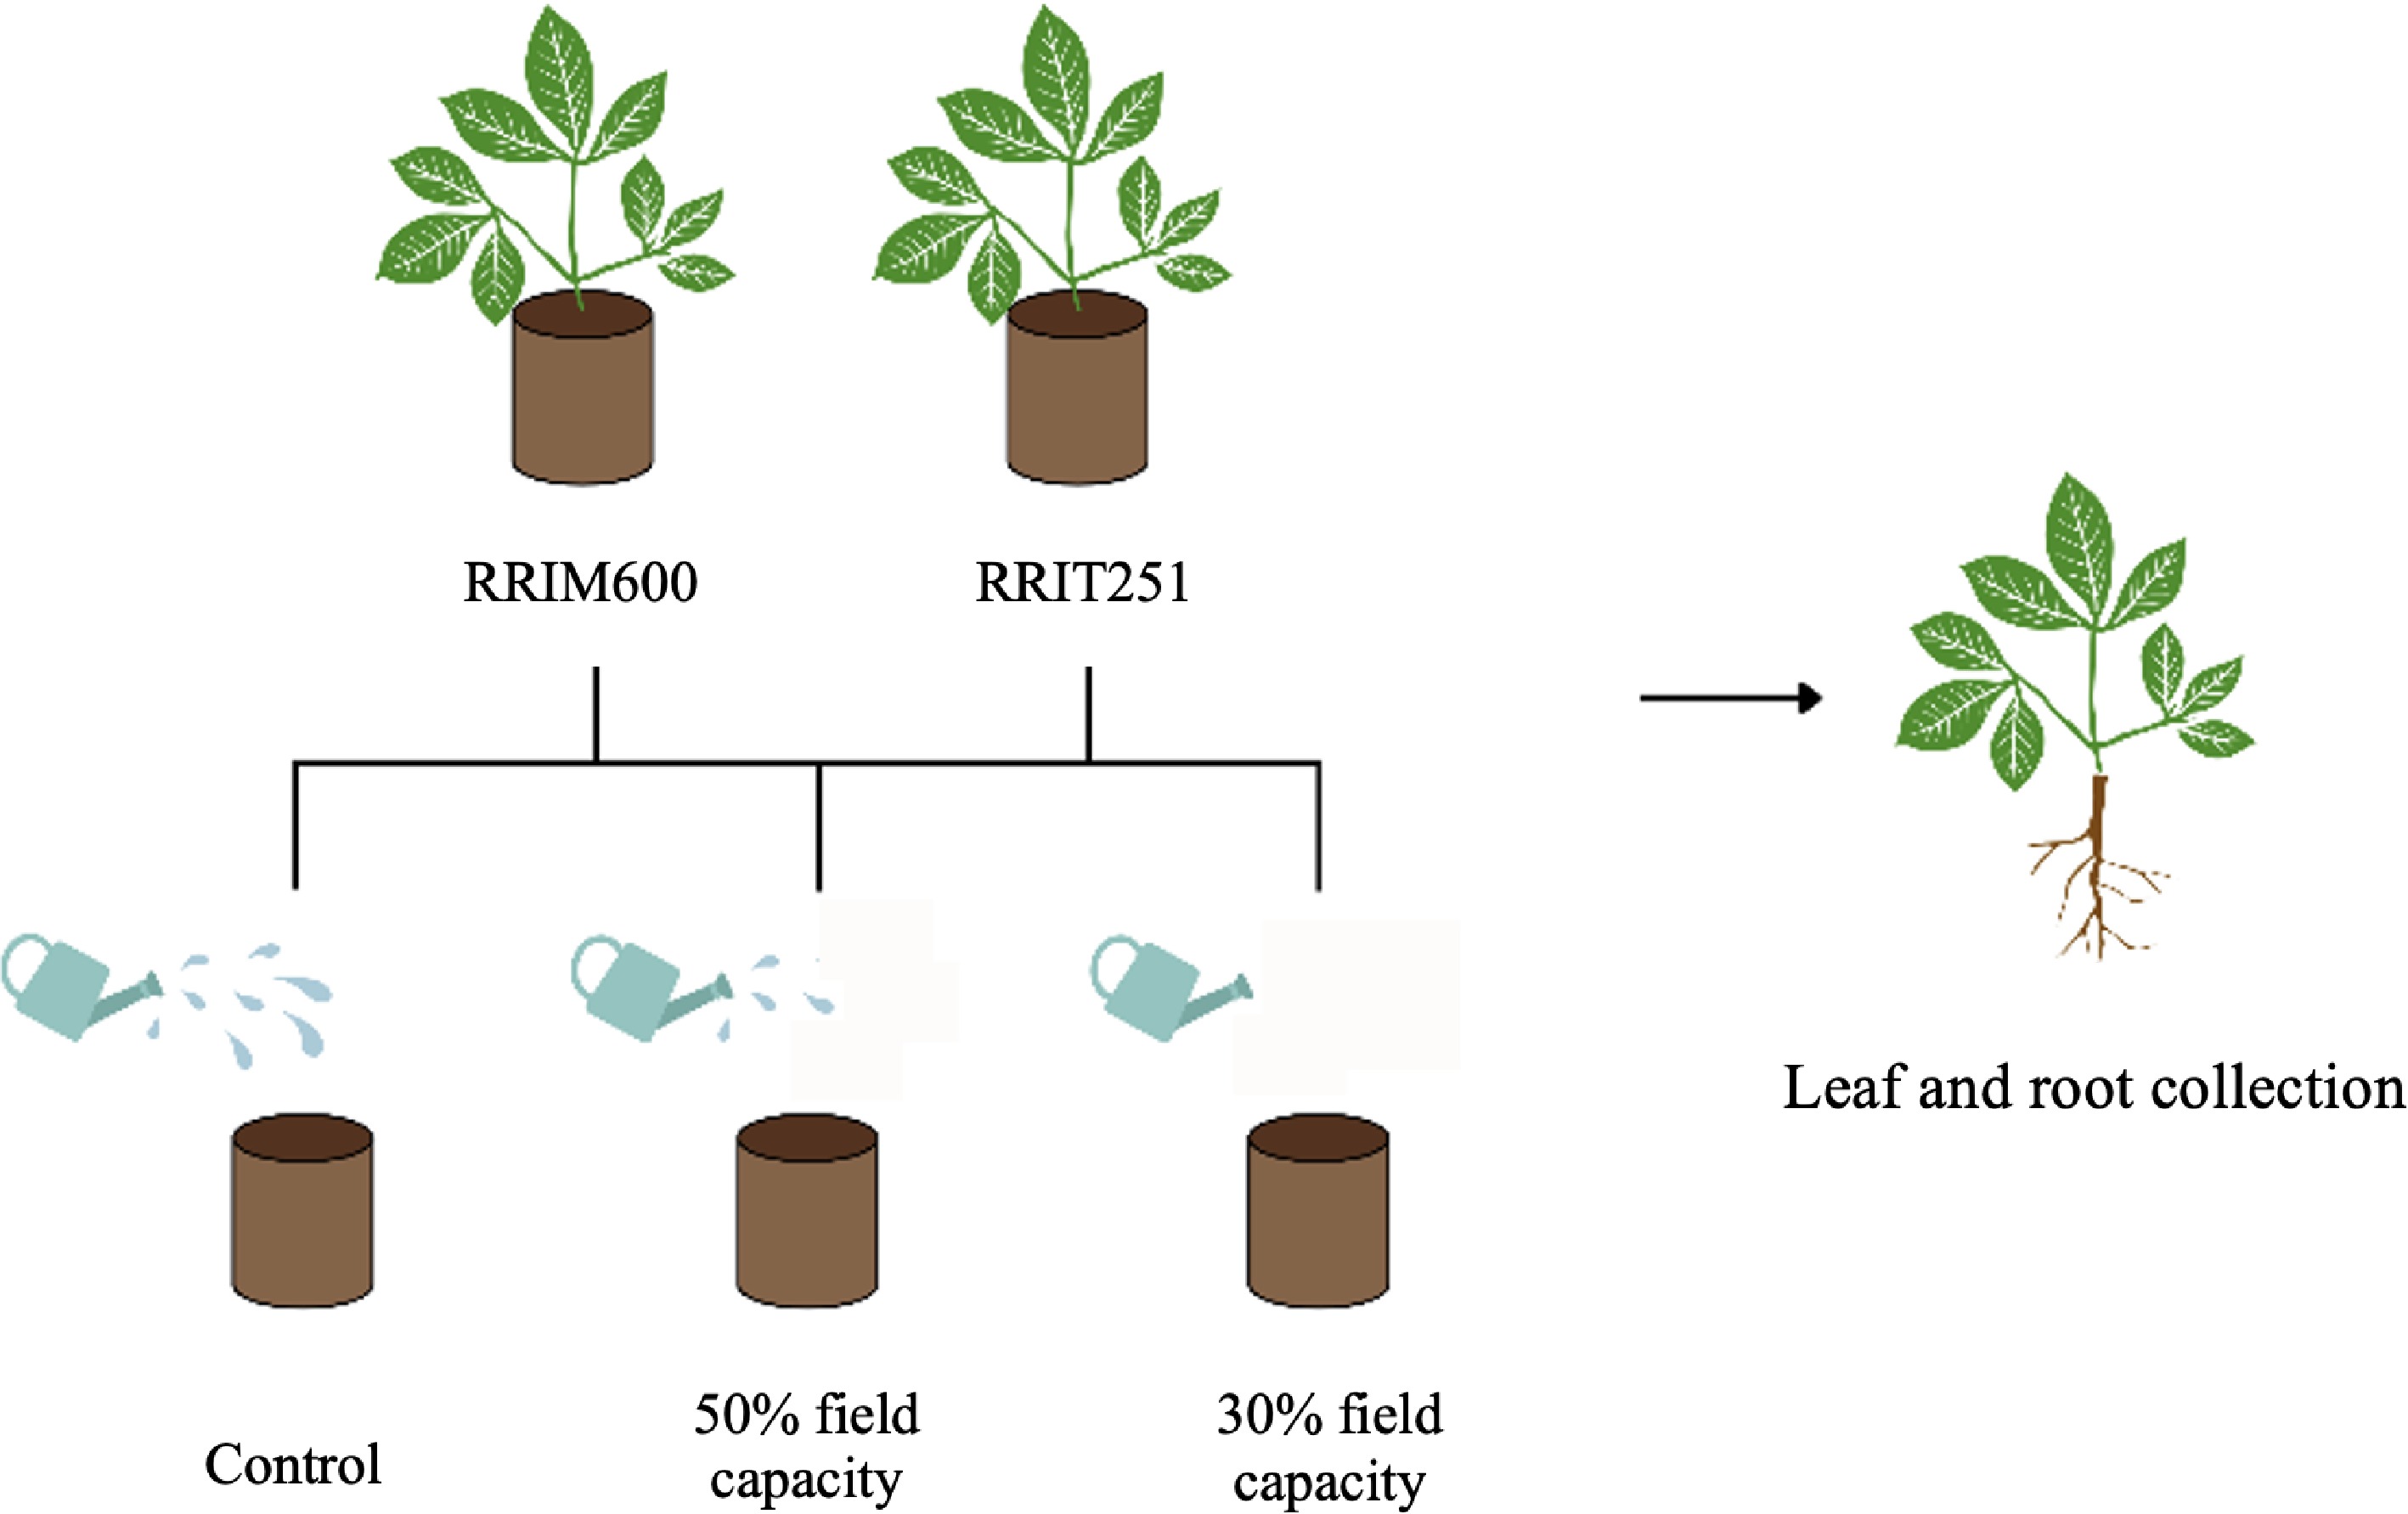
Figure 1.
Experimental design for drought stress treatments in H. brasiliensis. Two rubber tree clones, RRIM 600 and RRIT 251, were subjected to three soil moisture regimes: Well-watered at 85%–100% field capacity (control), moderate drought stress at 50% field capacity, and severe drought stress at 30% field capacity. Soil water content was monitored continuously using the gravimetric method and adjusted daily to maintain the target water levels.
-
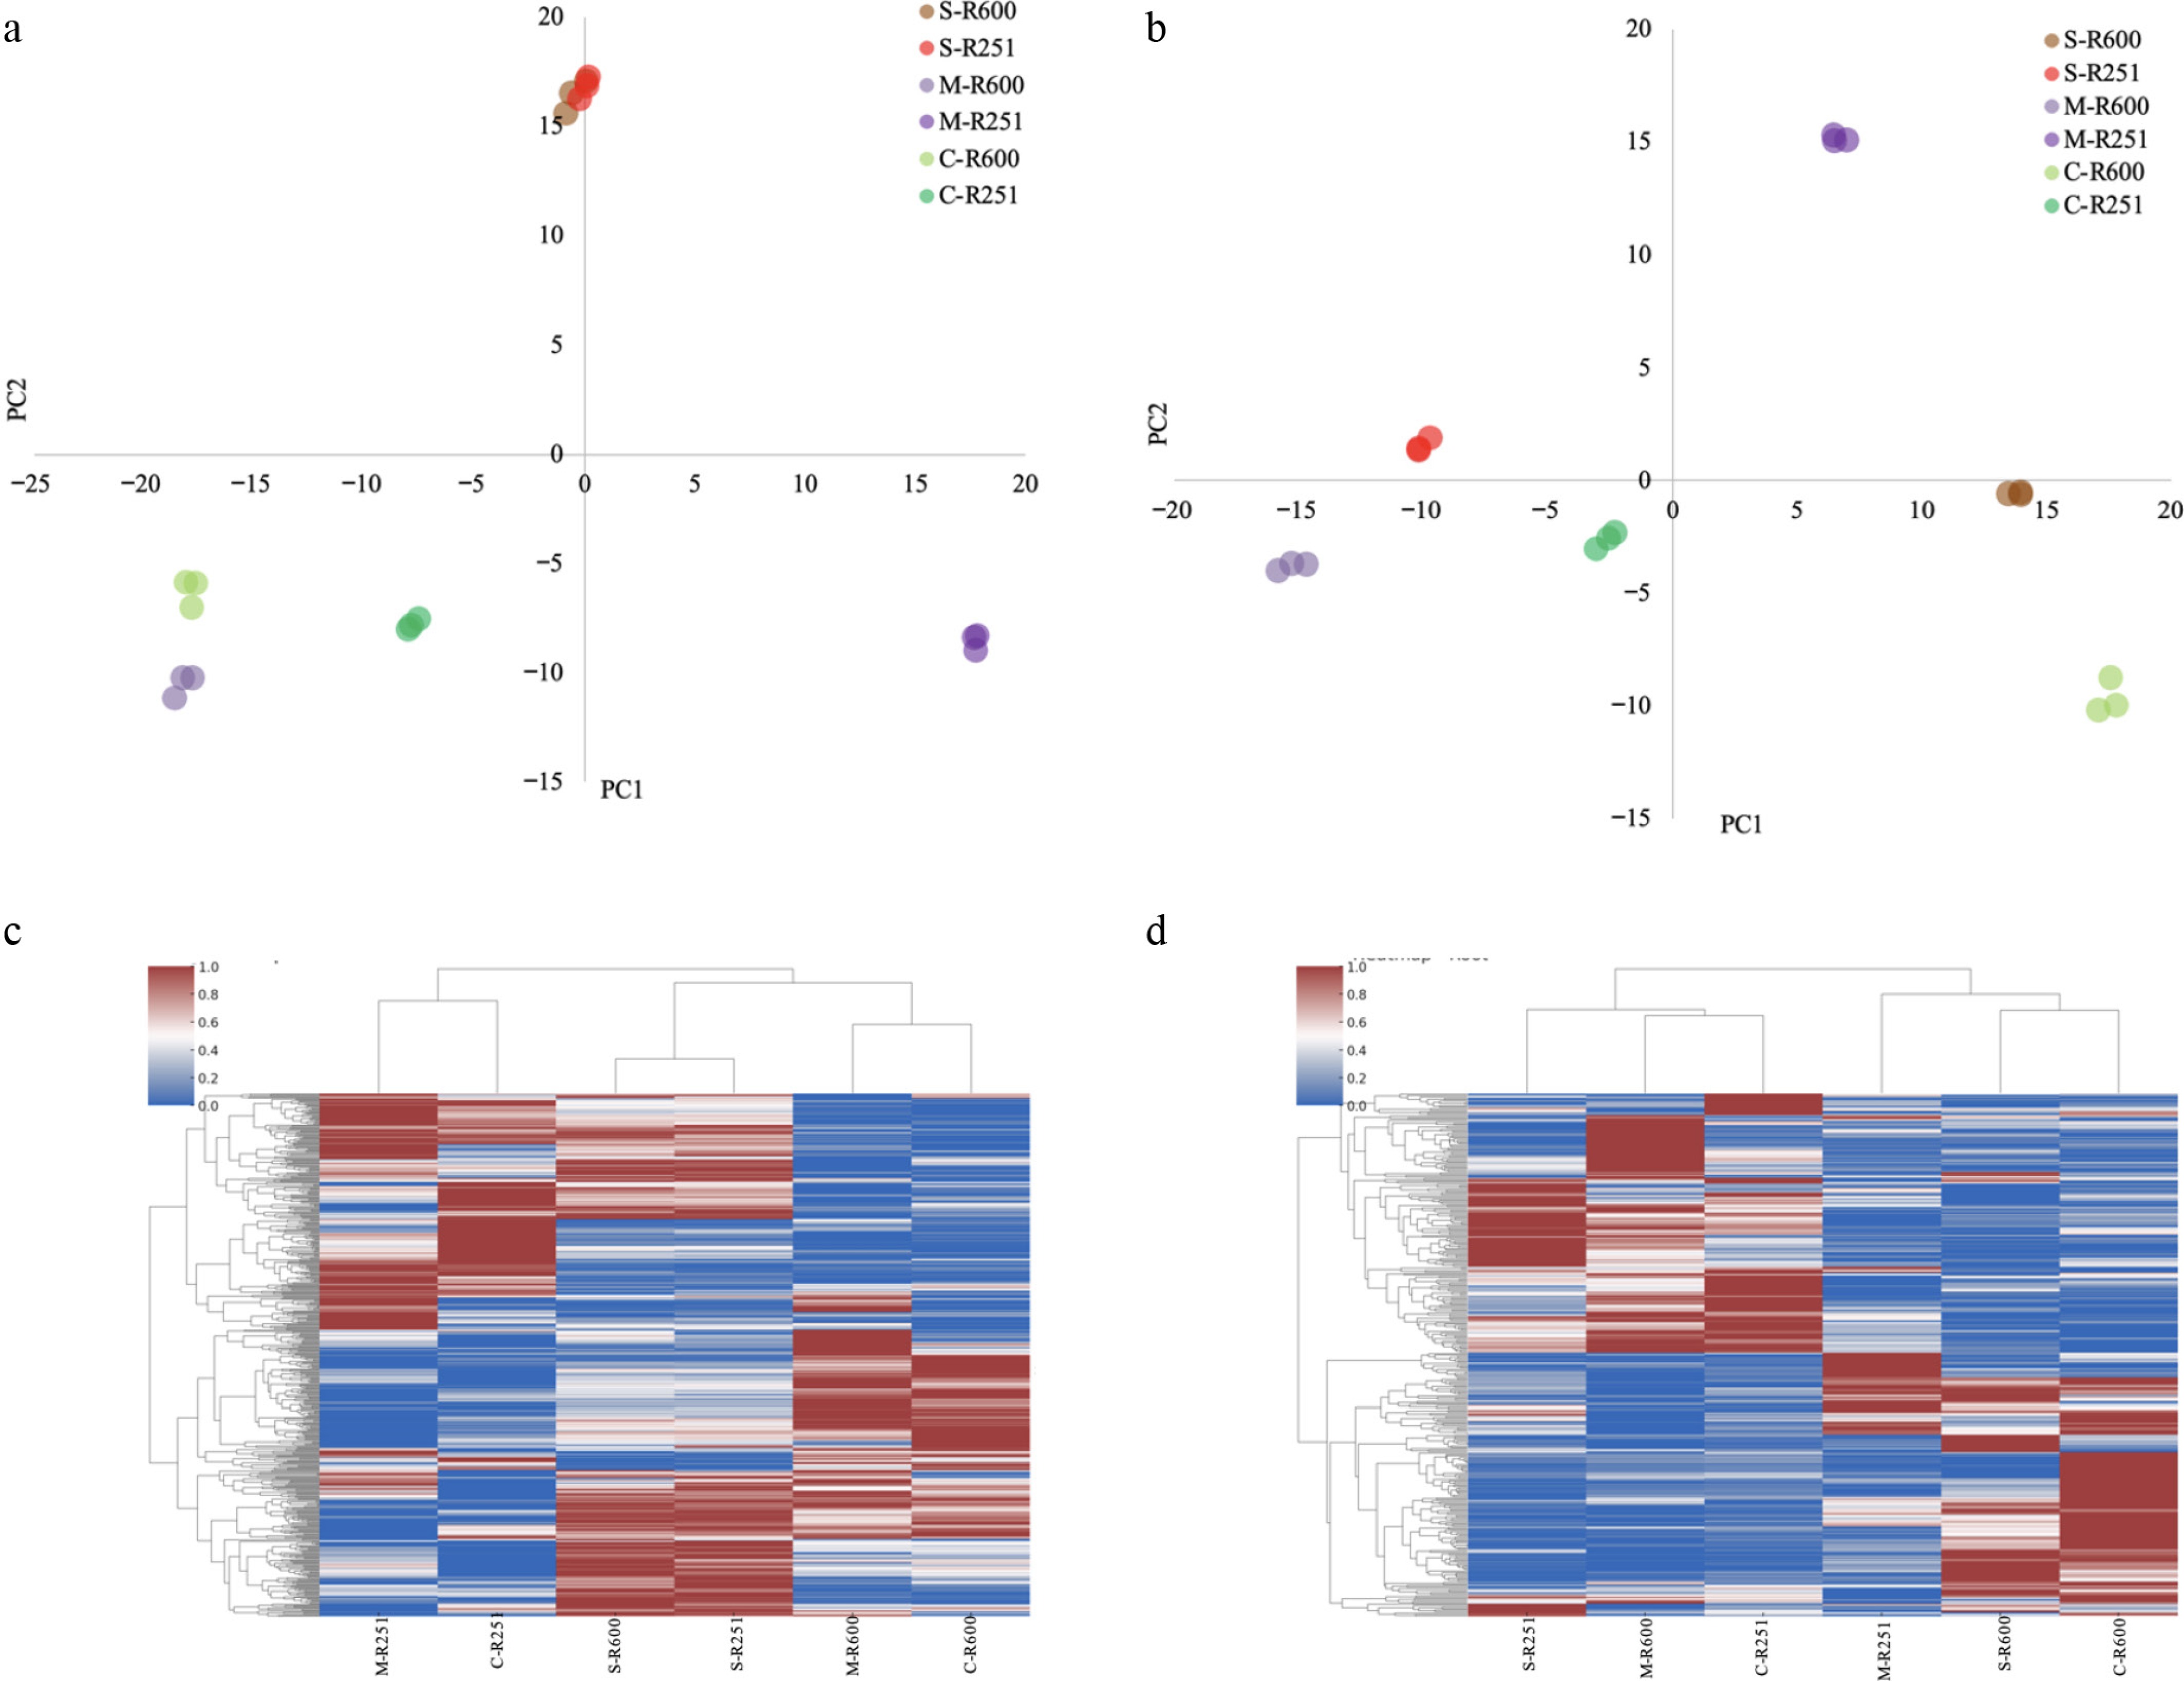
Figure 2.
Multivariate and hierarchical clustering analysis of metabolite profiles in leaf and root tissues of RRIM 600 and RRIT 251 under different soil moisture conditions (85%, 50%, and 30% field capacity). (a) PCA of leaf metabolite profiles and root metabolite profiles (b). The x-axis and y-axis represent the first and second principal components, explaining the highest proportions of total variance in the dataset. Clustering by drought severity and cultivar is observed. Hierarchical clustering heatmap of (c) leaf metabolites and (d) root metabolites. Columns represent treatment groups labeled by field capacity and cultivar; rows represent individual metabolites. Clustering was based on average linkage and Euclidean distance. Color gradients reflect standardized (z-score) abundance values across samples.
-
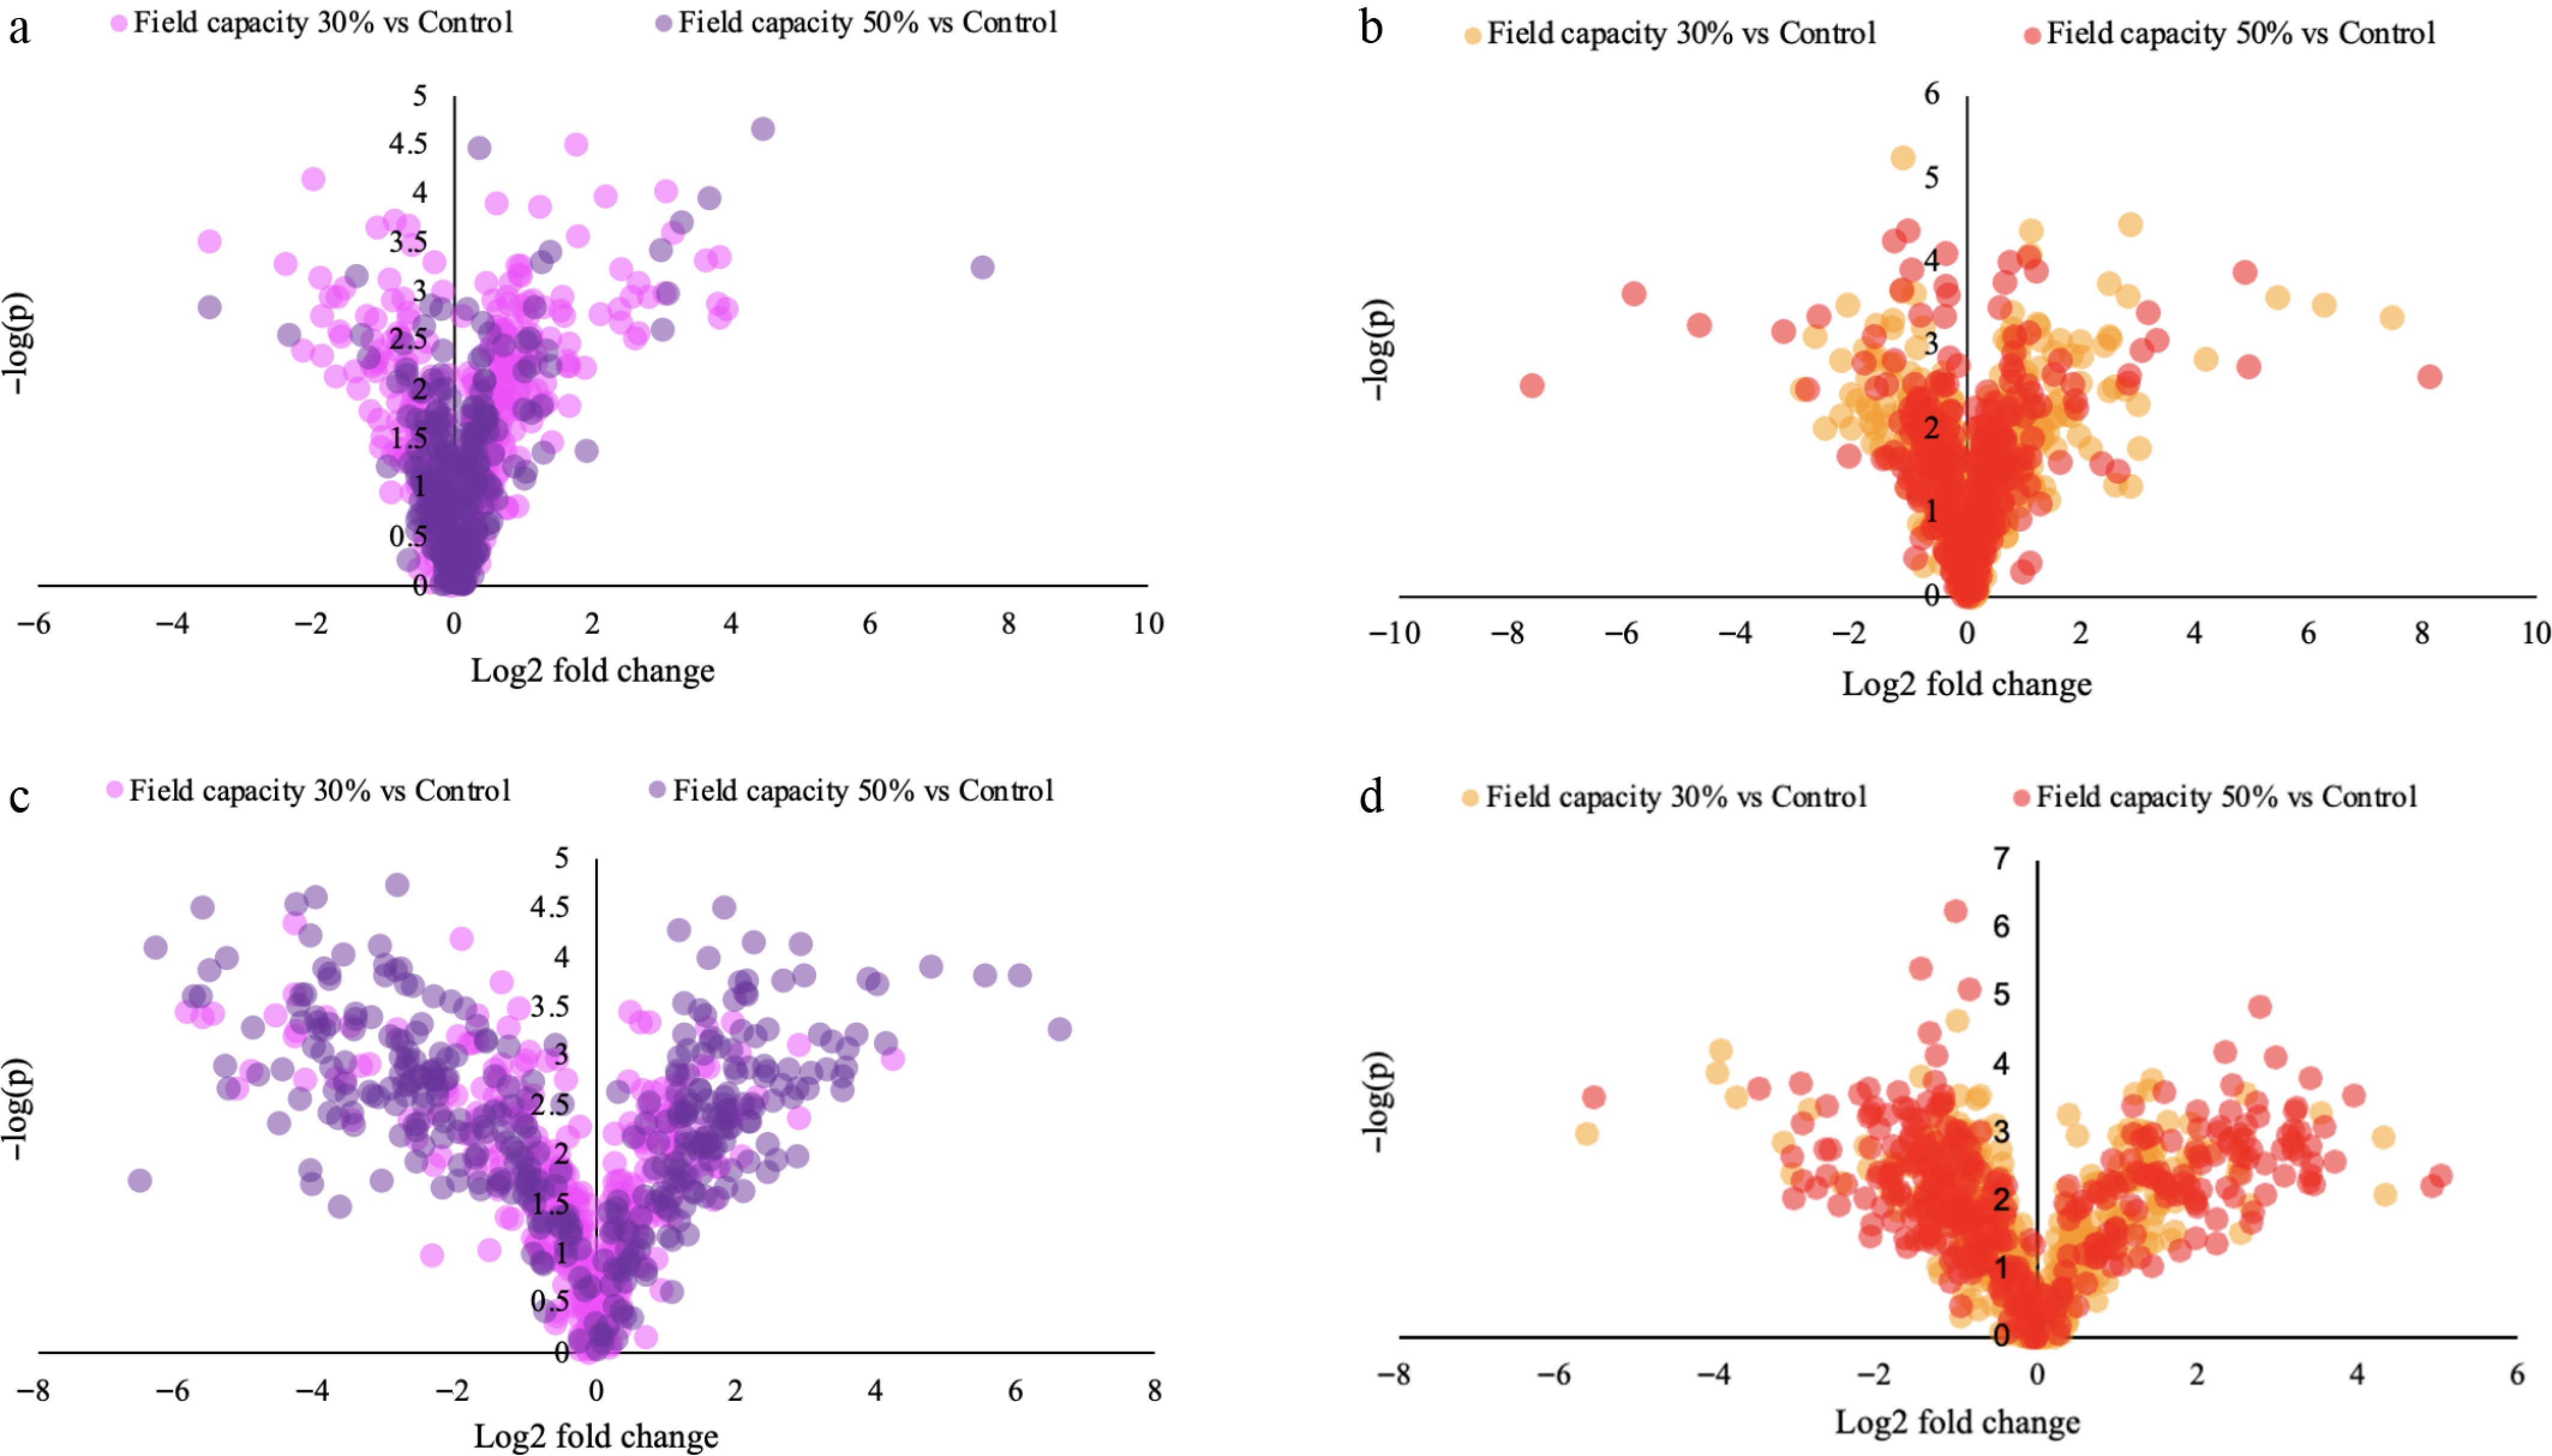
Figure 3.
Differential abundance of metabolites under drought stress relative to the well-watered controls (85% field capacity) in RRIM 600 and RRIT 251. (a) Leaves of RRIM 600, (b) leaves of RRIT 251, (c) roots of RRIM 600, and (d) roots of RRIT 251. Each panel displays metabolite differences, with log2 fold change plotted on the x-axis and –log10(p) on the y-axis.
-
Clone Field capacity Fv/Fm SD Significant RRIM 600 Control; 85% 0.808 0.005 − 50% 0.792 0.005 * 30% 0.665 0.008 ** RRIT 251 Control; 85% 0.823 0.005 − 50% 0.788 0.035 ns 30% 0.658 0.014 ** Data are expressed as the mean ± standard deviation (n = 2). Asterisks indicate statistically significant differences from the control within the same clone (* p < 0.05; ** p < 0.01), and 'ns' denotes nonsignificant differences. Table 1.
Maximum quantum efficiency of PSII (Fv/Fm) in two rubber tree clones under progressive drought stress.
-
MS mode Name Formular Mass error (ppm) FISh profiling Leaf (−) NP-005013 C16H12O5 0.09 
(−) 4-Carboxy nevirapine C15H12N4O3 −4.25 − (−) (2R)-2-Hydroxy-3-(phosphonooxy)propyl
(9Z)-9-nonadecenoateC22H43O7P −0.13 
Root (+) proline C5H9NO2 
(−) 3-(Sulfooxy)butanoic acid C4H8O6S −0.25 
(+) Sphondin C12H8O2 
The table lists the ionization mode, metabolite name, chemical formula, and annotation mass error (ppm). FISh profiling is noted for compounds with confirmed fragmentation spectra supporting structural identification. In the FISh profiling '–' denotes compounds for which FISh fragmentation data could not be assigned because of database or adduct limitations. Table 2.
Top-ranking metabolites identified in rubber leaf and root tissues under drought stress (30% field capacity) with molecular annotation details.
-
Accession Protein name Field capacity 50% Field capacity 30% Ratio Adj. p Ratio Adj. p A0A6A6LI27 VWFA domain-containing protein 100 < 0.0001 100 < 0.0001 A0A6A6N915 Uncharacterized protein 3.017 0.0447 1.547 0.5569 A1E2C0 Beta glucosidase 2.993 0.0461 0.602 0.8463 A0A6A6KRE5 Cytochrome c oxidase subunit 6b-1 2.724 0.0757 1.155 0.8612 A0A6A6LJS0 60S acidic ribosomal protein P2 2.297 0.1731 1.739 0.4201 A0A6A6M521 NADP-dependent oxidoreductase domain-containing protein 1.377 0.7294 0.219 0.0196 A0A6A6KPX3 Peroxidase 1.100 0.9095 0.010 < 0.0001 A0A6A6KWE6 Uncharacterized protein 1.043 0.9245 5.929 0.0002 A0A6A6MJD2 Bet v I/Major latex protein domain-containing protein 0.540 0.6049 2.923 0.0389 A0A6A6KC03 NAD(P)H dehydrogenase (quinone) 0.518 0.5591 0.01 < 0.0001 A0A6A6KZZ5 Cyclase family protein 0.390 0.2292 0.203 0.0117 A0A6A6LUJ9 Glutathione transferase 0.278 0.0447 2.638 0.0699 A0A6A6LGP0 Annexin 0.188 0.0034 0.807 0.9902 A0A6A6MNG7 Bet v I/Major latex protein domain-containing protein 0.186 0.0033 3.189 0.0224 A0A6A6MIQ2 GST N-terminal domain-containing protein 0.182 0.0029 1.021 0.9251 A0A2K8BTD2 Tonoplast intrinsic protein 0.153 0.0007 0.010 0.0000 A0A6A6M2Y3 Nucleoside phosphorylase domain-containing protein 0.052 < 0.0001 0.779 0.9715 Fold-change ratios (relative to the well-watered control) and adjusted p-values (Benjamini–Hochberg FDR) are shown only for proteins with significant differential abundance. Table 3.
Differentially expressed root proteins in RRIM 600 under moderate and severe drought stress.
-
Accession Protein name Field capacity 50% Field capacity 30% Ratio Adj. p-value Ratio Adj. p-value A0A6A6LUJ9 Glutathione transferase 6.270 0.0006 7.852 0.0002 A0A6A6LVE8 (S)-2-hydroxy-acid oxidase 0.844 0.9633 5.580 0.0036 A0A6A6KK80 Uncharacterized protein 3.800 0.0214 4.318 0.0235 A0A6A6NF79 Annexin 0.616 0.8010 4.169 0.0295 A0A6A6KM18 Bet v I/Major latex protein domain-containing protein 7.896 0.0001 4.078 0.0335 A0A6A6MNG7 Bet v I/Major latex protein domain-containing protein 6.338 0.0005 2.767 0.2265 A0A6A6KA07 Uncharacterized protein 14.831 < 0.0001 2.471 0.3462 A0A6A6MJD2 Bet v I/Major latex protein domain-containing protein 5.627 0.0014 1.796 0.7386 A0A6A6KJK2 Bet v I/Major latex protein domain-containing protein 0.251 0.0472 1.371 0.9388 A0A6A6LCX6 Monodehydroascorbate reductase (NADH) 0.010 < 0.0001 0.572 0.3689 A0A6A6LI27 VWFA domain-containing protein 0.184 0.0069 0.499 0.2274 A0A6A6M978 Germin-like protein 0.265 0.0628 0.439 0.1333 A0A6A6MJV3 C2 domain-containing protein 0.554 0.7087 0.392 0.0799 A0A6A6L7I8 JAB1/MPN/MOV34 metalloenzyme 0.807 0.9488 0.266 0.0063 A0A2K8BTD2 Tonoplast intrinsic protein 0.266 0.0635 0.128 < 0.0001 A0A6A6KPX3 Peroxidase 2.612 0.1527 0.074 < 0.0001 C9WSP8 Plasma membrane intrinsic protein 0.784 0.9367 0.010 < 0.0001 Fold-change ratios (relative to the well-watered control) and adjusted p-values (Benjamini–Hochberg FDR) are shown only for proteins with significant differential abundance. Table 4.
Differentially expressed root proteins in RRIT 251 under moderate and severe drought stress.
-
Name RRIM 600 RRIT 251 Rate: FC50 p-value Rate: FC30 p Rate: FC50 p-value Rate: FC30 p 6,7,8-Trimethoxy-2H-chromen-2-one 0.14 0.006 1.05 0.654 8.68 0.001 2.772 0.002 Puerarin 0.16 0.001 1.37 0.038 6.76 0.001 3.761 0.001 2-Hydroxyethyl-3-methyl-1,4-naphthoquinone 0.05 0.000 0.55 0.011 5.20 0.001 2.555 0.002 Choline 1.21 0.035 0.57 0.008 0.56 0.002 0.944 0.139 Quercetin 3-isobutyrate 0.03 0.001 0.94 0.619 13.04 0.003 1.309 0.119 Proline 47.16 0.000 7.48 0.001 30.49 0.006 20.447 0.008 Nobiletin 1.33 0.057 1.91 0.009 0.50 0.010 1.003 0.714 Phloretin 0.58 0.022 1.00 0.404 0.76 0.006 0.723 0.002 Myricetin 0.14 0.002 0.80 0.049 0.95 0.155 1.099 0.174 The table shows fold change ratios (FC stands for field capacity) relative to the control and their corresponding p-values. Statistically significant changes are indicated by p < 0.05. Table 5.
Drought-responsive metabolites with known antioxidant or osmoprotectant activities in the roots of two rubber tree clones (RRIM 600 and RRIT 251) under moderate and severe drought stress.
Figures
(3)
Tables
(5)