-
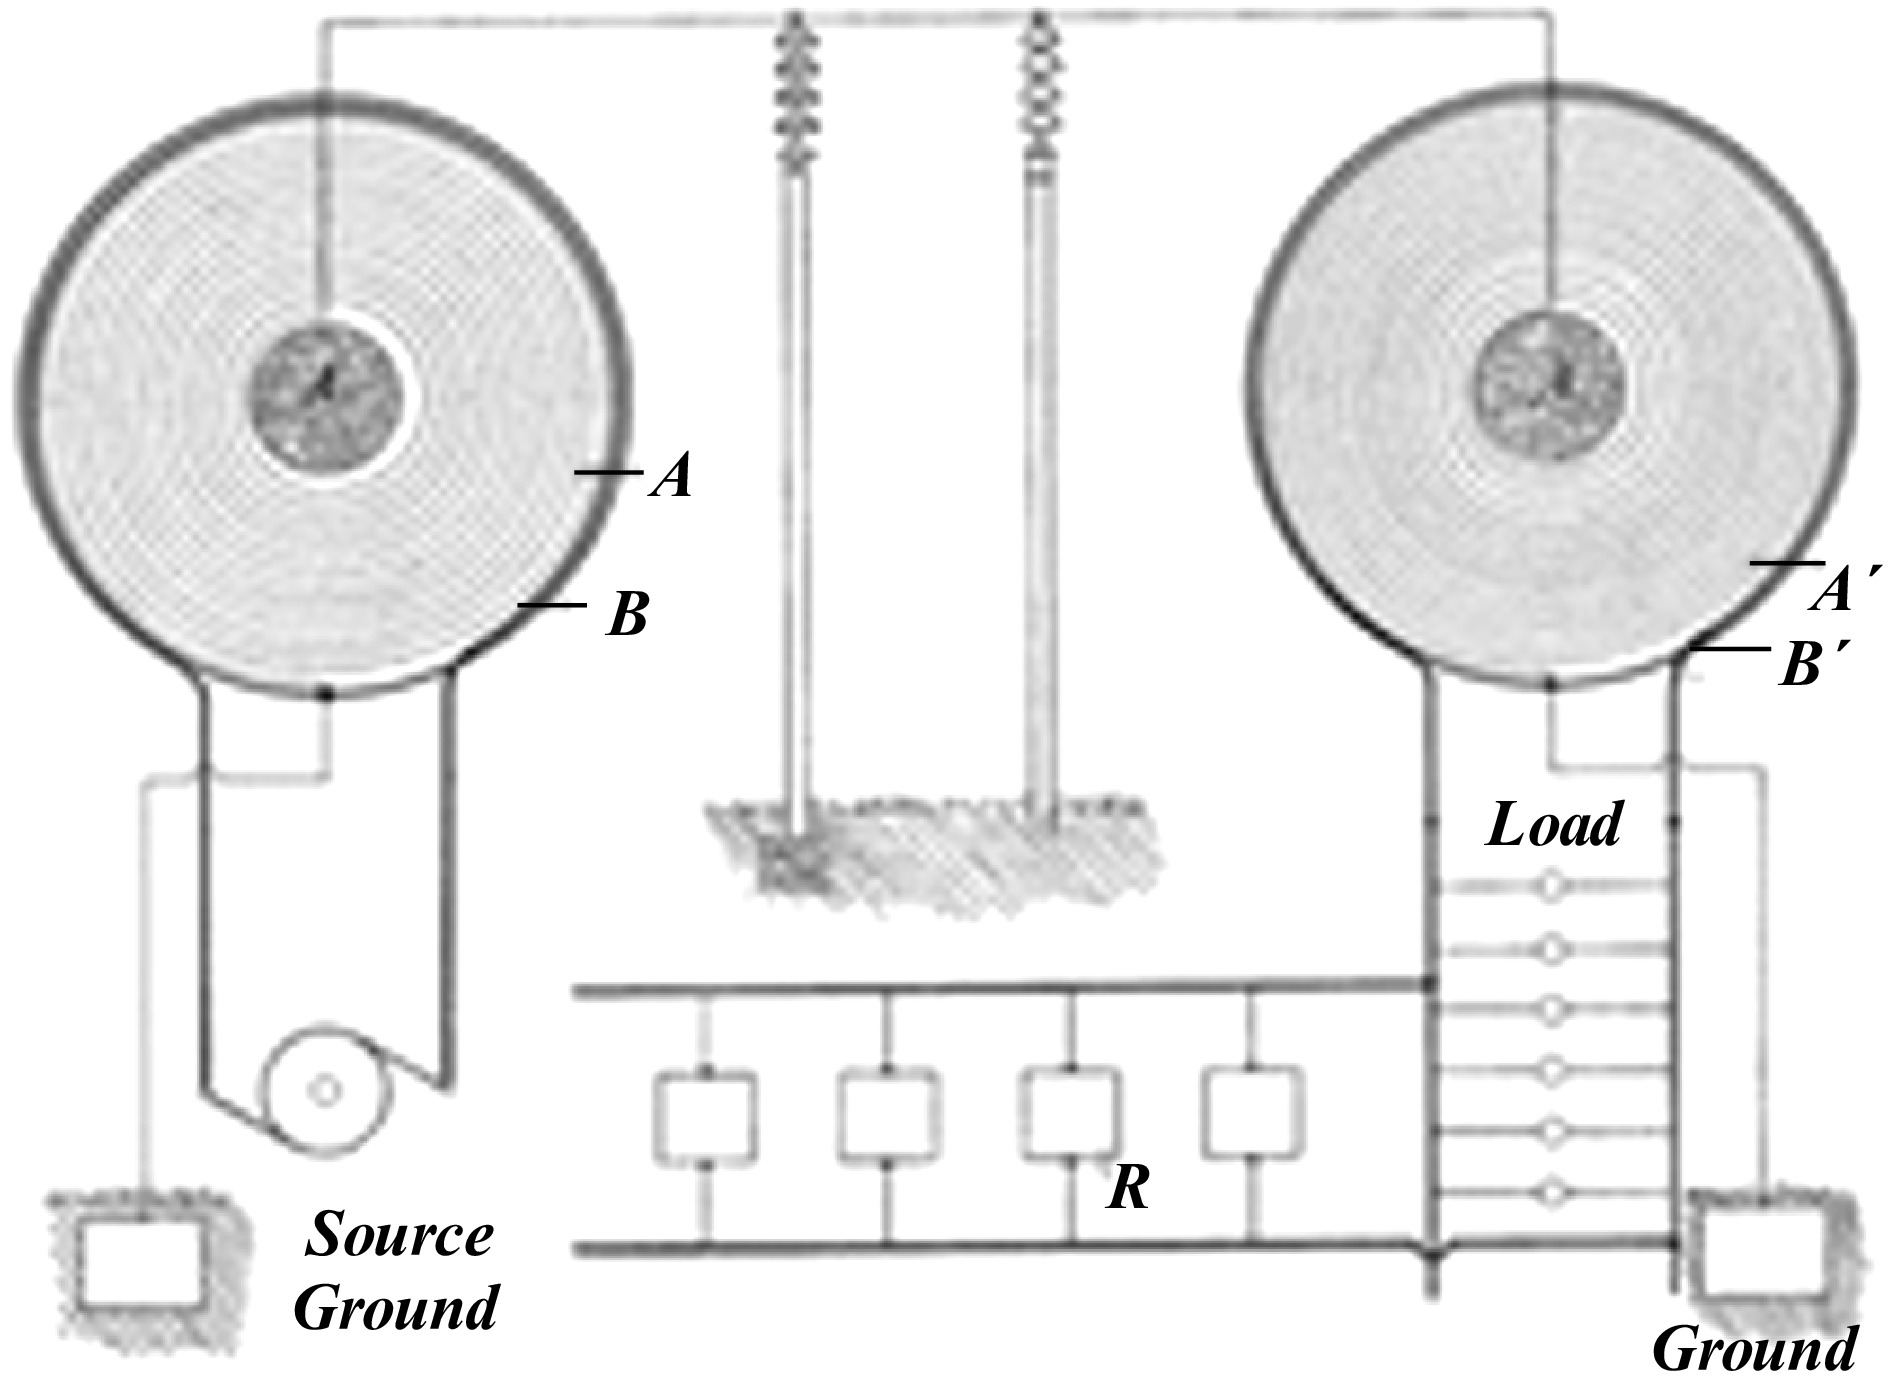
Figure 1.
Tesla's single-wire device.
-
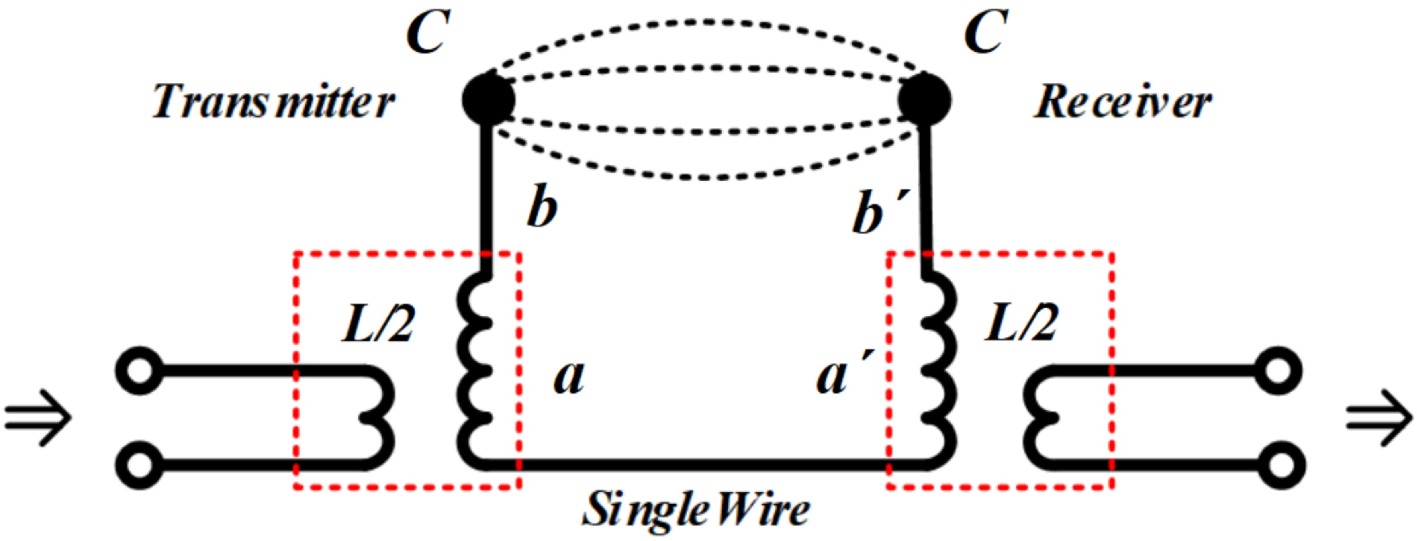
Figure 2.
Typical single-wire device.
-
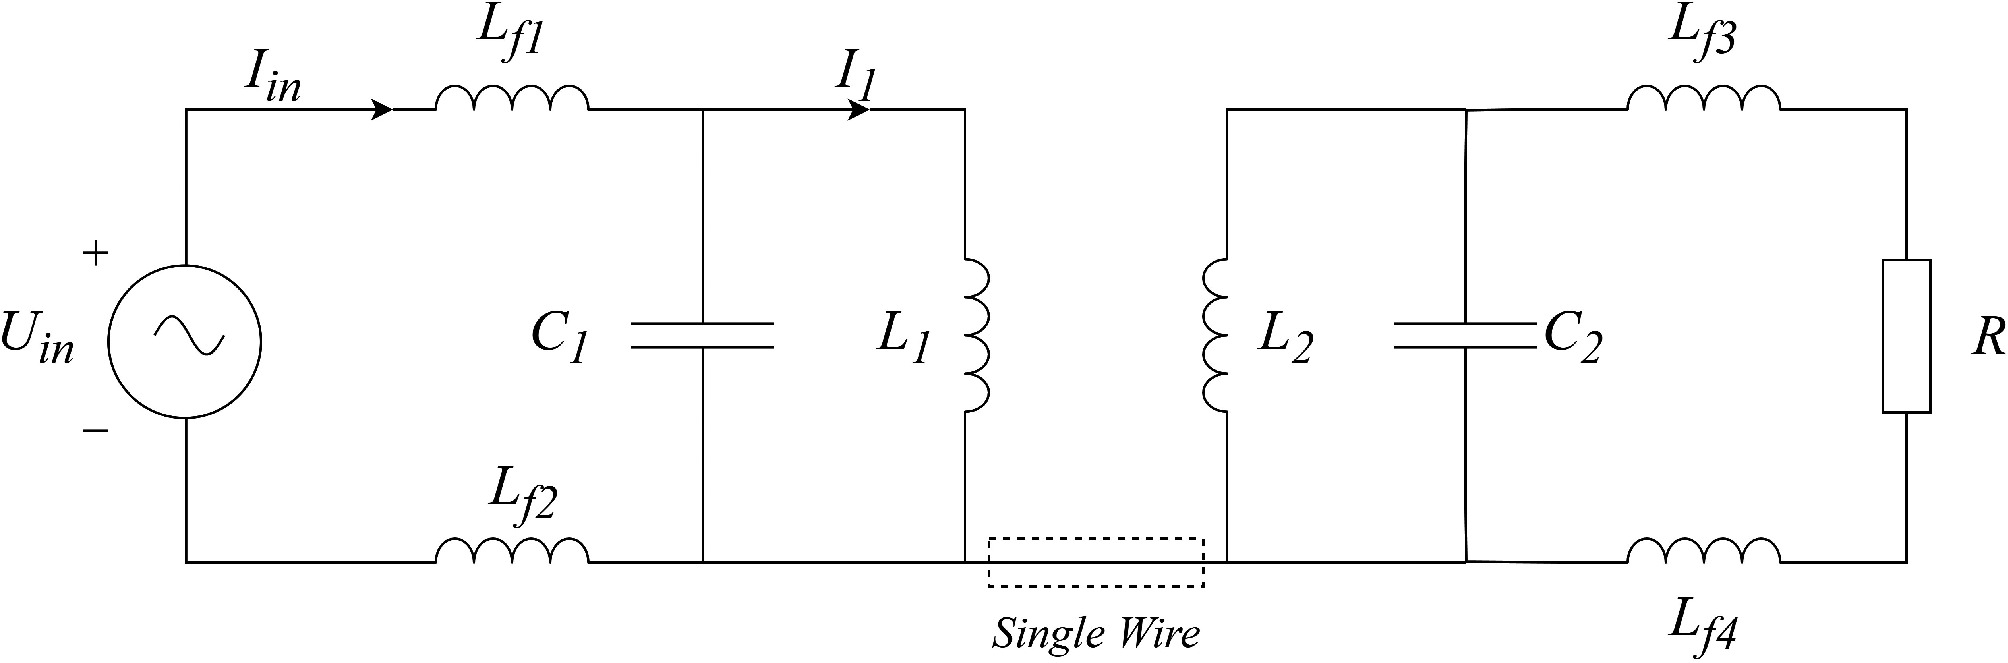
Figure 3.
Schematic diagram of the system.
-
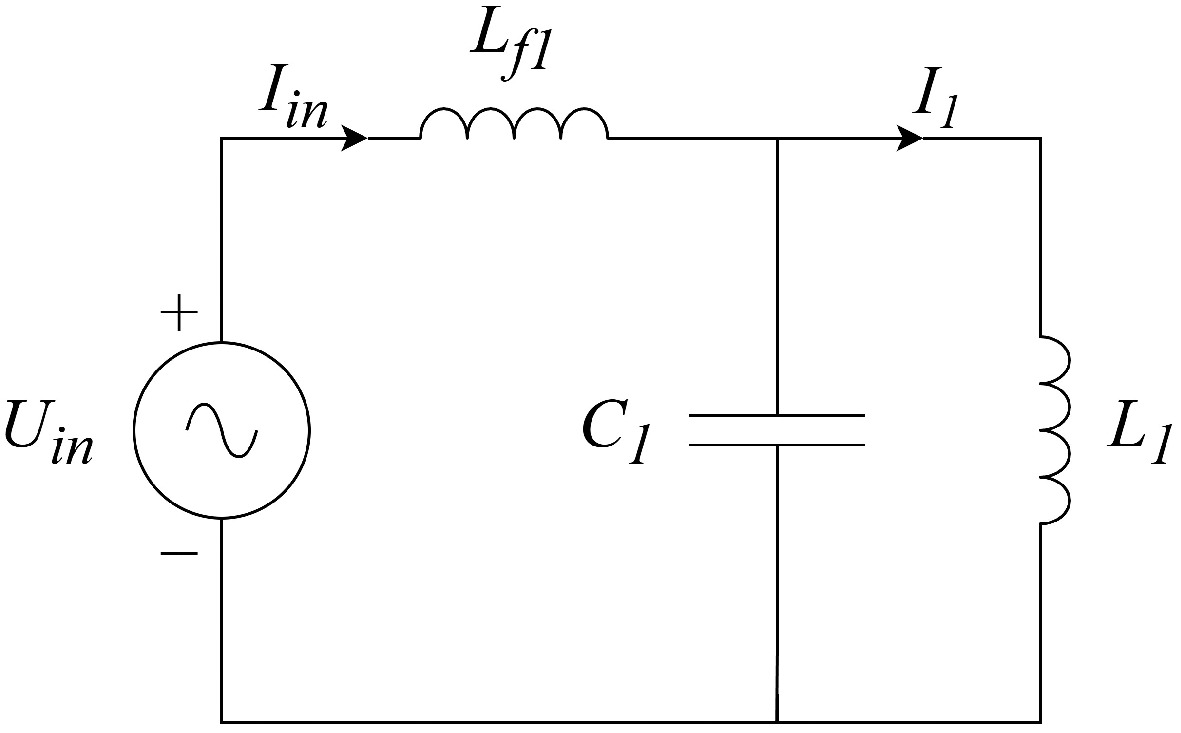
Figure 4.
Asymmetric LCL compensation topology.
-
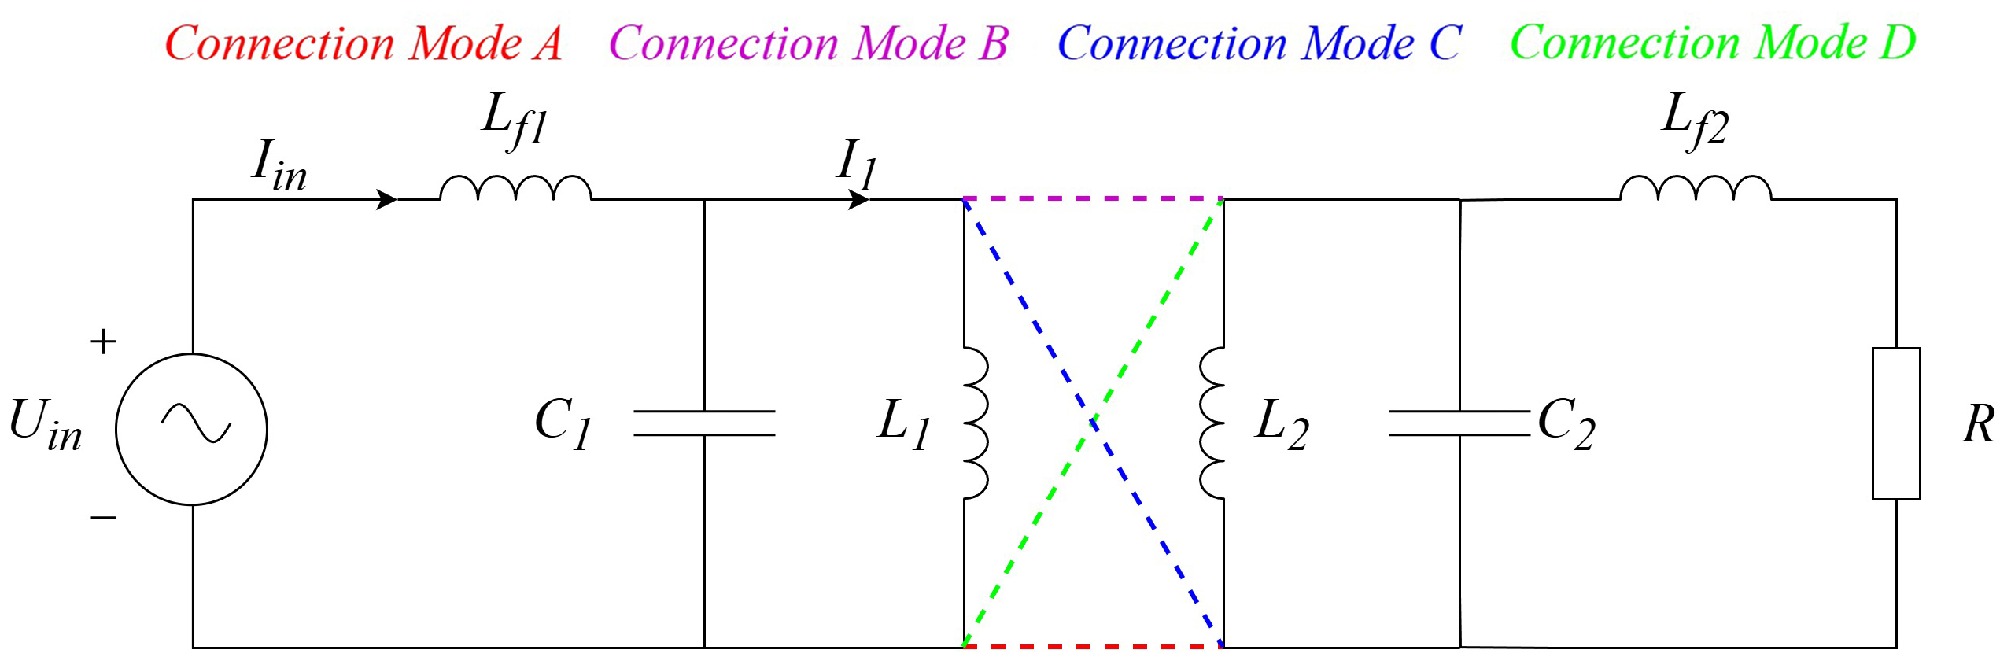
Figure 5.
Different connection positions of the single wire.
-
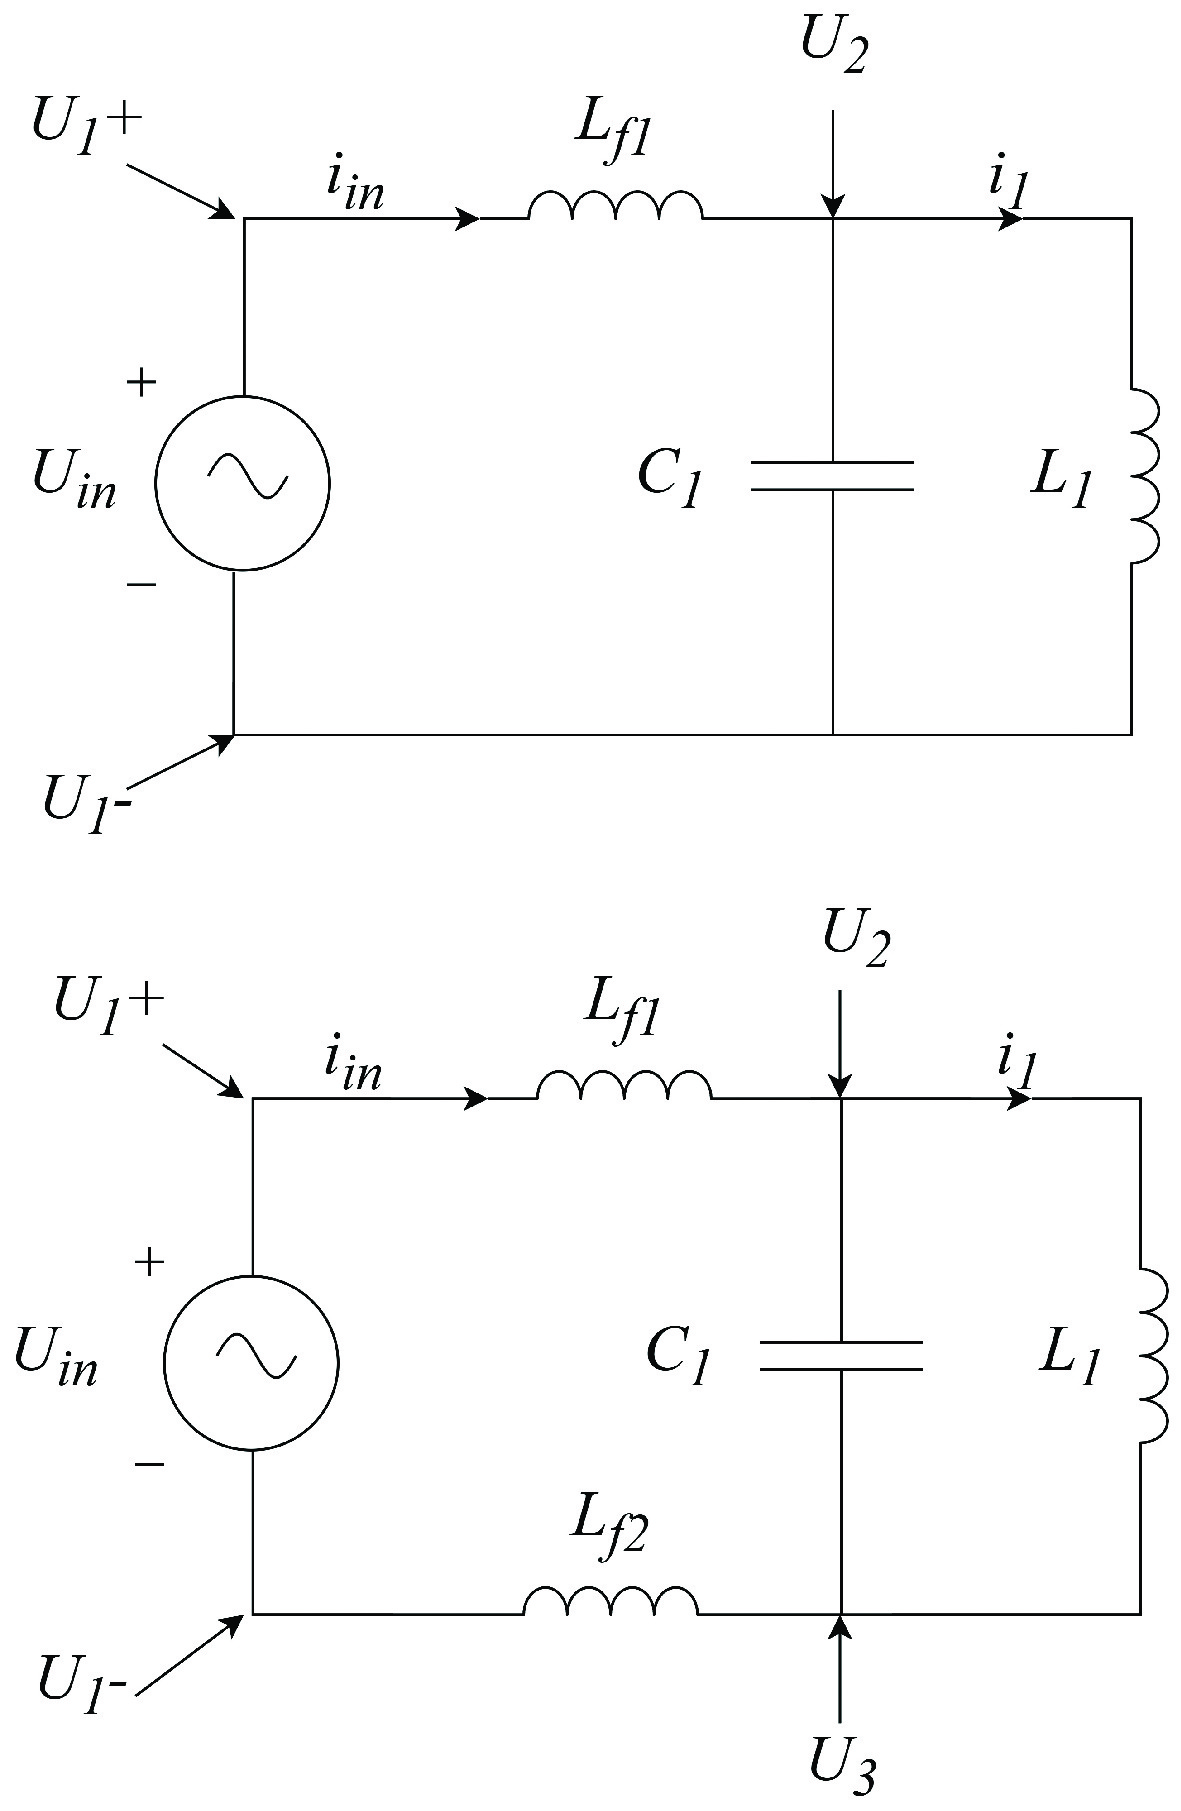
Figure 6.
Potential diagrams of different topologies.
-
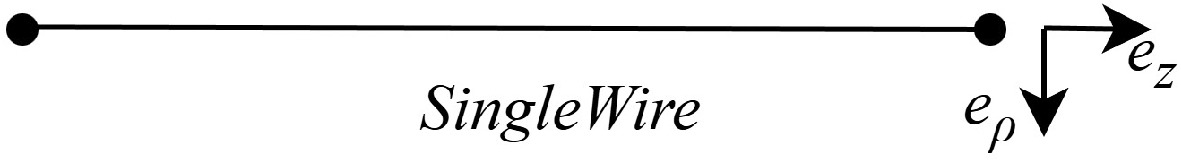
Figure 7.
The SWPT system in a cylindrical coordinate system.
-
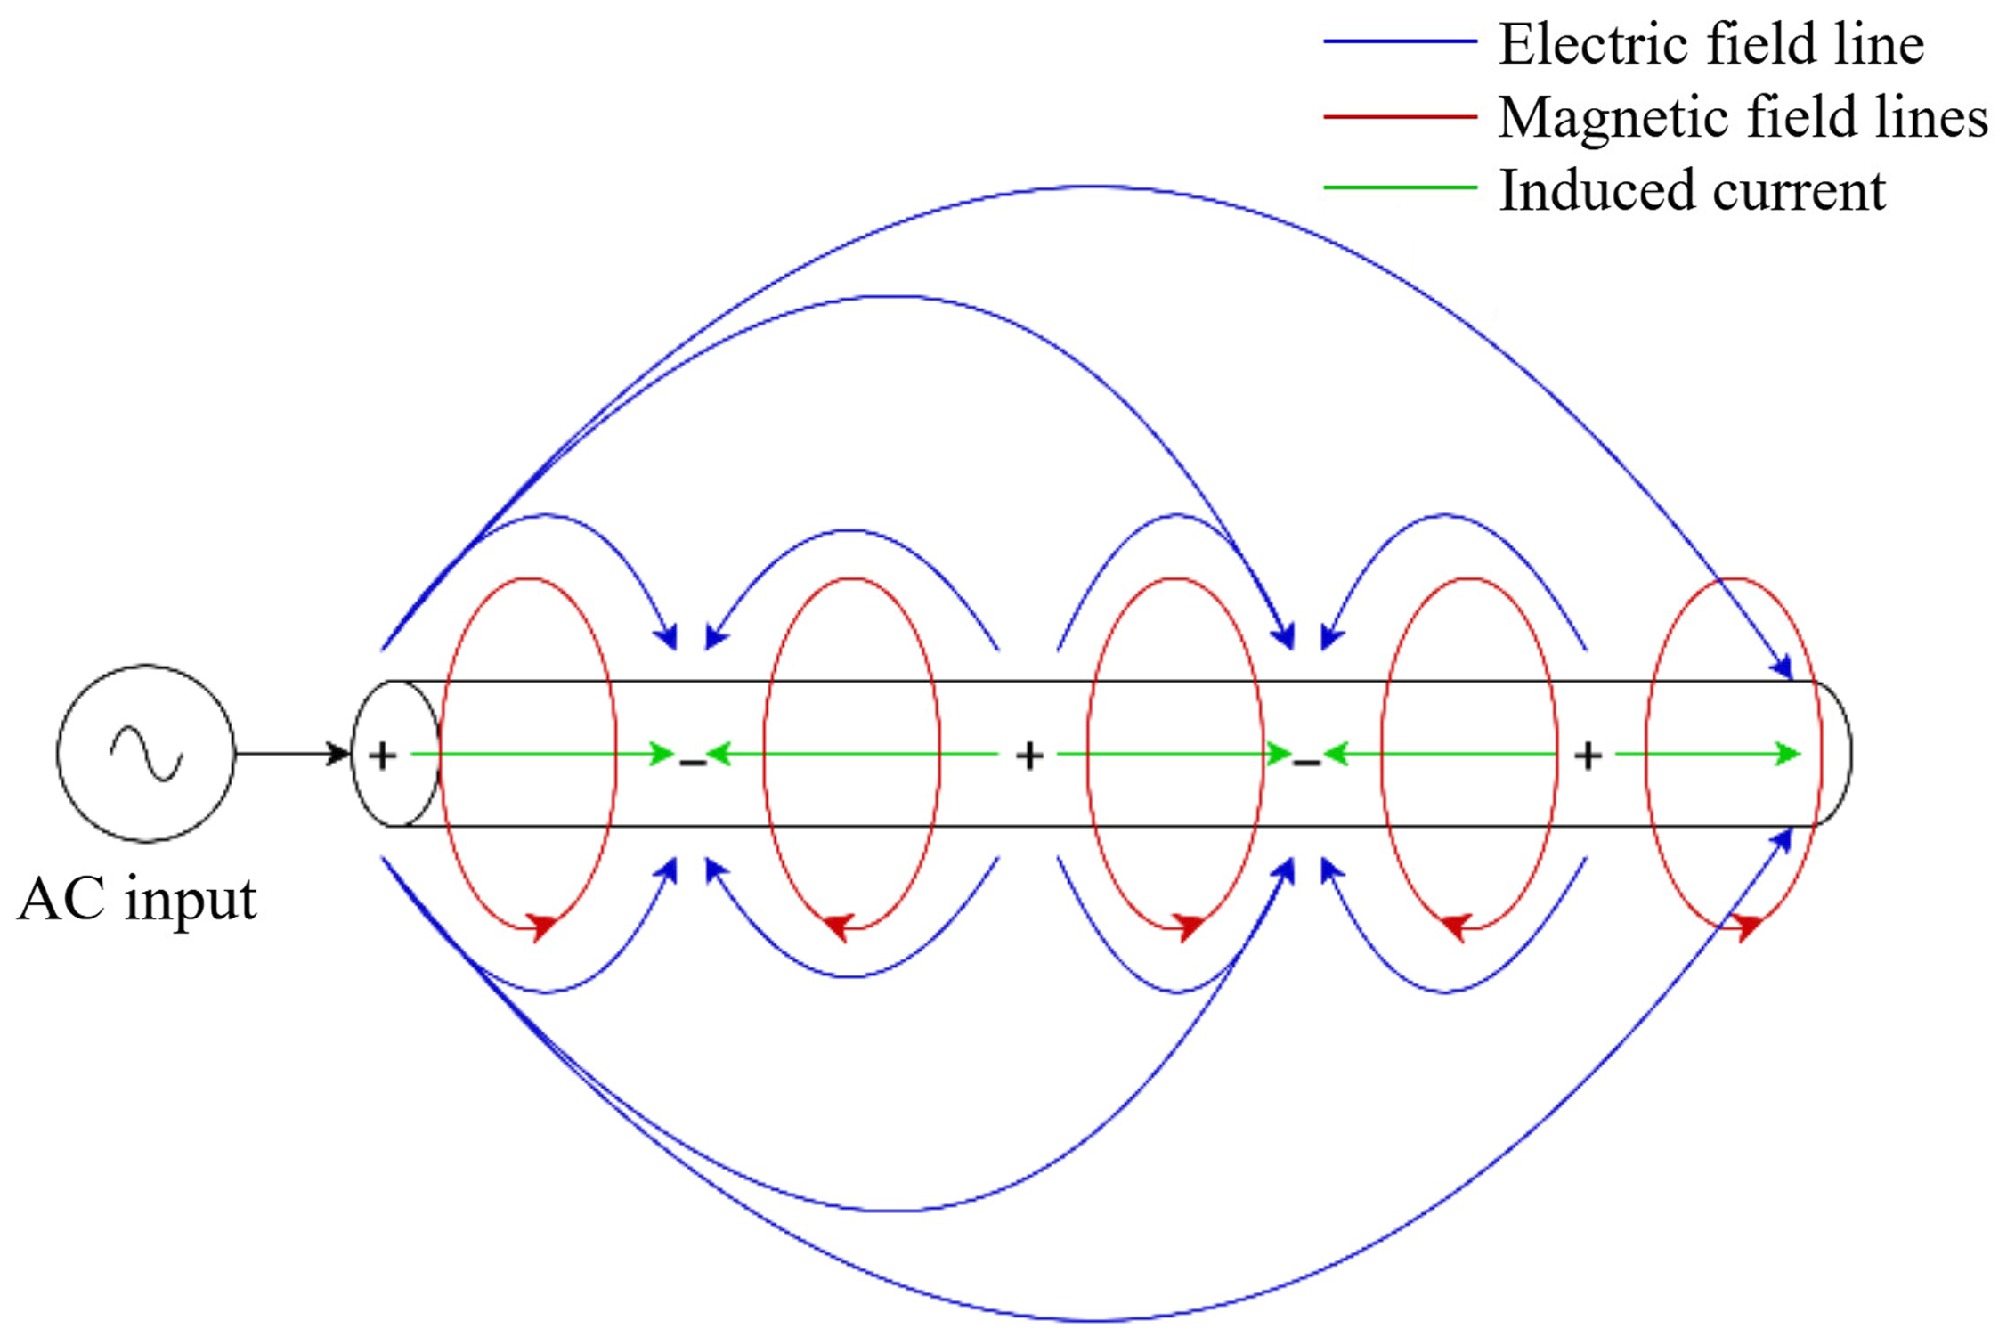
Figure 8.
Schematic diagram of electromagnetic induction in a single wire.
-
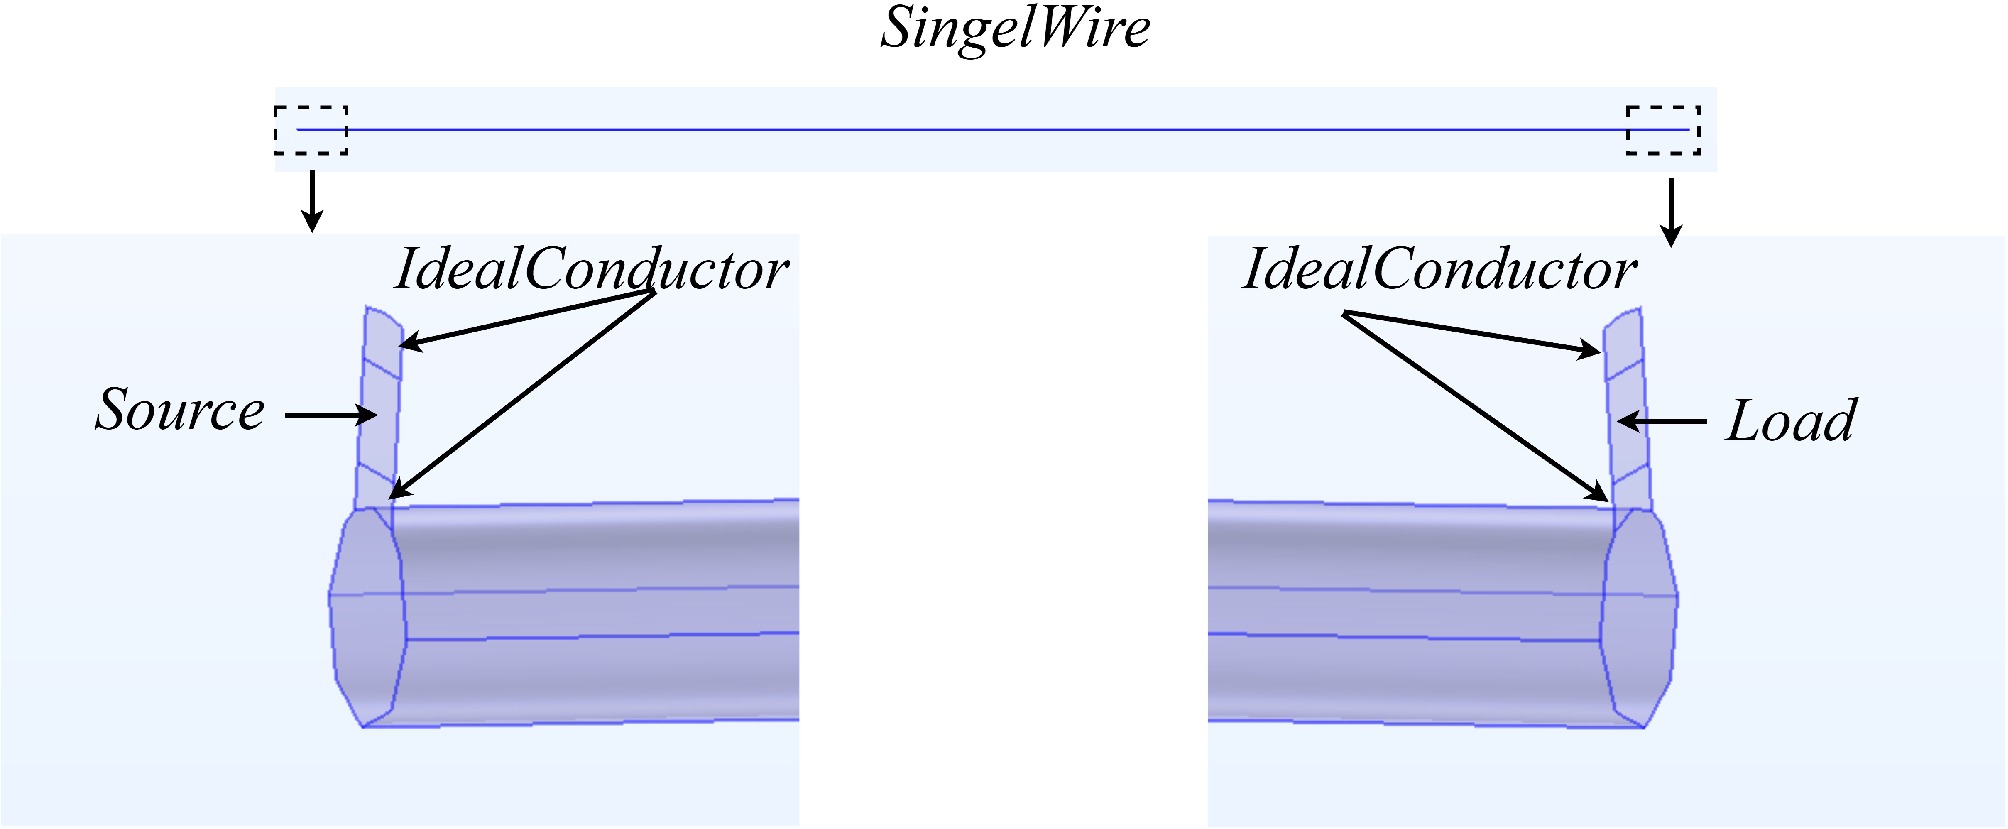
Figure 9.
Schematic diagram of the single-wire simulation.
-
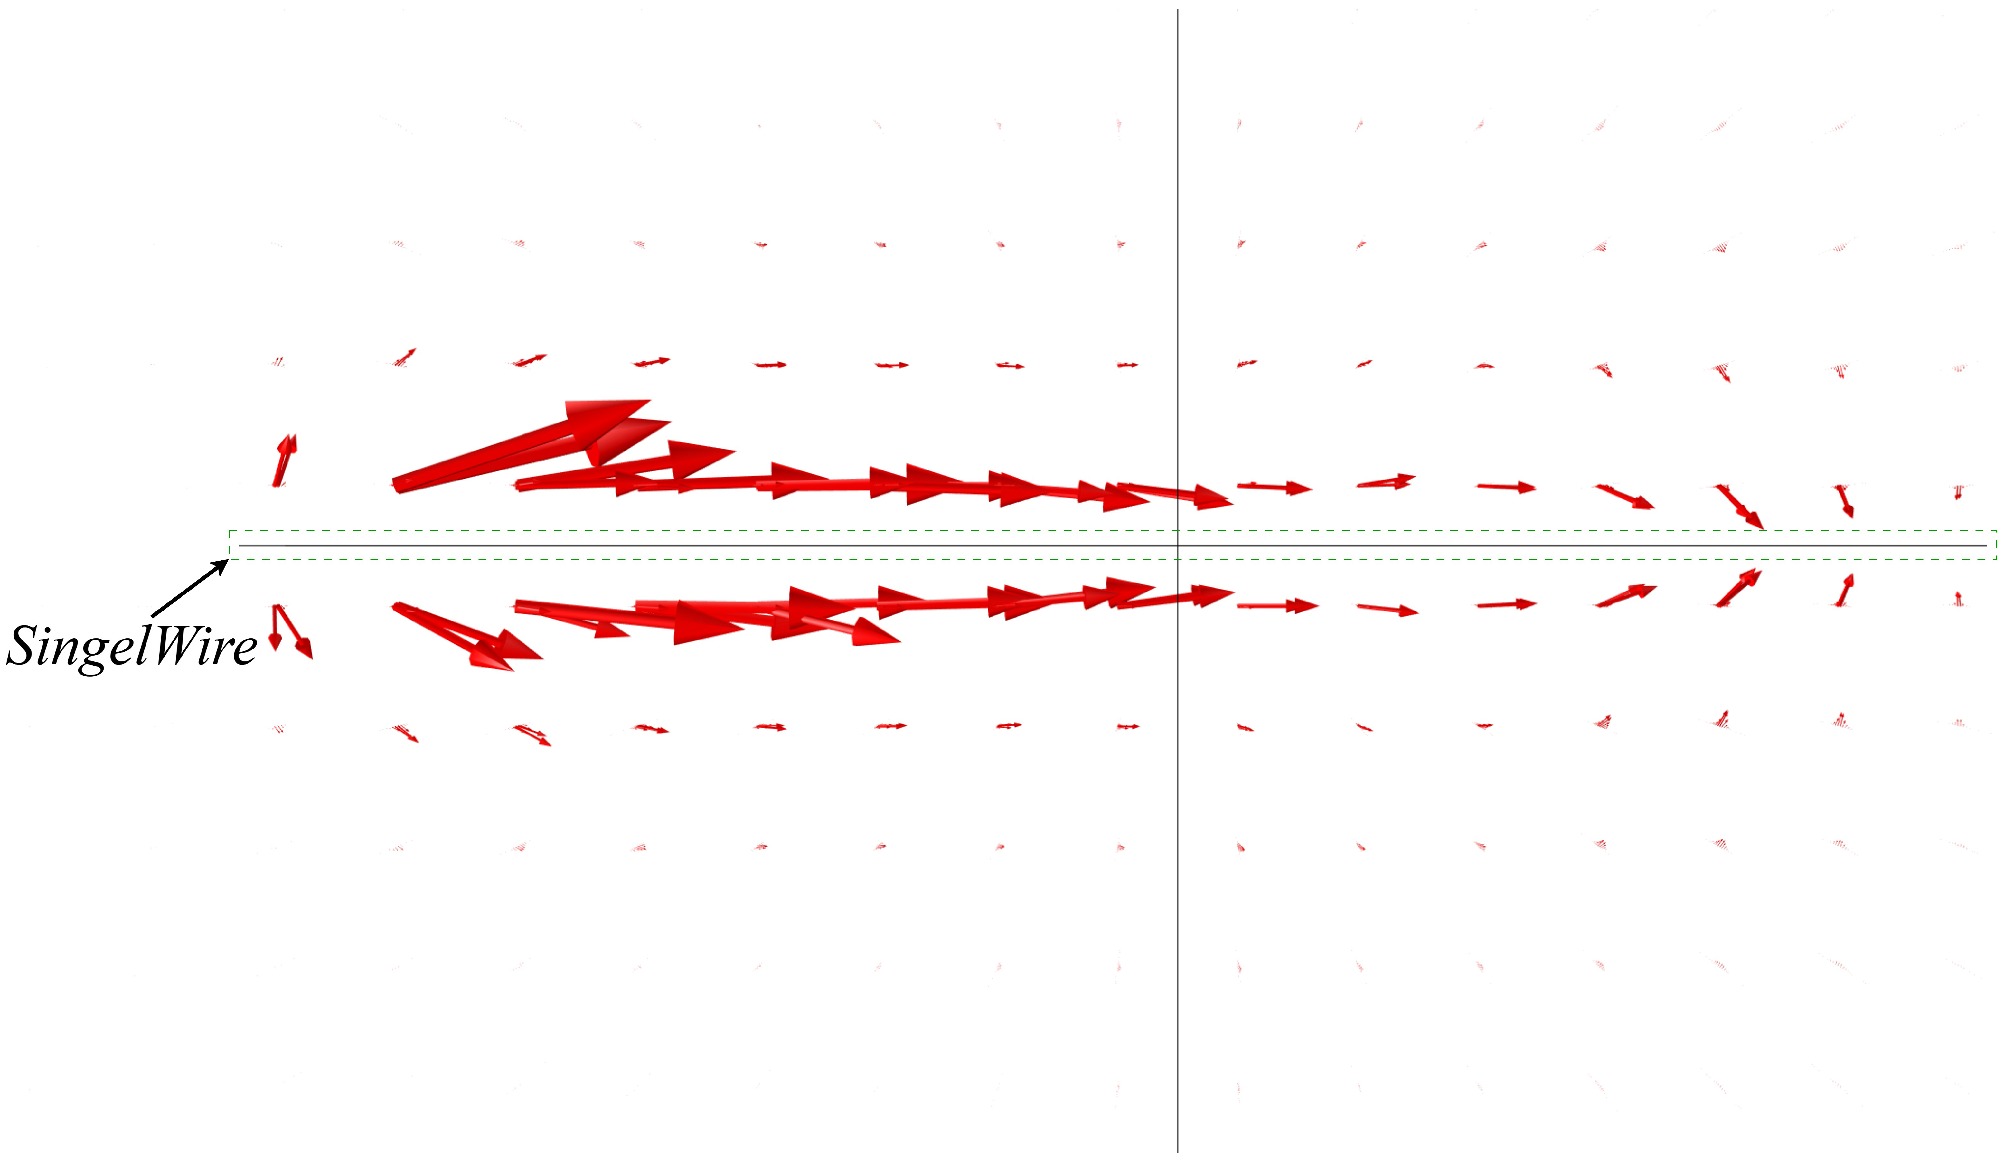
Figure 10.
Simulation result of the Poynting vector.
-
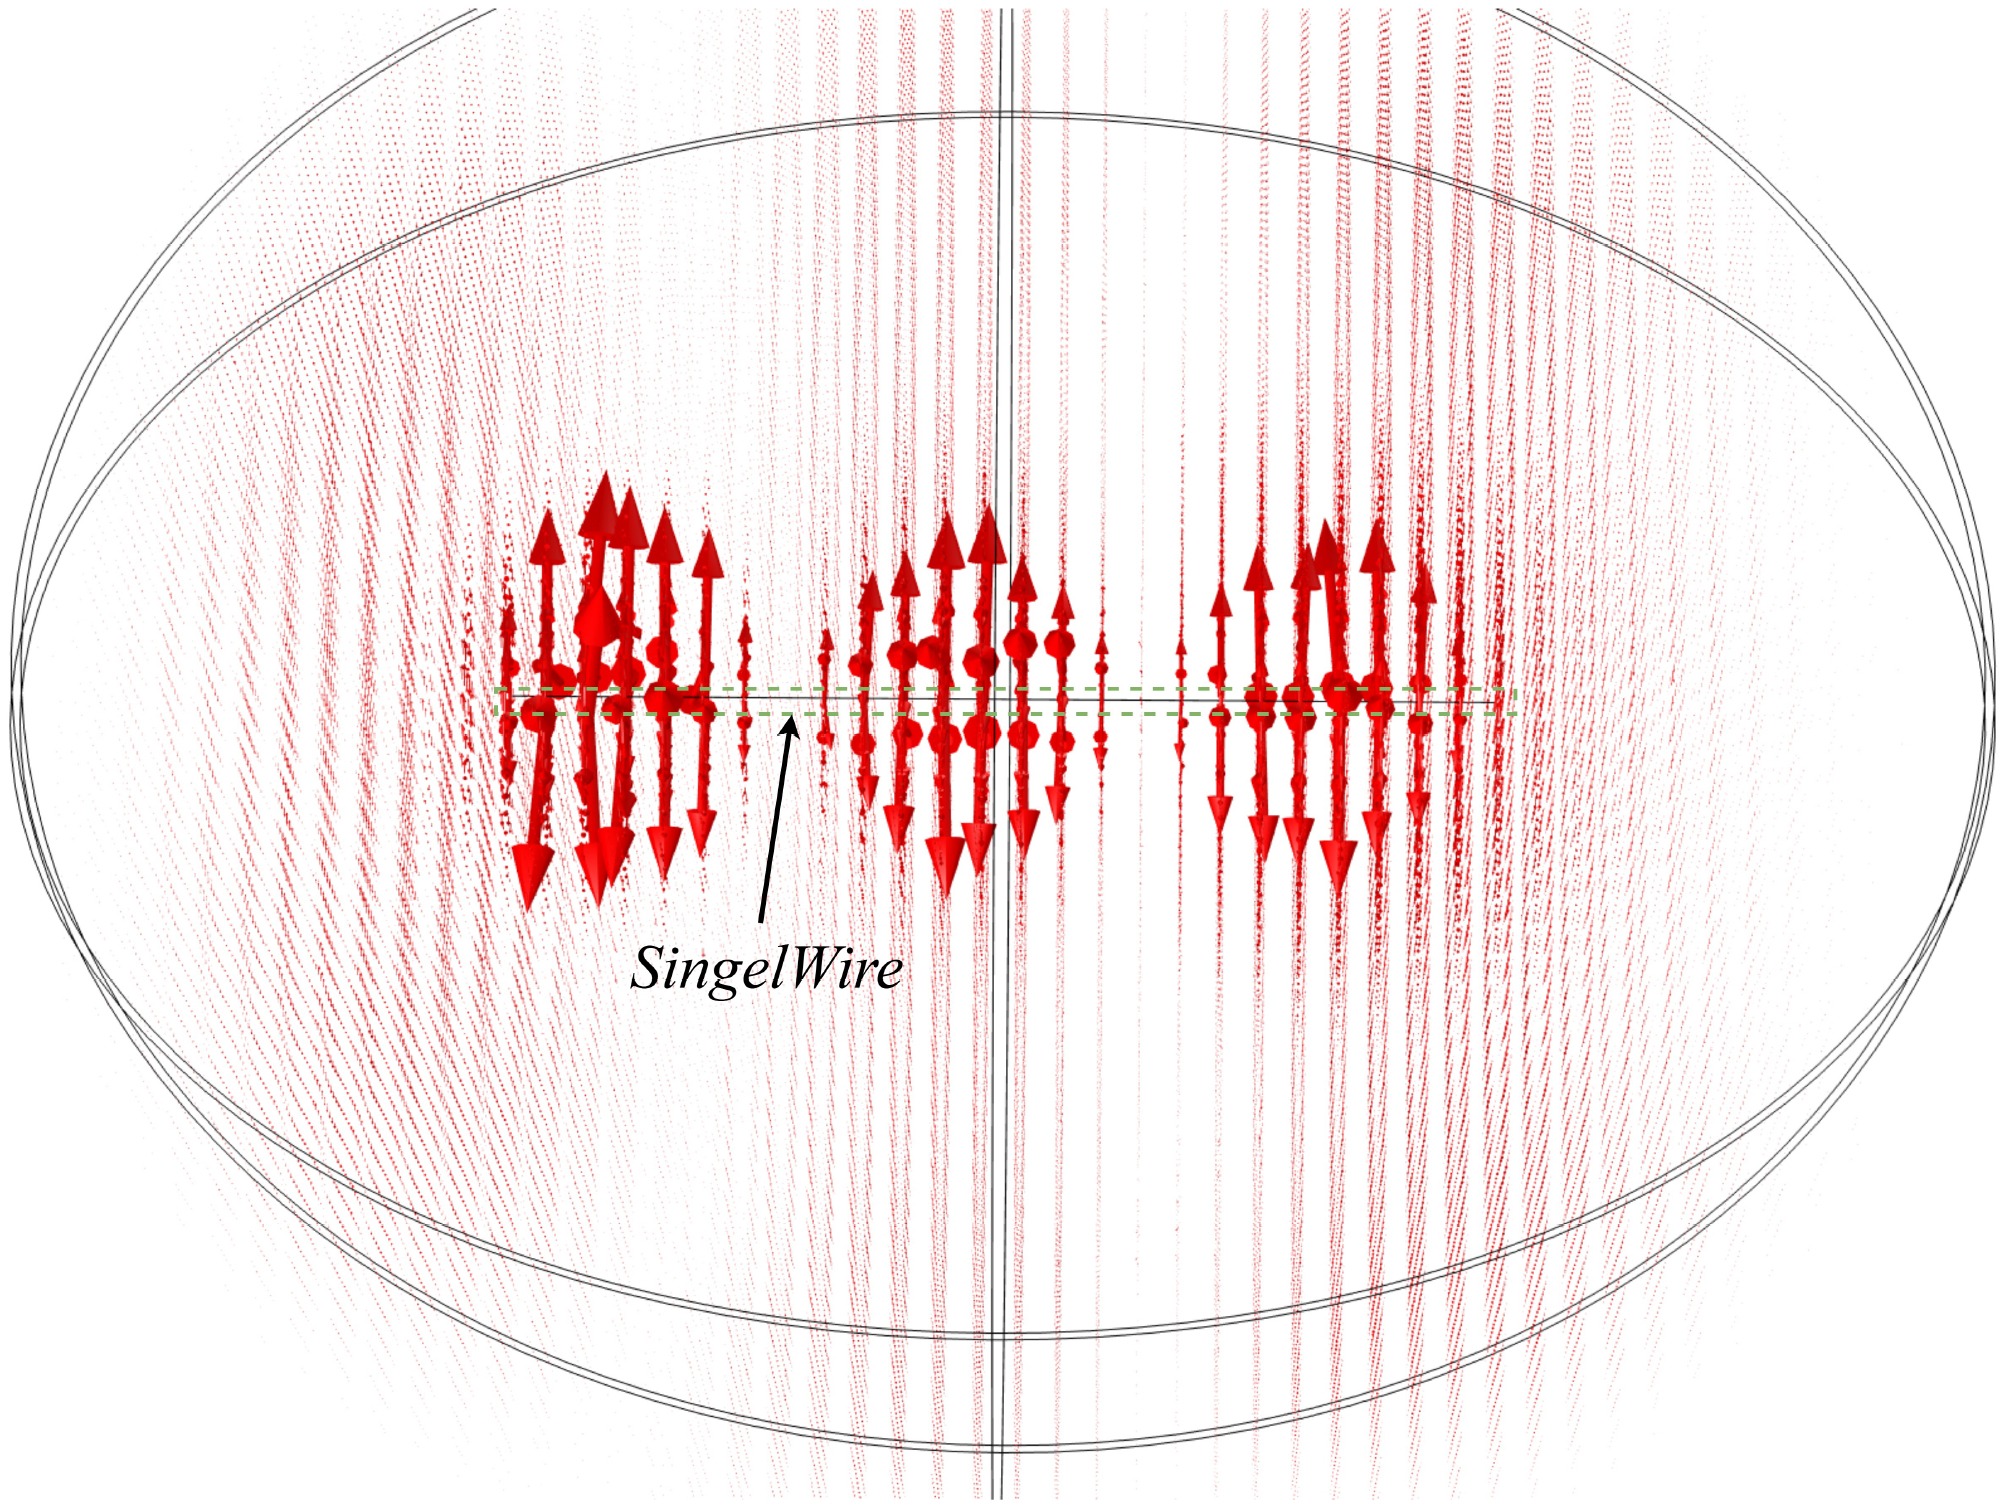
Figure 11.
Simulation result of the magnetic field.
-
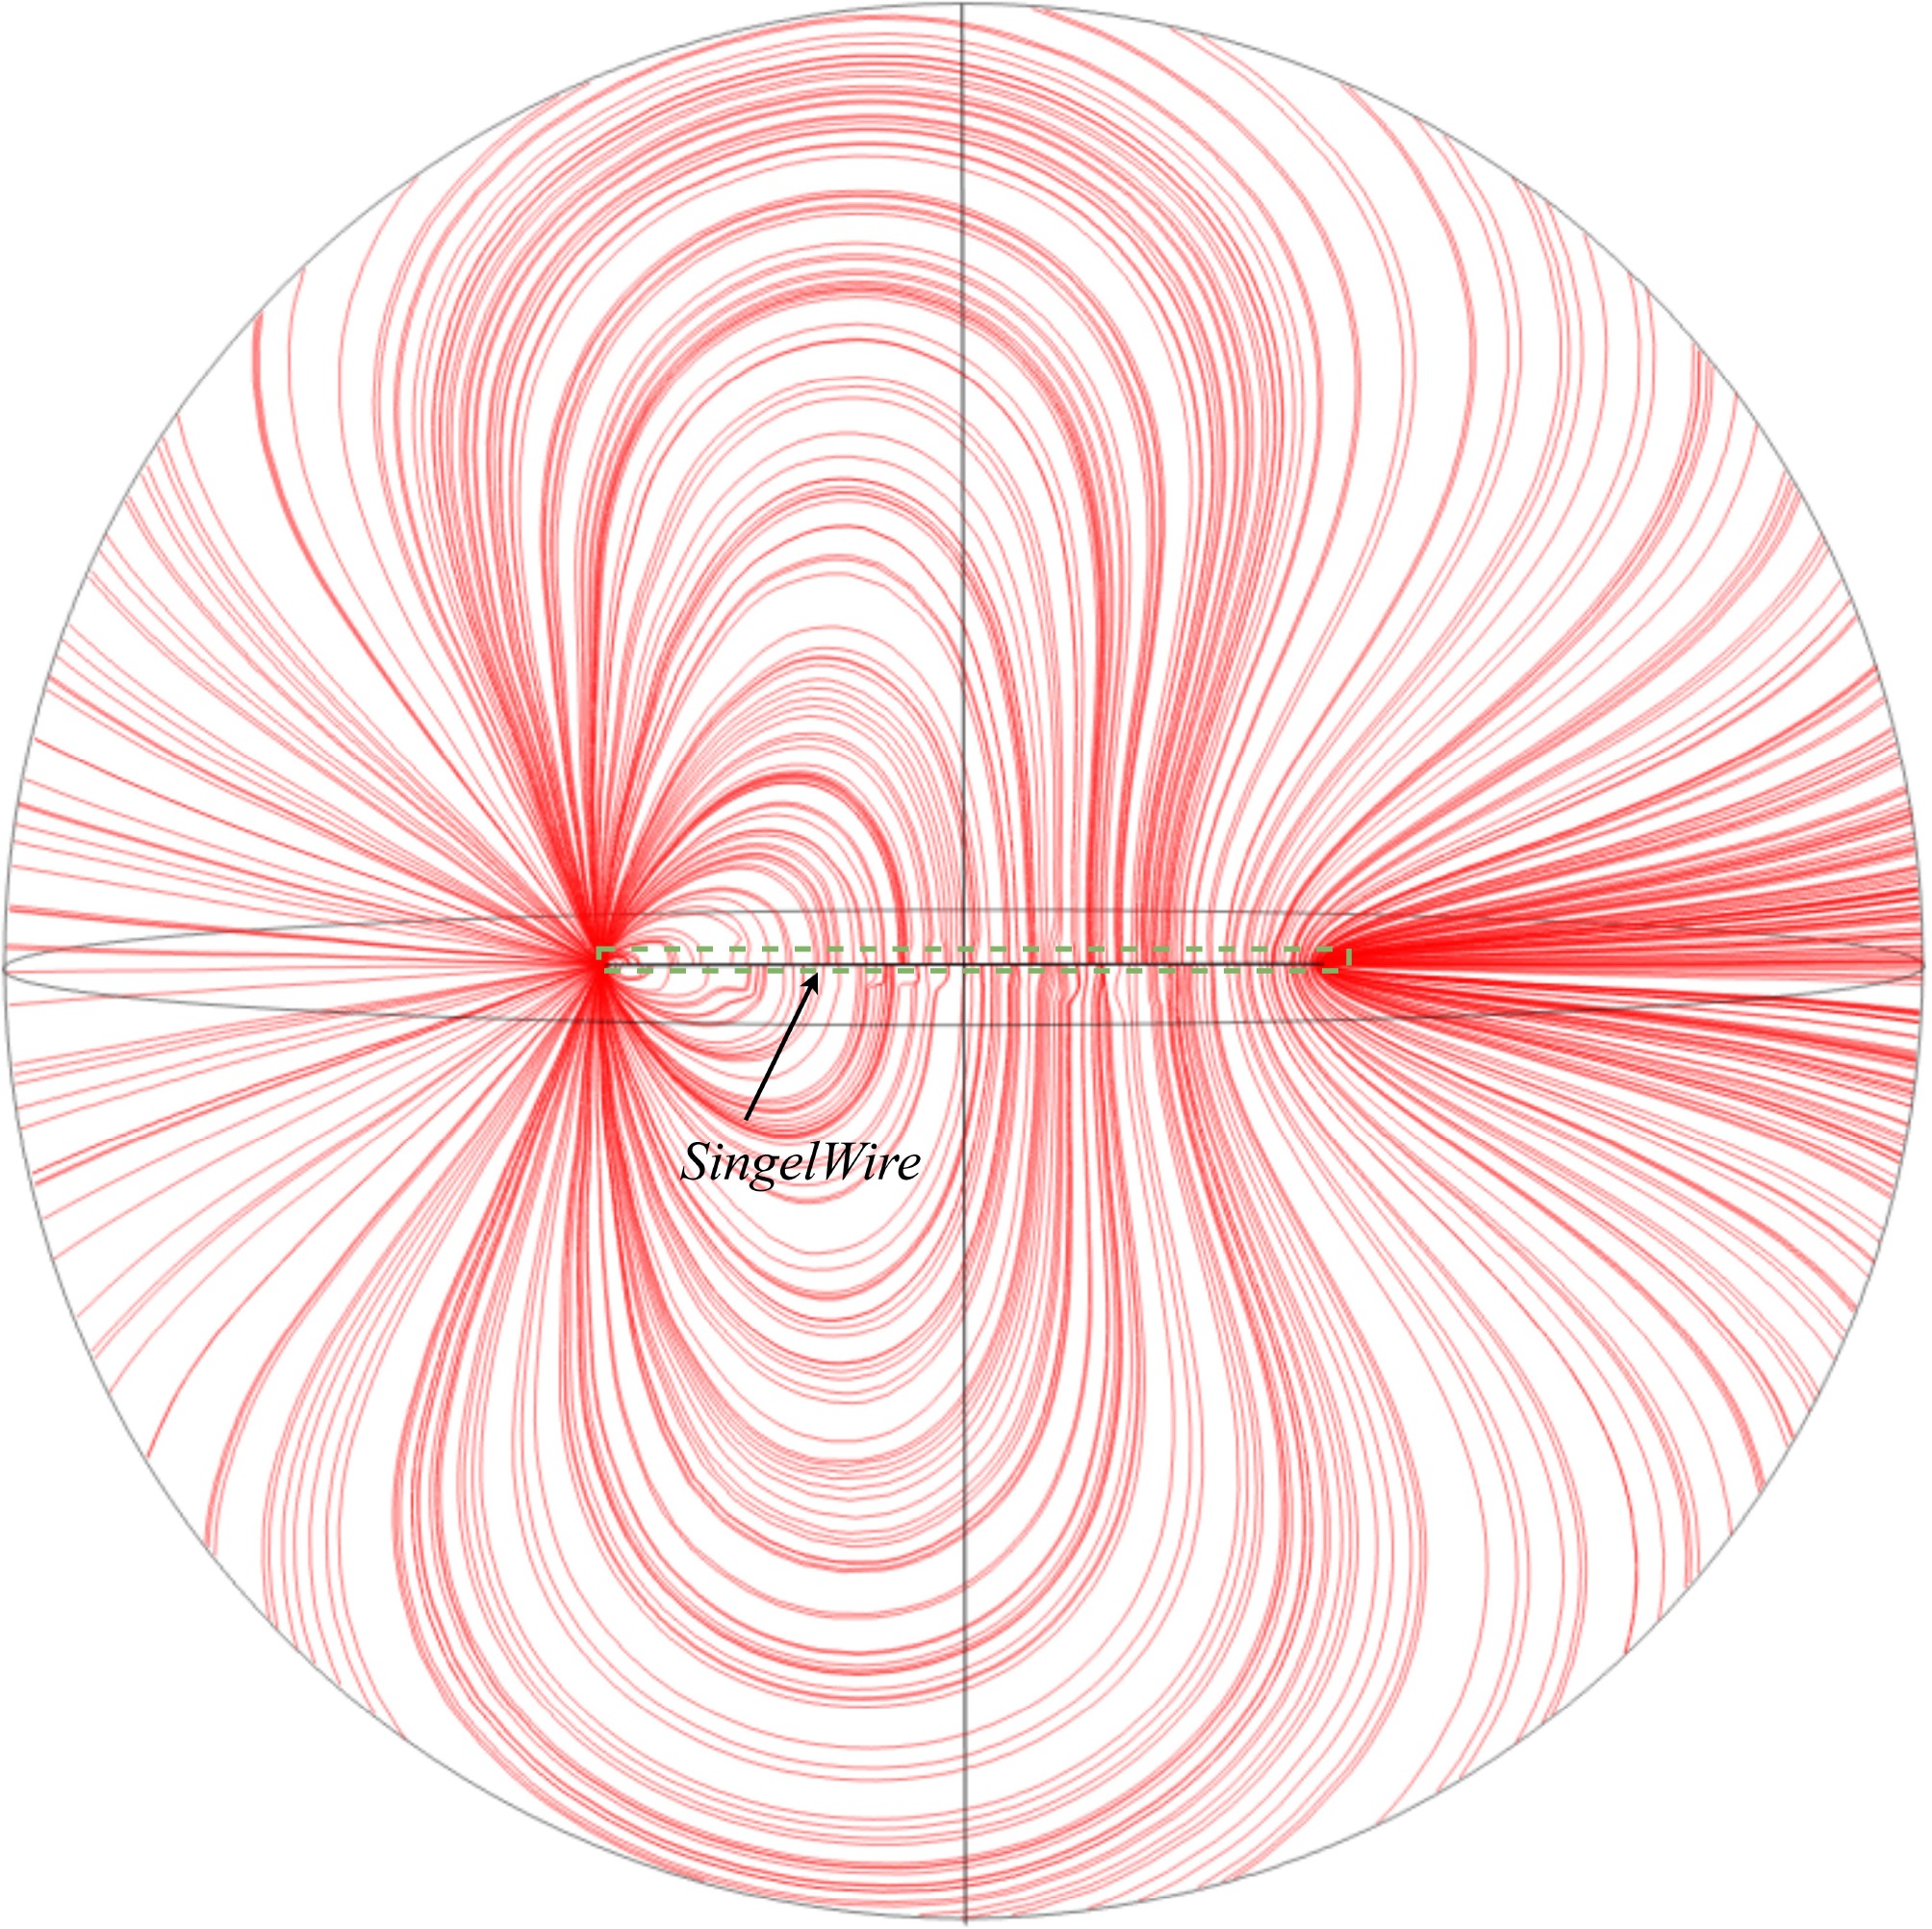
Figure 12.
Simulation result of electric field lines.
-
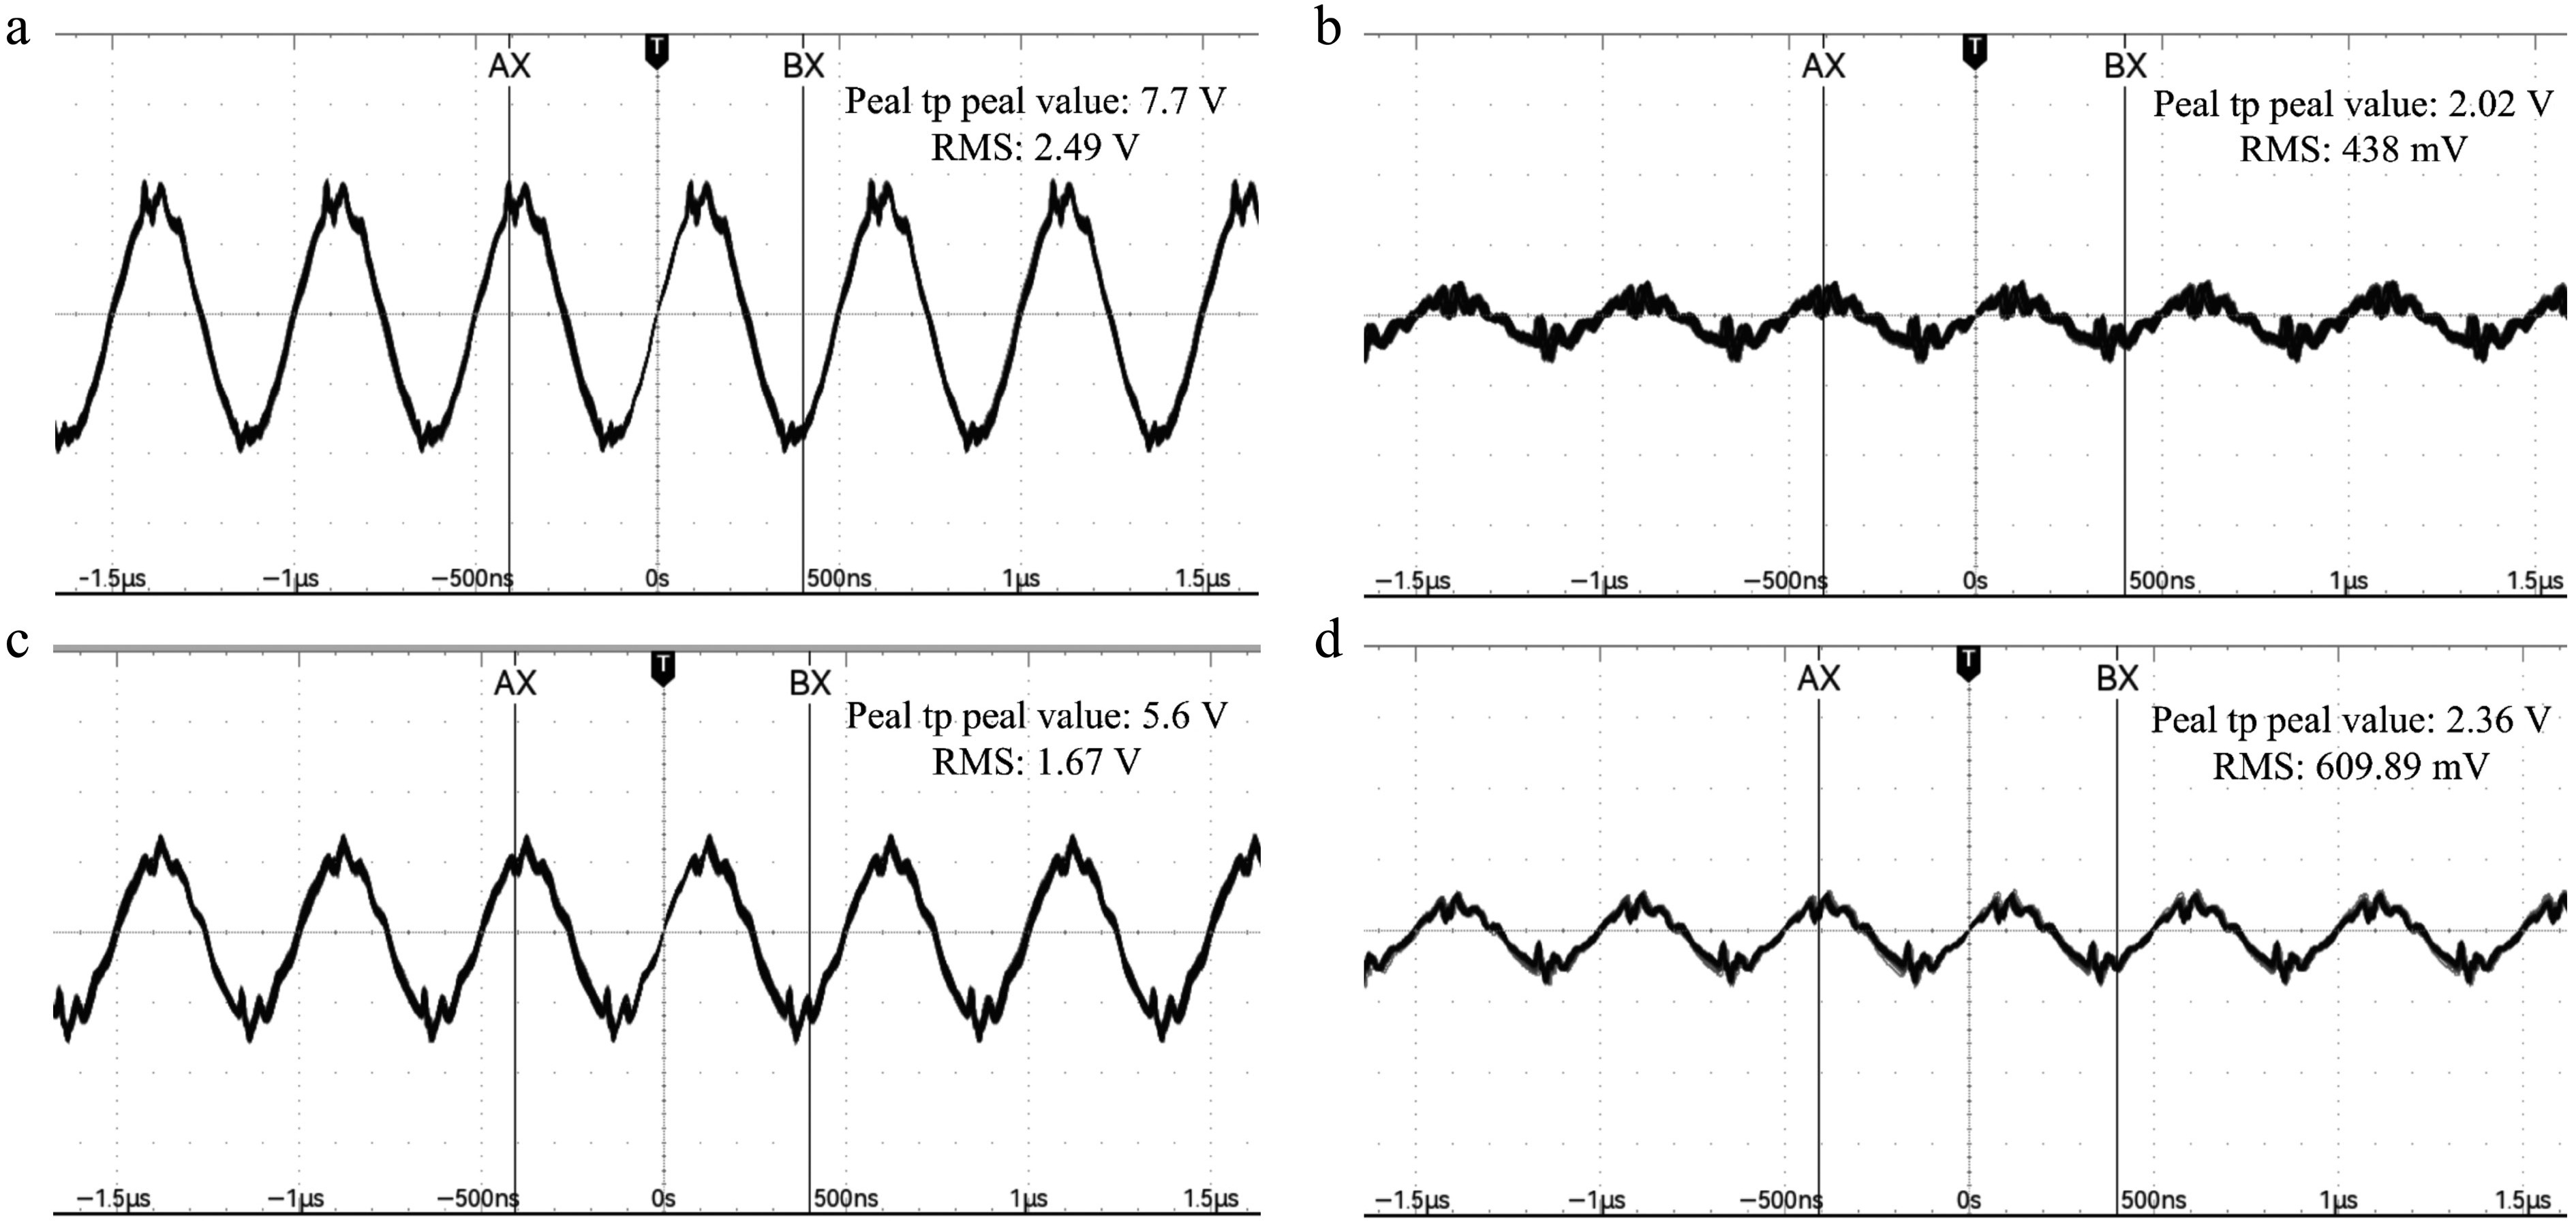
Figure 13.
Experimental schematic diagram of different connection methods for asymmetric LCL coils. (a) Connection mode A; (b) connection mode B; (c) connection mode C; (d) connection mode D.
-
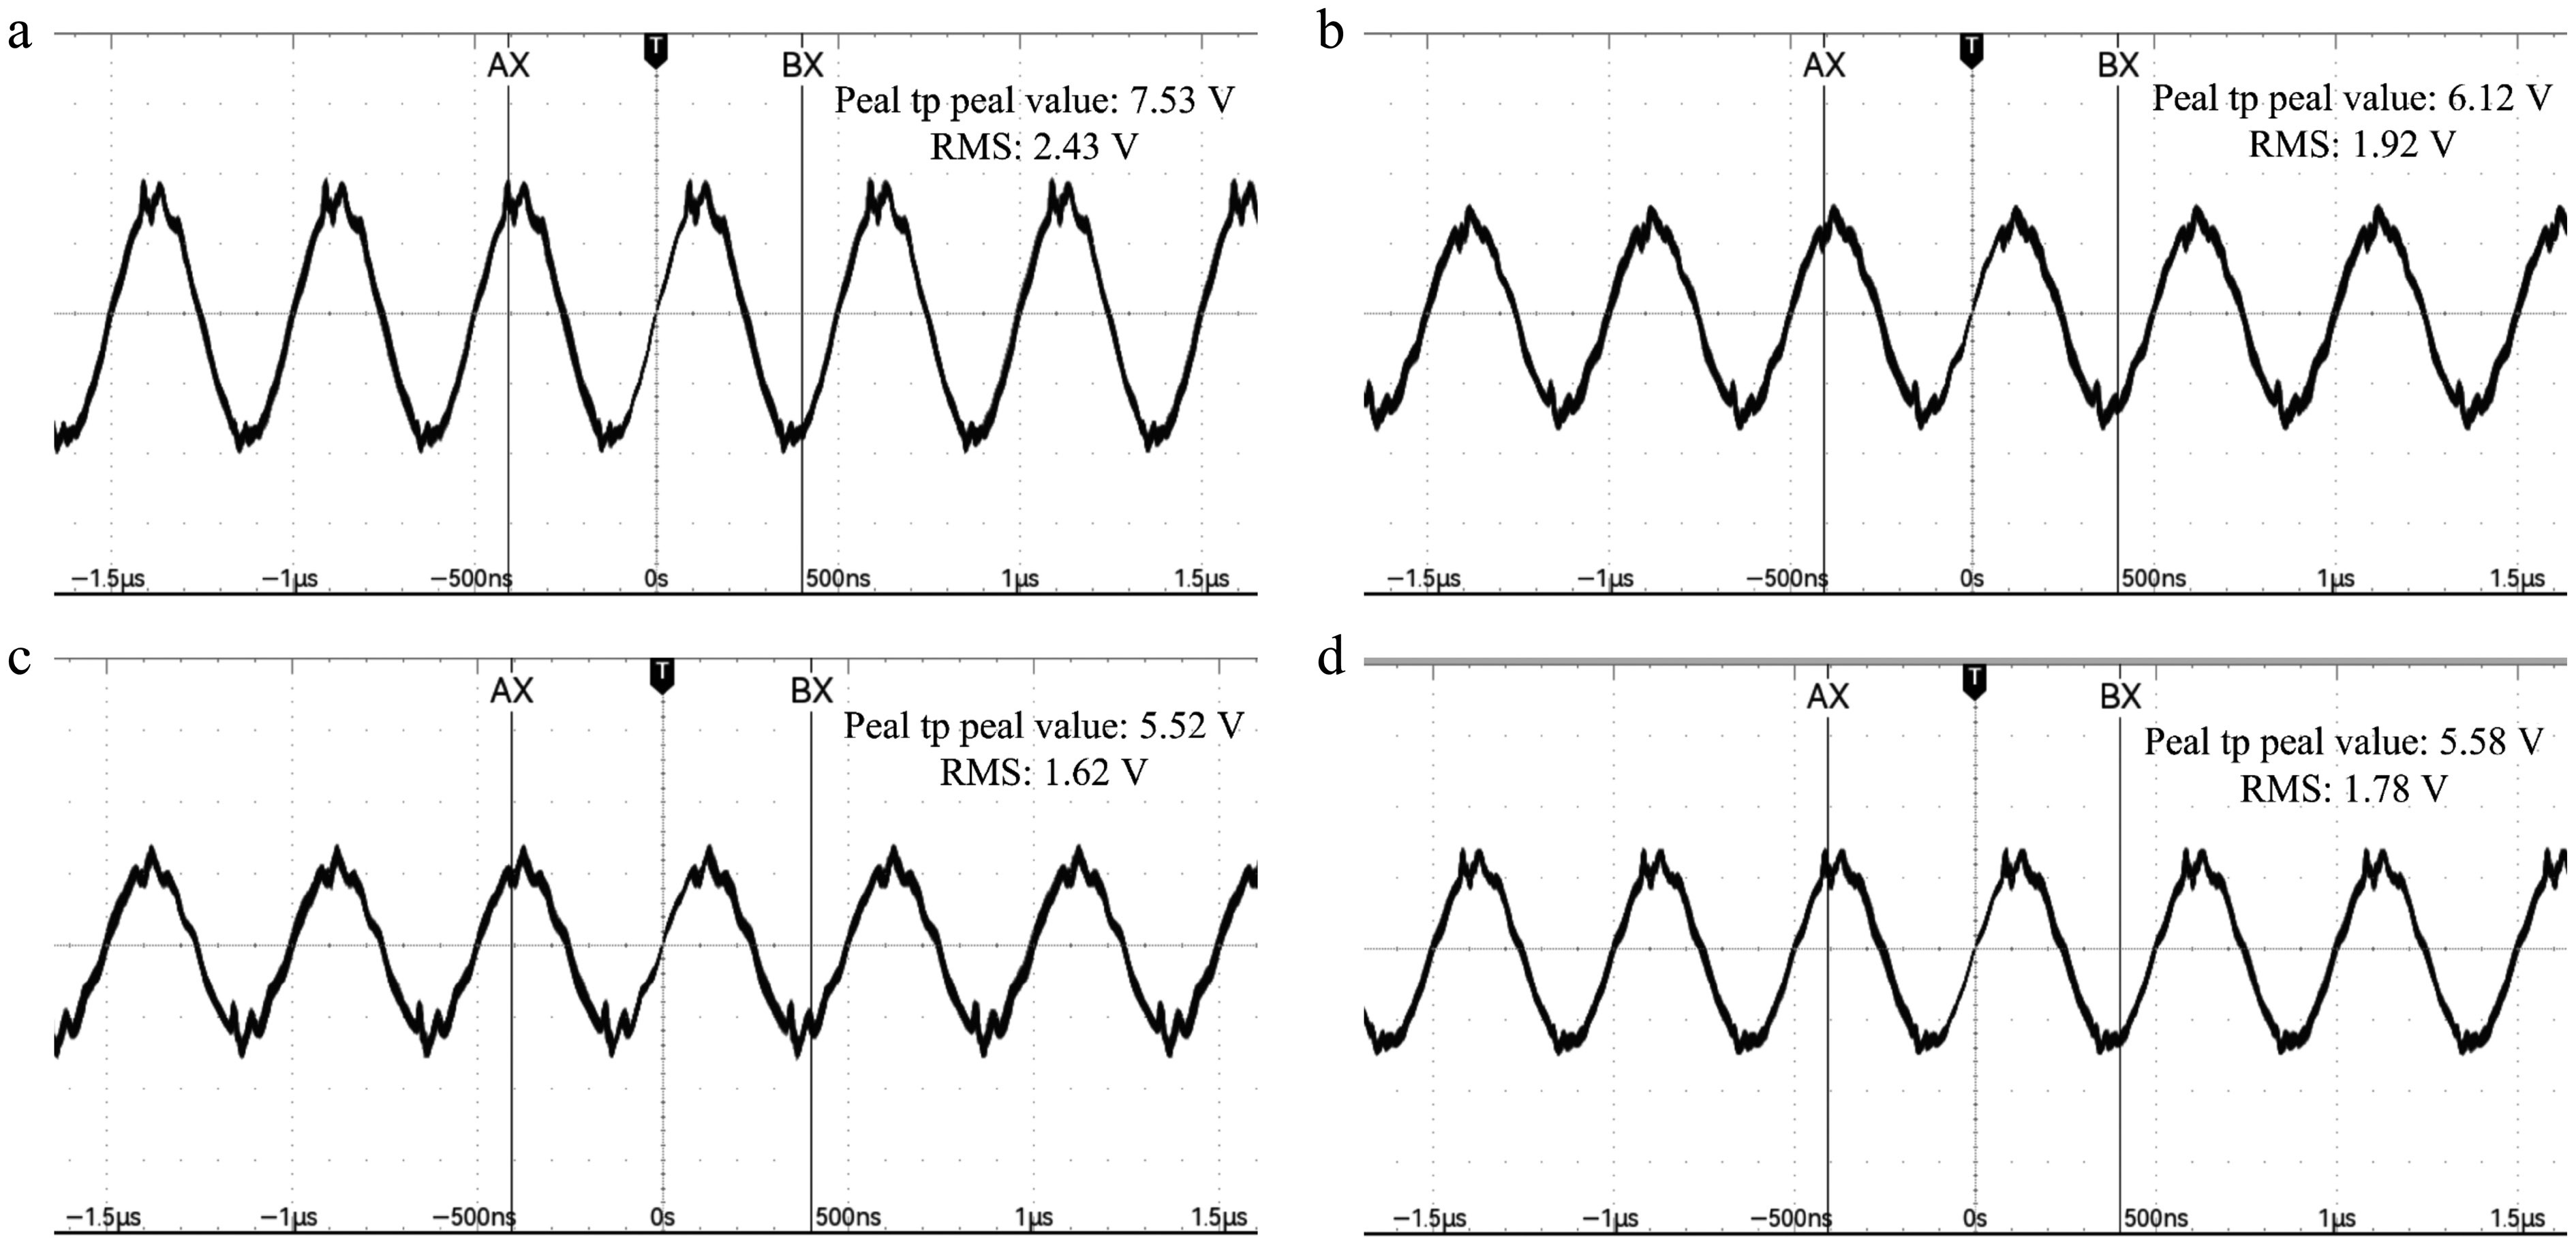
Figure 14.
Experimental diagram of different connection modes with a symmetrical LCL coil. (a) Connection mode A; (b) connection mode B; (c) connection mode C; (d) connection mode D.
-
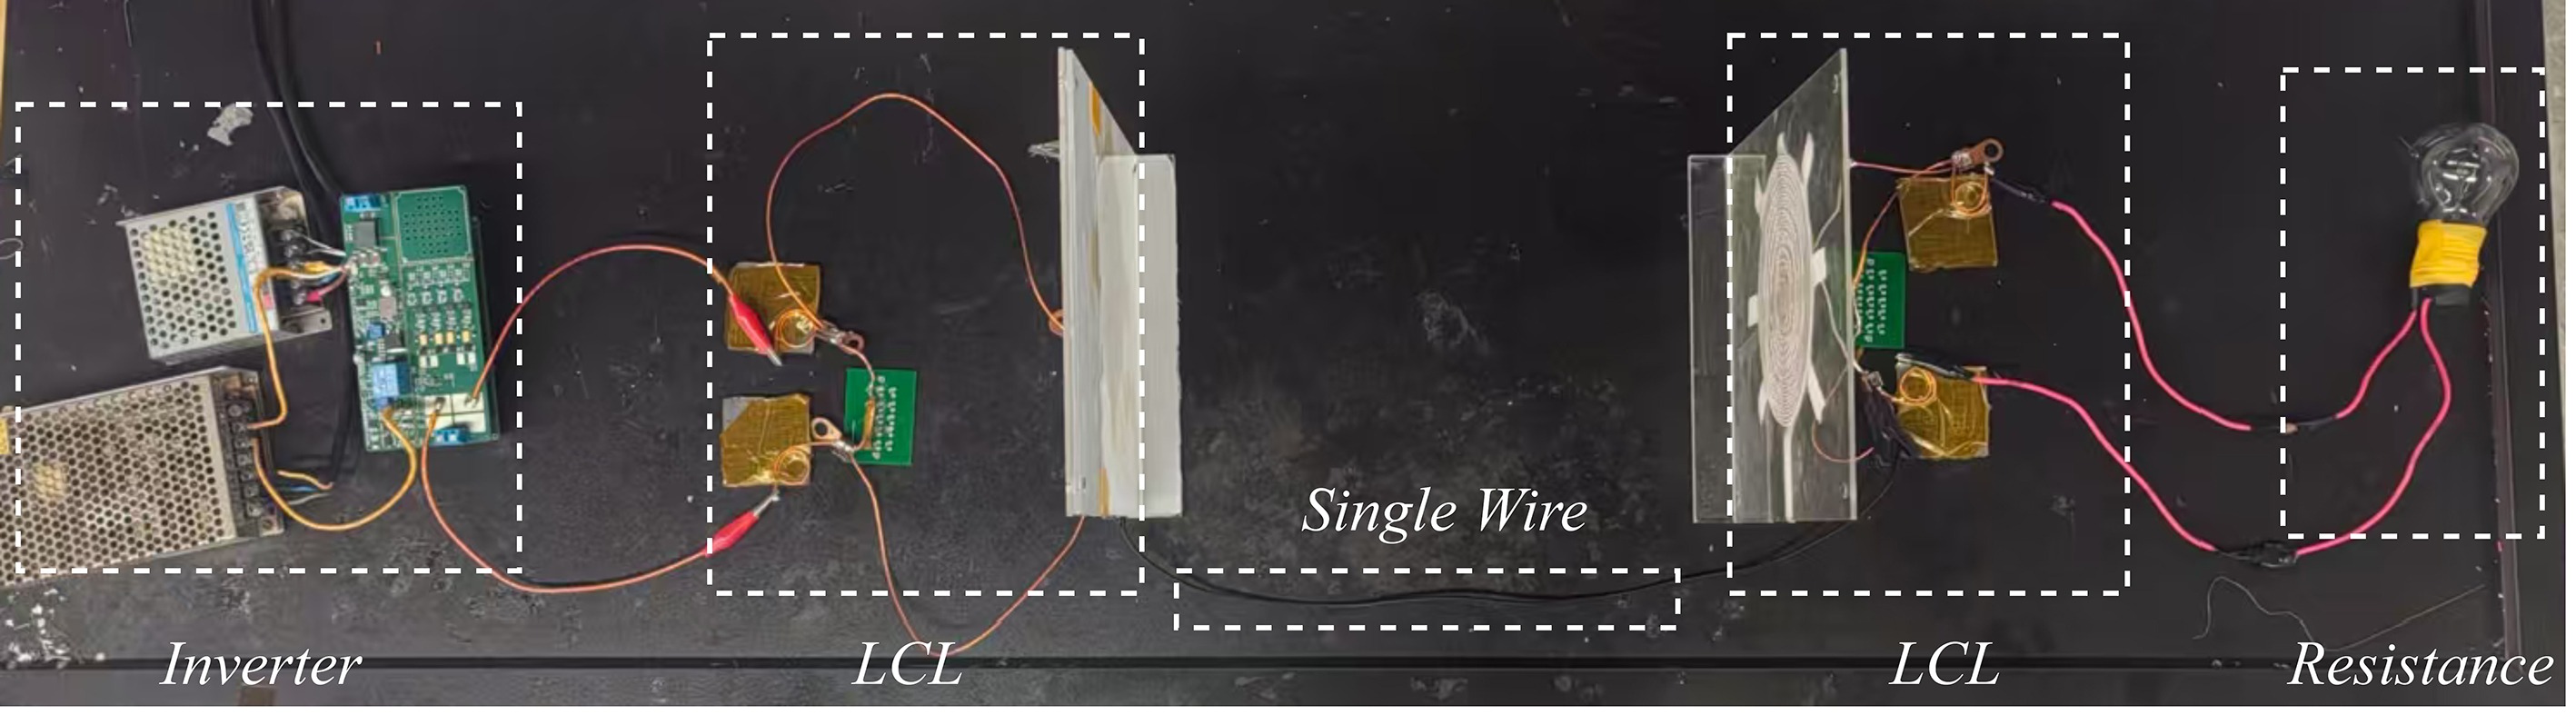
Figure 15.
Schematic diagram of the experimental device.
-
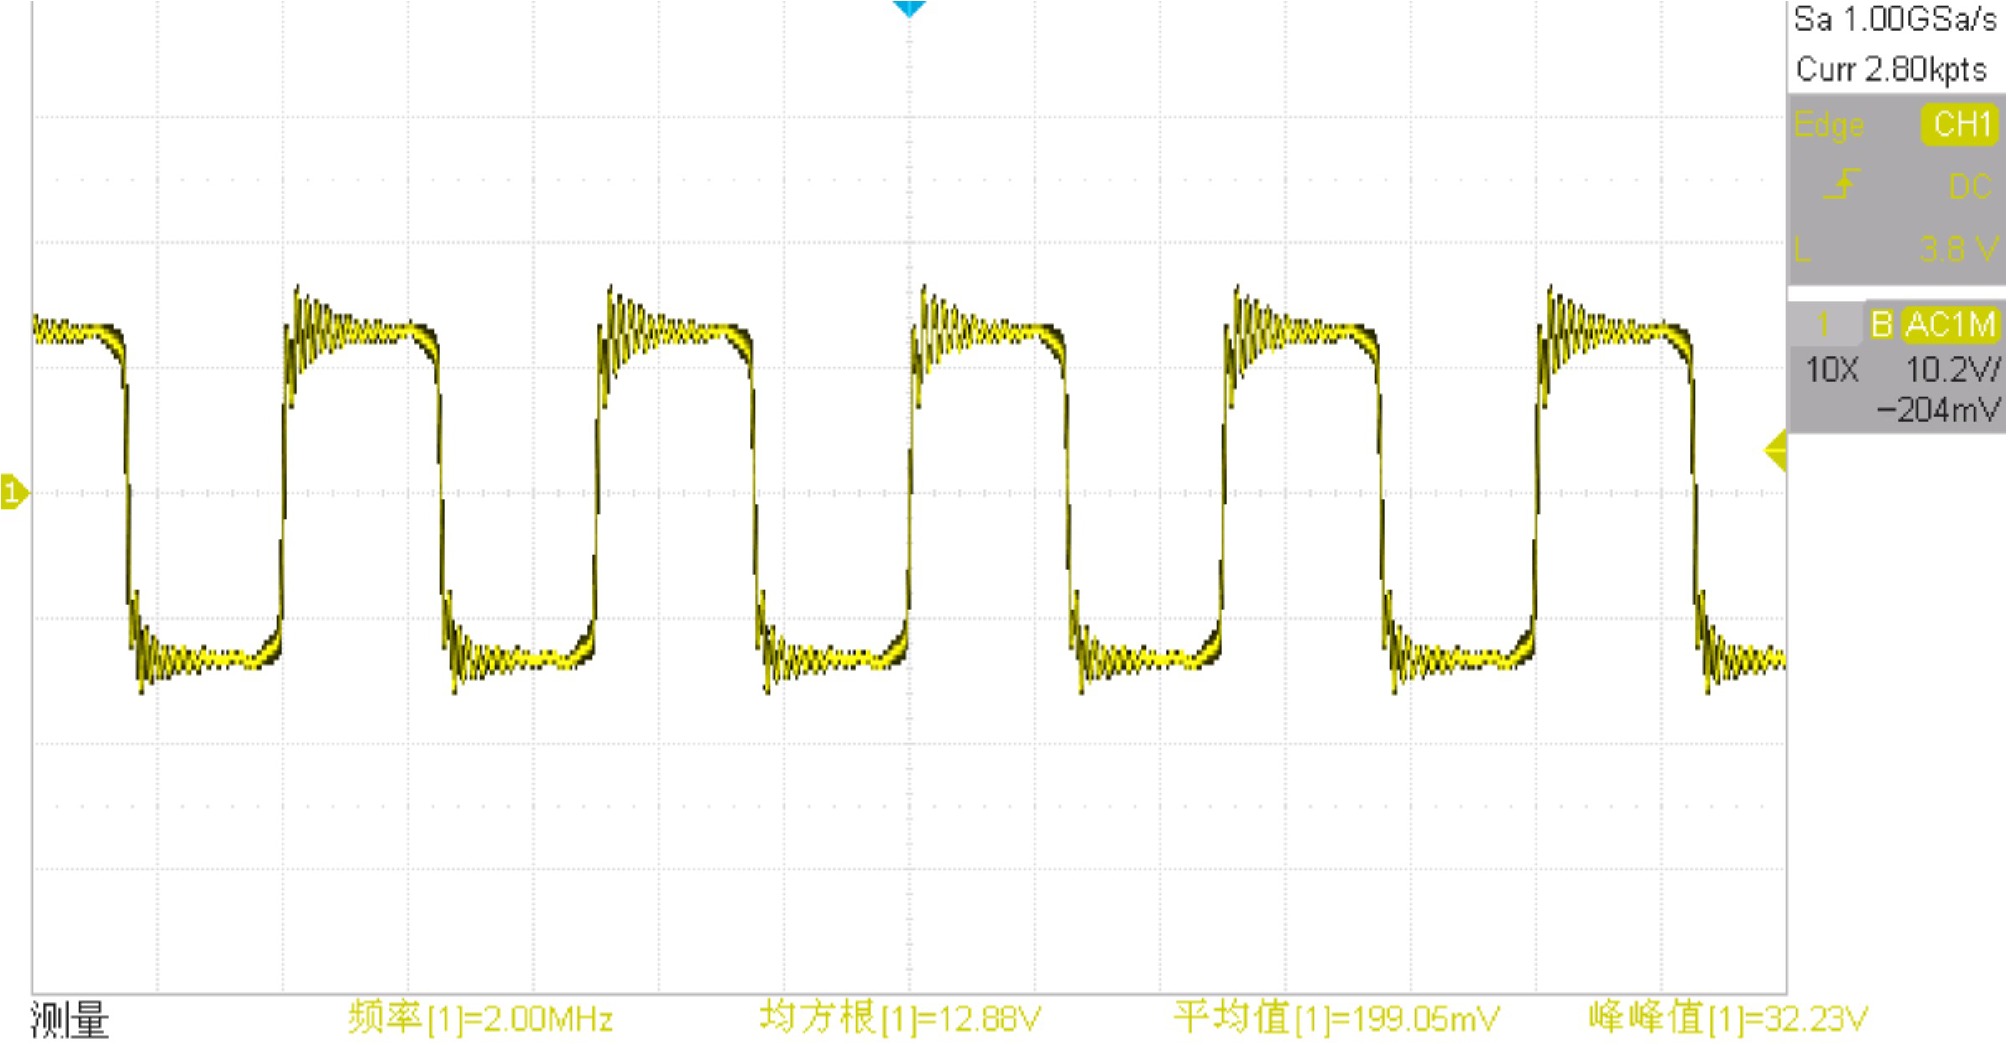
Figure 16.
Inverter voltage
$ {U}_{in} $ -
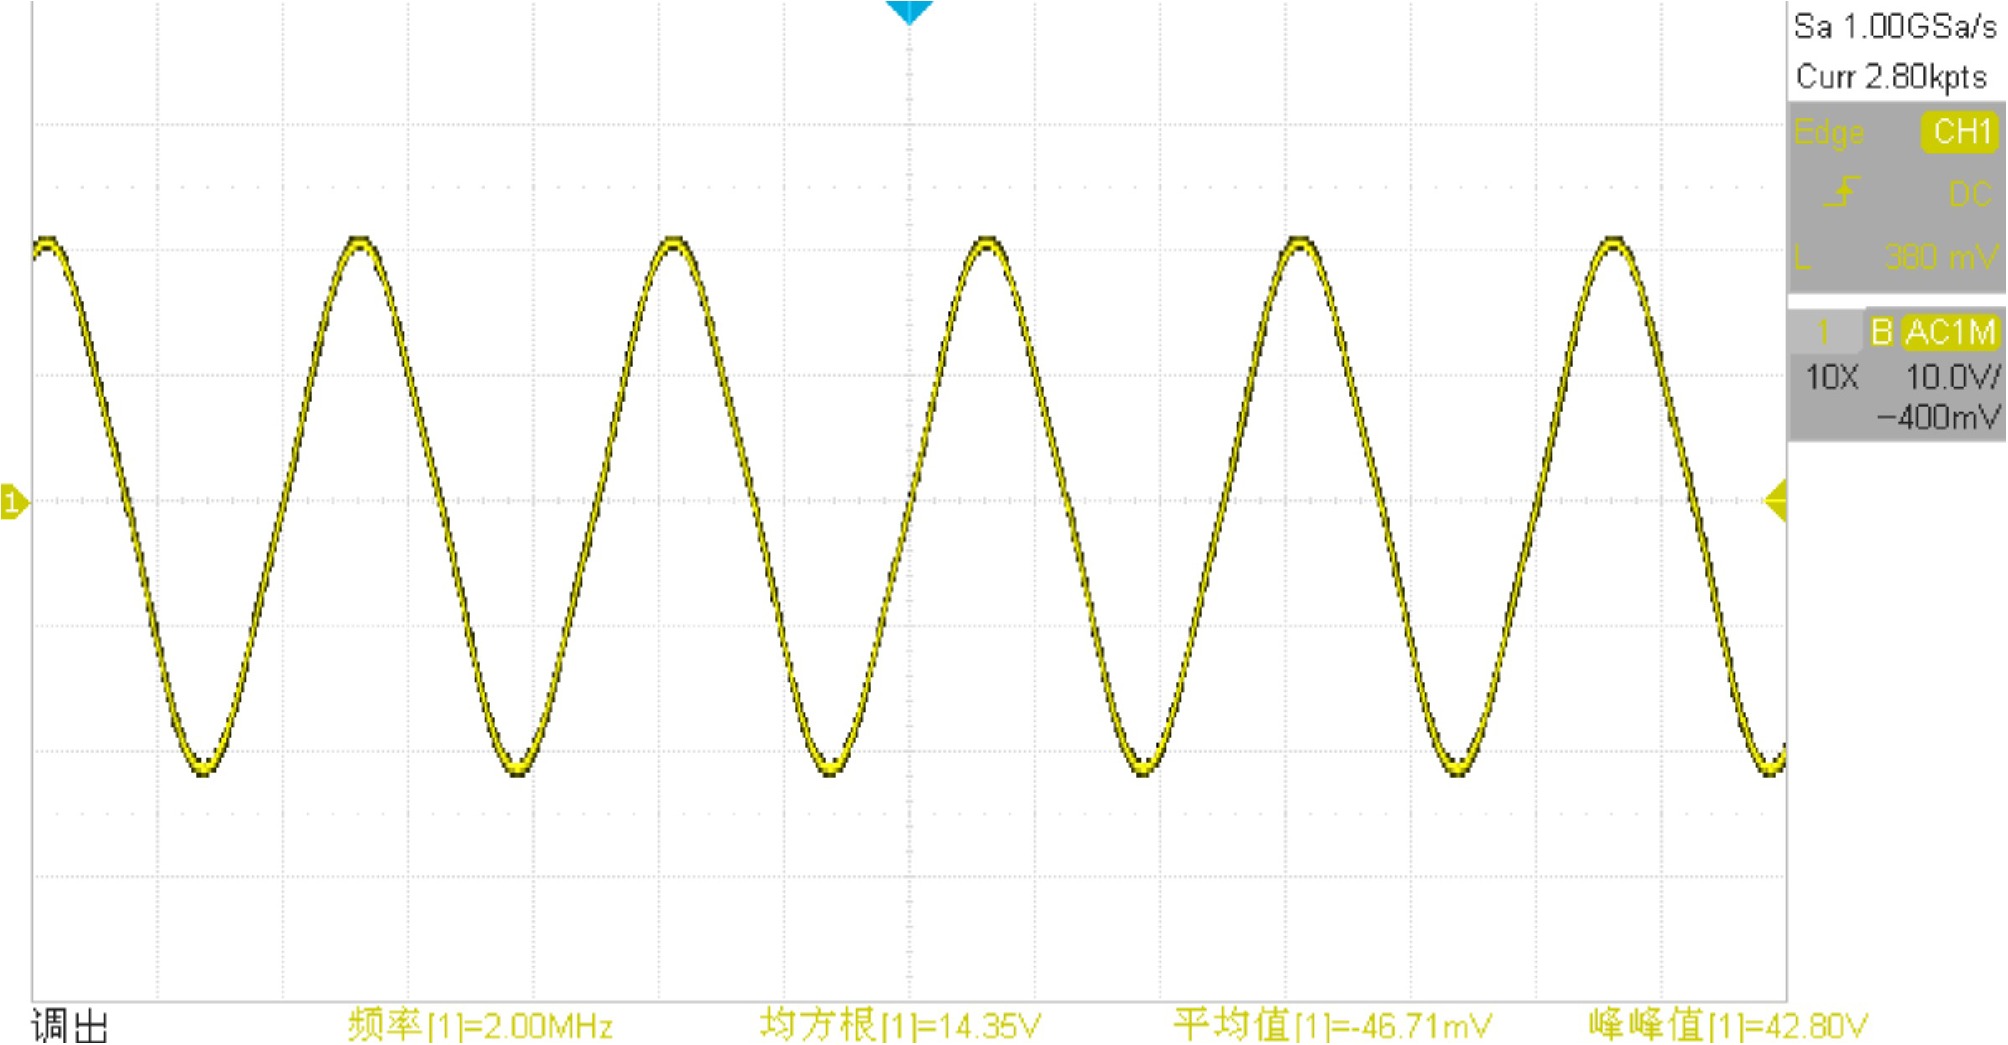
Figure 17.
Primary capacitor voltage
$ {U}_{{{C}_{1}}} $ -
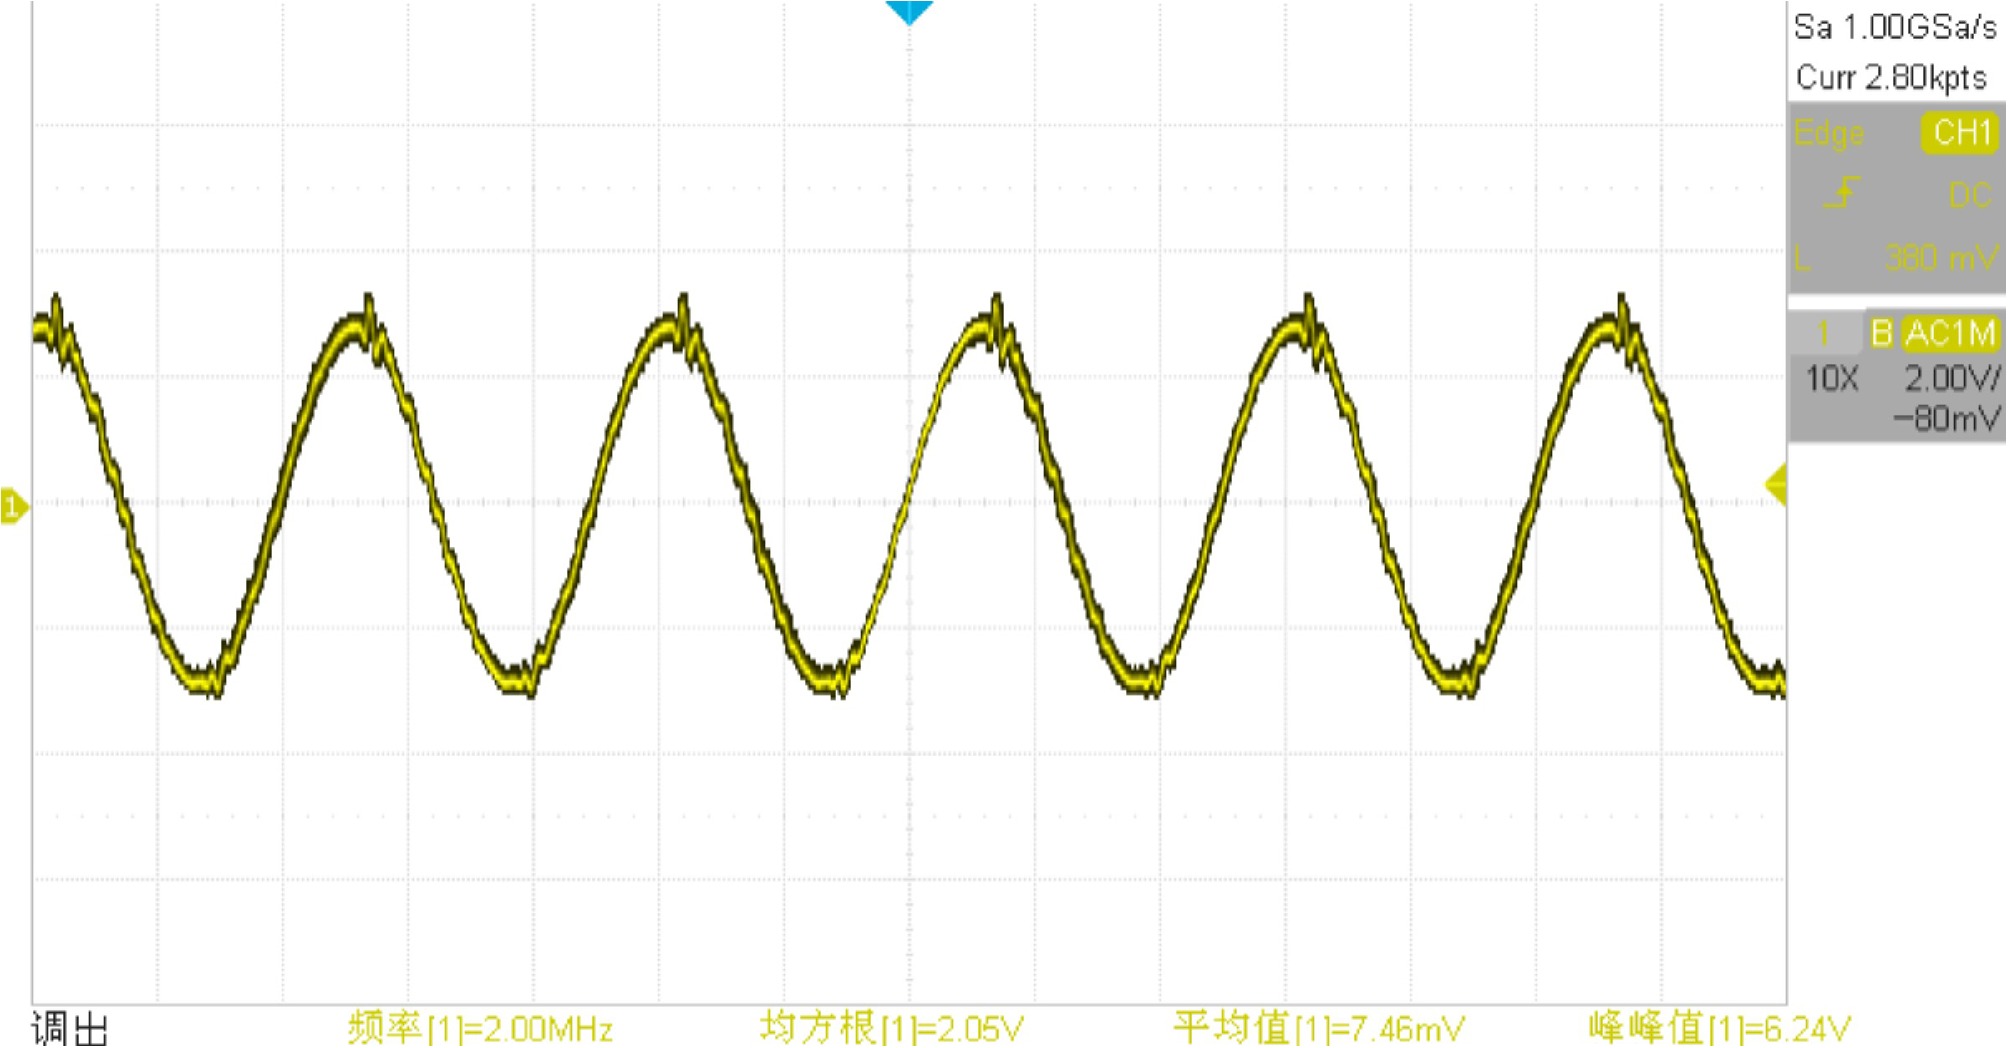
Figure 18.
Load voltage
$ {U}_{R} $ -
Parameter Value Length of the single wire 200 m Radius of the single wire 0.53 mm Input power supply 100 V Load 50 Ω Table 1.
Simulation parameters.
-
Parameter Value LCL inductance 1.2 μH LCL capacitance 5.28 nF Diameter of the single line 2 mm Load resistance 50 Ω Effective value of the inverter's output voltage 12 V Working frequency 2 Mhz Effective value of load voltage 2 V Length of the single line 15 cm Table 2.
The system's parameters.
-
Experimental scenario Peak to peak value Root mean square Load voltage under asymmetric connection method A 7.7 V 2.49 V Load voltage under asymmetric connection method B 2.02 V 438.05 mV Load voltage under asymmetric connection method C 5.6 V 1.67 V Load voltage under asymmetric connection method D 2.36 V 609.89 mV Load voltage under symmetrical connection method A 7.53 V 2.43 V Load voltage under symmetrical connection method B 6.128 V 1.92 V Load voltage under symmetrical connection method C 5.52 V 1.62 V Load voltage under symmetrical connection method D 5.58 V 1.78 V Single line length = 5 cm in Mode A 7.5 V 2.43 V Single line length = 10 cm in Mode A 7.7 V 2.42 V Single line length = 15 cm in Mode A 7.764 2.44 V Single line length = 20 cm in Mode A 7.88 V 2.49 V Single line length = 25 cm in Mode A 7.83 V 2.46 V Output under no load condition 9.6 V 3.32 V Table 3.
Experimental data chart.
Figures
(18)
Tables
(3)