-
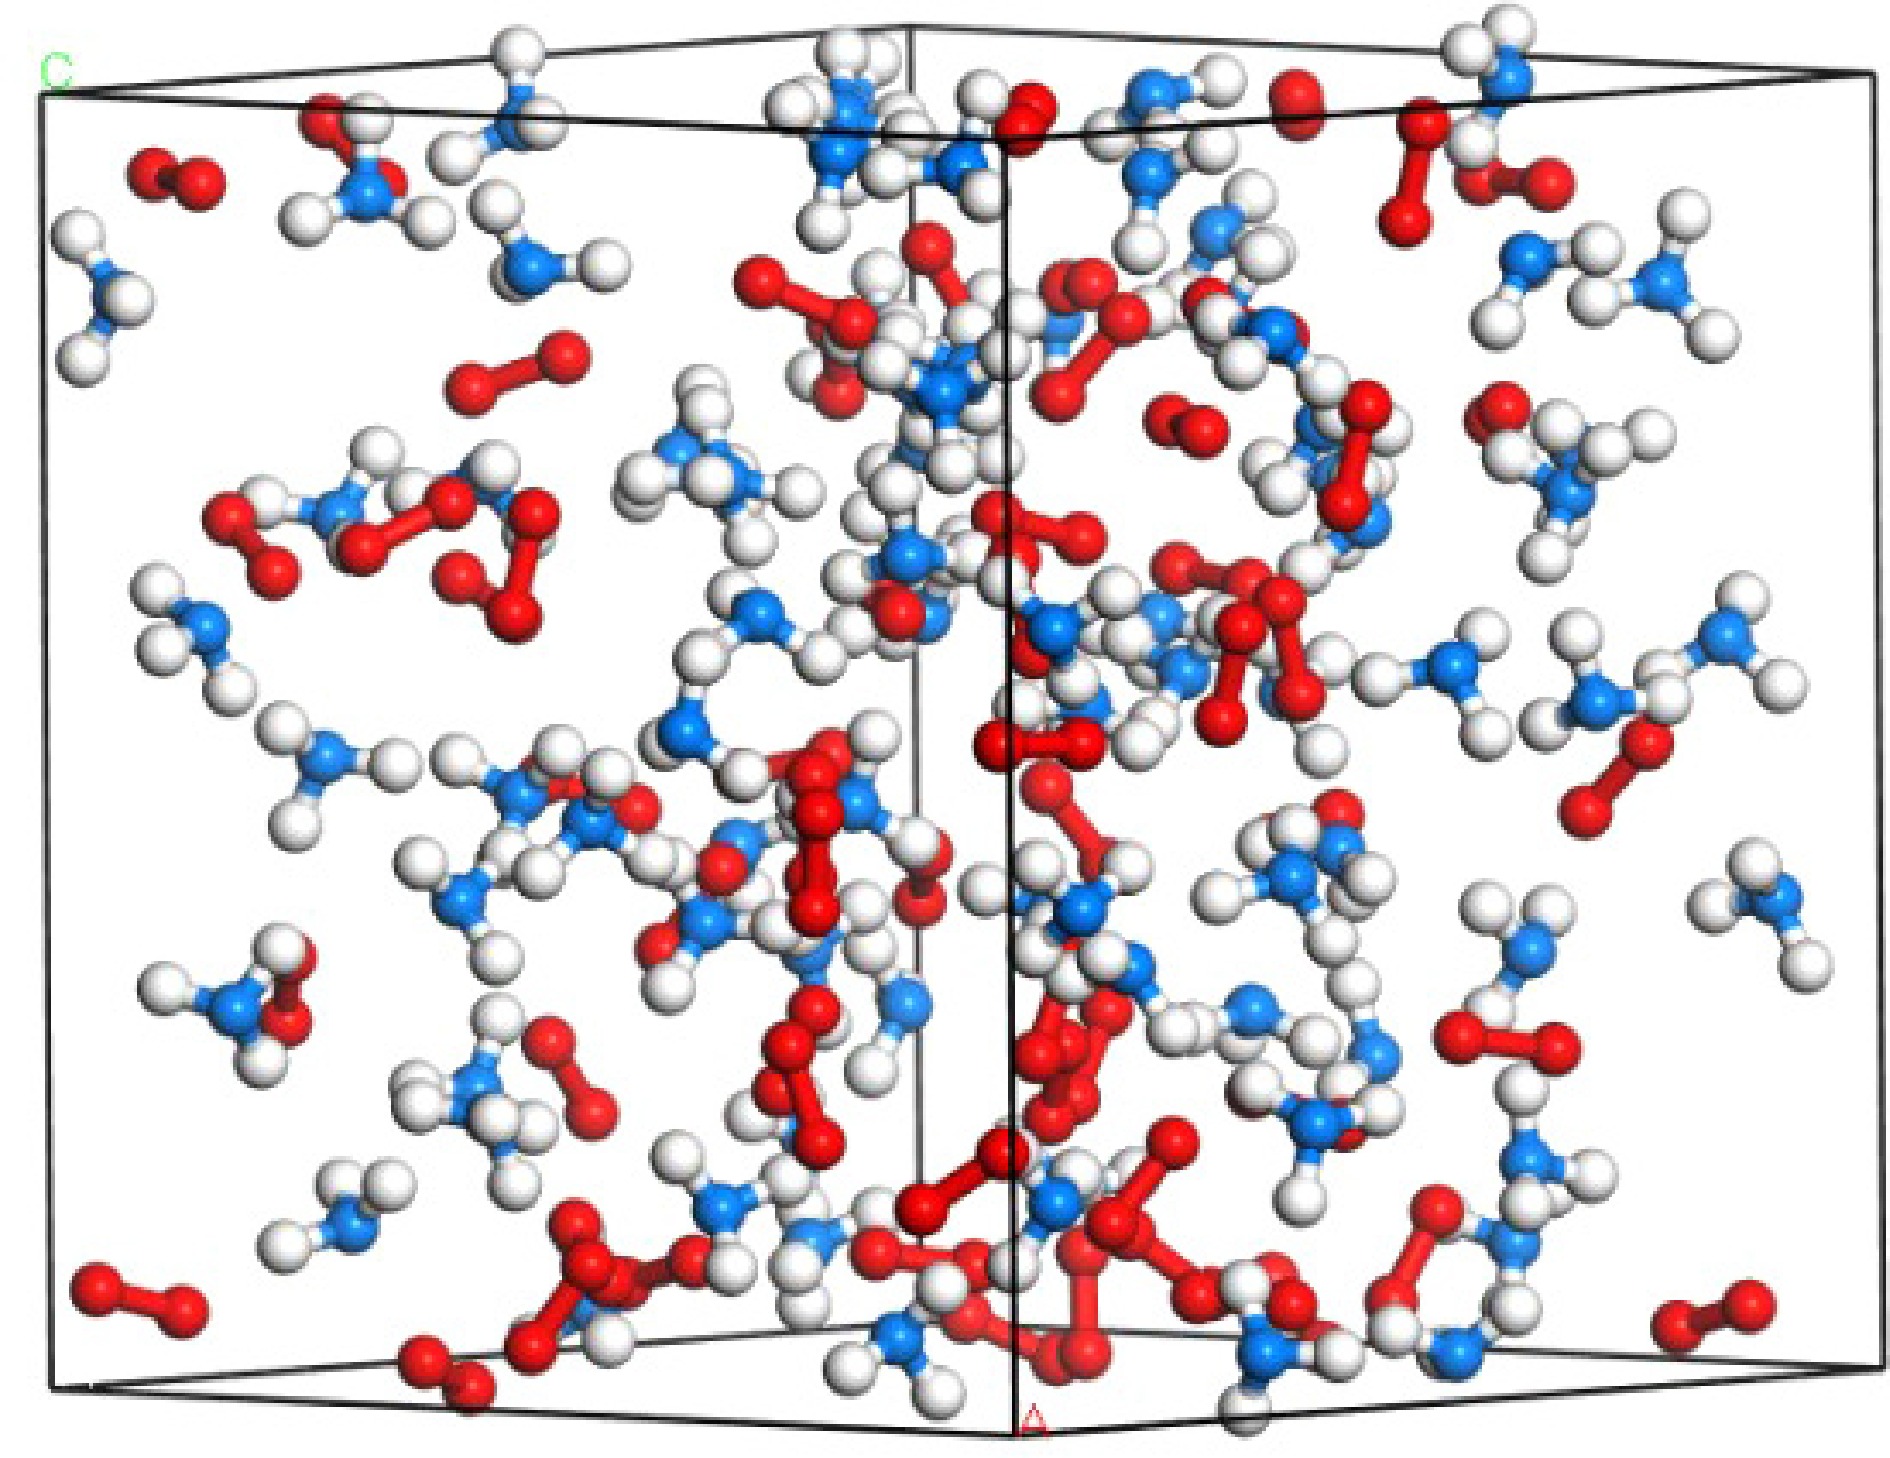
Figure 1.
Ammonia/oxygen premixed system (Equivalence ratio = 1.0, N is blue, H is white, O is red).
-
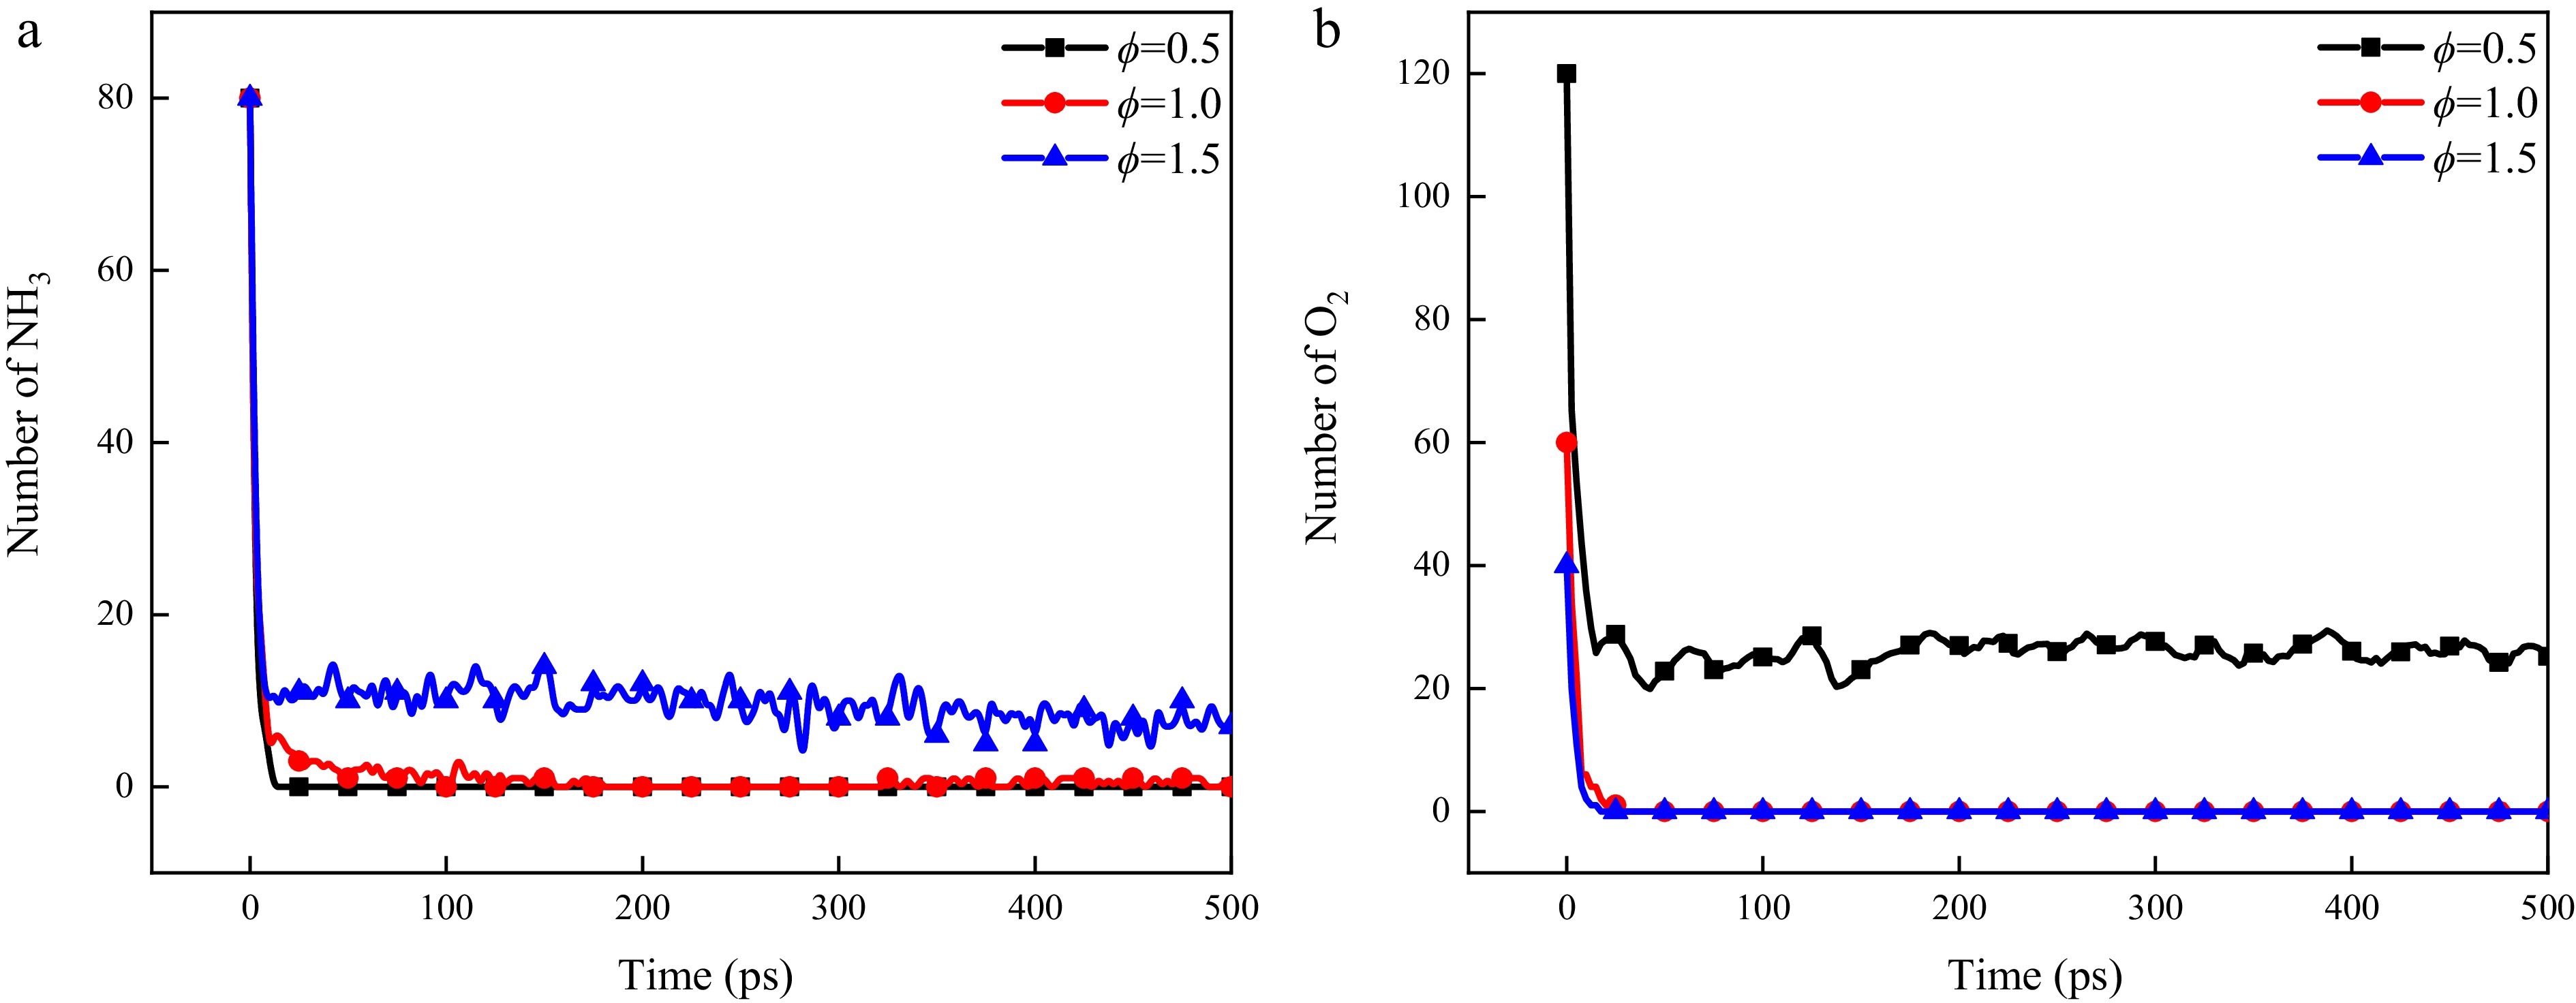
Figure 2.
Evolution of main reactants at different equivalent ratios.
-
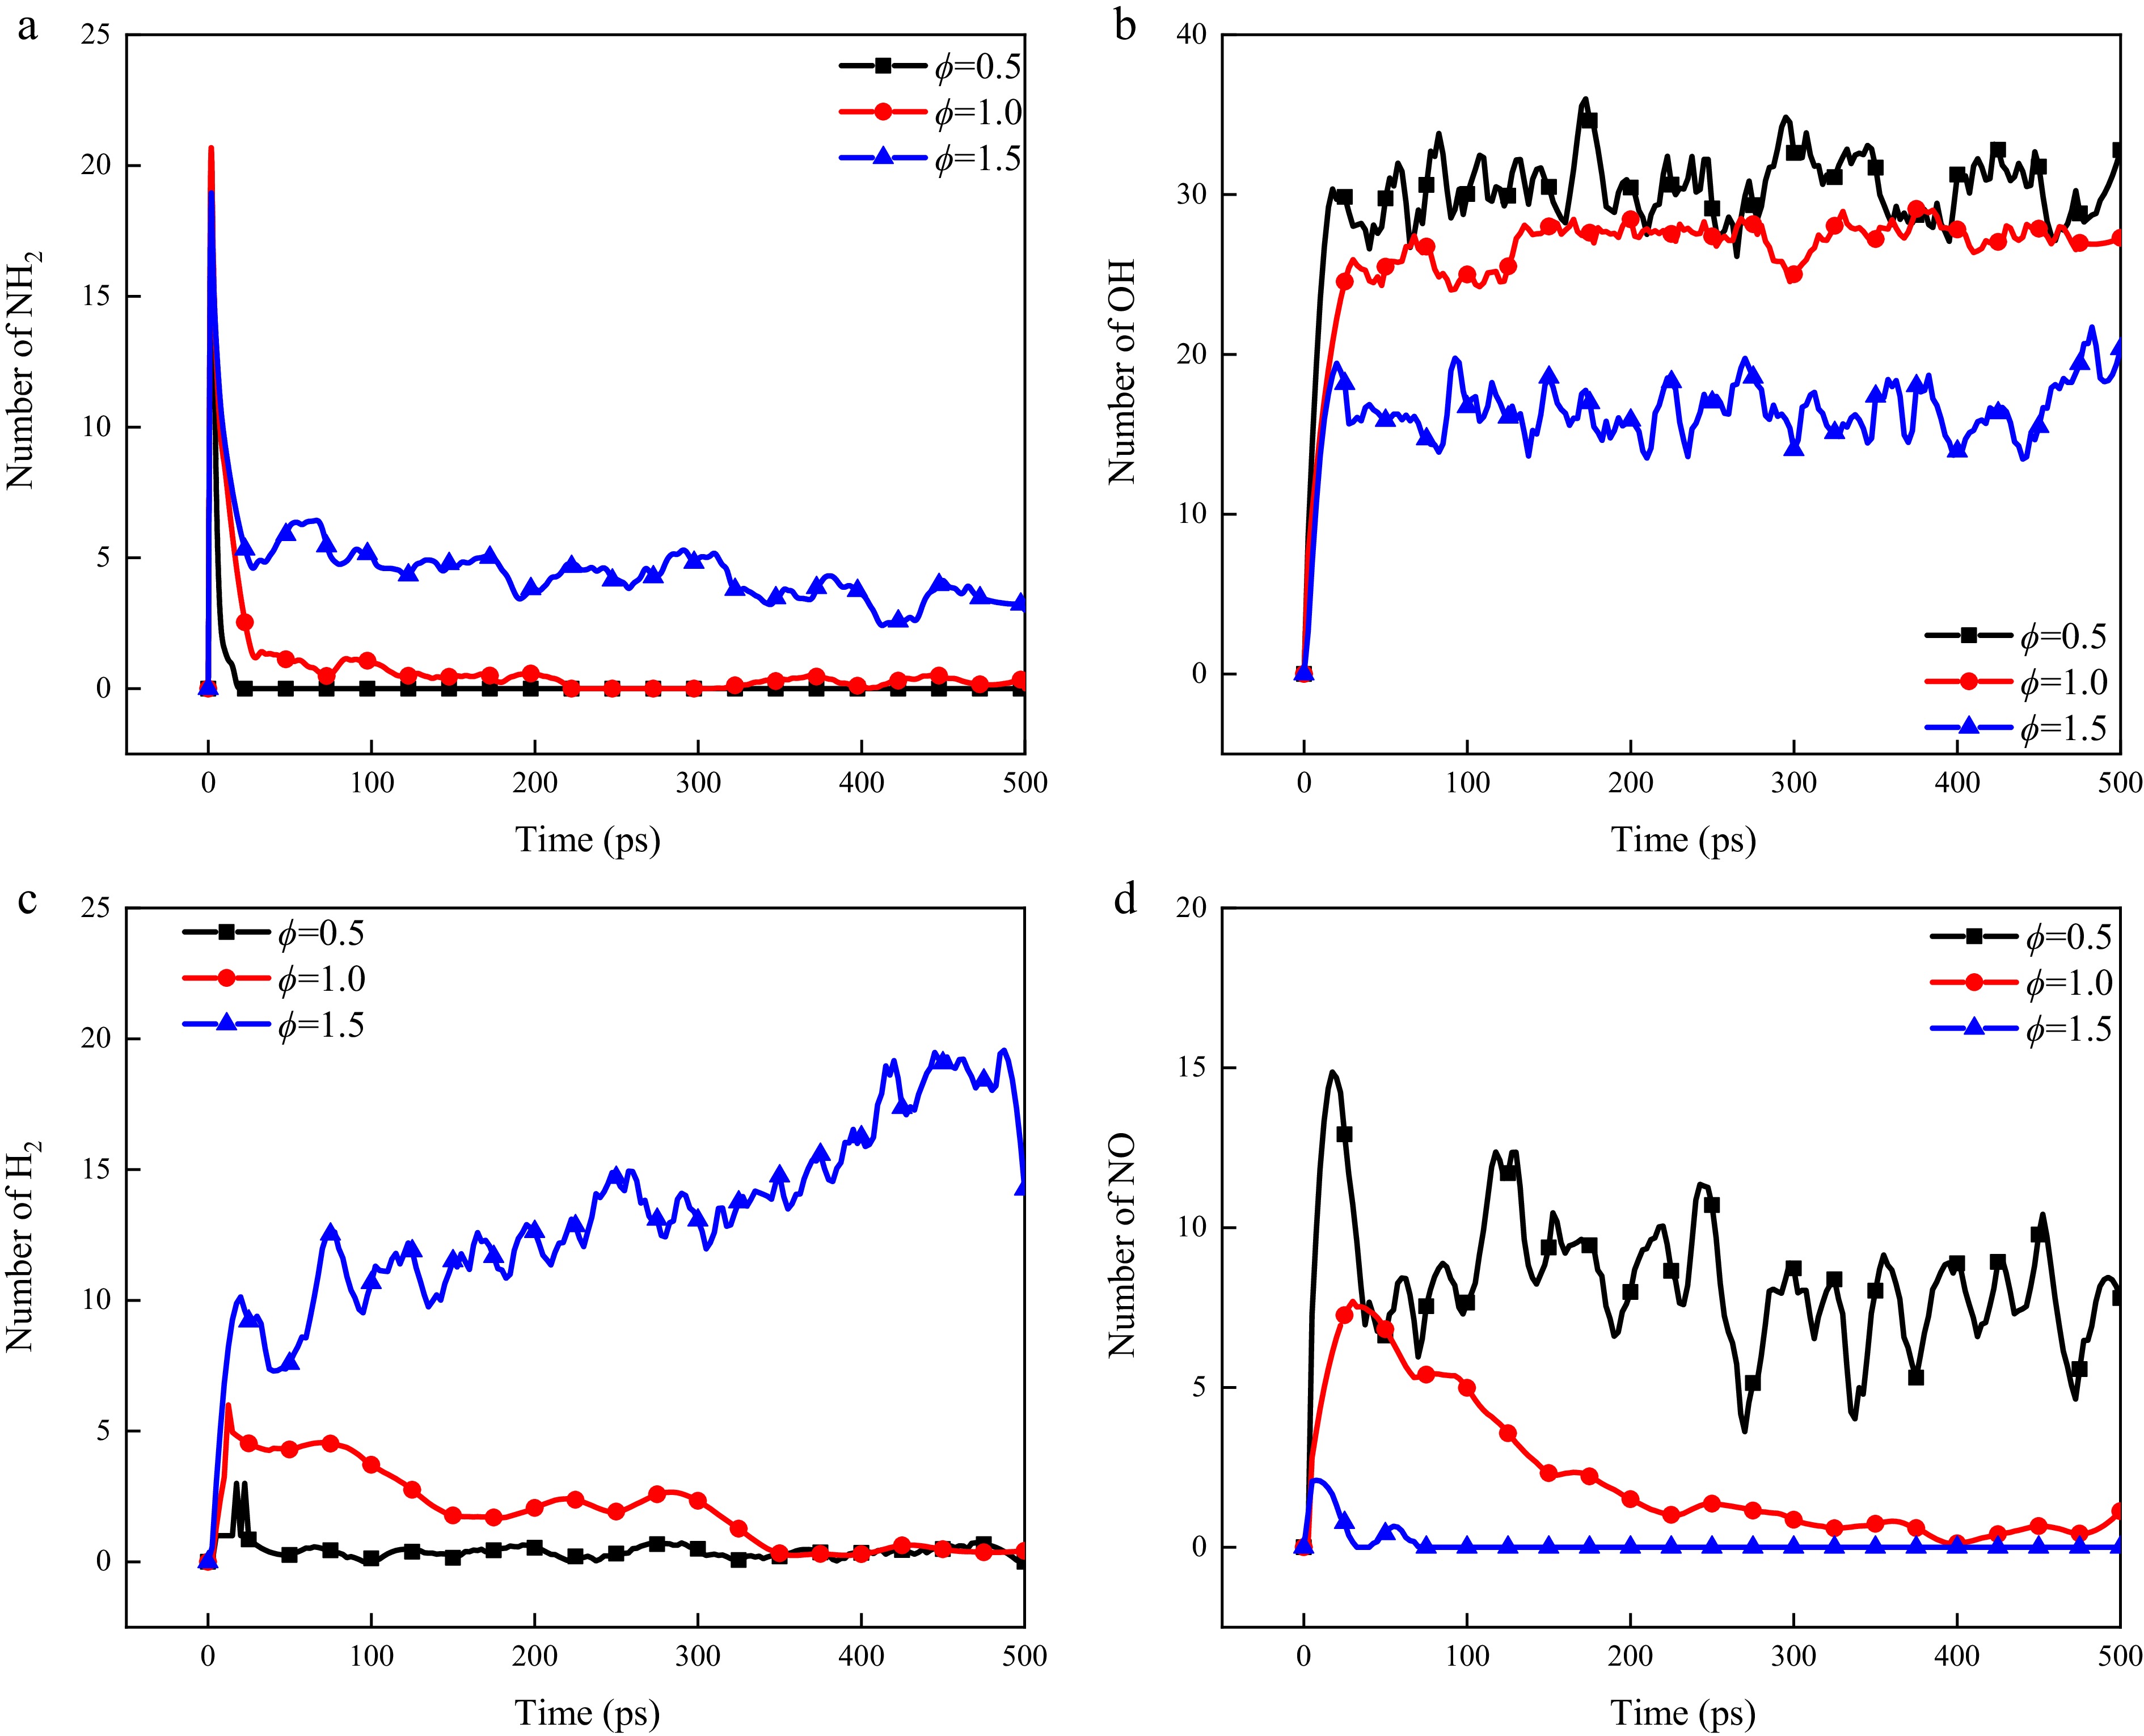
Figure 3.
Temporal evolution of main radicals and products at different equivalence ratios.
-
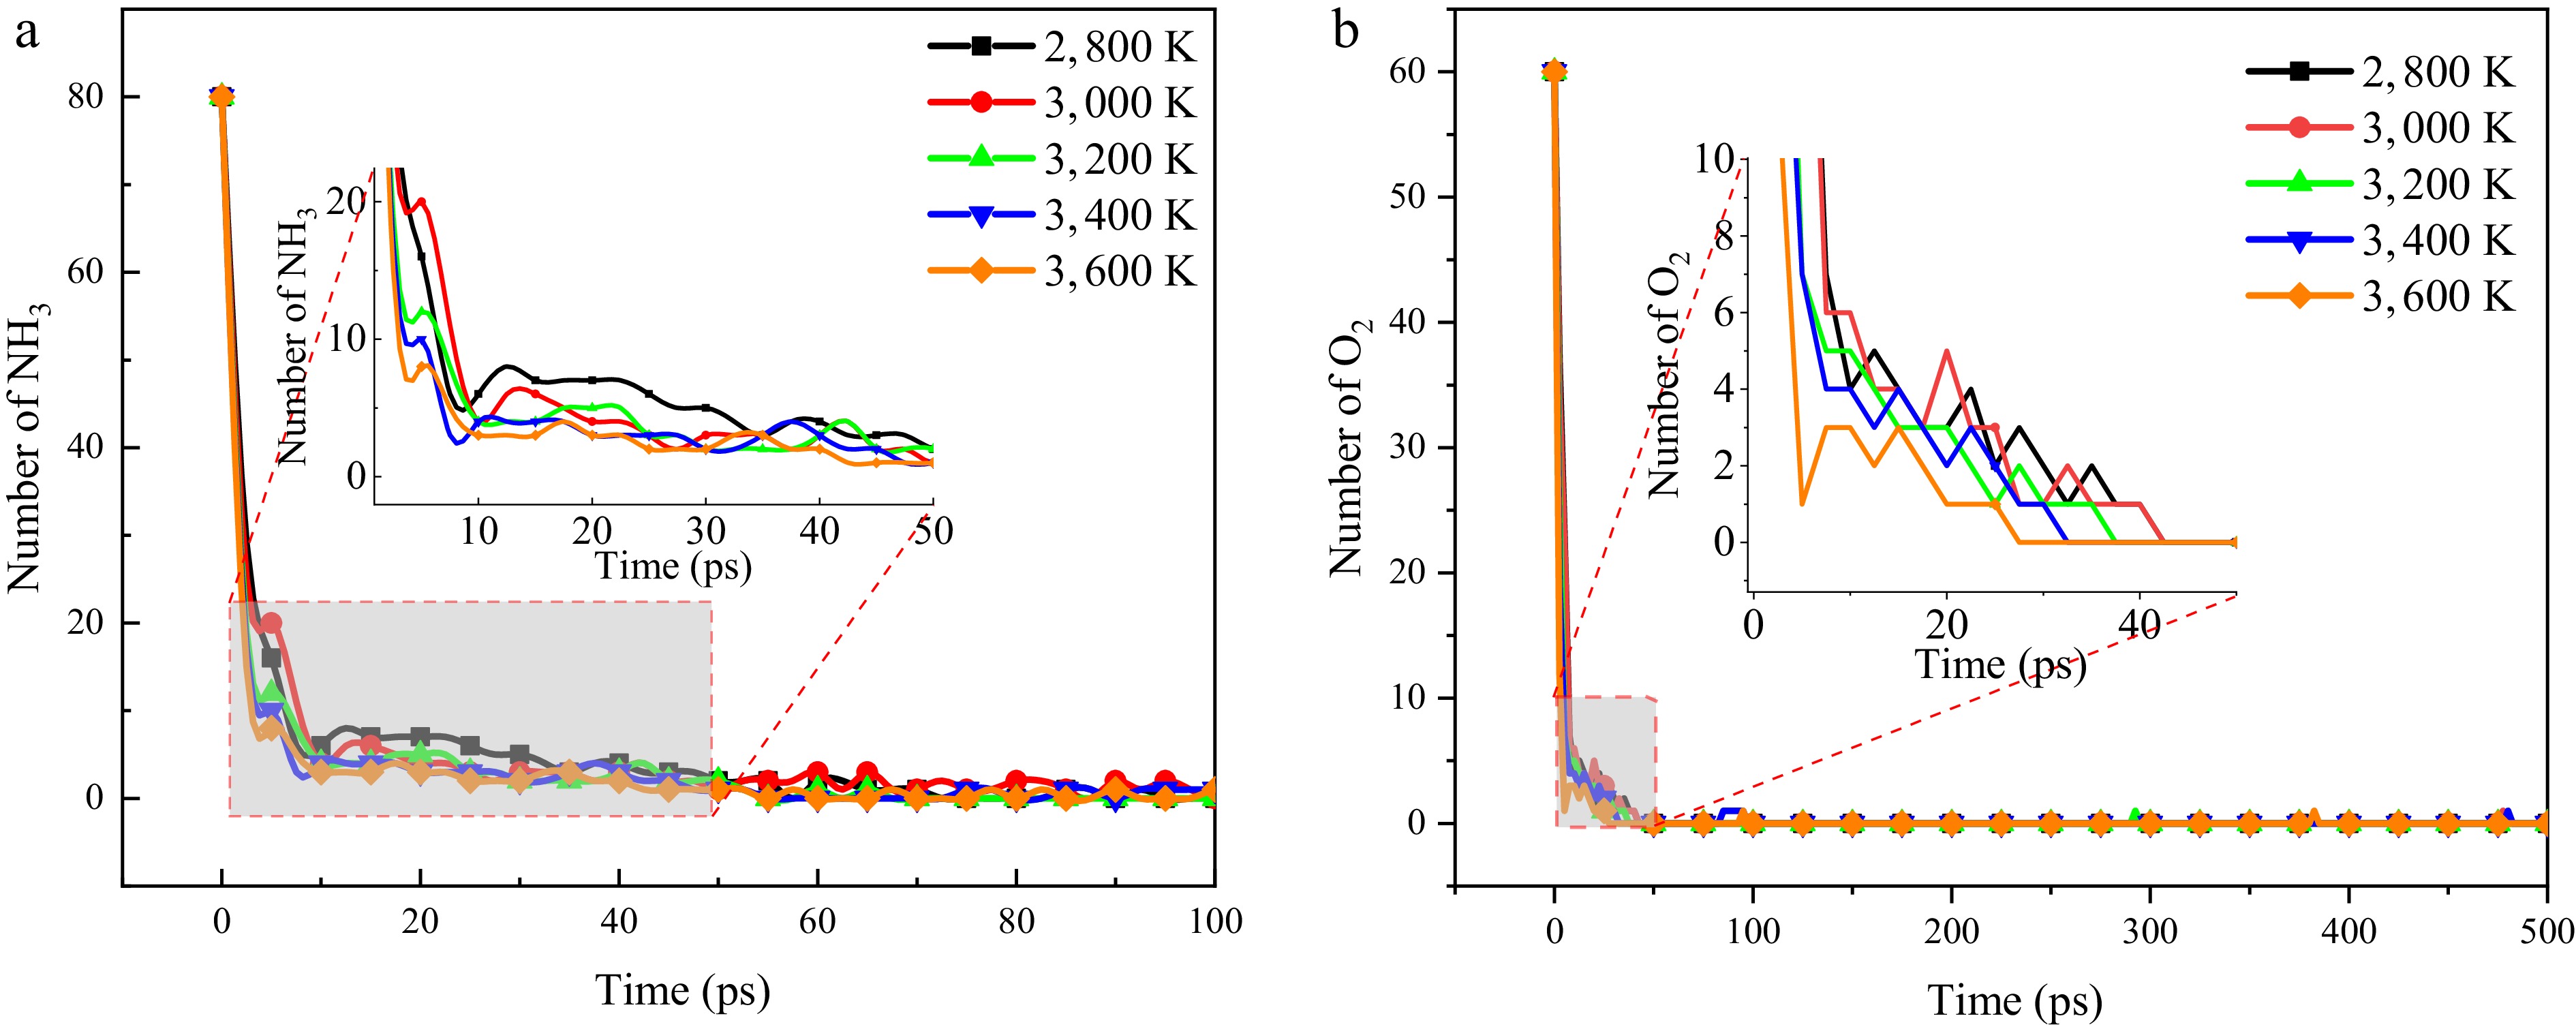
Figure 4.
Variation curves of NH3 and O2 with time at different temperatures.
-
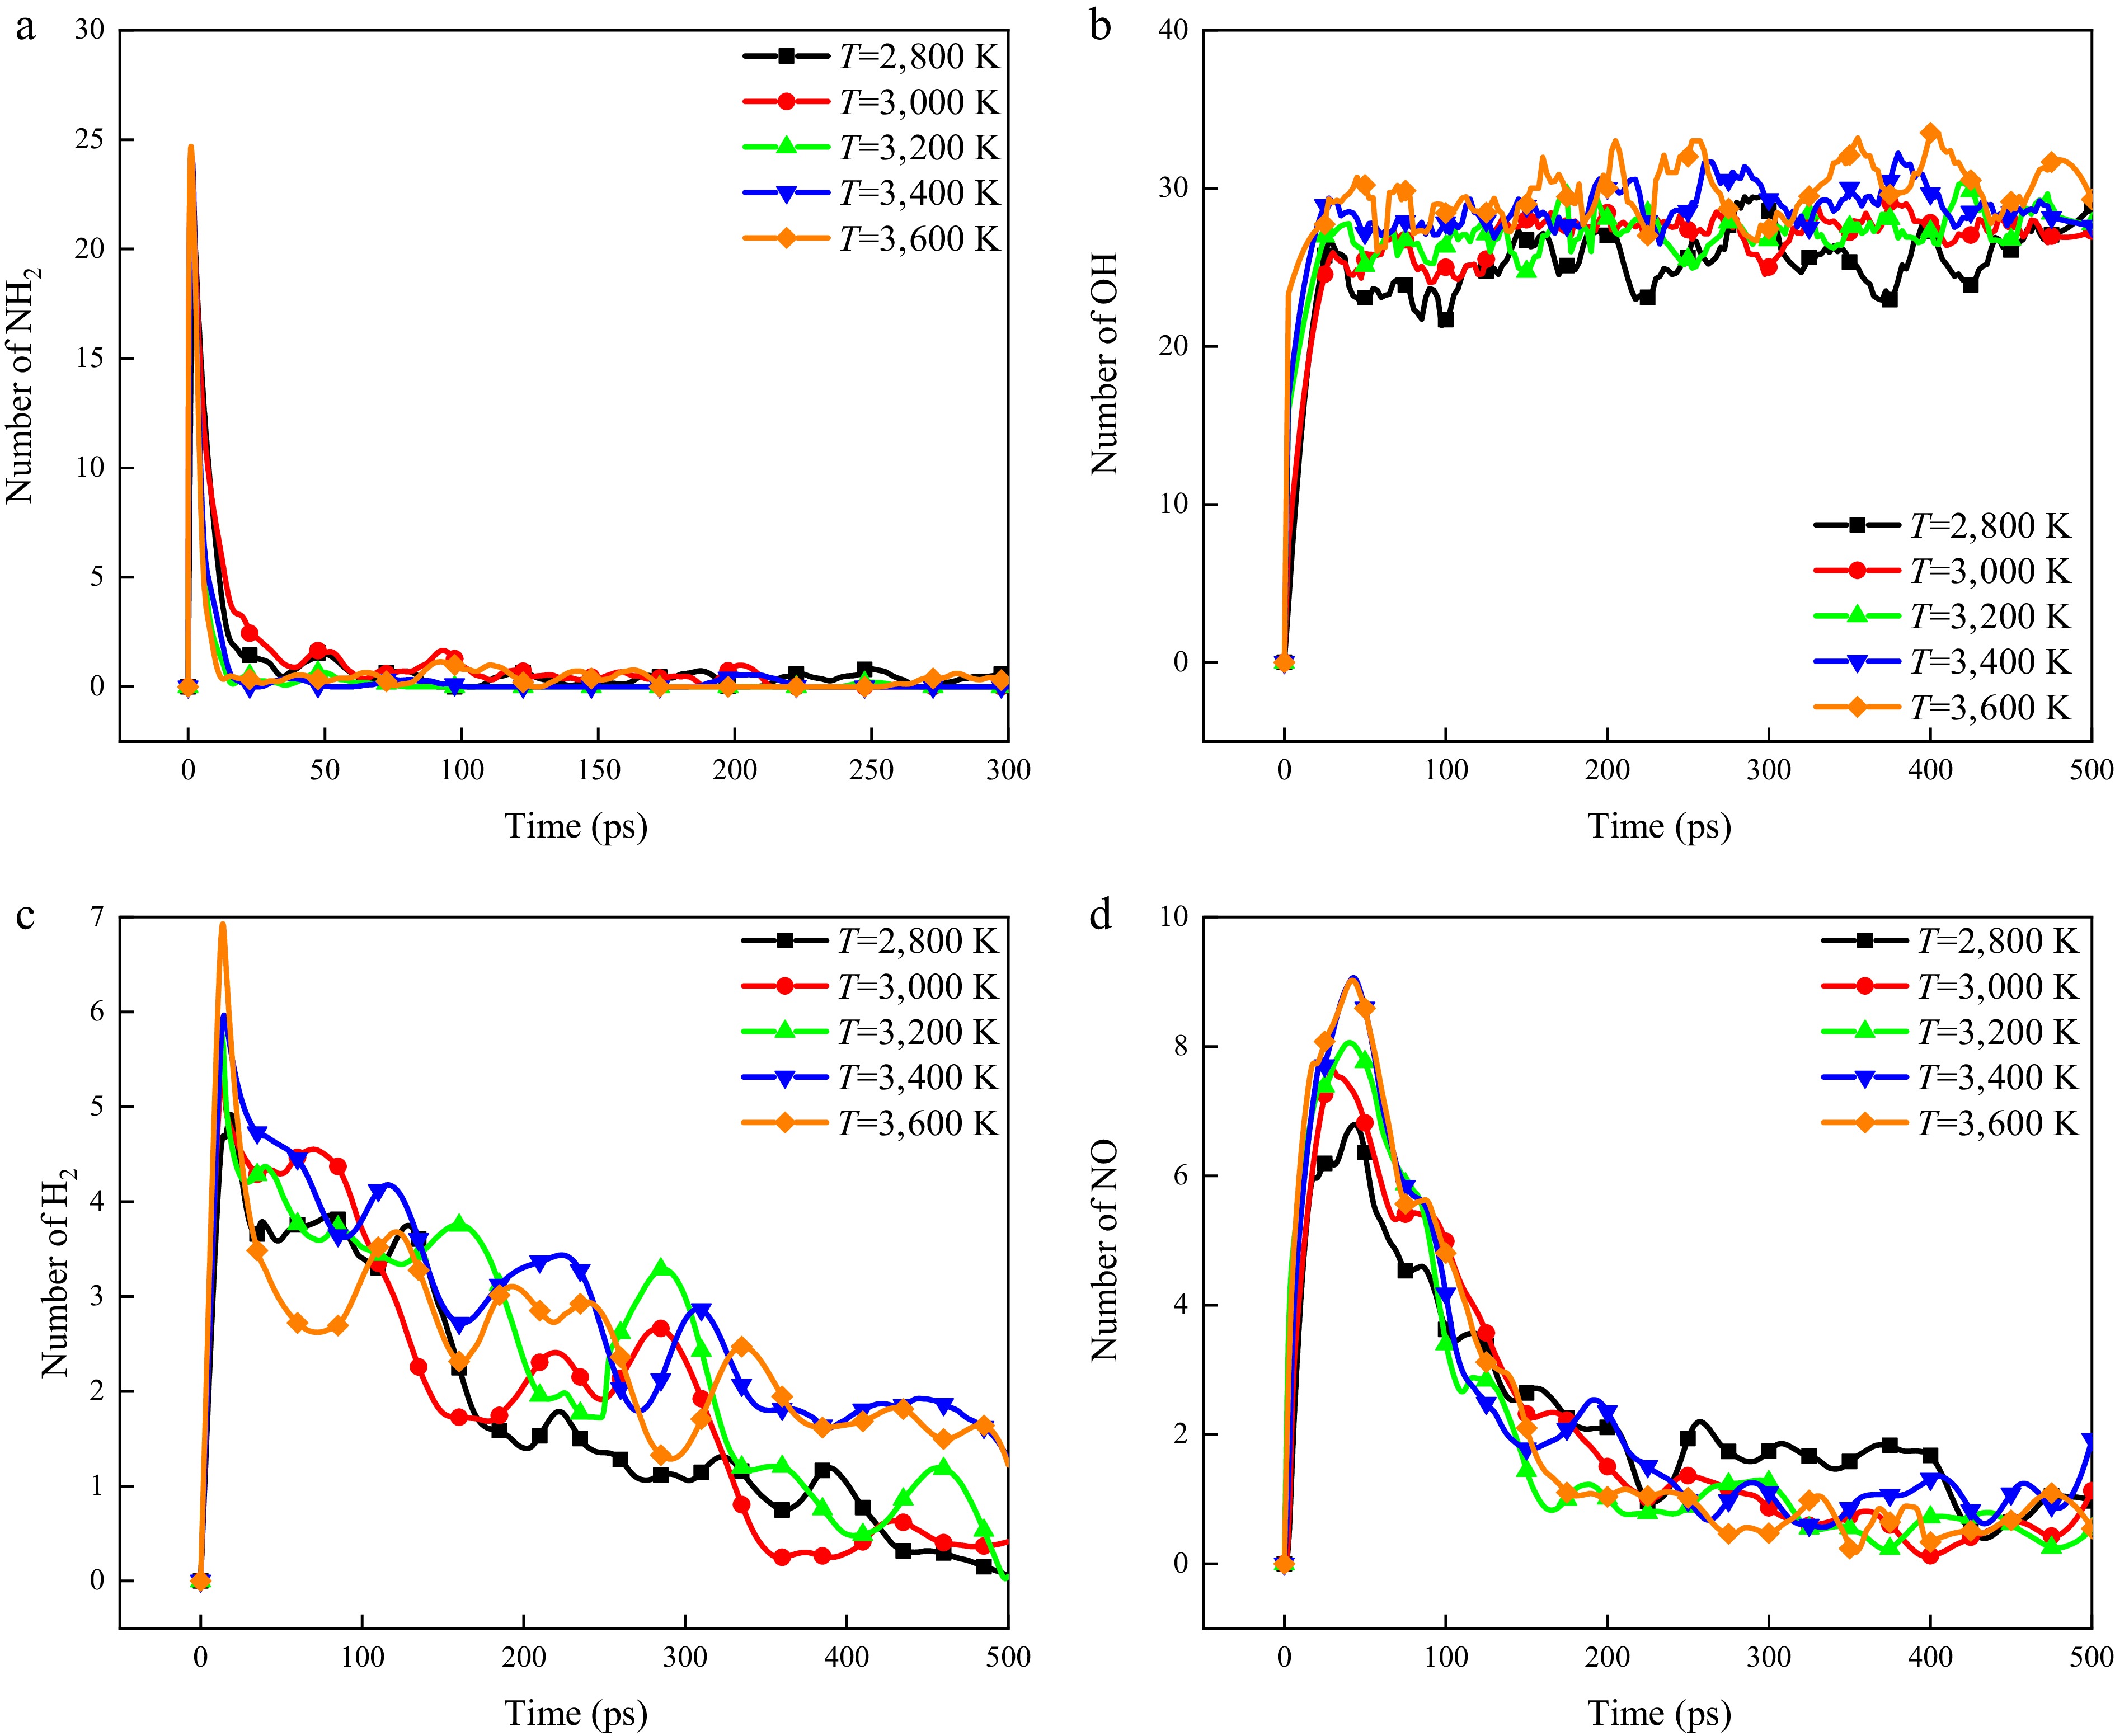
Figure 5.
Variation curves of radicals and formation products with time at different temperatures.
-
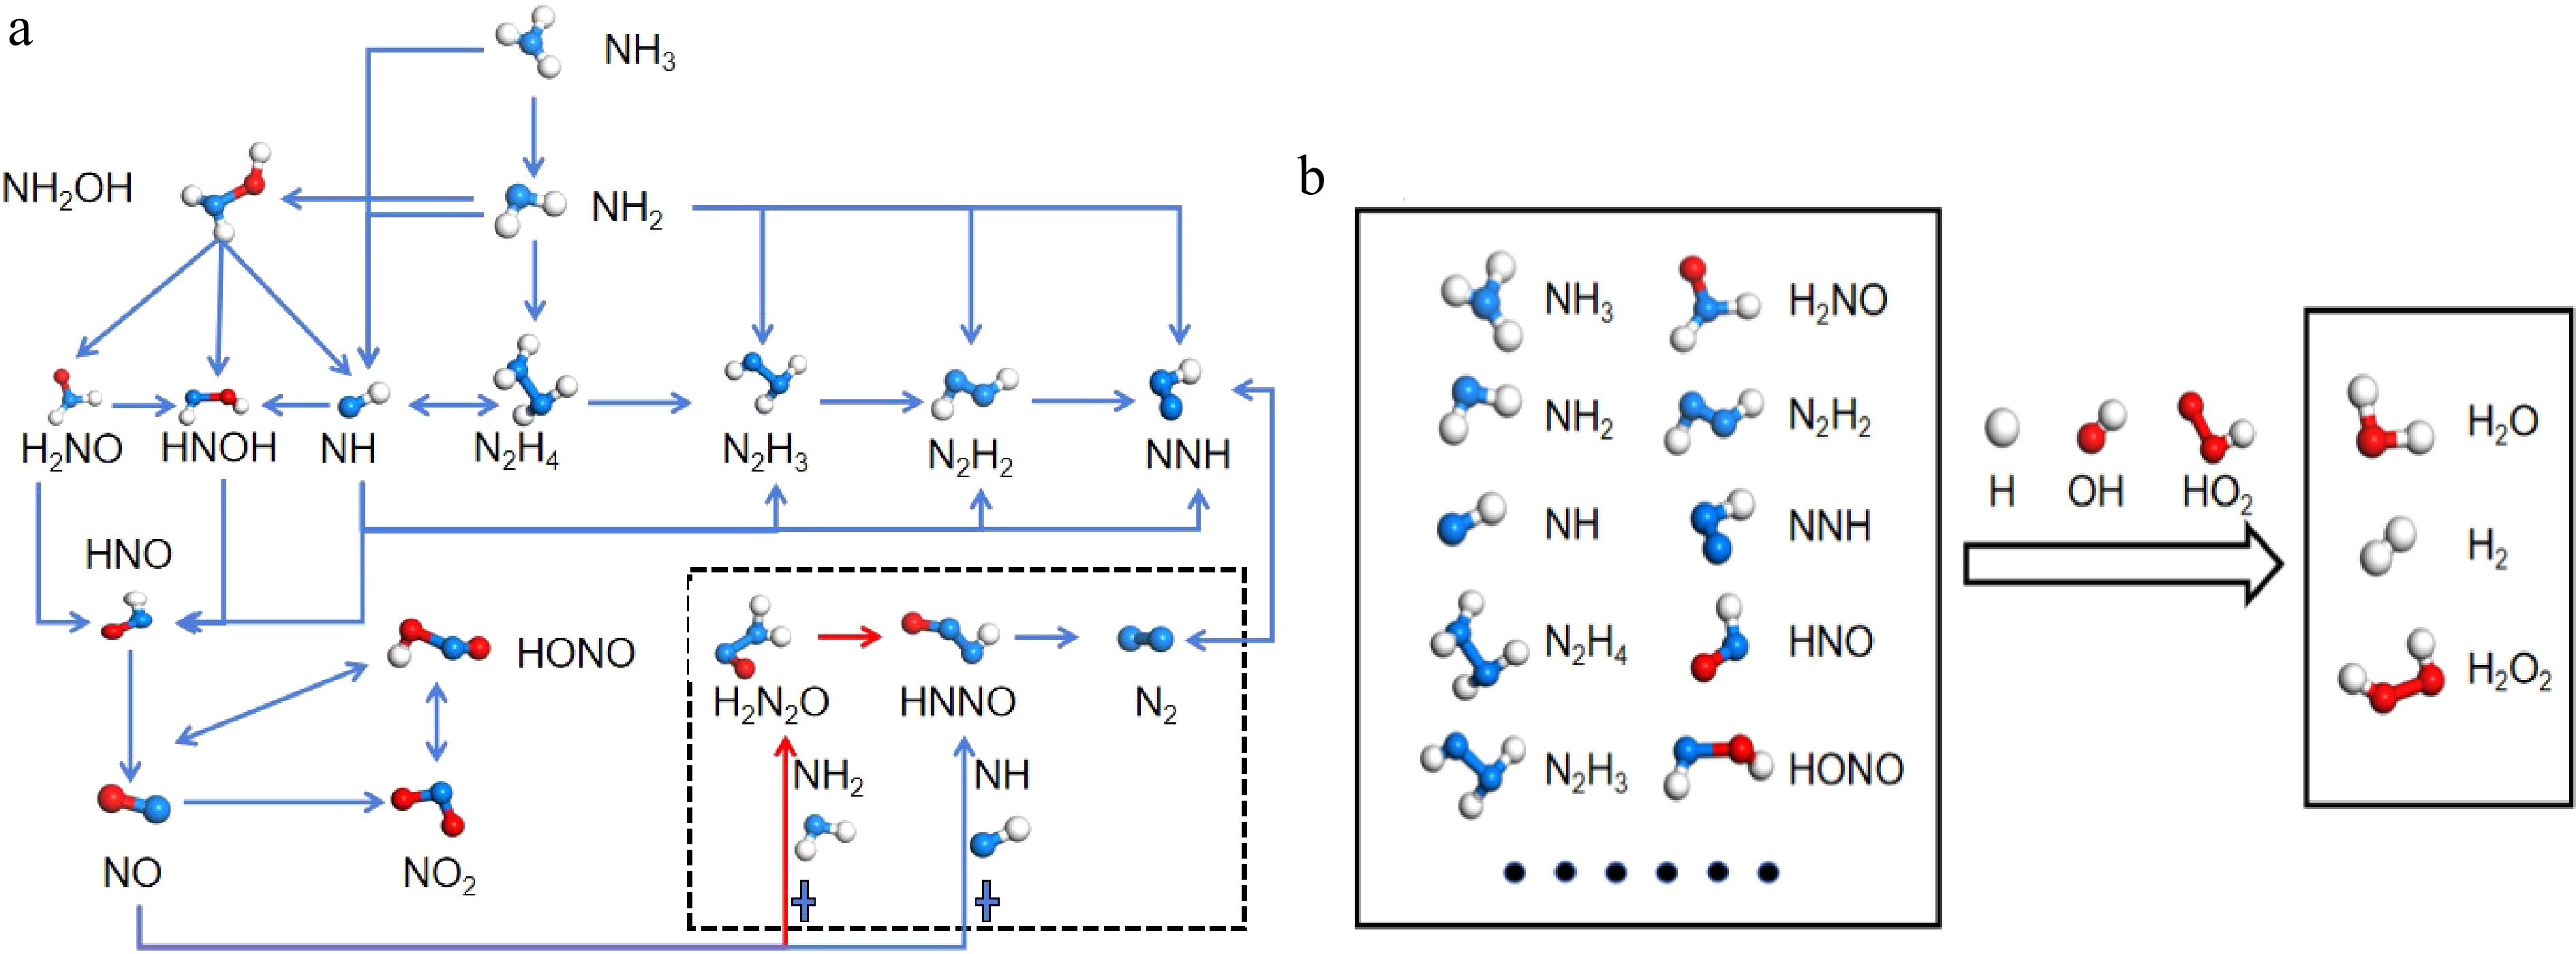
Figure 6.
Reaction path of ammonia combustion.
-
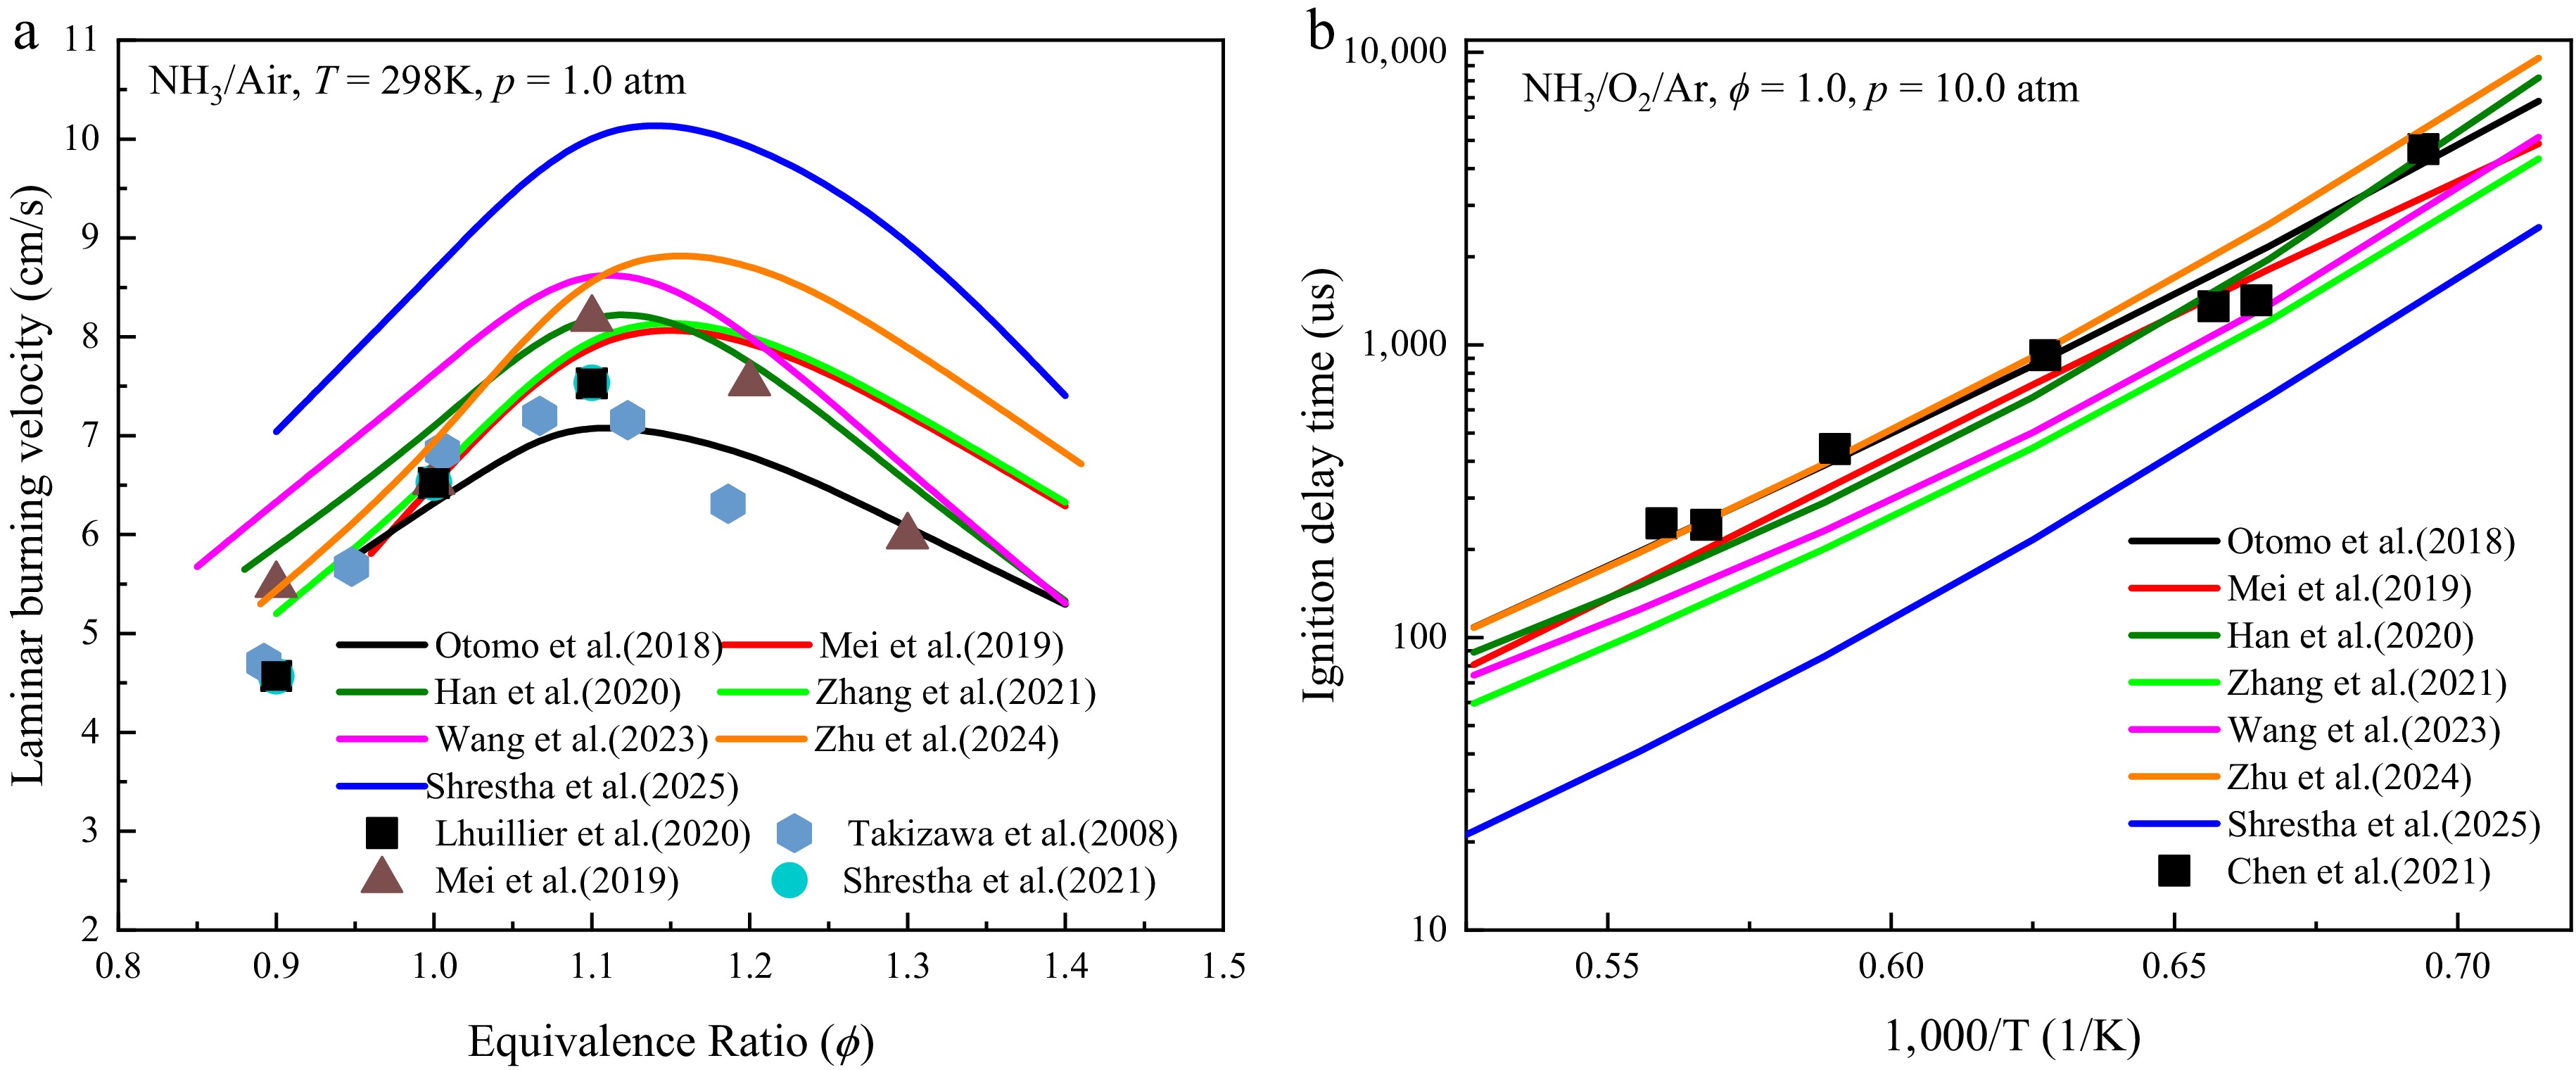
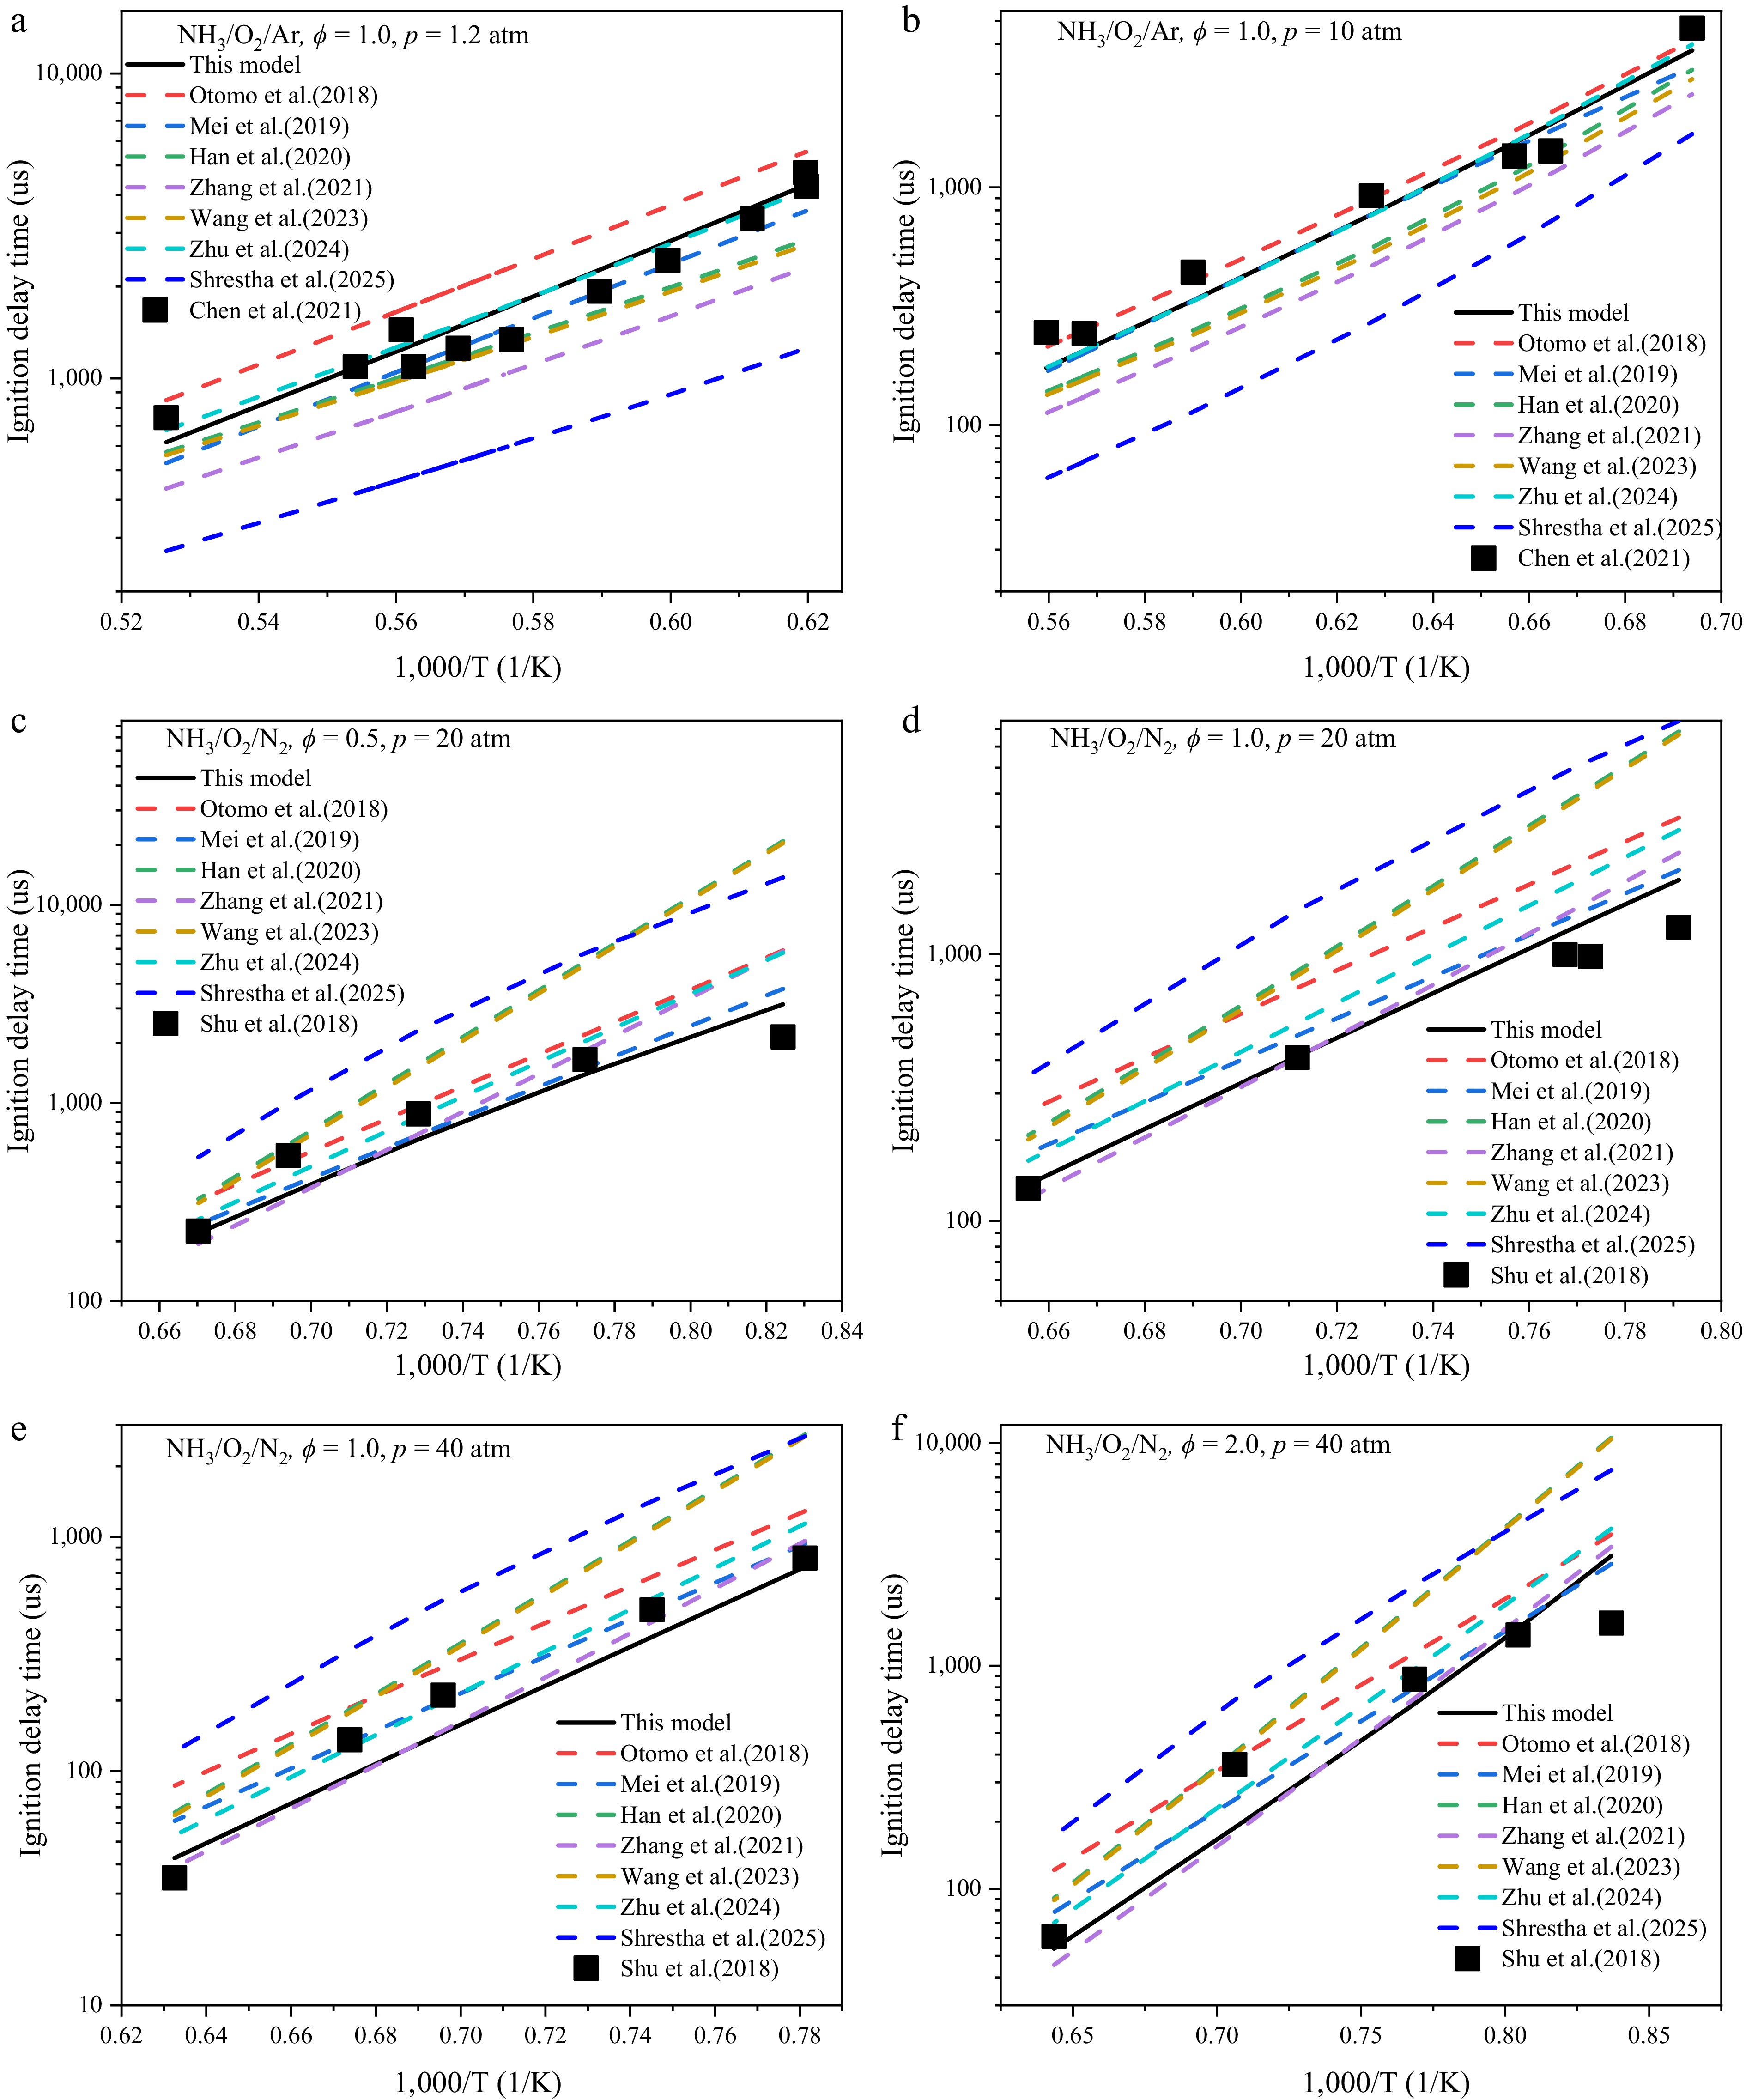
Figure 7.
Comparison of predictive capabilities of different mechanism. (The lines represent predictions seven comparative models, while the symbols correspond to experimentally measured data reported in Lhuillier et al.[10], Takizawa et al.[8], Mei et al.[9], Shrestha et al.[13], and Chen et al.[25]).
-
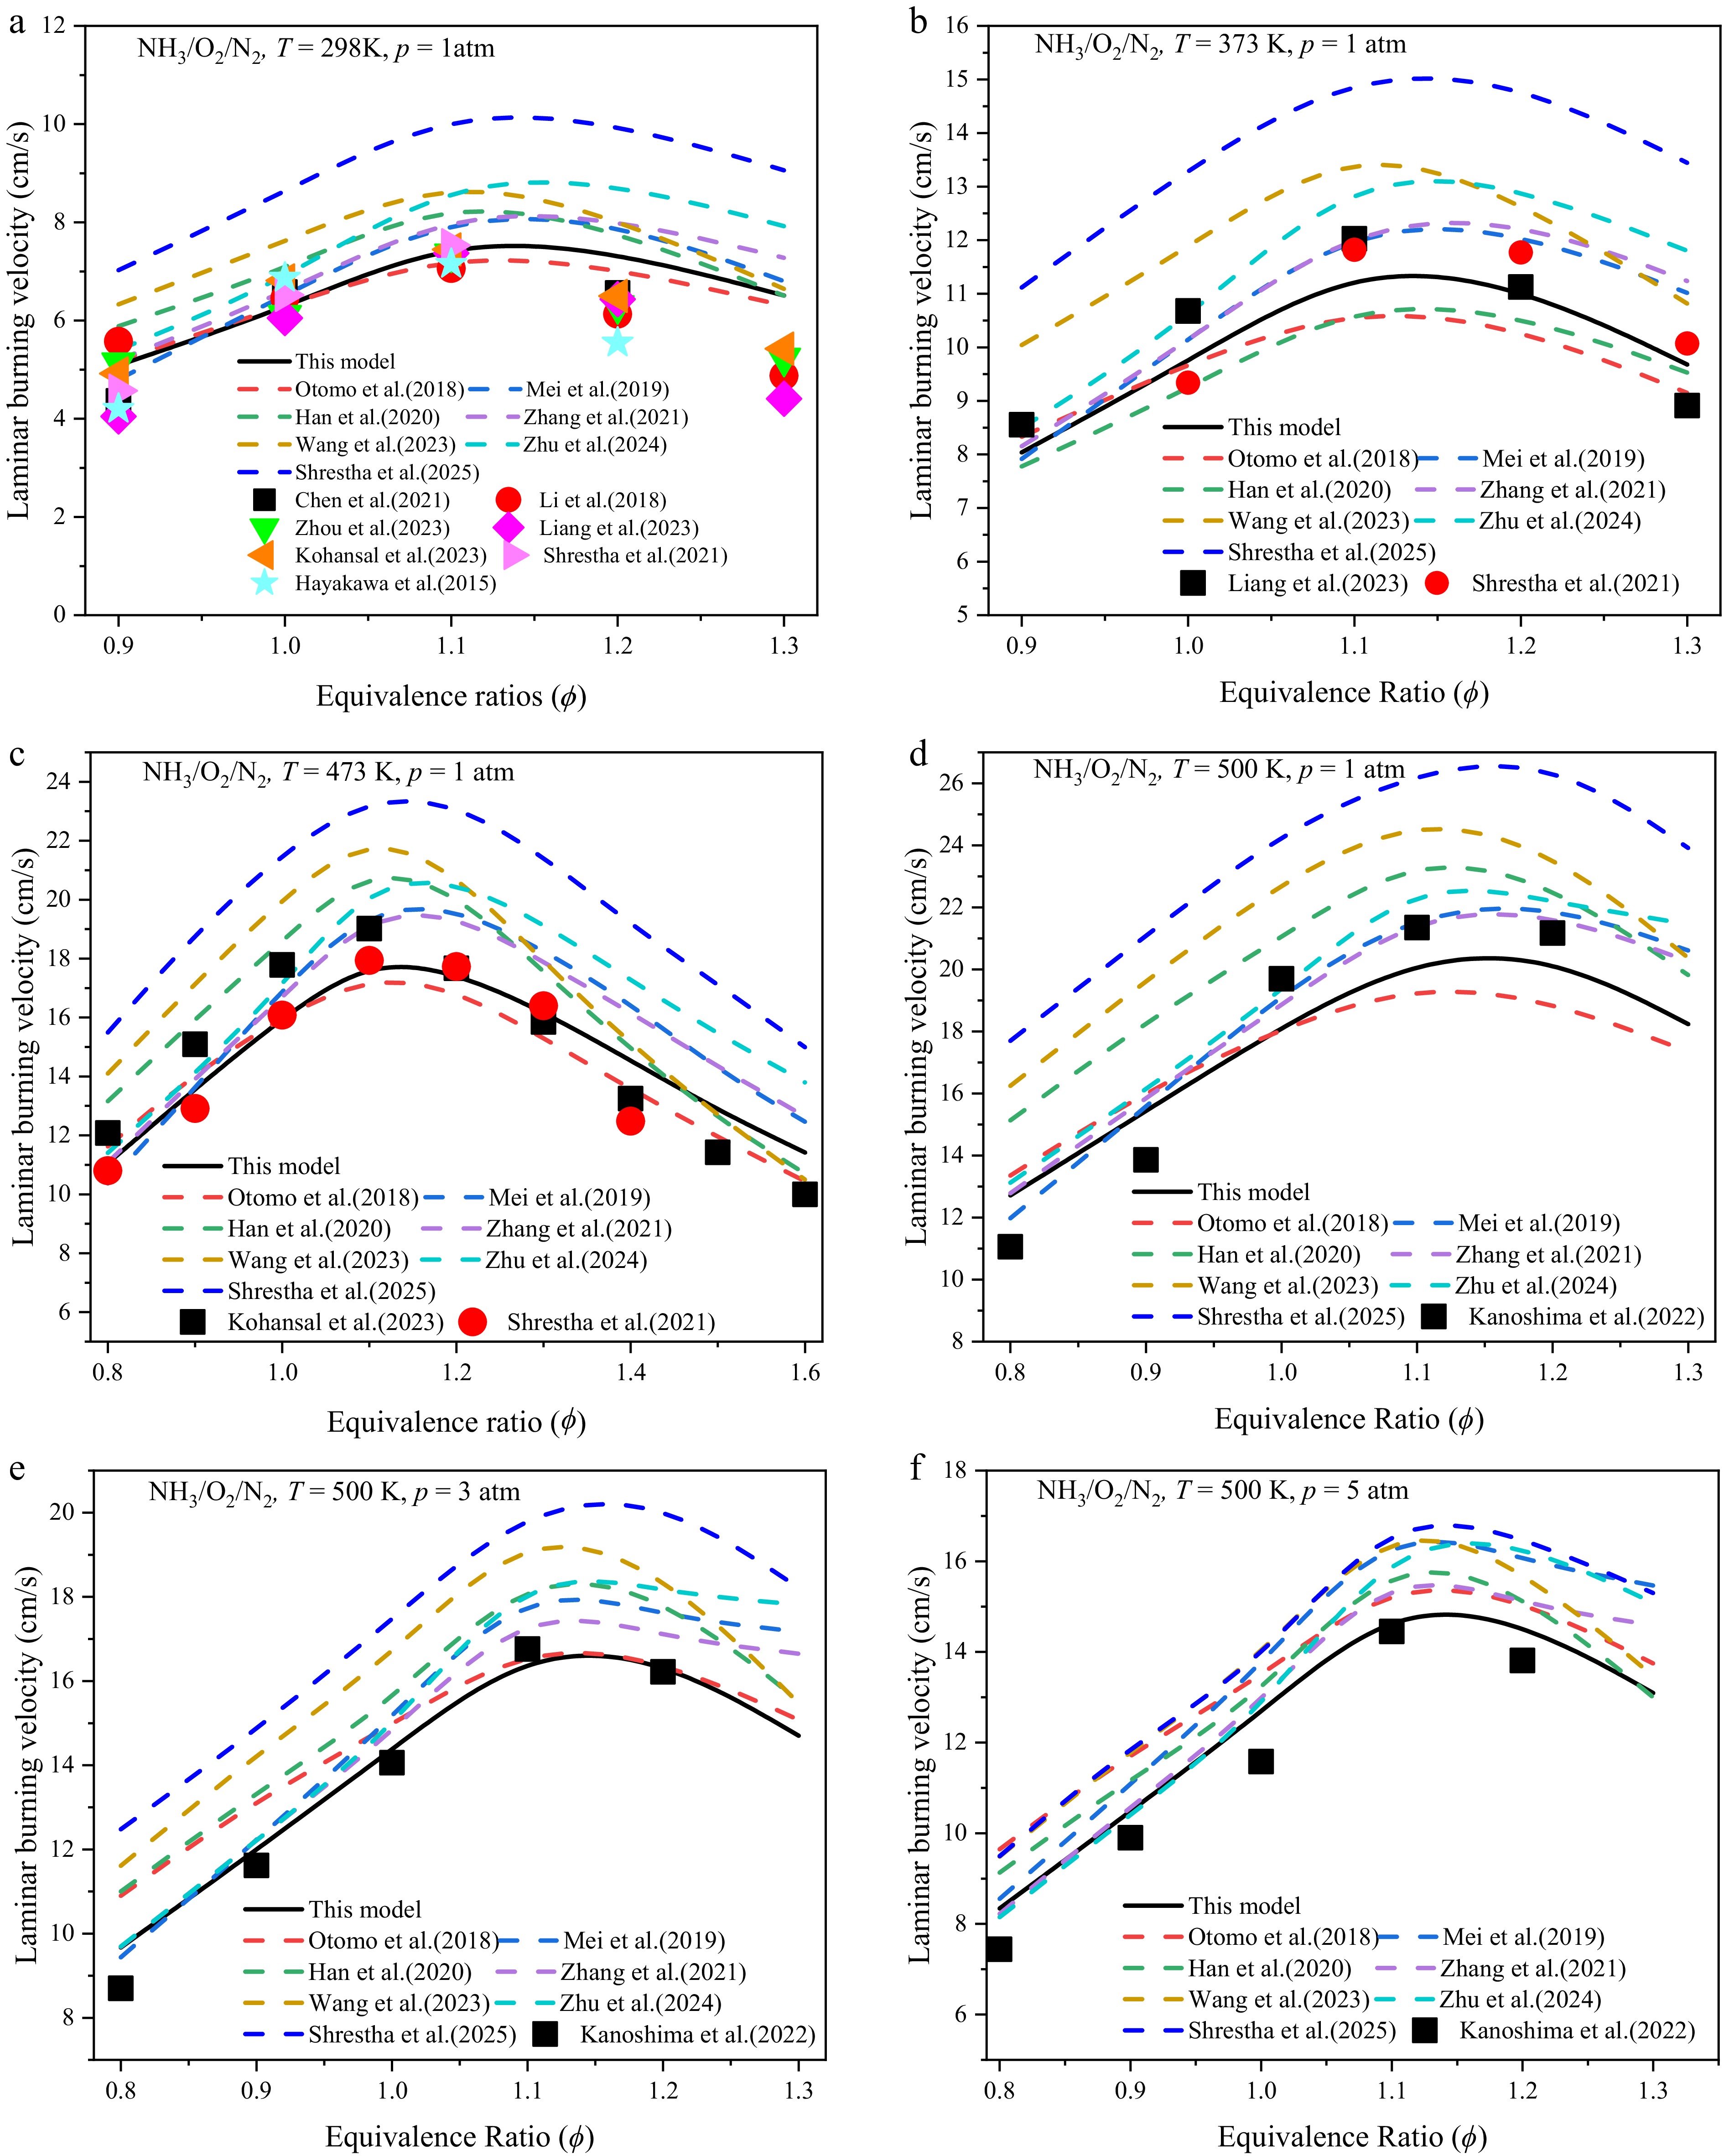
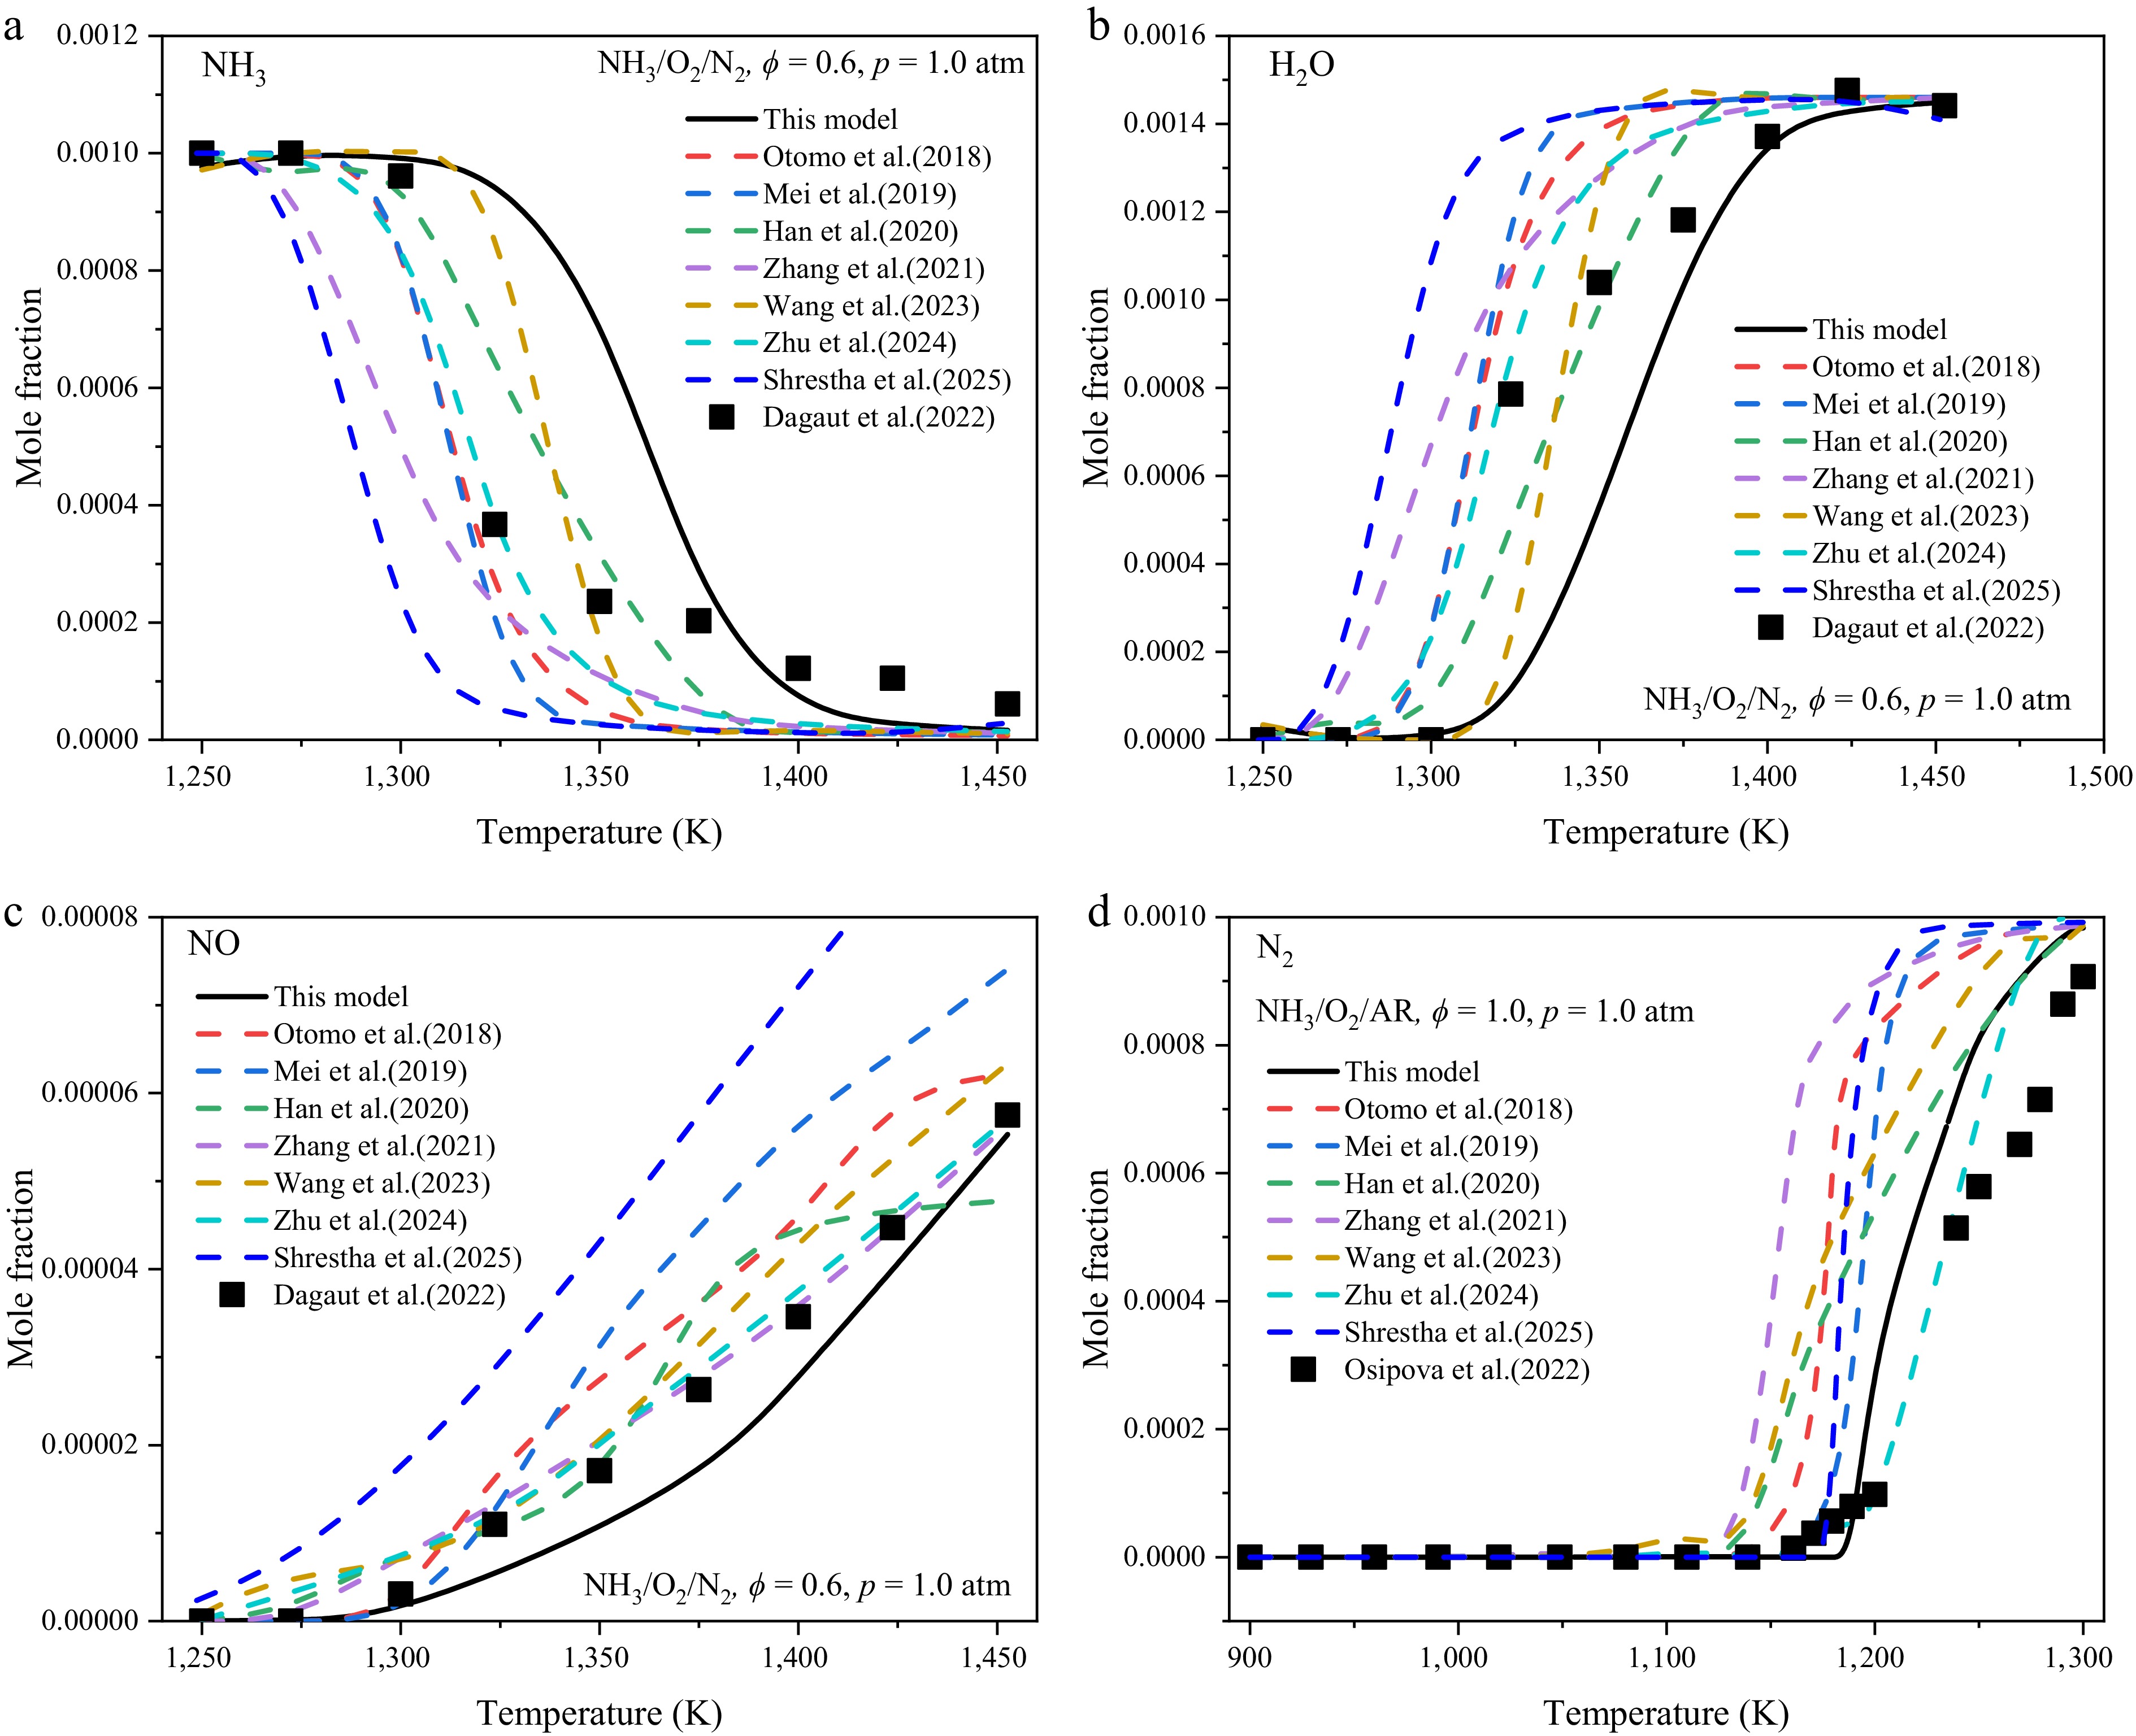
Figure 8.
Comparative verification of laminar burning velocity. (The line is the prediction result of this model and the other seven models, and the points are experimental data, from Hayakawa et al.[11], Chen et al.[12], Shrestha et al.[13], Kanshina et al.[14], Liang et al.[15], Zhou et al.[17], Kohansal et al.[18], and Li et al.[58]).
-
-
-
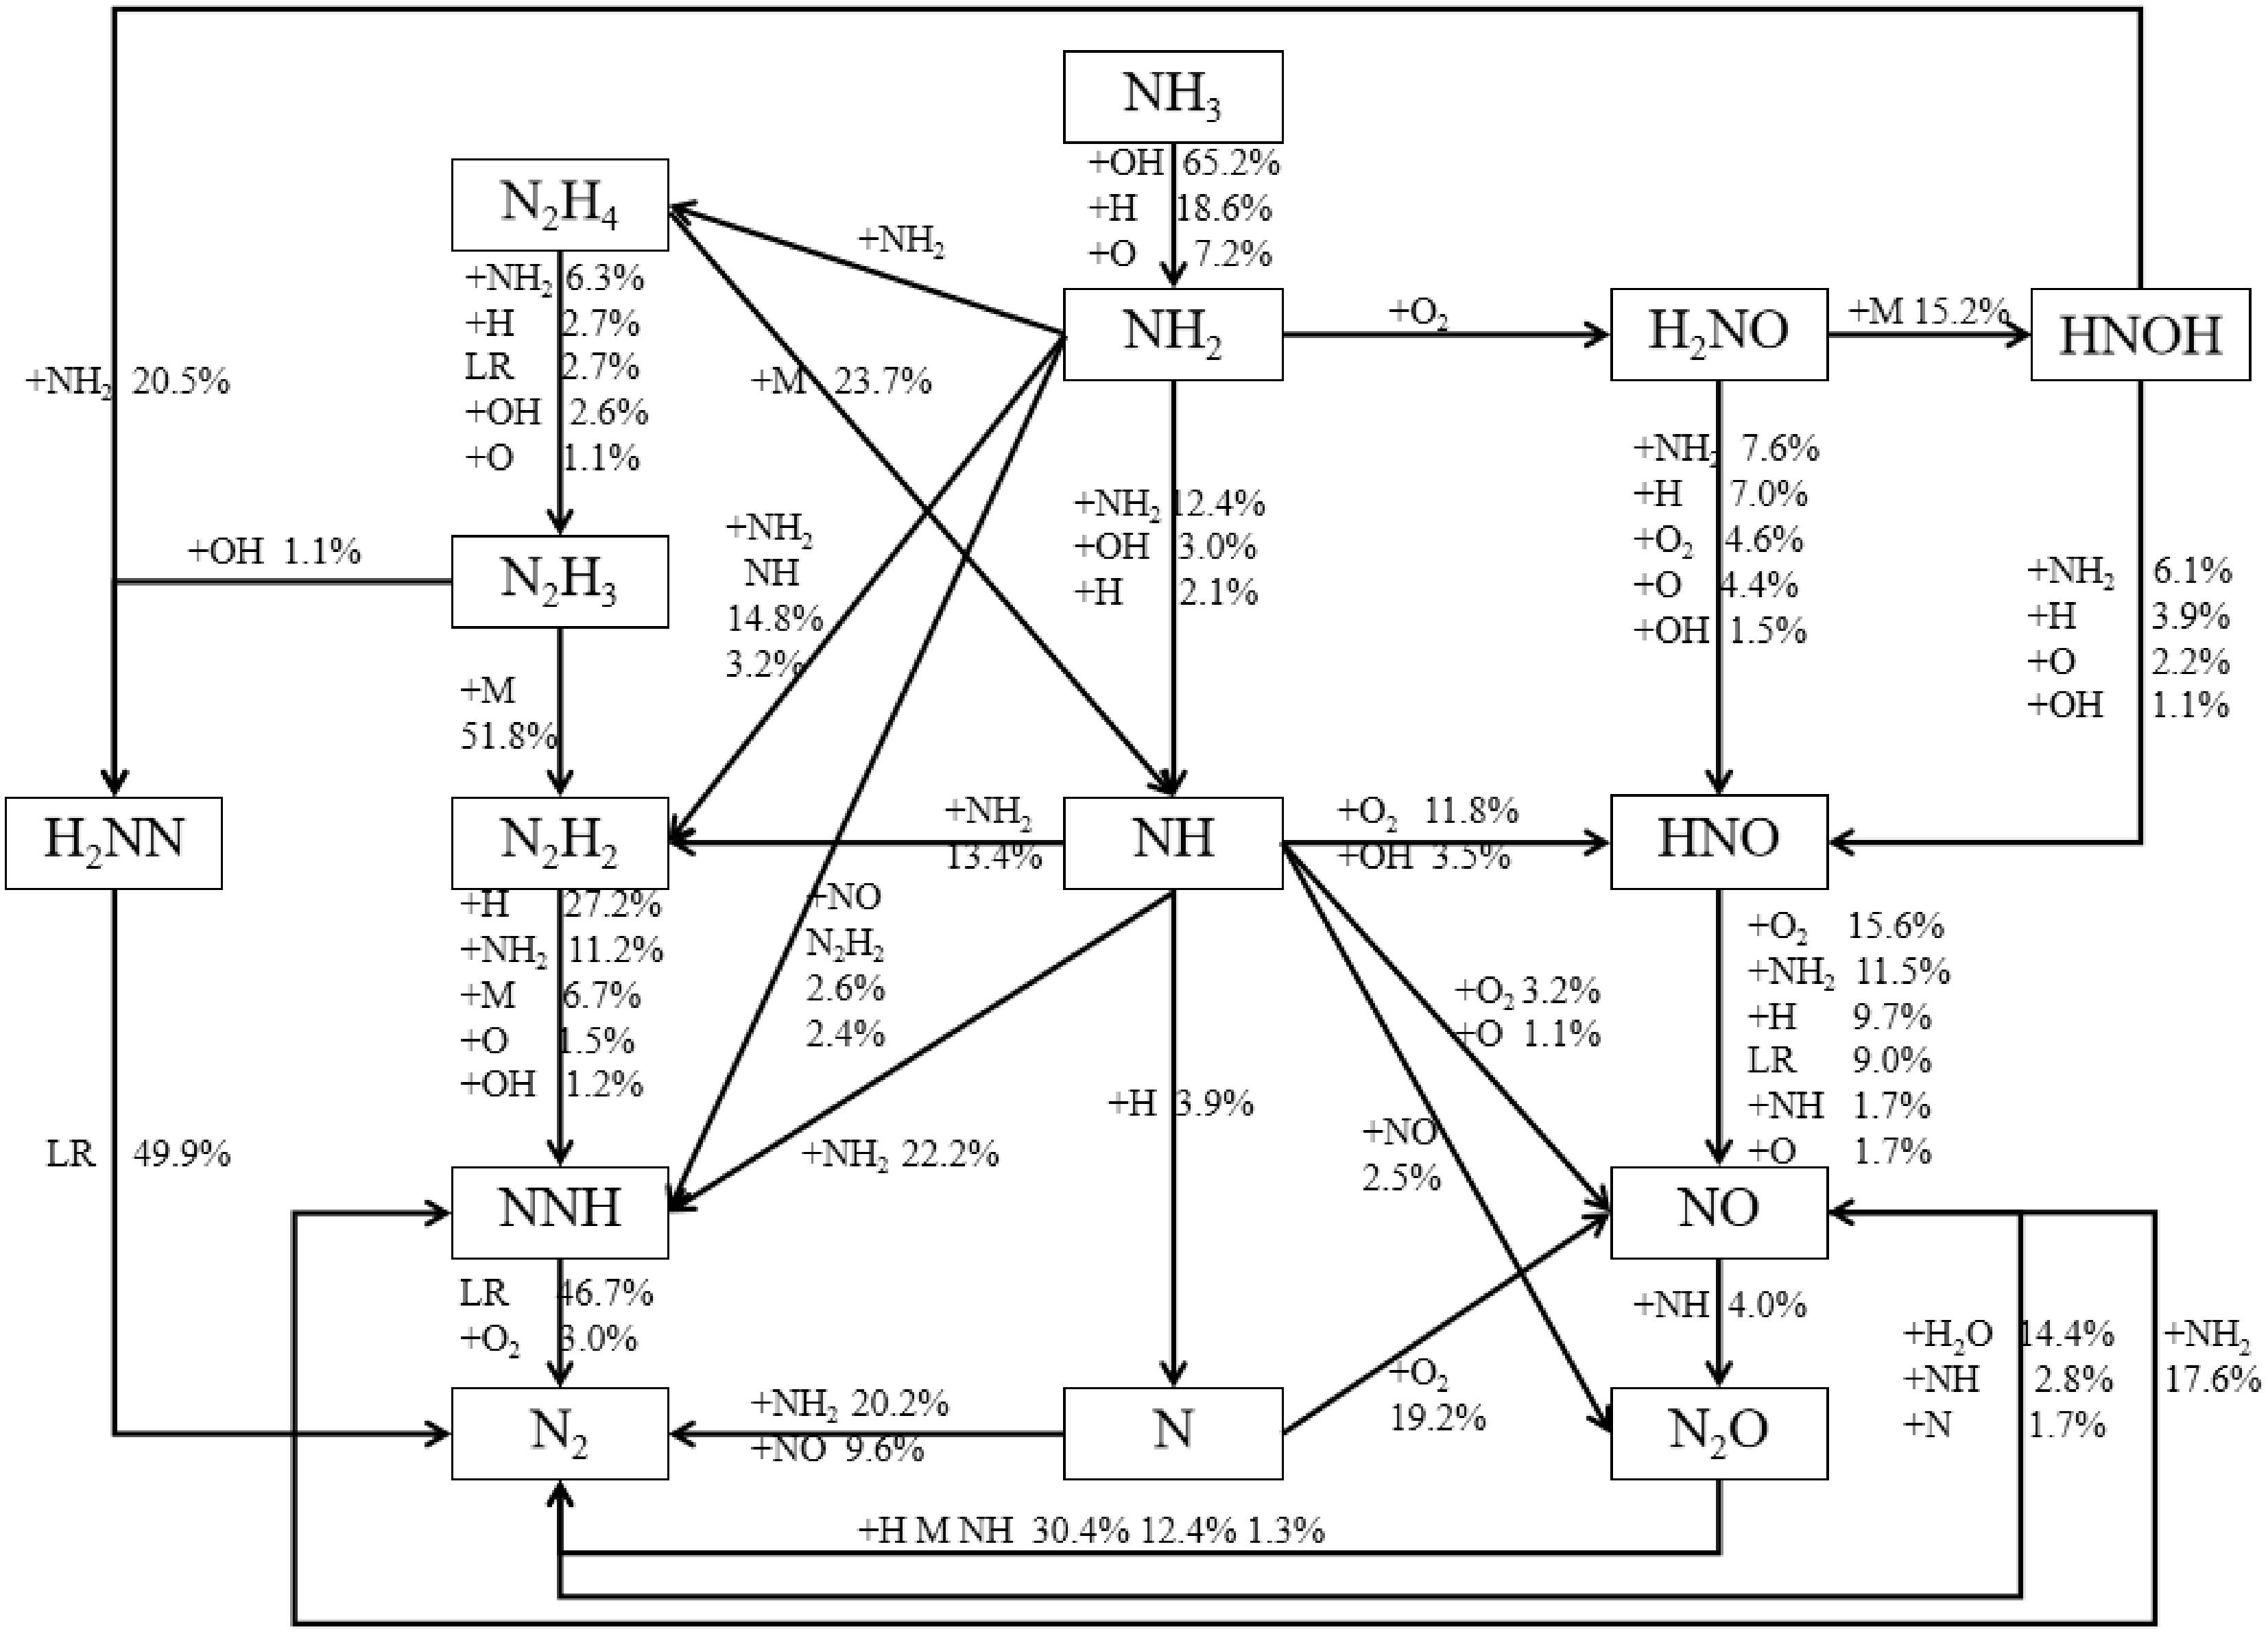
Figure 11.
The main reaction path of the ammonia combustion process.
-
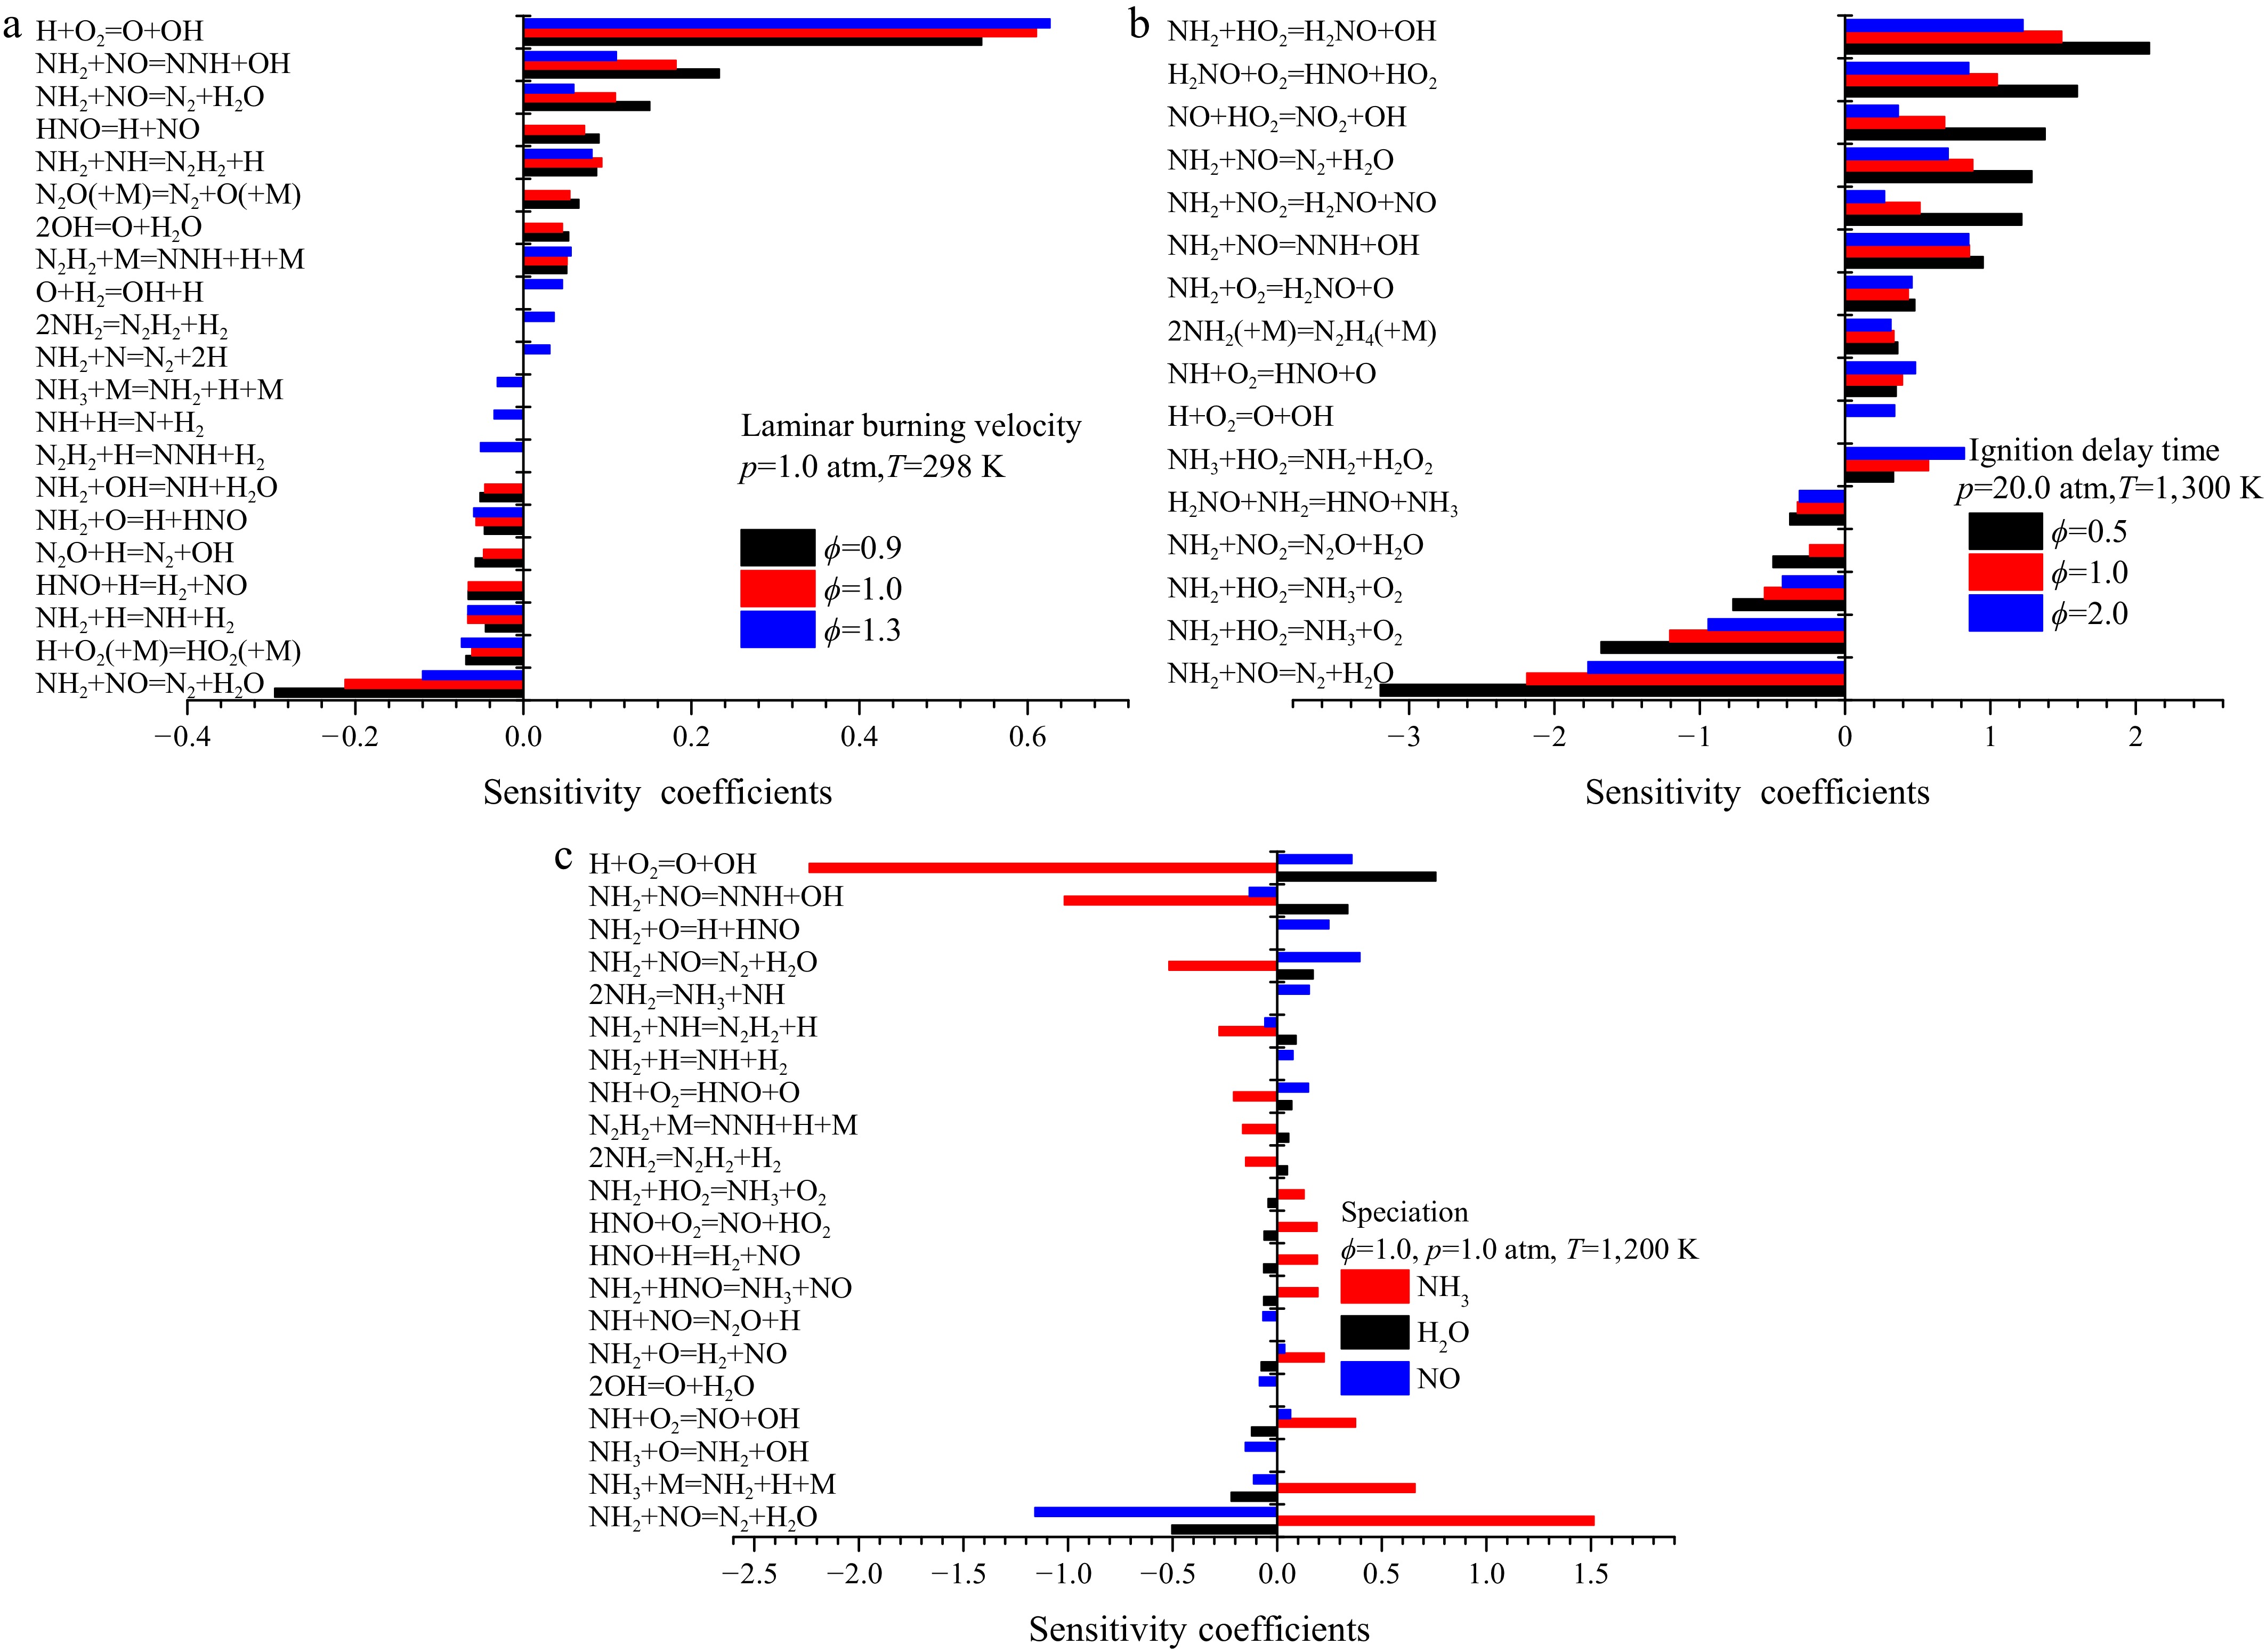
Figure 12.
Sensitivity analysis of laminar burning velocity, ignition delay time, and species.
-
Author Year Number of species/reactions Fuel/oxidizer Properties Ref. Mathieu et al. 2015 54/278 NH3/O2/Ar IDT [21] Song et al. 2016 32/204 NH3/O2/N2 SP [31] Otomo et al. 2018 32/213 NH3/H2/Air LBV/IDT [32] Mei et al. 2019 38/265 NH3/O2/N2 LBV/IDT [9] Han et al. 2020 35/174 NH3/H2/Syngas/Air LBV/IDT [2] Zhang et al. 2021 38/263 NH3/H2/Air SP [33] Bertolino et al. 2021 38/264 NH3/Air LBV/IDT/SP [35] Shrestha et al. 2021 125/1,099 NH3/H2/Air LBV [13] Dagaut et al. 2022 47/257 NH3/NO/Air SP [27] Zhou et al. 2023 169/1,268 NH3/H2 /CO/CH4/Air LBV [17] Wang et al. 2023 35/178 NH3/H2/O2/Air LBV [36] Zhu et al. 2024 43/312 NH3/Air; NH3/H2/Air LBV/IDT/SP [37] Shrestha et al. 2025 285/2,364/38/307 NH3/Methanol/Ethanol/Air/NH3/H2/CO/Air LBV/IDT [34] Table 1.
Typical combustion mechanism of ammonia and ammonia-blended fuels.
-
System Temperature (K) Equivalent ratio Number of molecules Size (nm) NH3 O2 1 3,000 0.5 80 120 22.1029 × 22.1029 × 22.1029 2 3,000 1.0 80 60 18.9575 × 18.9575 × 18.9575 3 3,000 1.5 80 40 17.6354 × 17.6354 × 17.6354 4 2,800 1.0 80 60 18.9575 × 18.9575 × 18.9575 5 3,200 1.0 80 60 18.9575 × 18.9575 × 18.9575 6 3,400 1.0 80 60 18.9575 × 18.9575 × 18.9575 7 3,600 1.0 80 60 18.9575 × 18.9575 × 18.9575 Table 2.
Information about each simulation system.
Figures
(12)
Tables
(2)