-
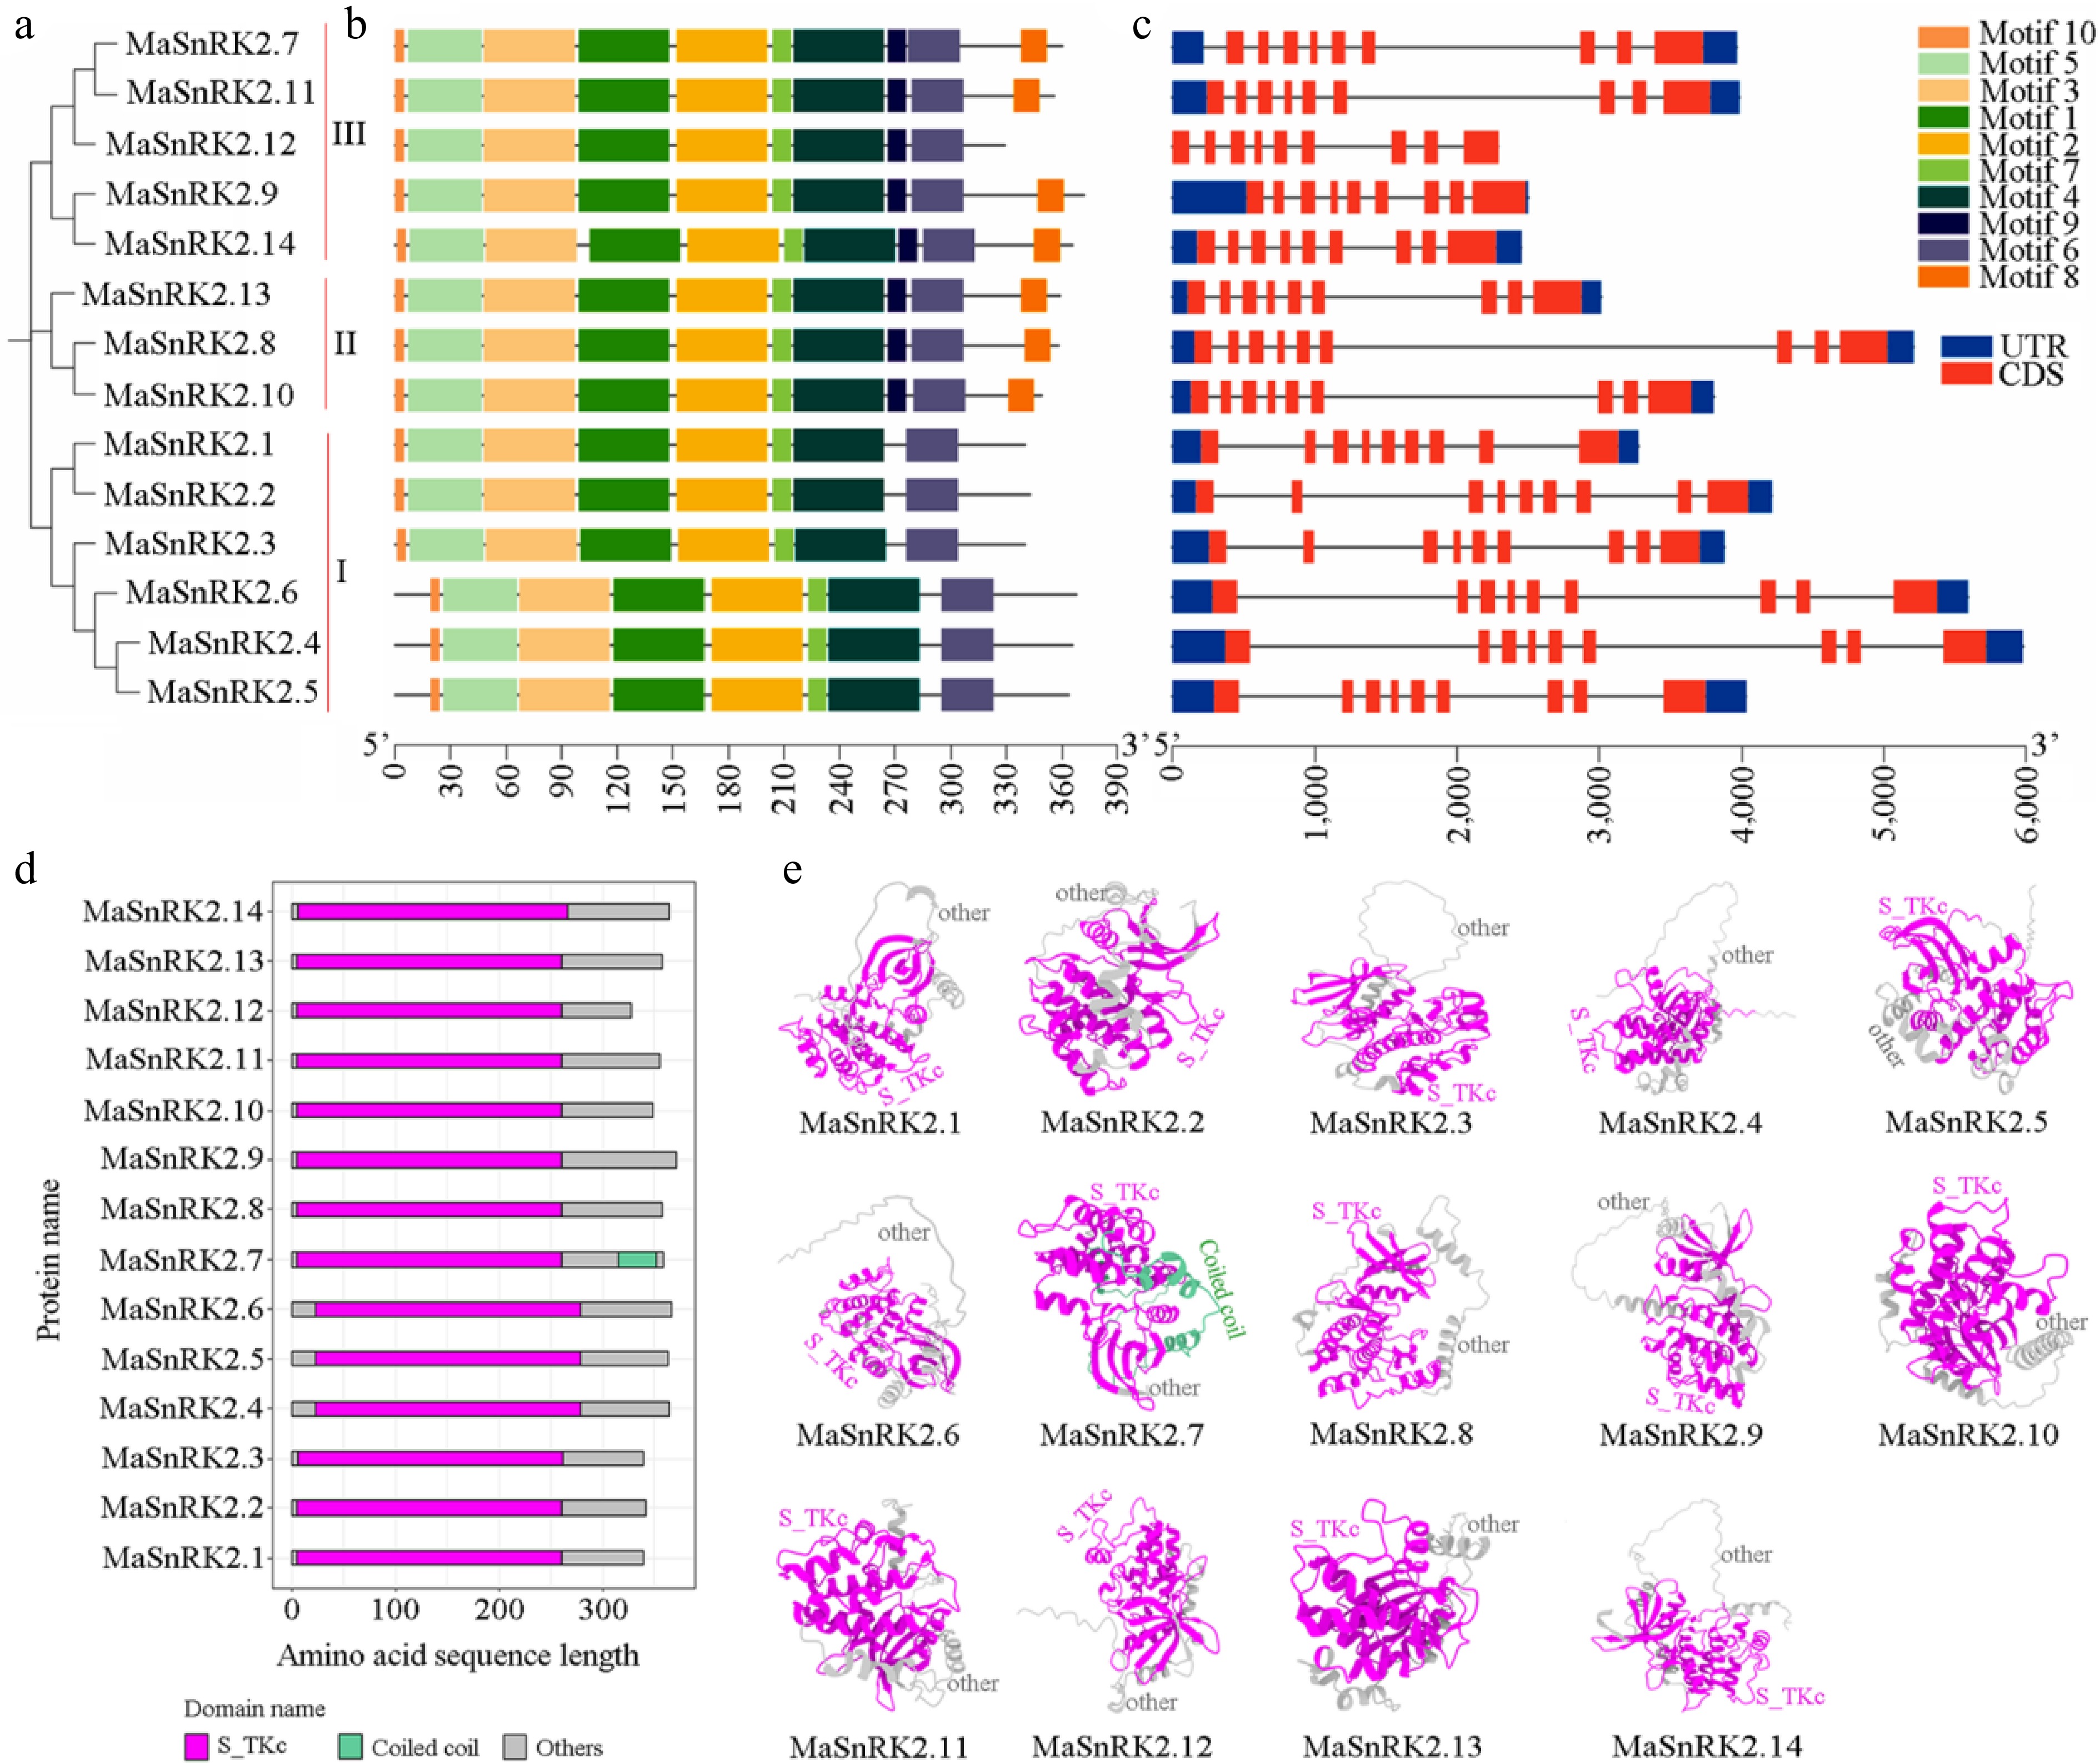
Figure 1.
Bioinformatics analyzes of MaSnRK2 genes family. (a) Phylogenetic evolution of the MaSnRK2 protein family. (b) Motif analysis of the MaSnRK2 gene family. (c) Gene structure analysis of the MaSnRK2 gene family. (d) Protein domain analysis of MaSnRK2 family members. (e) Three-dimensional (3D) structure prediction of MaSnRK2 proteins. Purple represents a conserved serine/threonine protein kinases catalytic domain (S_TKc, cd14662). Green represents a coiled coil domain. Gray represents the other domain.
-
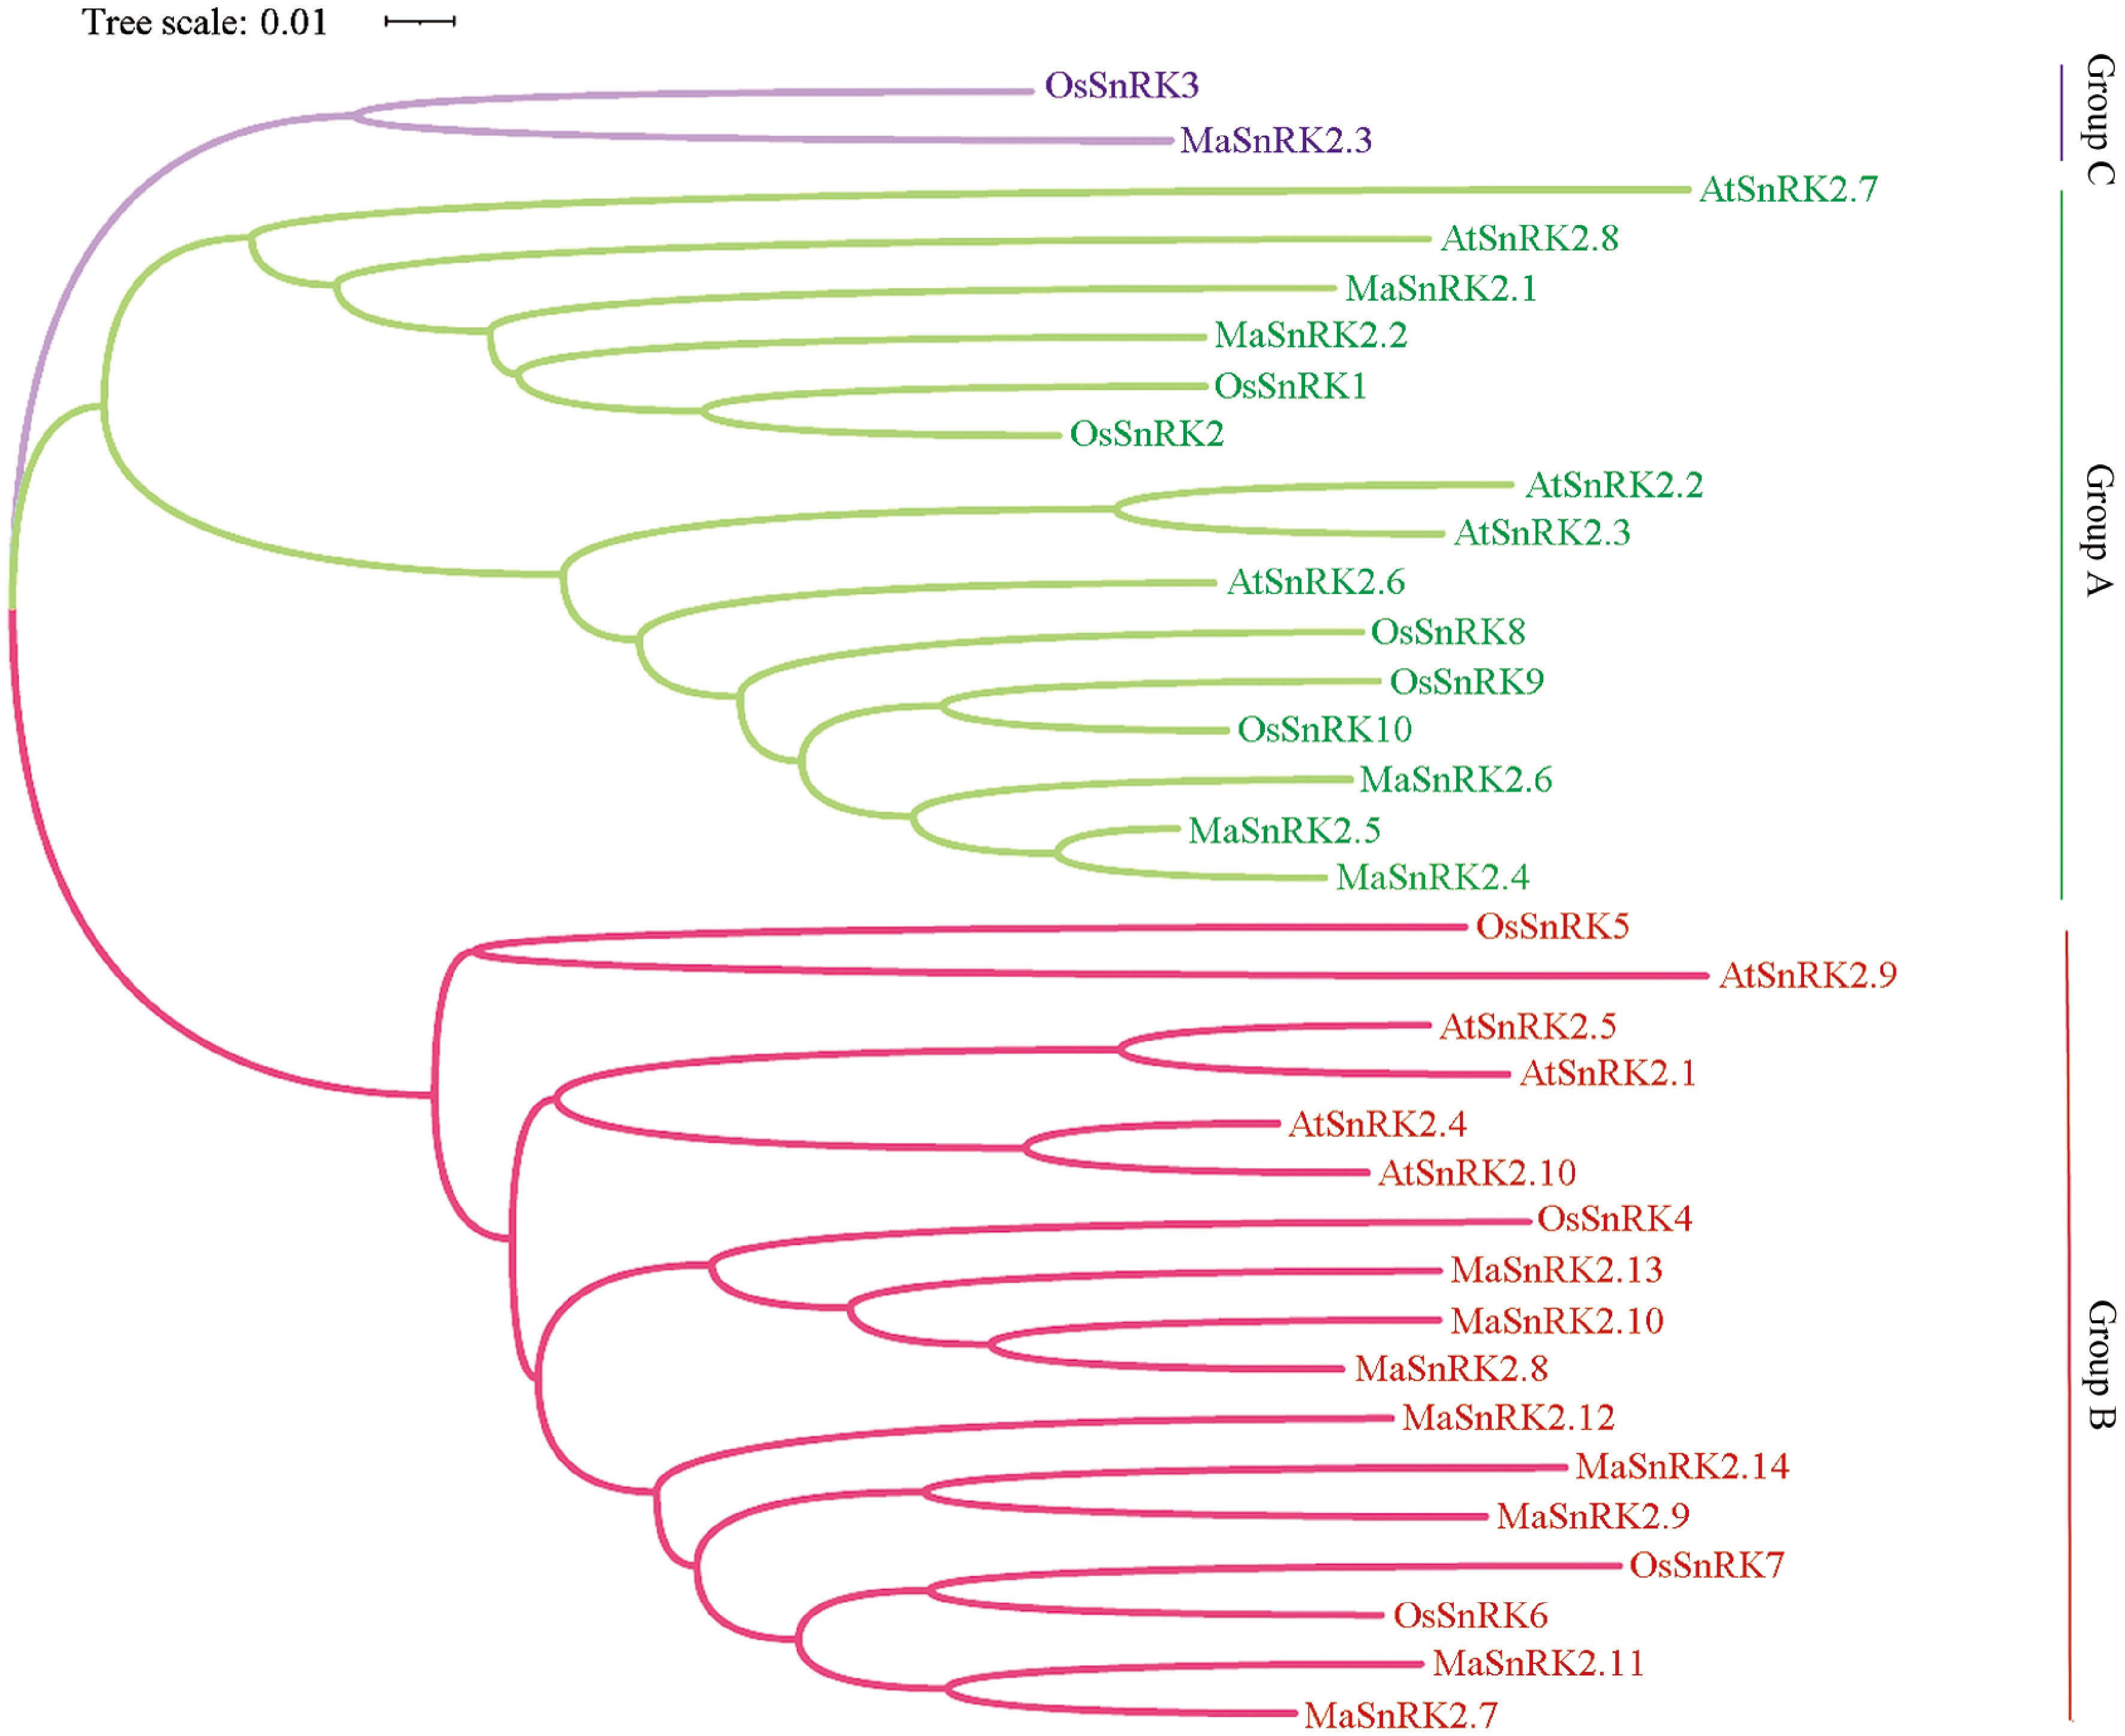
Figure 2.
Phylogenetic, Ka/Ks ratio, and chromosomal distribution of SnRK2 proteins from banana, A. thaliana, and rice species. The phylogenetic tree constructed by MEGA X v.10.1.1 software. (a) The SnRK2s were divided into three groups including group I, II, and III based on banana MaSnRK2s and other plants SnRK2 amino acid sequences. The MaSnRK2s, OsSnRK2s, and AtSnRK2s represent SnRK2s from Musa acuminata, Oryza sativa, and Arabidopsis thaliana, respectively. (b) Boxplot with scatter points of Ka/Ks values by species.
-
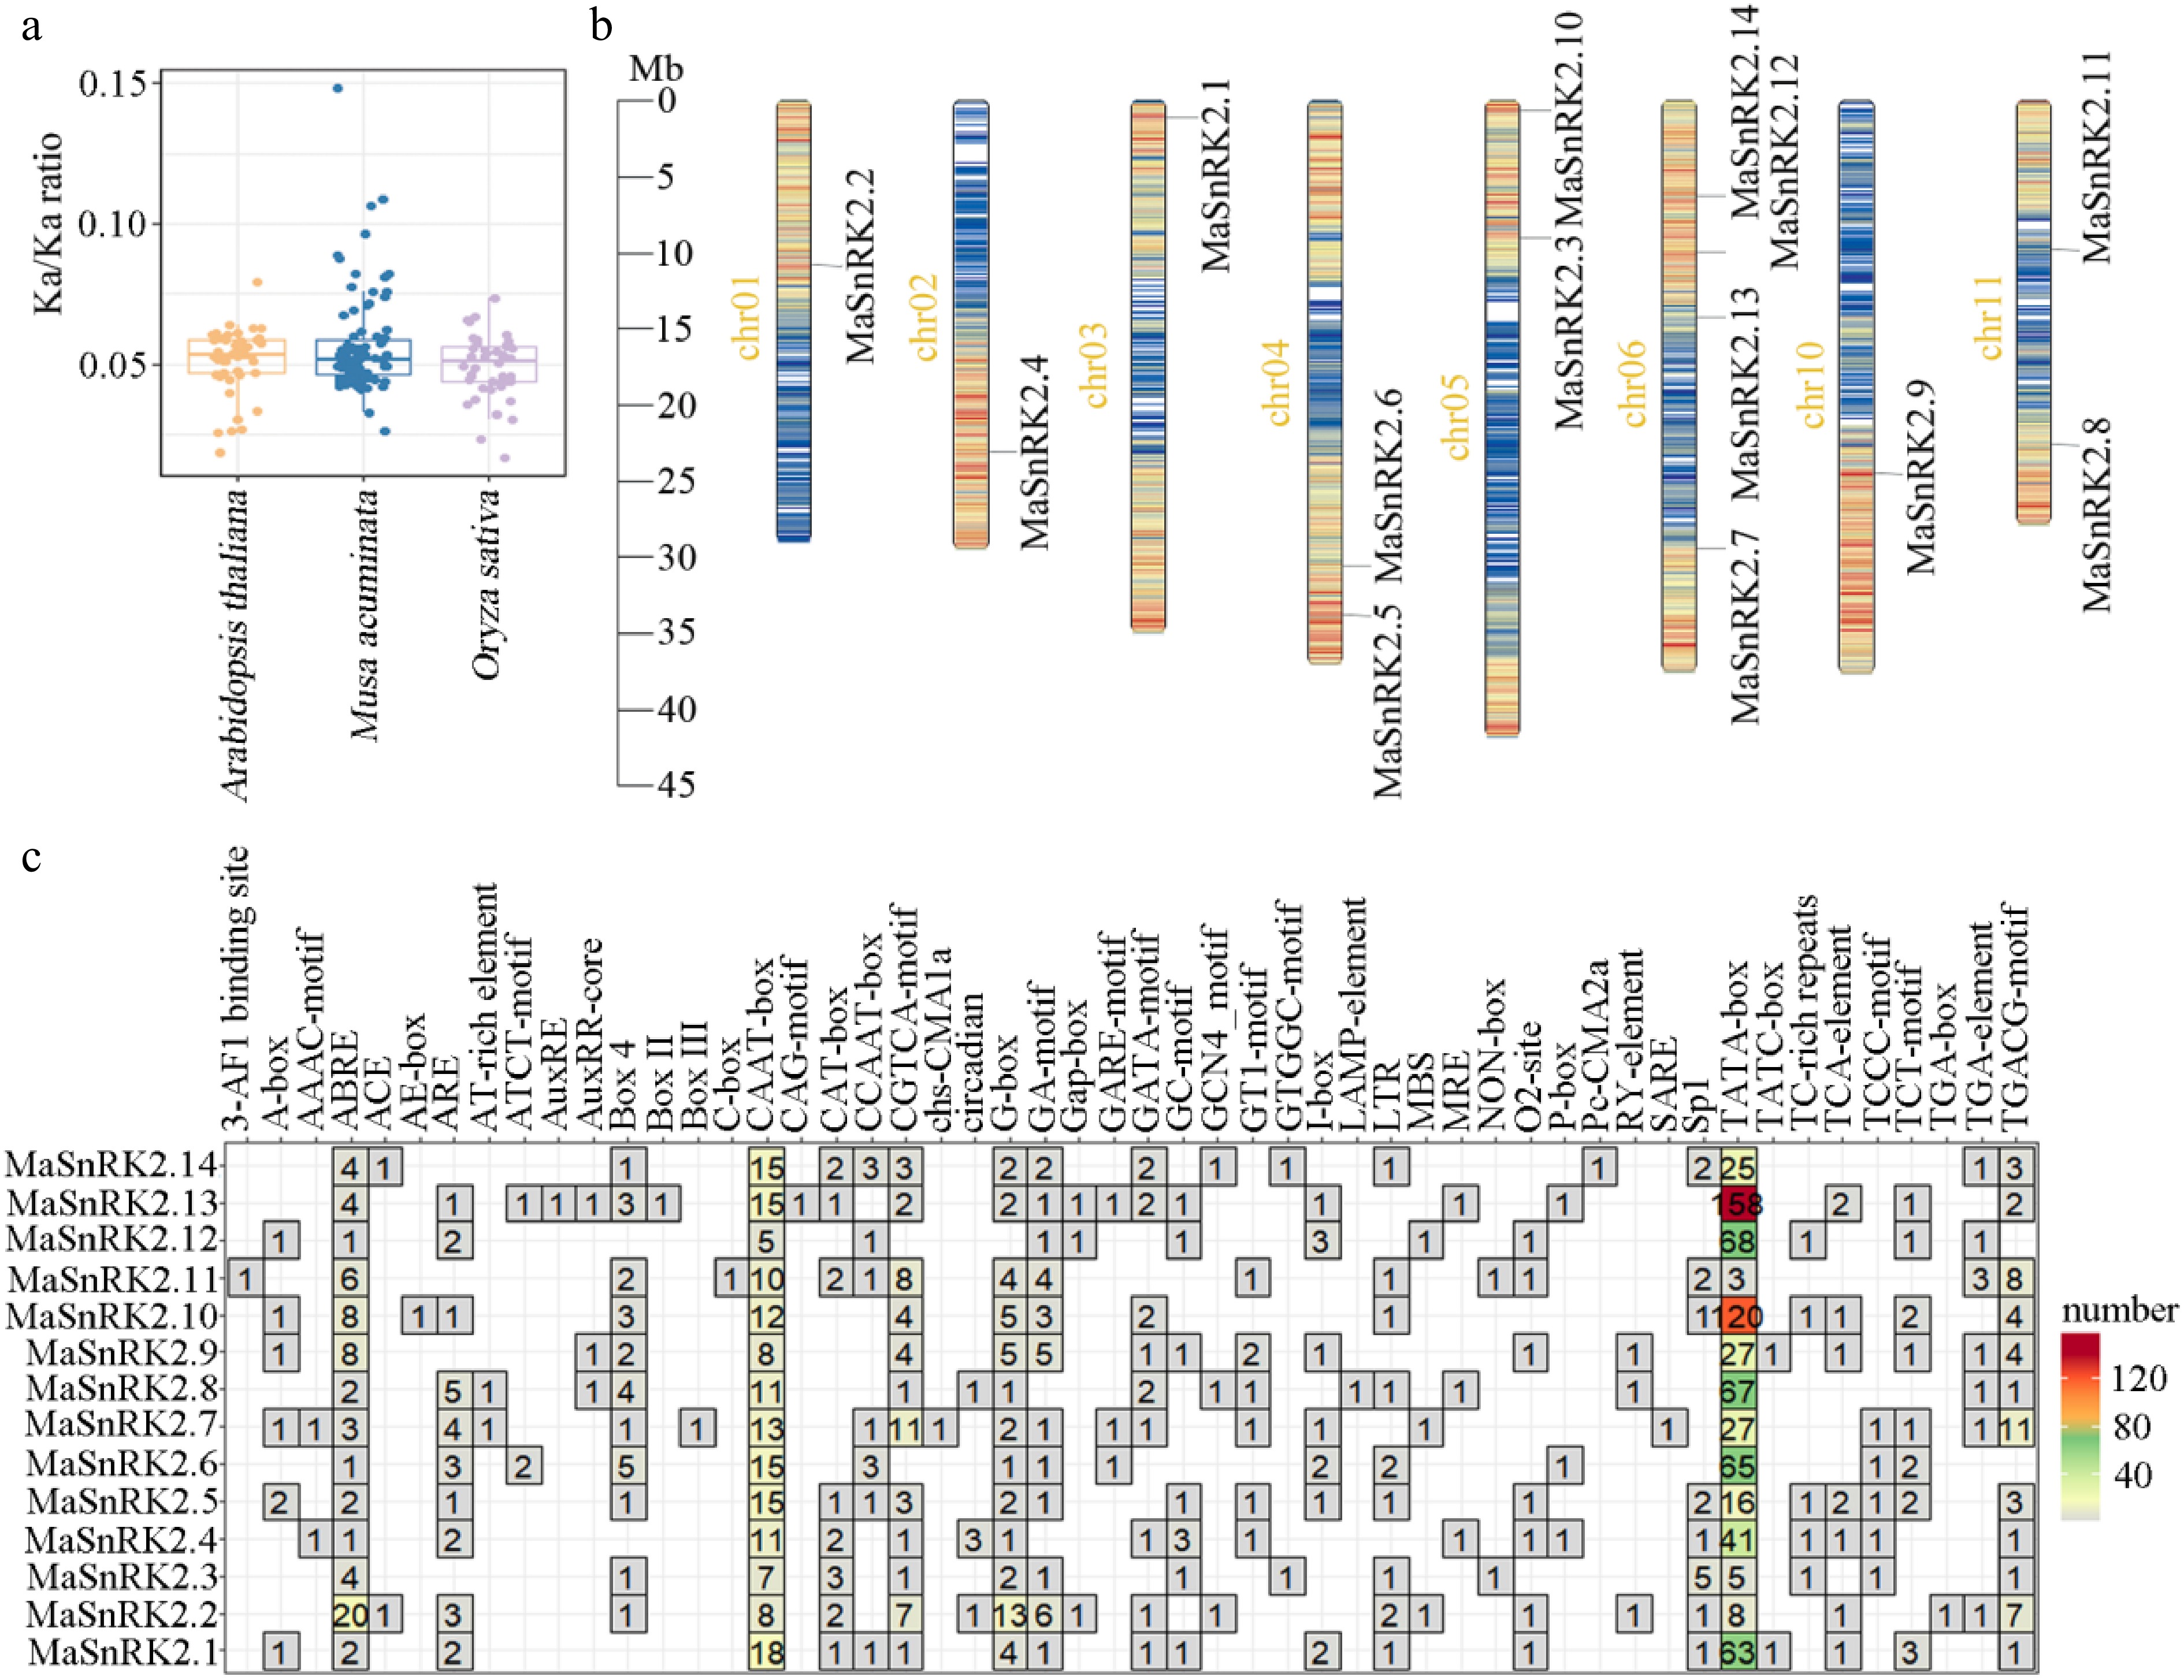
Figure 3.
Cis-acting elements analysis of MaSnRK2 family. (a) Chromosomal localization of 14 MaSnRK2 gene family members. Different colors represent different gene densities on the chromosome. Specifically, green, blue, and orange represent low, medium, and high gene density, respectively. (b) Promoter cis-acting elements of MaSnRK2 genes; the number represents the number of cis-acting elements in each MaSnRK2 promoter.
-
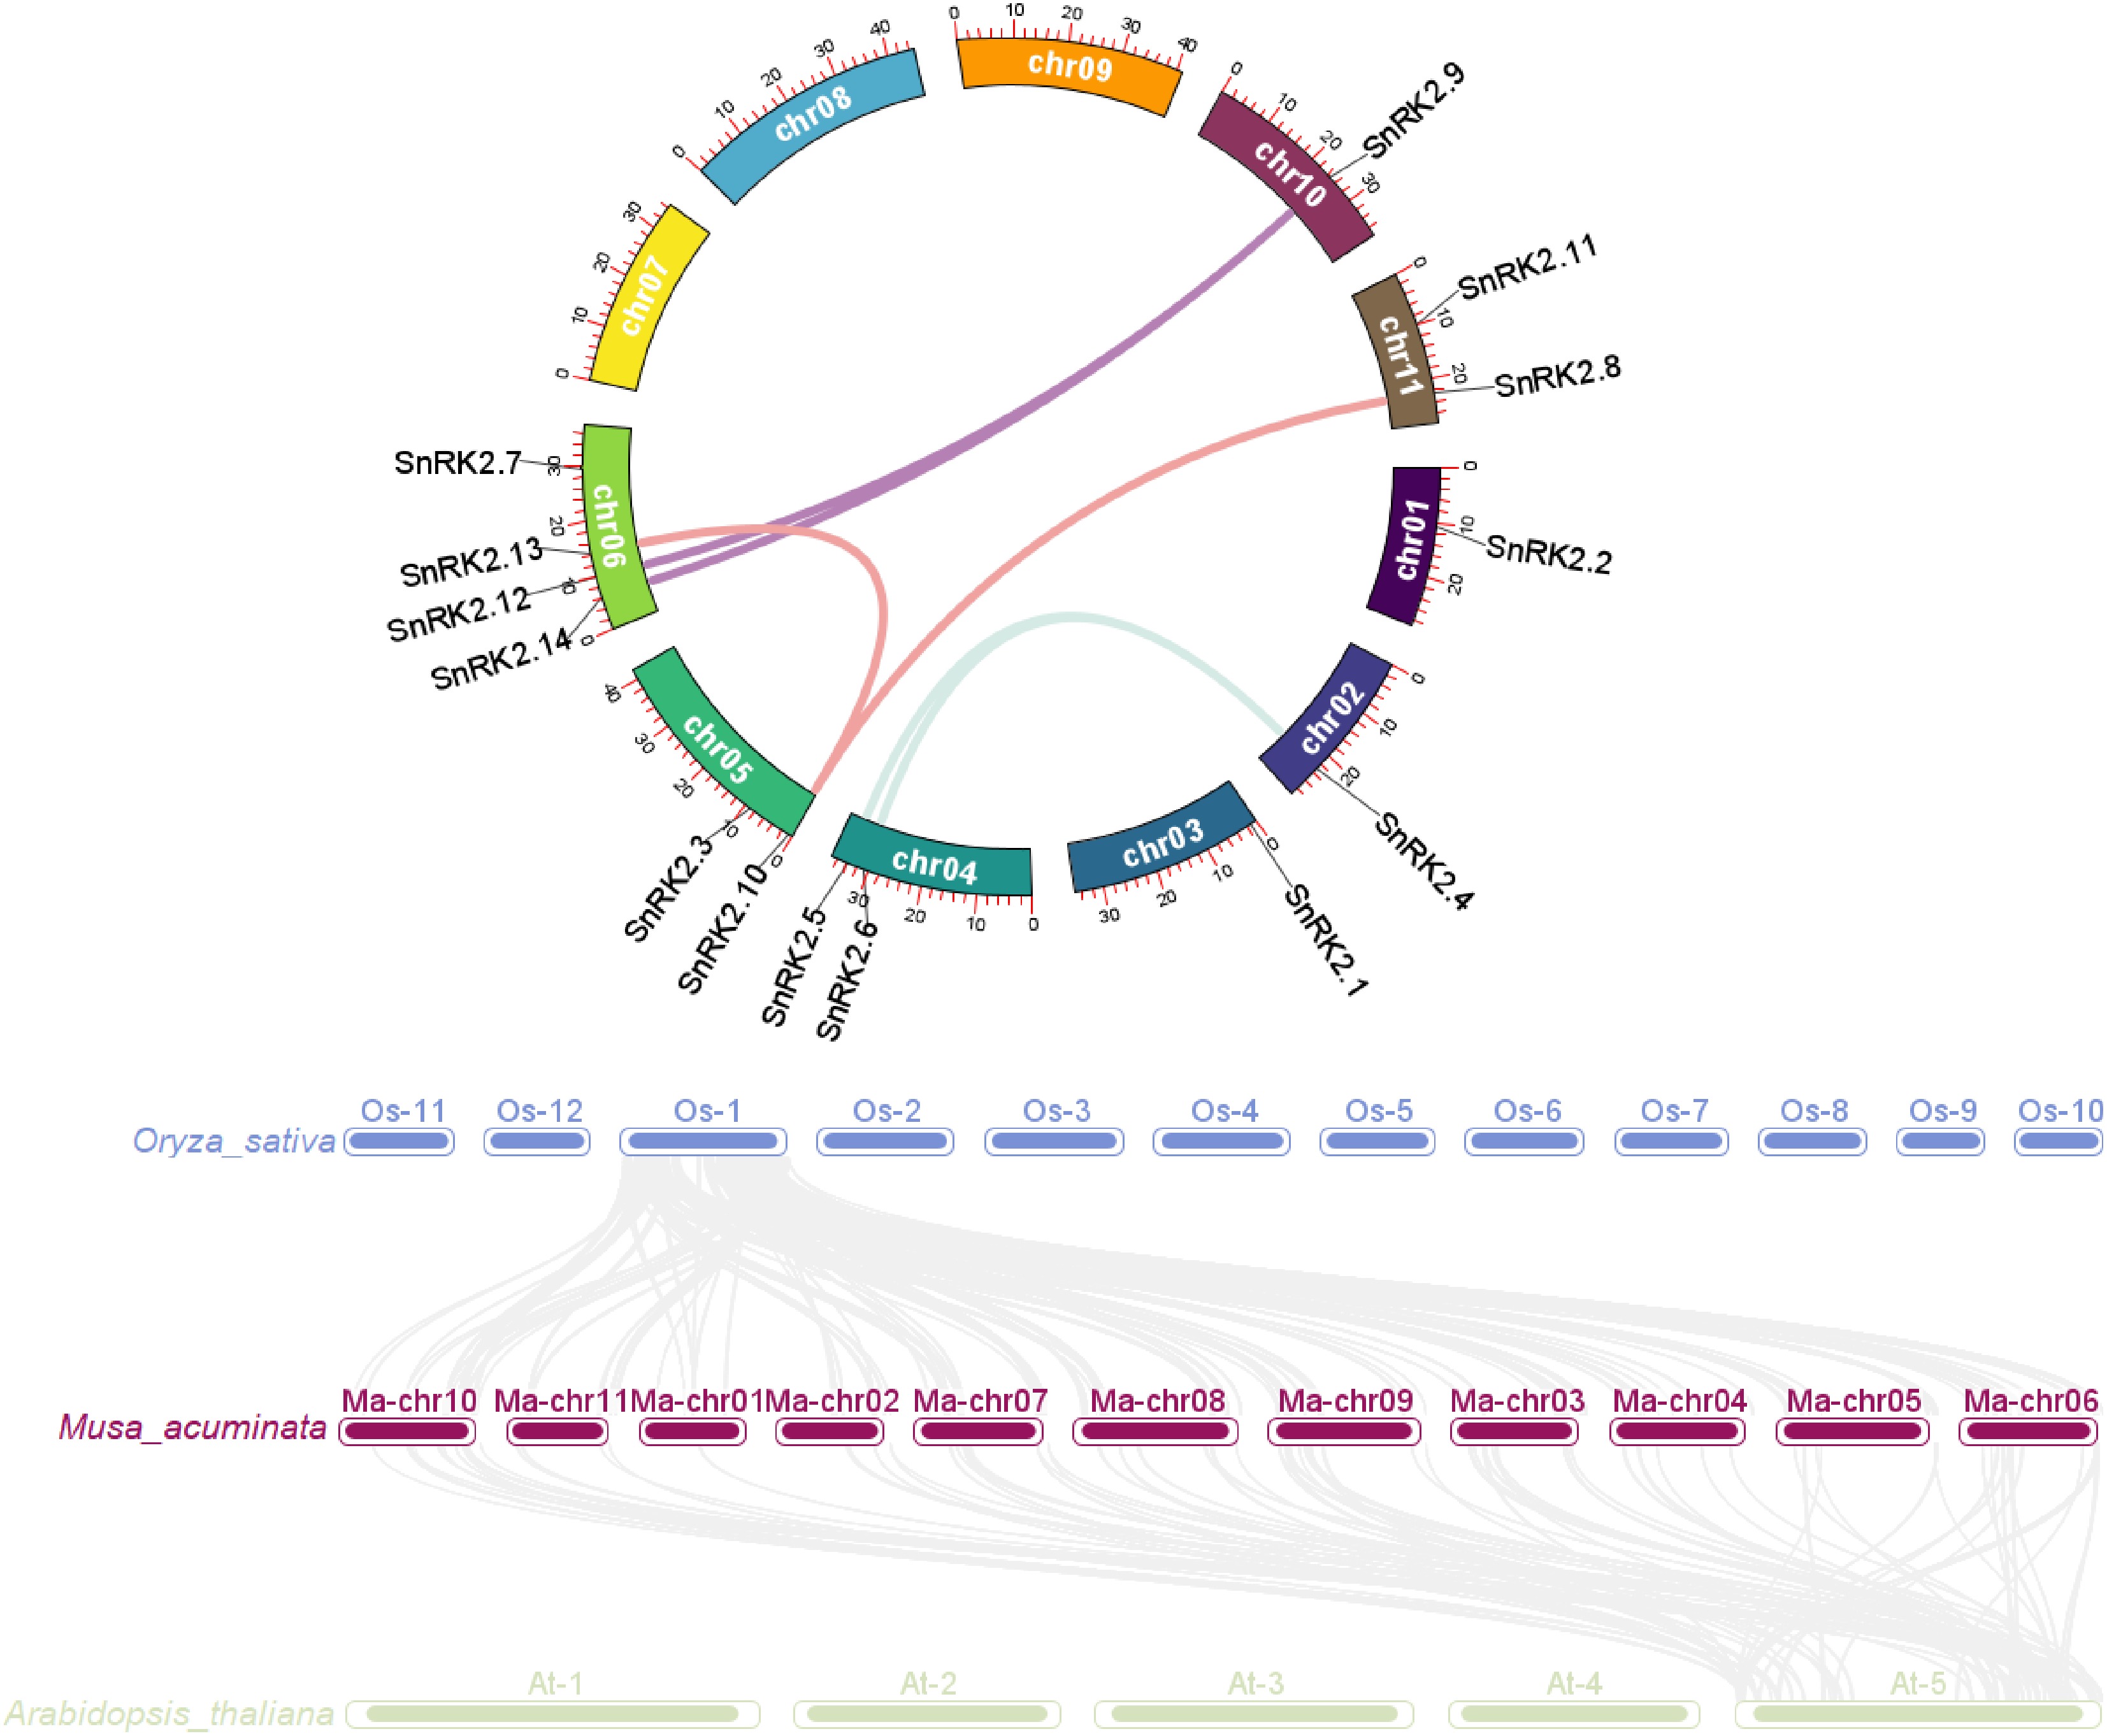
Figure 4.
Intergenomic and intragenomic synteny relationship of the SnRK2 family members among banana (Musa acuminata), Arabidopsis (Arabidopsis thaliana), and rice (Oryza sativa). (a) Intergenomic synteny relationship of the MaSnRK2 members in the banana genome. Green lines indicate intrachromosomal collinearity between MaSnRK2.4 and MaSnRK2.5 or MaSnRK2.6. Red lines indicate intrachromosomal collinearity between MaSnRK2.10 and MaSnRK2.8 or MaSnRK2.13. Purple lines indicated intrachromosomal collinearity between MaSnRK2.9 and MaSnRK2.12 or MaSnRK2.14. (b) Collinear SnRK2 family gene pairs between rice and banana, and between banana and A. thaliana.
-
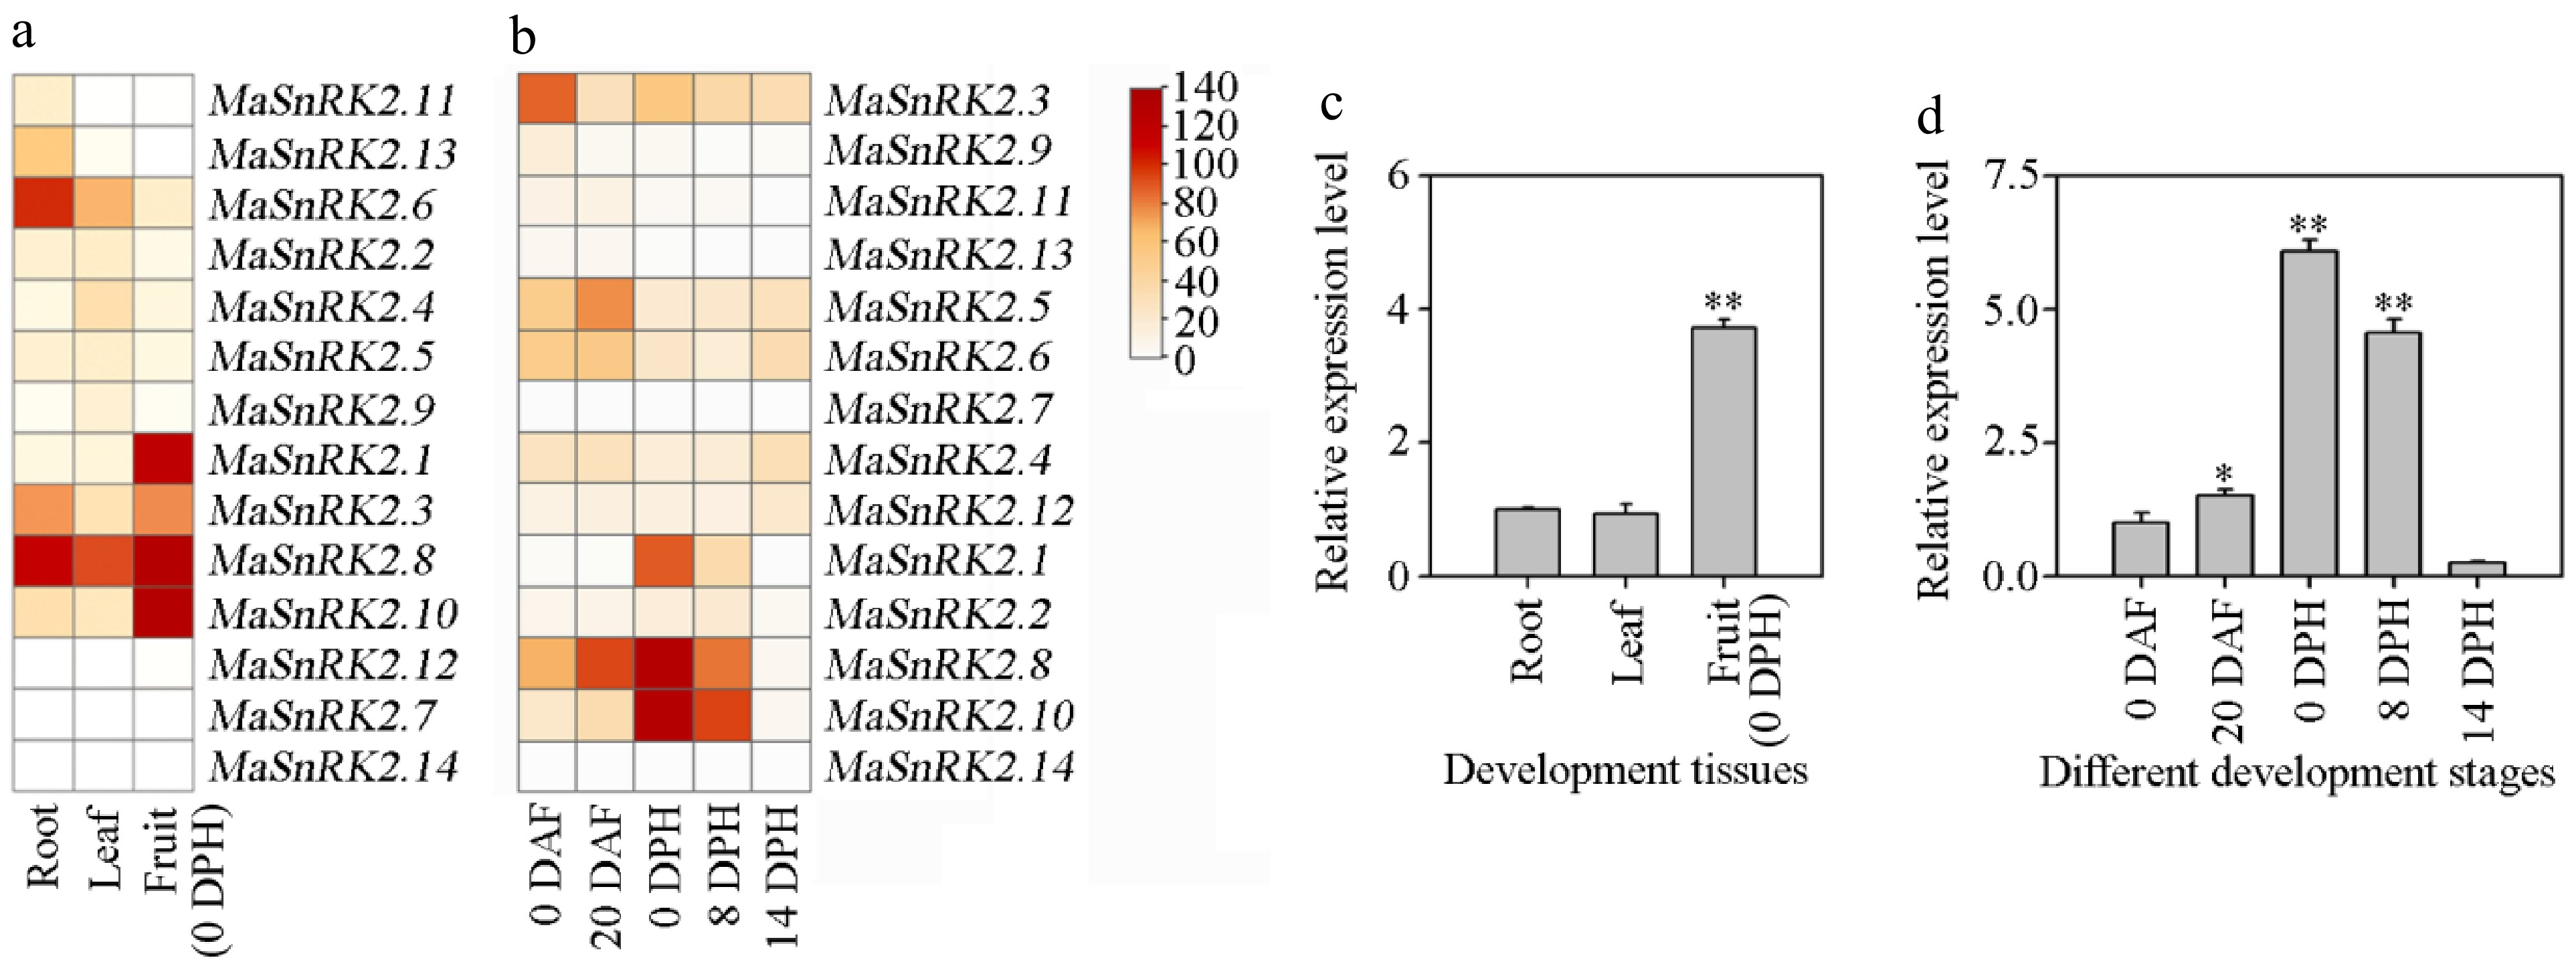
Figure 5.
Expression profiles of MaSnRK2 family genes in the different organs and different developmental stages by banana transcriptome and qRT-PCR. (a), (b) Expression of MaSnRK2s in different organs and during different stages of banana fruit development and ripening. The heat map with clustering was created based on the FPKM value of the MaSnRK2s. Differences in gene expression changes are shown in color in the red-yellow scale. (c) Expression of MaSnRK2.10 in different tissues. (Note: the expression data were detected by real-time fluorescence quantitative PCR [RT-QPCR]). (d) Expression of MaSnRK2.10 at different stages of fruit development and ripening. Data are presented as means ± standard deviations, n = 3 biological replicates.
-
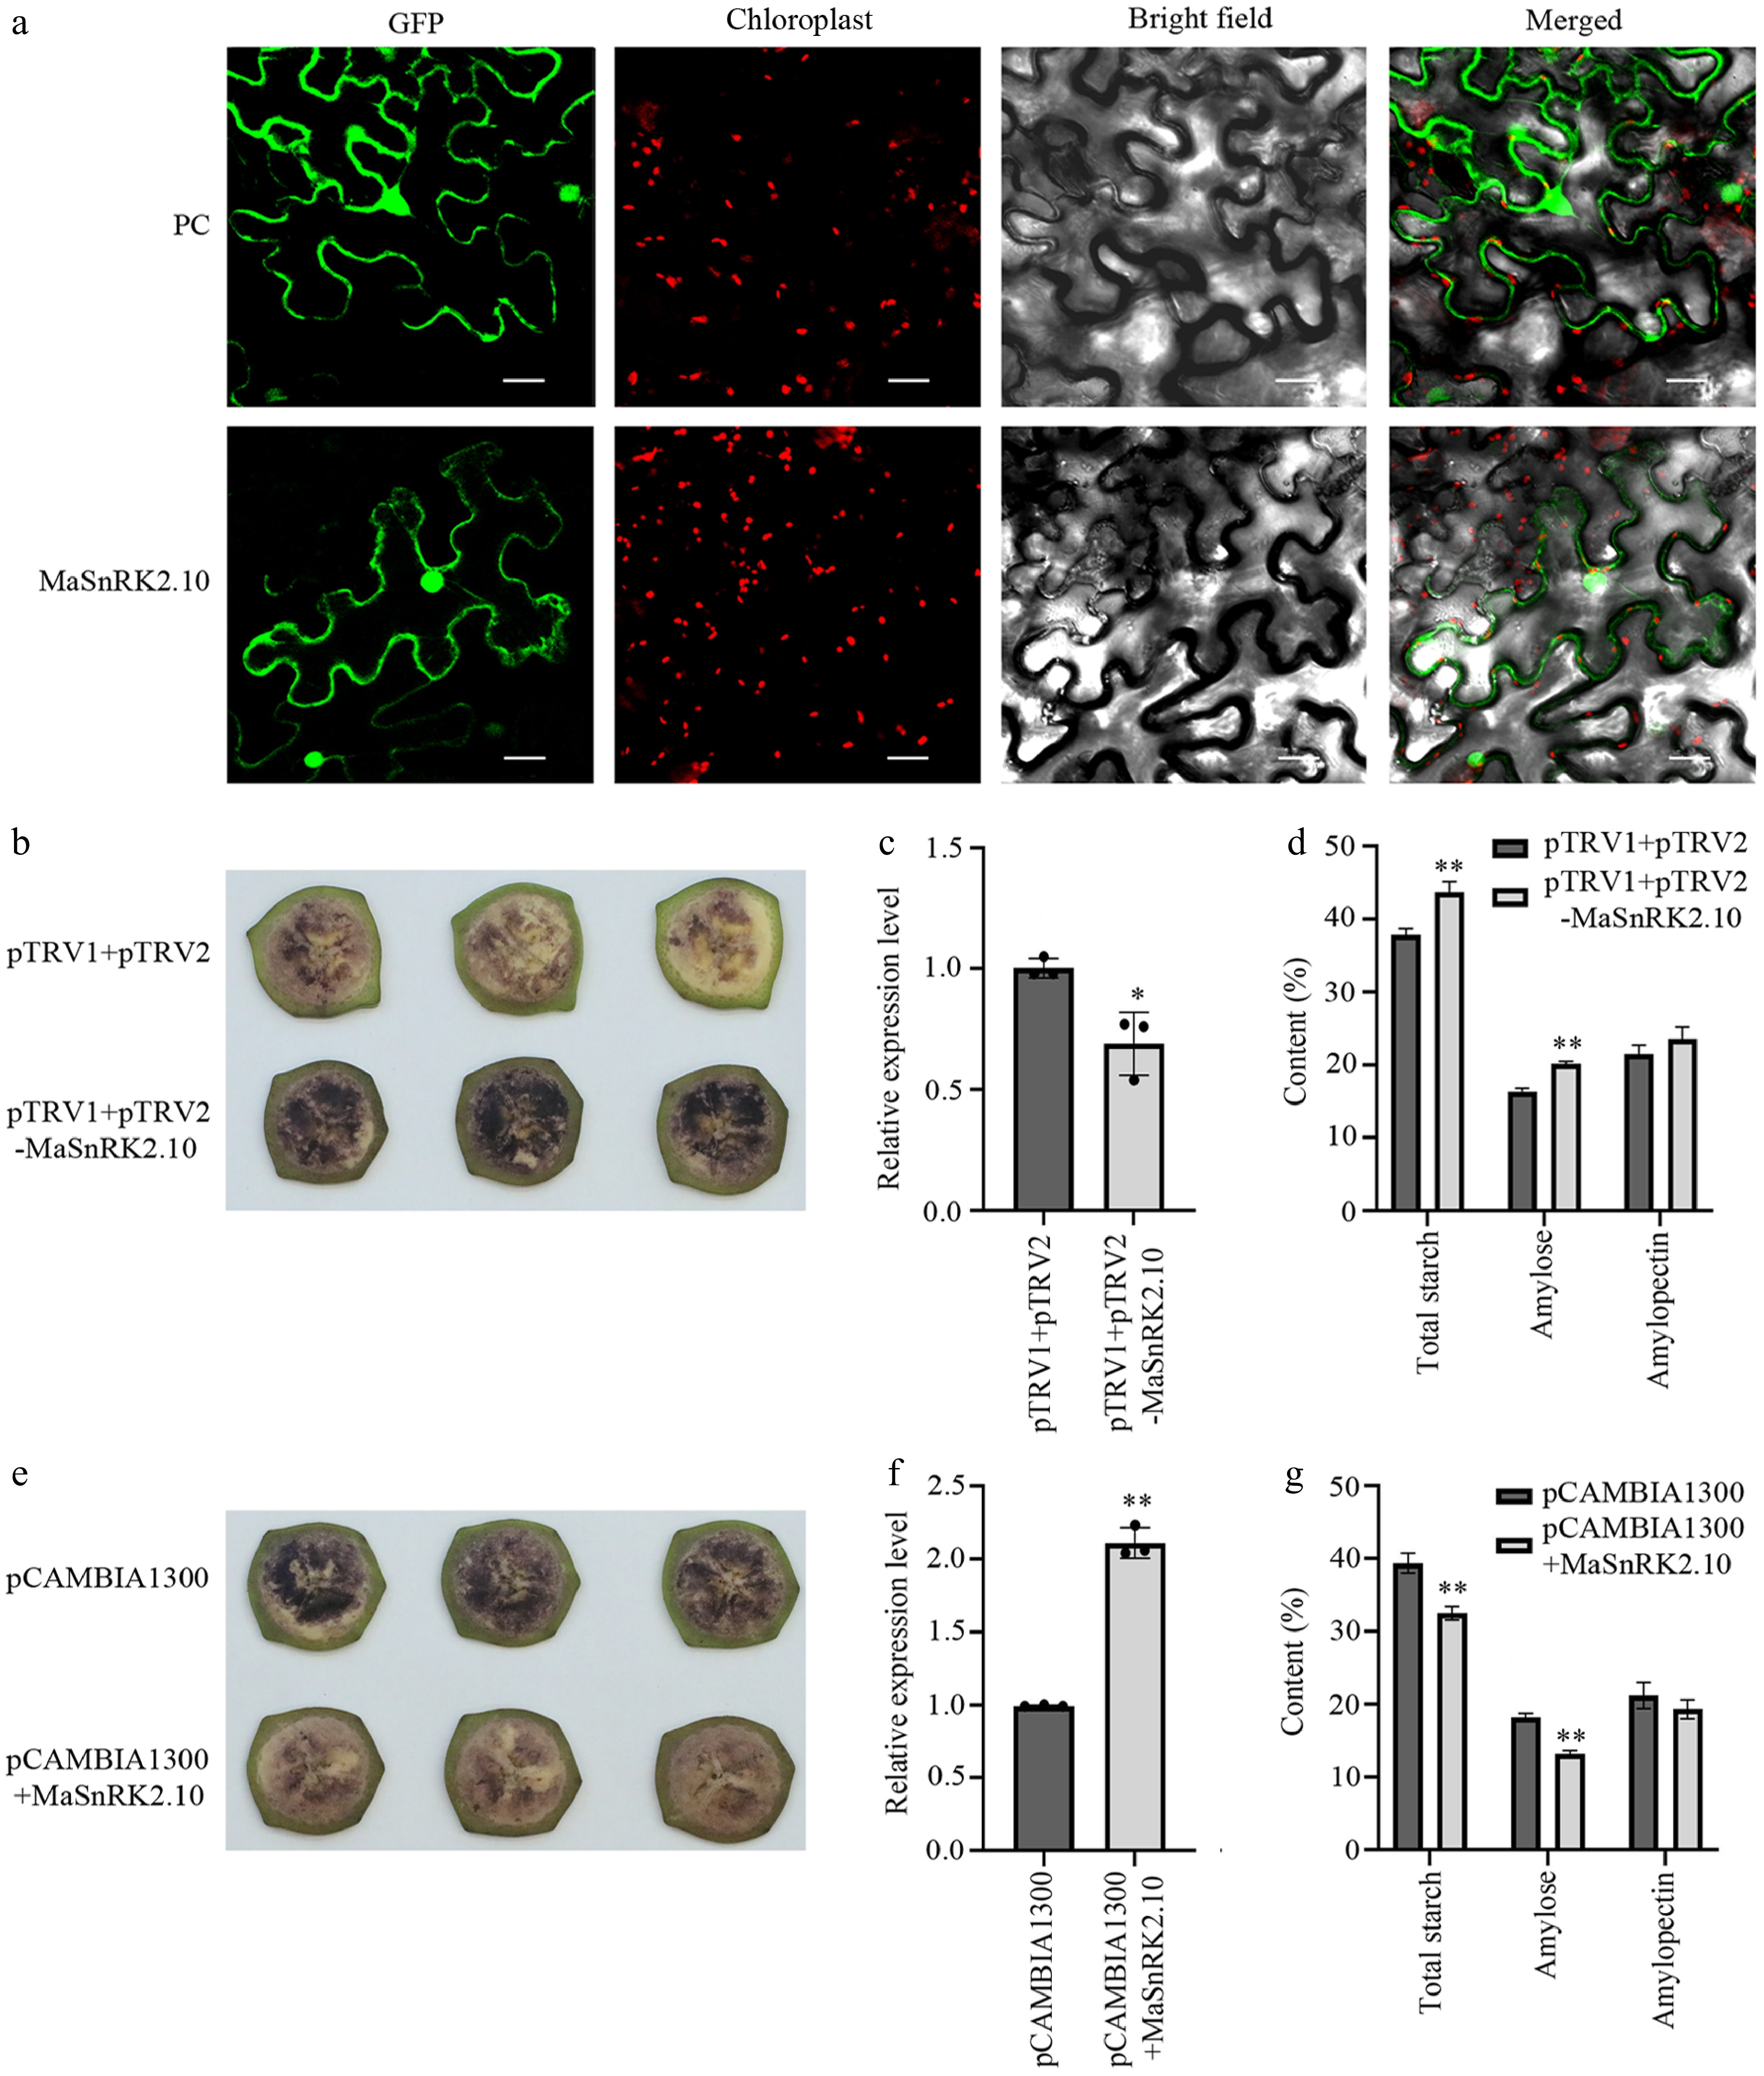
Figure 6.
Co-localization of MaSnRK2.10 in Nicotiana benthamiana and its functional analysis in banana (M. acuminata) fruit. (a) Co-localization of MaSnRK2.10. The green fluorescent protein (GFP) fluorescence is represented by green, whereas red fluorescence indicates chloroplast red fluorescent proteins. A composite image was created by merging the GFP and RFP fluorescence images, represented under 'merge'. Bar = 10 μm. (b) Iodine (I2-KI) staining of banana fruit discs showing reduced starch degradation following transient suppression of MaSnRK2.10. (c) Relative expression levels of MaSnRK2.10 in banana fruit discs after gene silencing, as determined by quantitative reverse transcriptase PCR (RT-qPCR). (d) Quantification of total starch, amylose, and amylopectin contents in banana fruit discs following MaSnRK2.10 suppression. (e) Iodine (I2-KI) staining of banana fruit discs showing increased starch degradation following transient overexpression of MaSnRK2.10. (f) Relative expression levels of MaSnRK2.10 in banana fruit discs after gene overexpression, as determined by RT-qPCR. (g) Quantification of total starch, amylose, and amylopectin contents in banana fruit discs following MaSnRK2.10 transient overexpression. Data represent the mean ± standard error (SE) of three independent biological replicates. Statistically significant differences between samples were determined by Analysis of Variance (ANOVA) (* p < 0.05; ** p < 0.01).
-
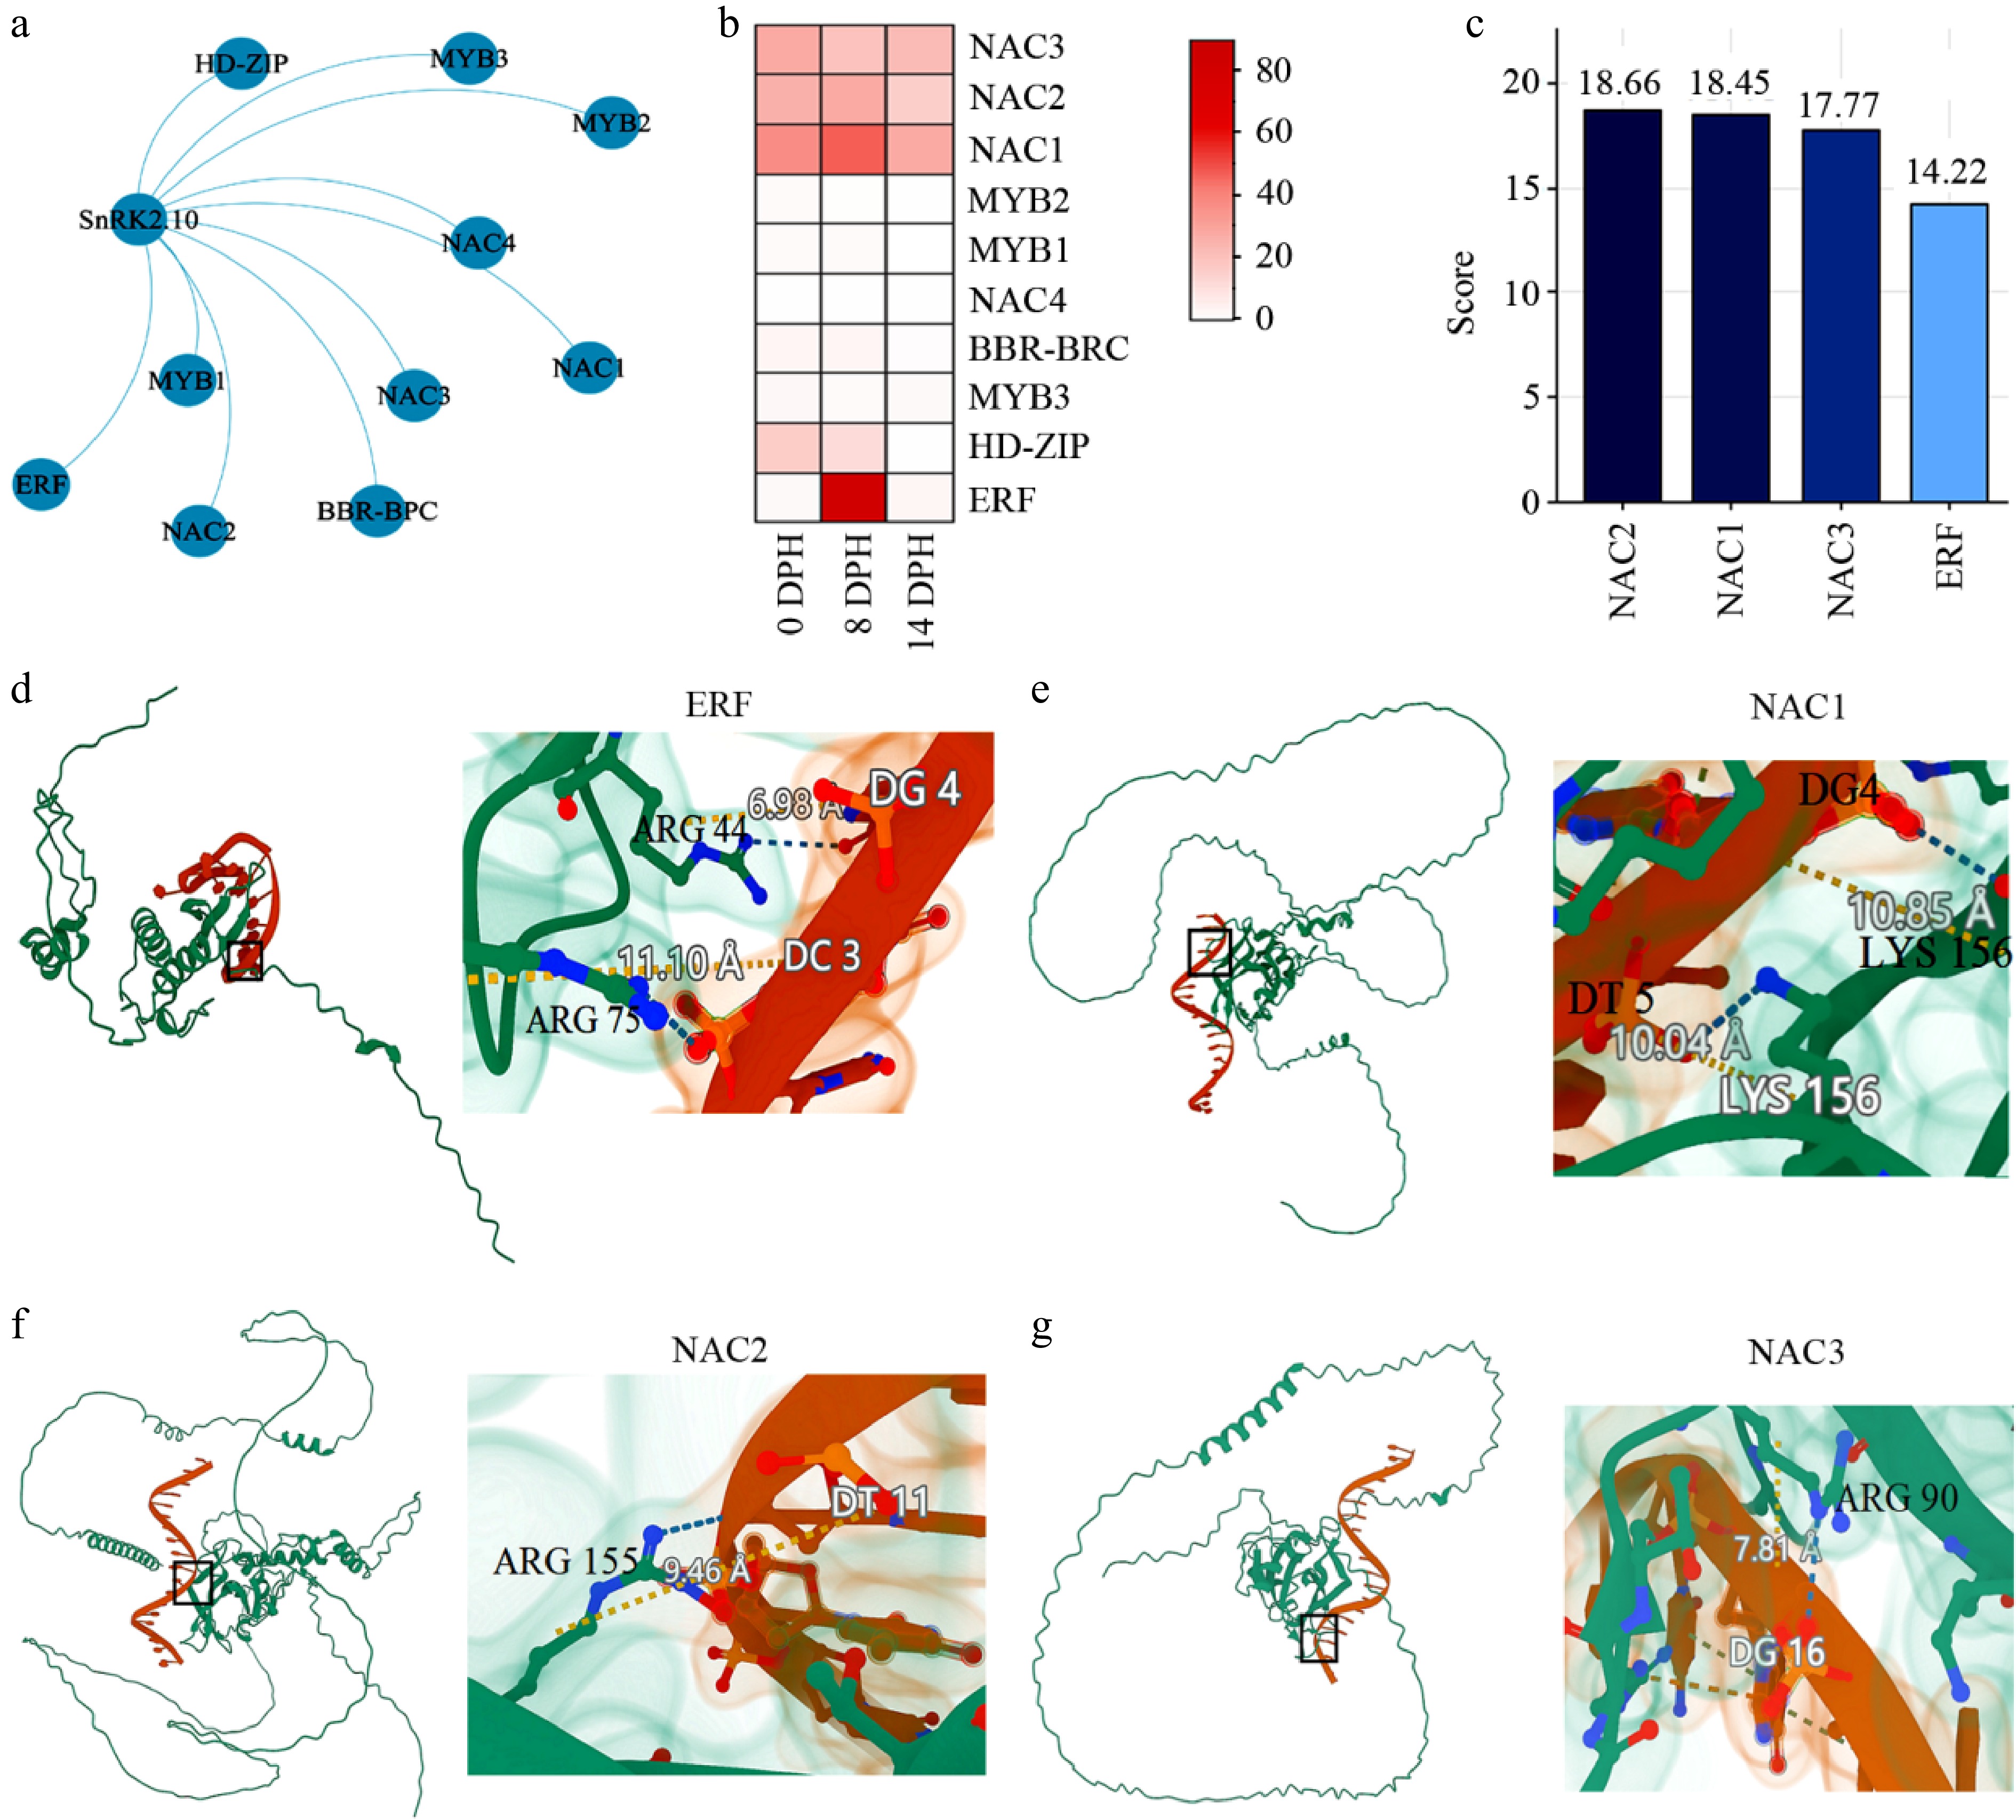
Figure 7.
Prediction and validation of transcriptional regulators targeting the MaSnRK2.10 promoter in banana (Musa acuminata). (a) Predicted transcriptional regulatory network involving transcription factors targeting the MaSnRK2.10 promoter. (b) Expression profiles of candidate transcription factors (NAC1, NAC2, NAC3, and ERF) associated with the MaSnRK2.10 regulatory network across different ripening stages of banana fruit. (c) Predicted binding scores of NAC1, NAC2, NAC3, and ERF to the MaSnRK2.10 promoter based on in-silico analysis. (d)–(g) Molecular docking simulations showing the predicted binding interactions between the MaSnRK2.10 promoter and transcription factors (d) ERF, (e) NAC1, (f), NAC2, and (g) NAC3, supporting their potential regulatory roles in starch biosynthesis.
Figures
(7)
Tables
(0)