-
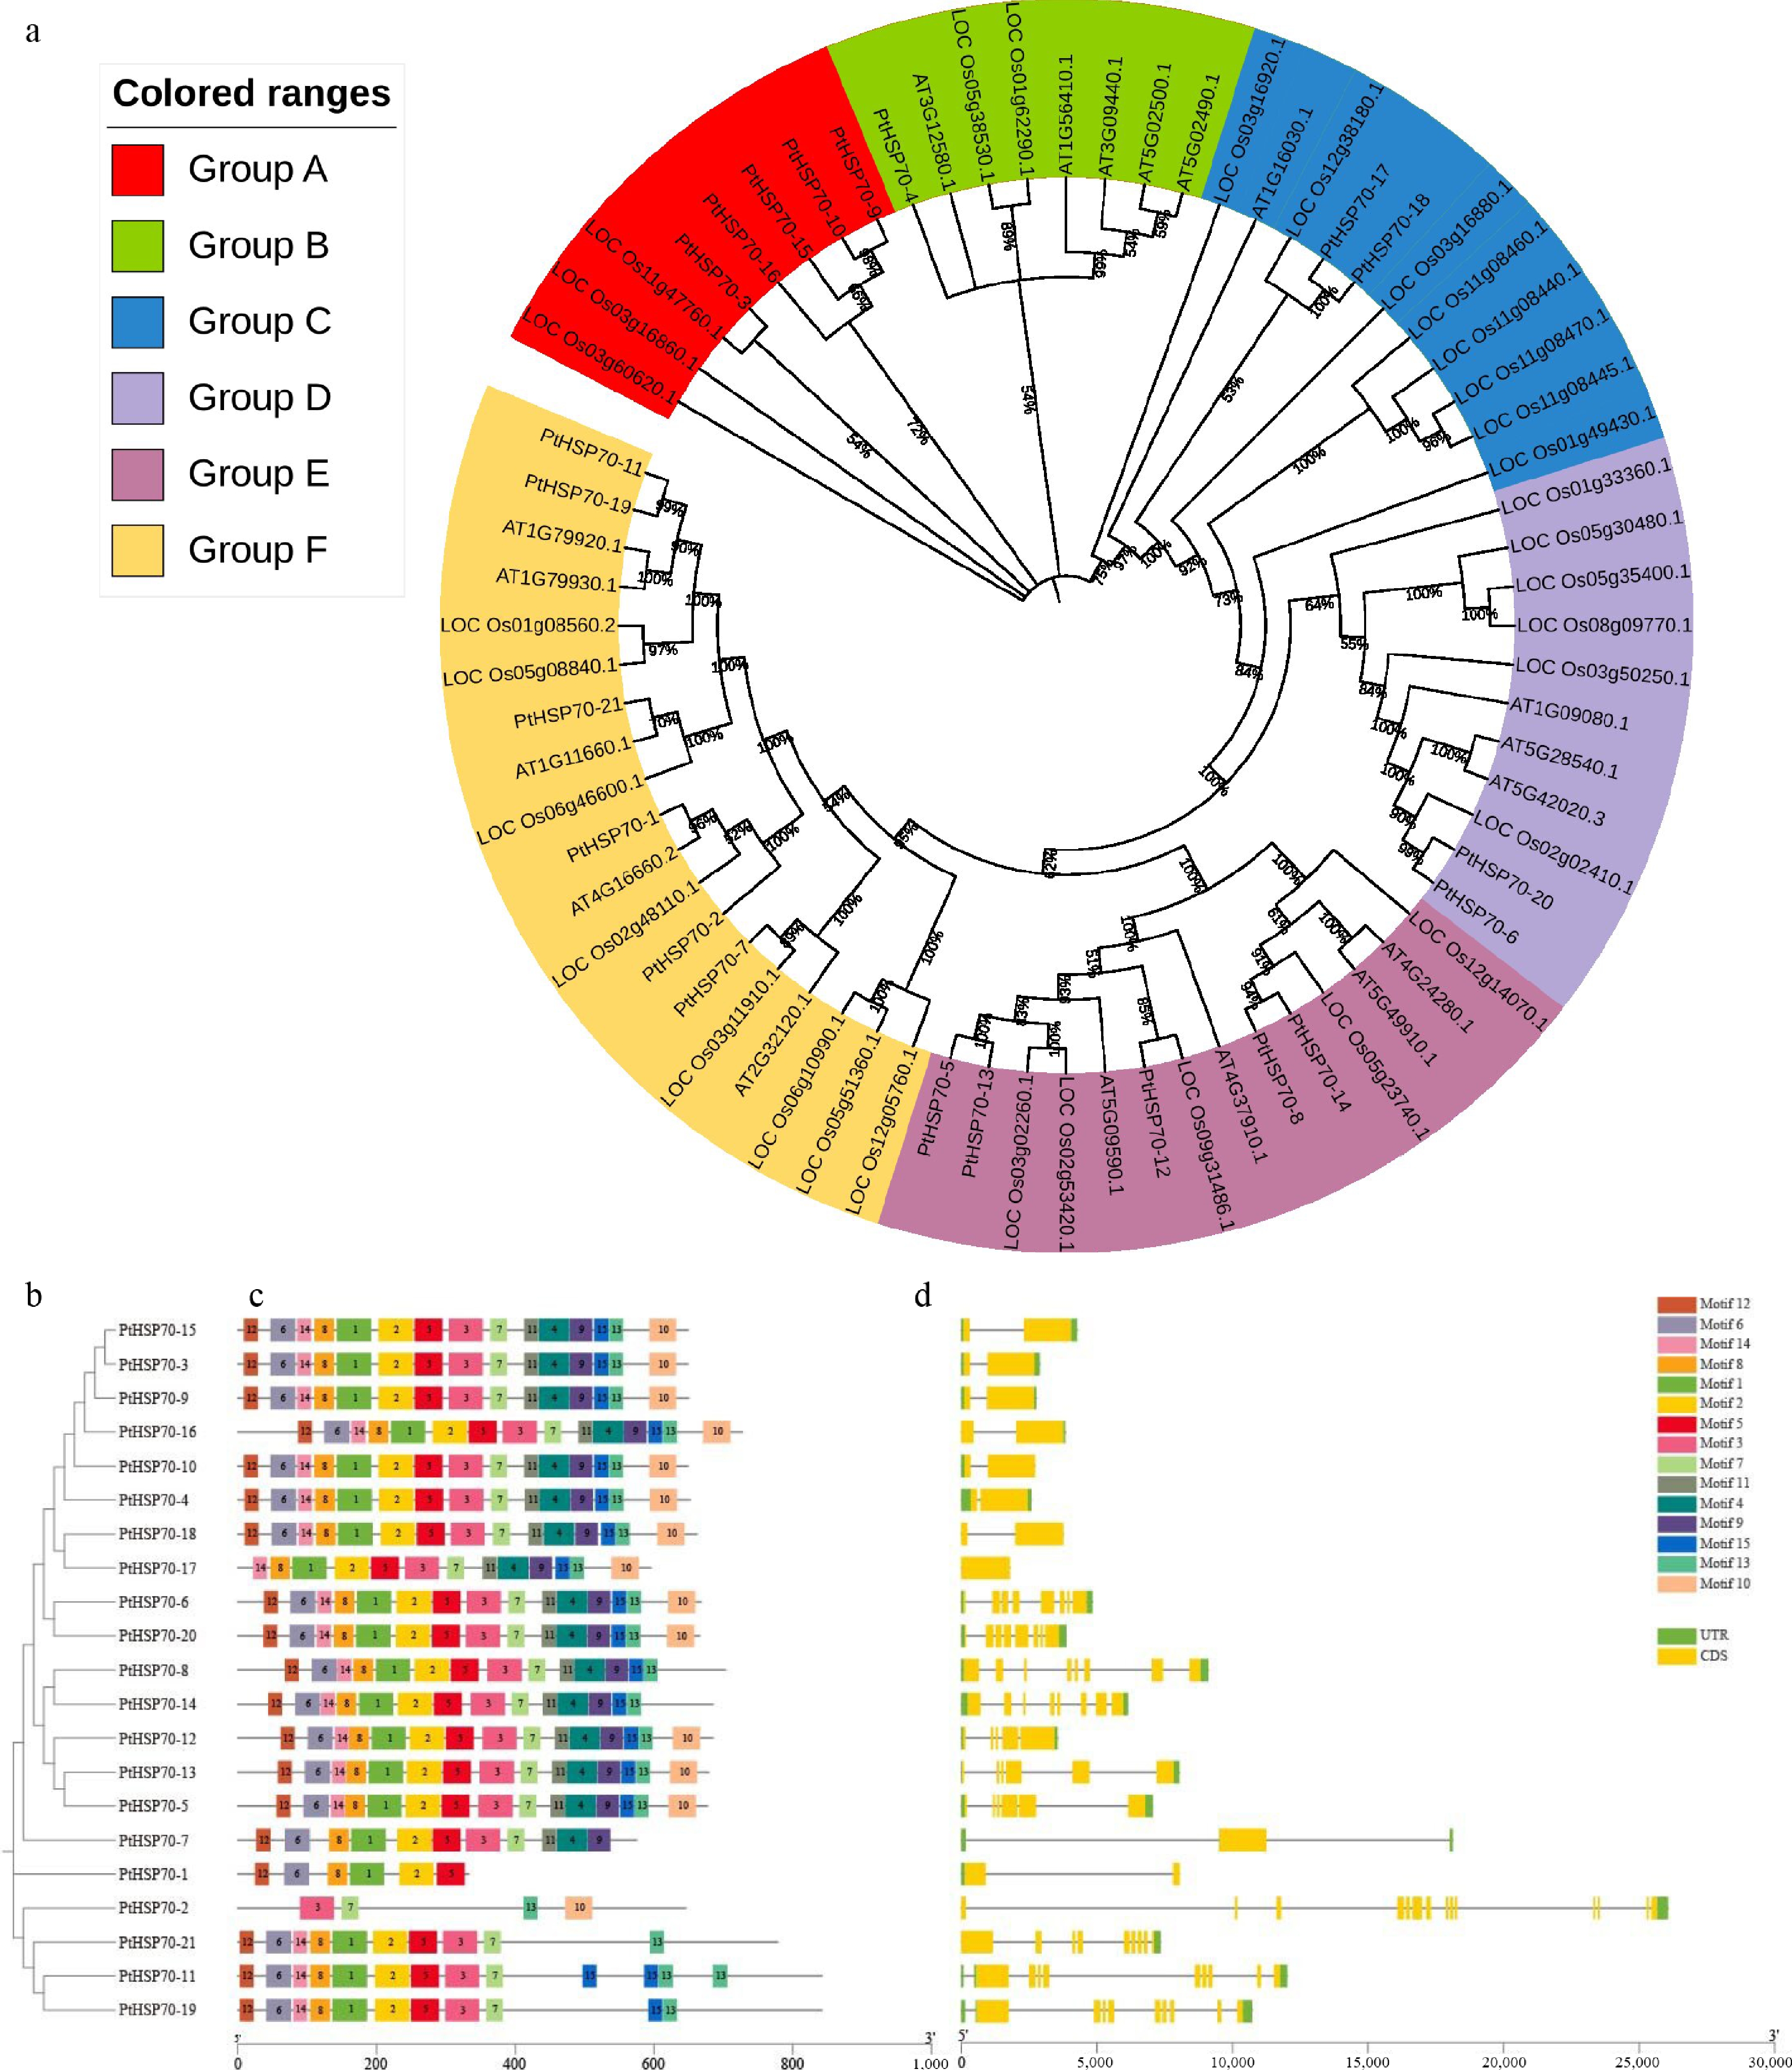
Figure 1.
Phylogenetic relationship, gene structure, and conserved protein motifs in the PtHSP70 gene family. Conserved motif analysis was performed by the MEME tool and visualized with TBTools; the gene structure was also visualized using TBTools. (a) Circular phylogenetic tree of HSP70 proteins from P. ternata (PtHSP70), Arabidopsis thaliana (At) and Oryza sativa (Os), divided into six colored groups (A−F), with each branch representing an individual HSP70 sequence. (b) Phylogenetic analysis of HSP70 proteins in P. ternata. (c) The conserved motifs in P. ternata, where each motif is shown as a box in one of 15 different colors. (d) Exon–intron structure of the HSP70 genes in P. ternata, where the yellow box represents the coding sequence (CDS), the green box represents the untranscribed region (UTR), and the black line connecting the two exons represents the intron. The scale in the bottom is in units of base pairs (bp).
-
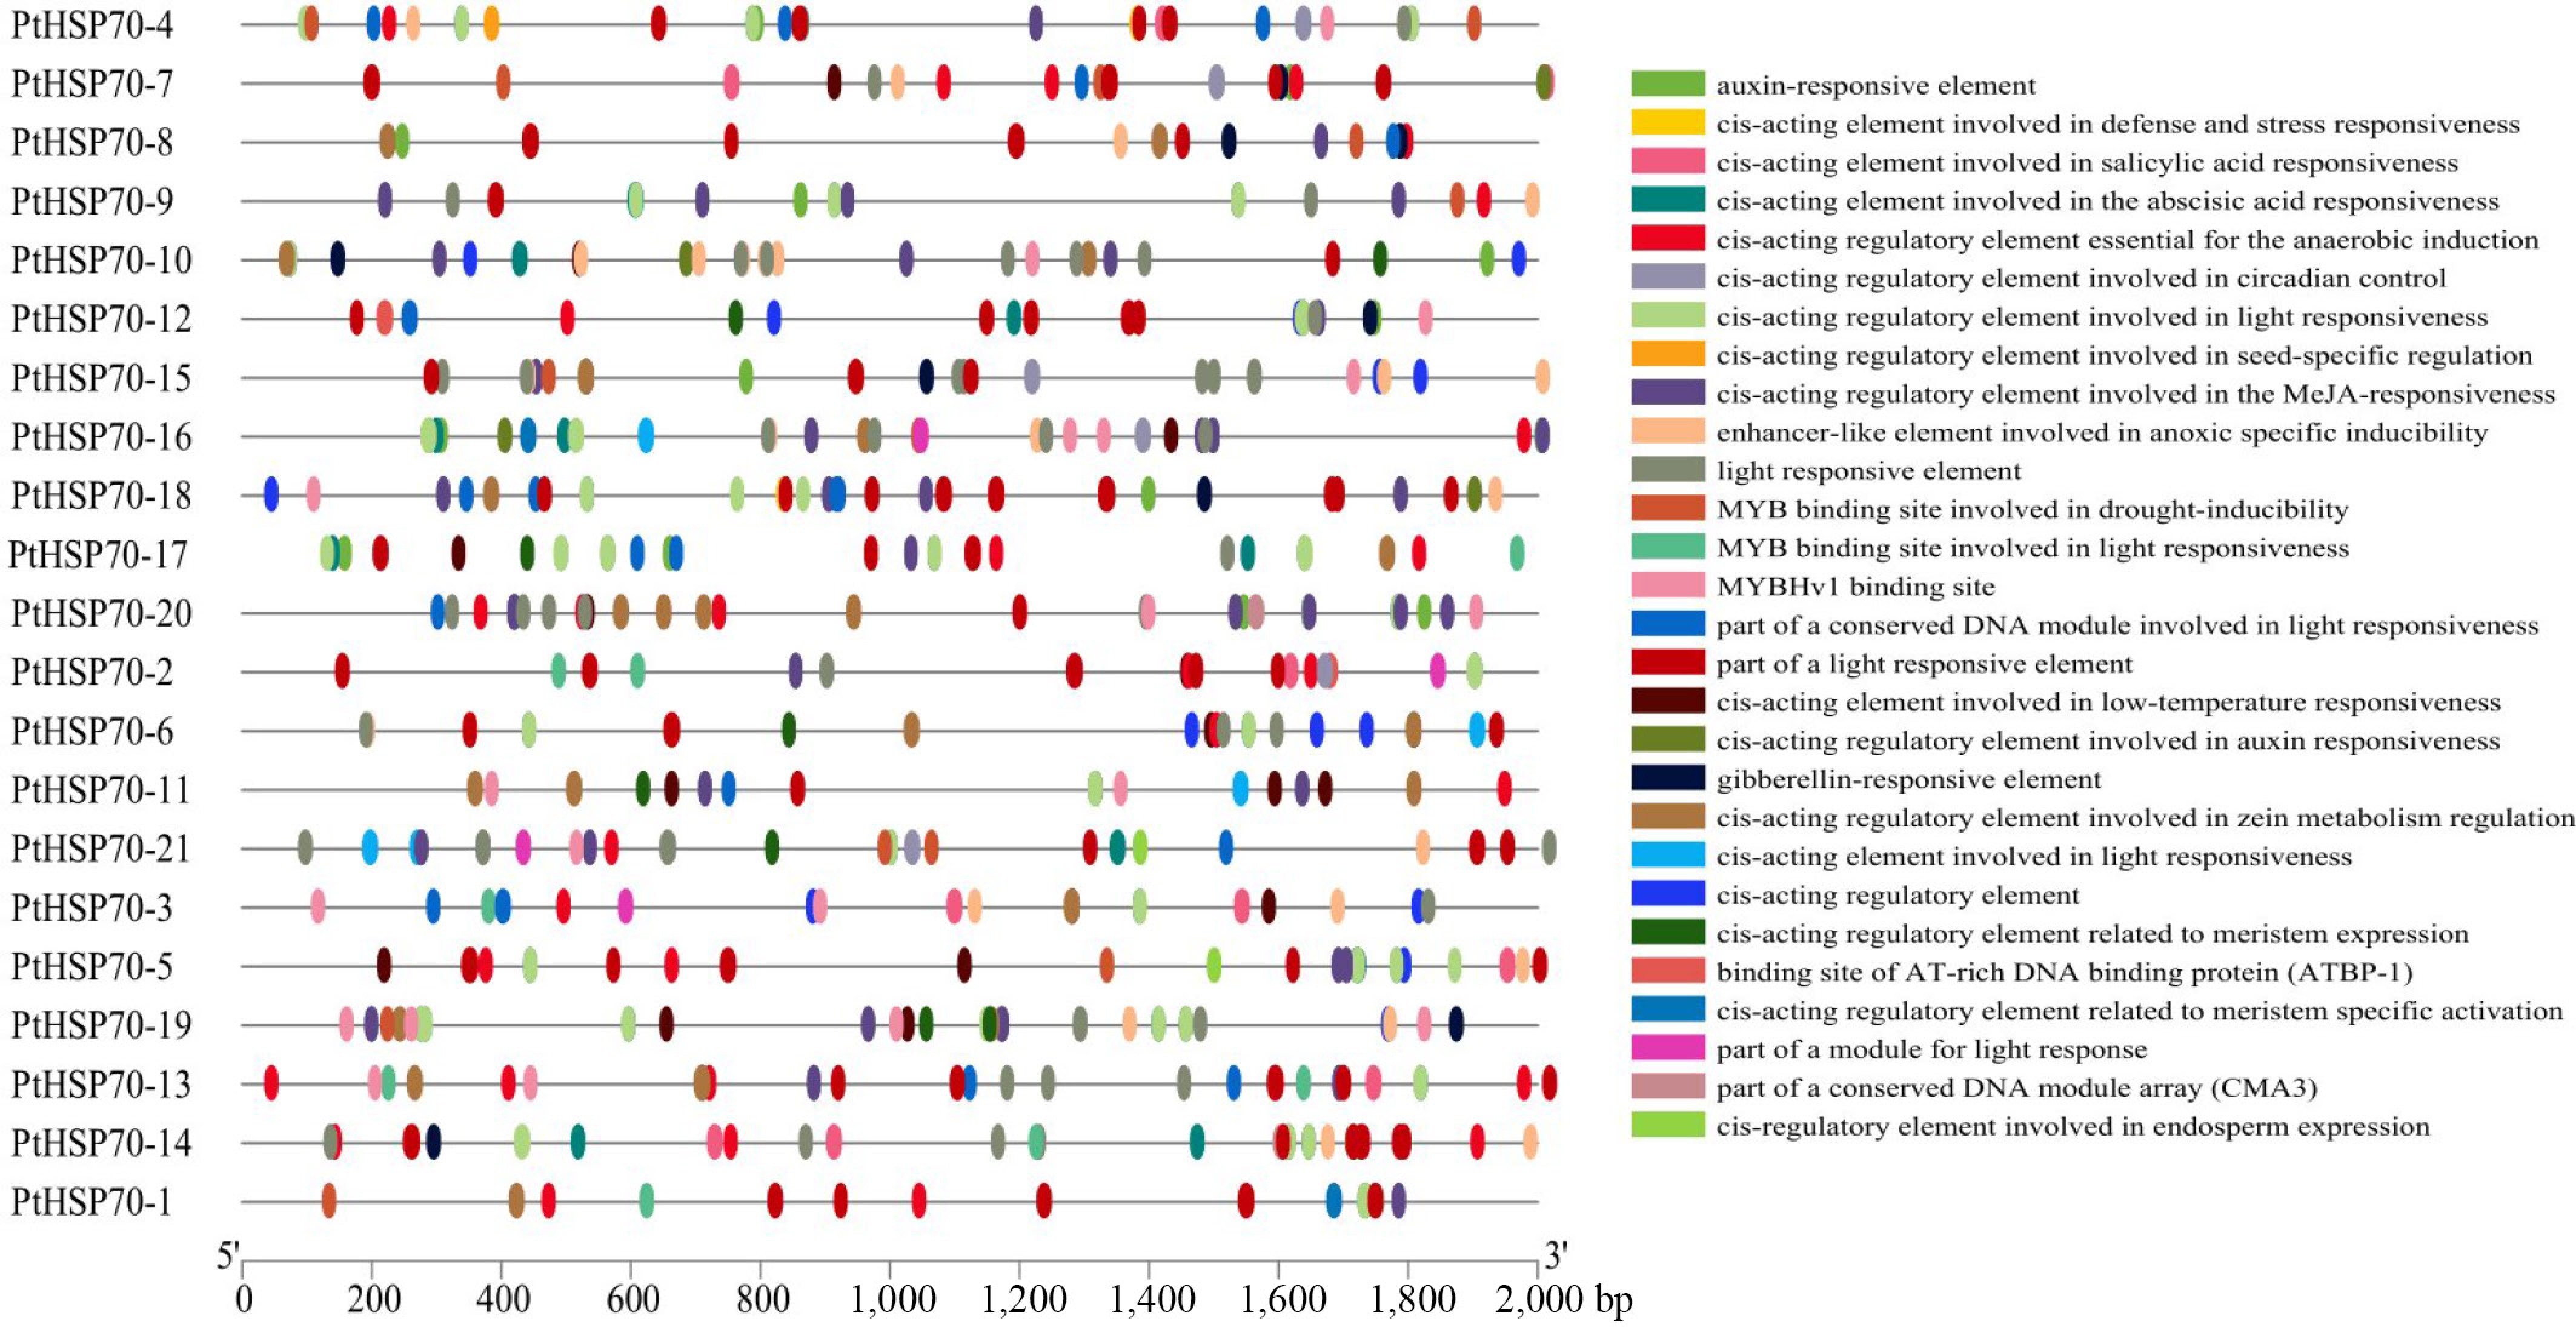
Figure 2.
PtHSP70 promoters' cis-acting elements. Different colored squares show different promoter cis-acting elements.
-
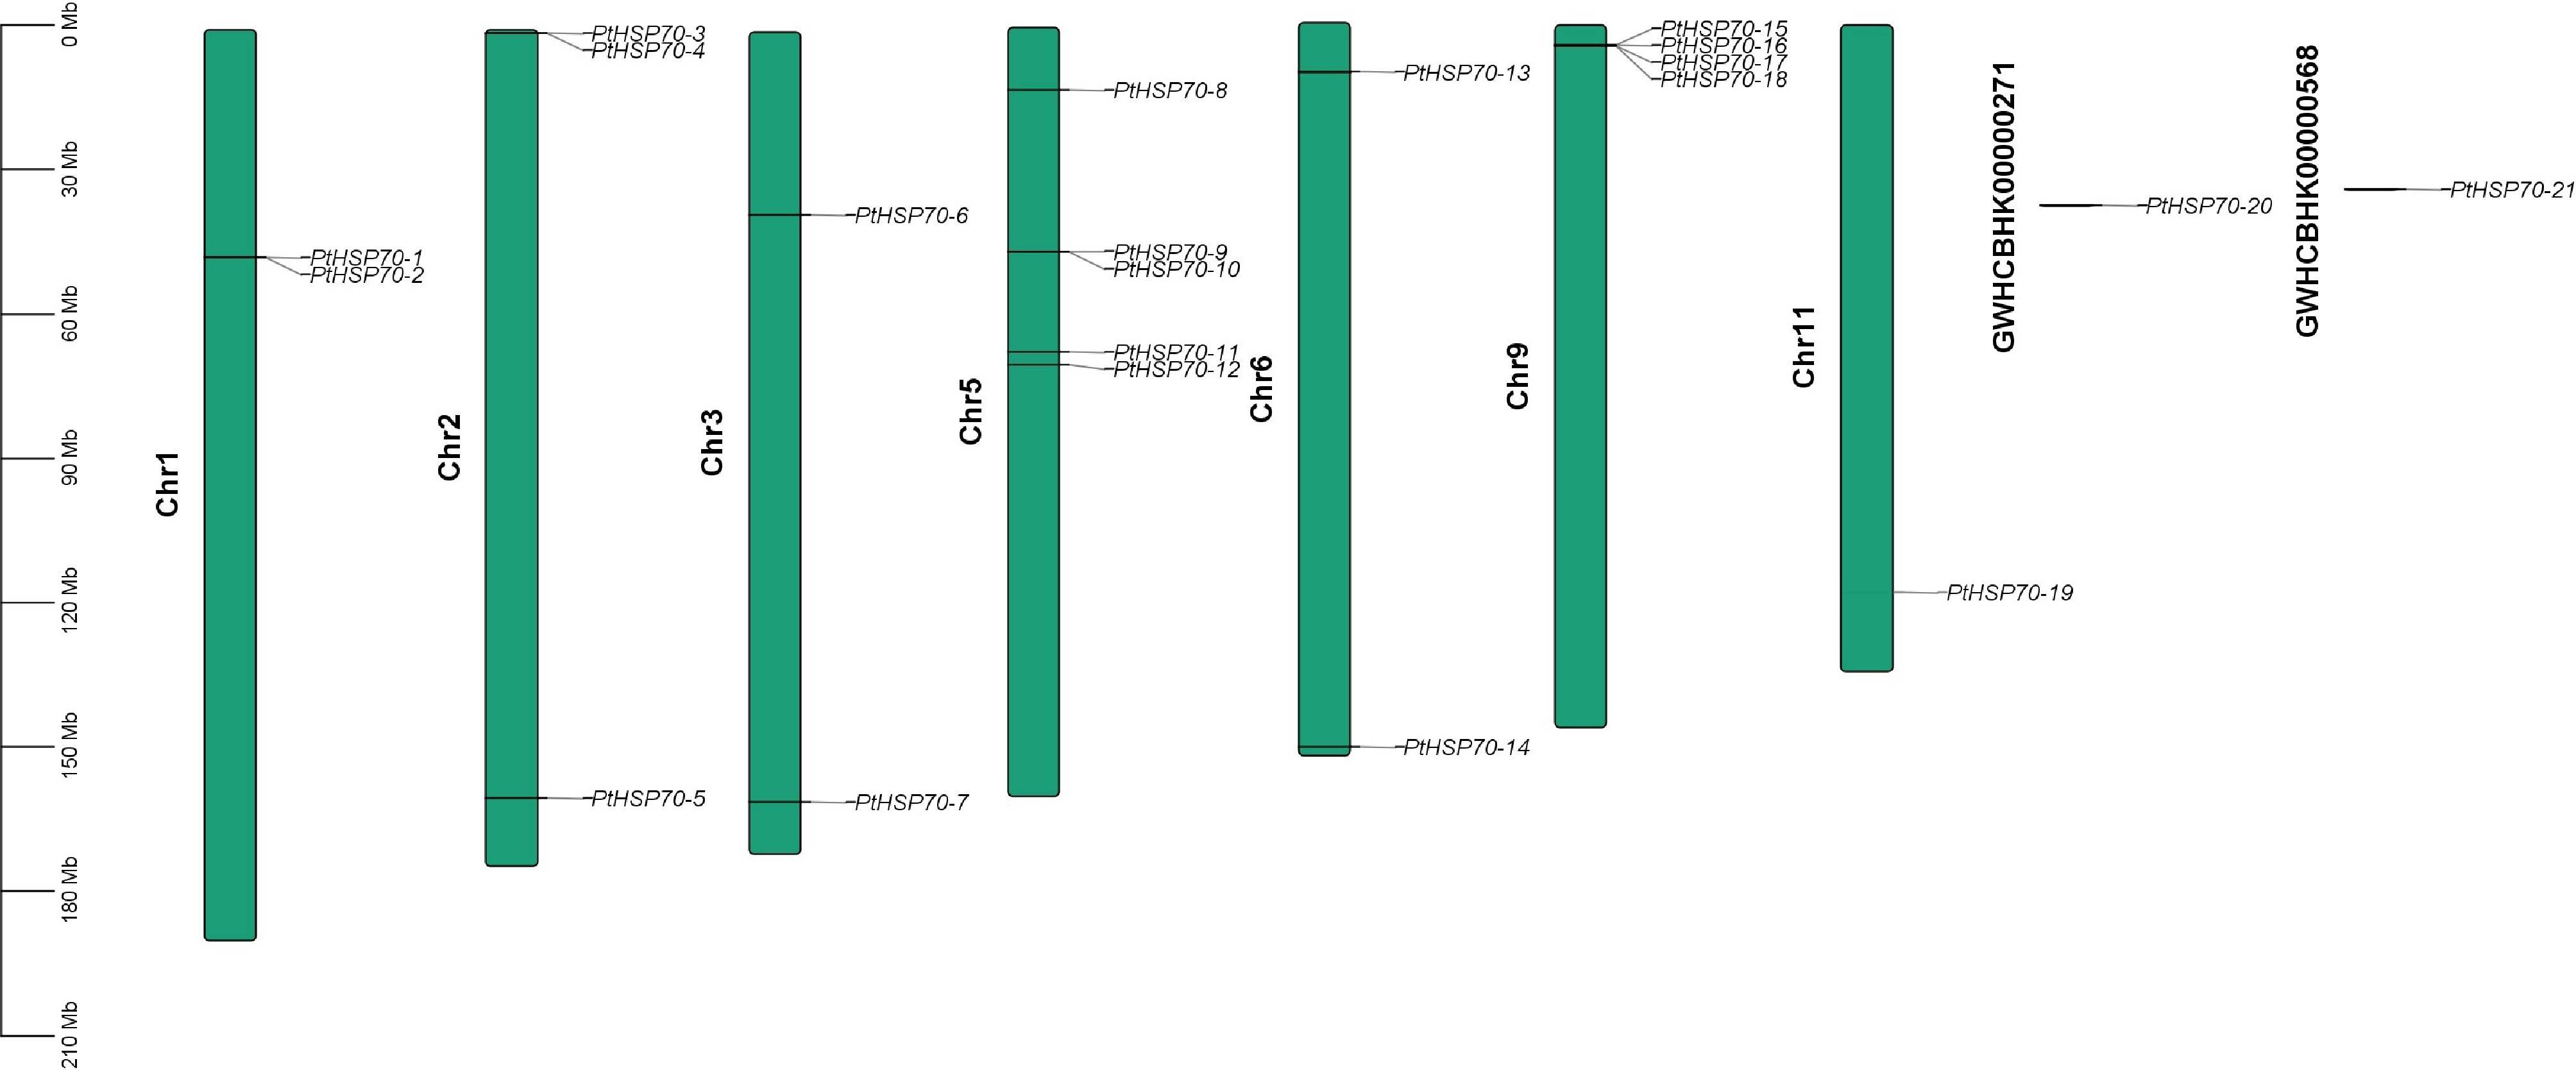
Figure 3.
Chromosomal location of the PtHSP70s. The chromosomes containing PtHSP70 genes are presented according to their physical lengths. The scalebar (Mb) on the left represents the length of the chromosomes, and the chromosome numbers are displayed on the left of chromosomes.
-
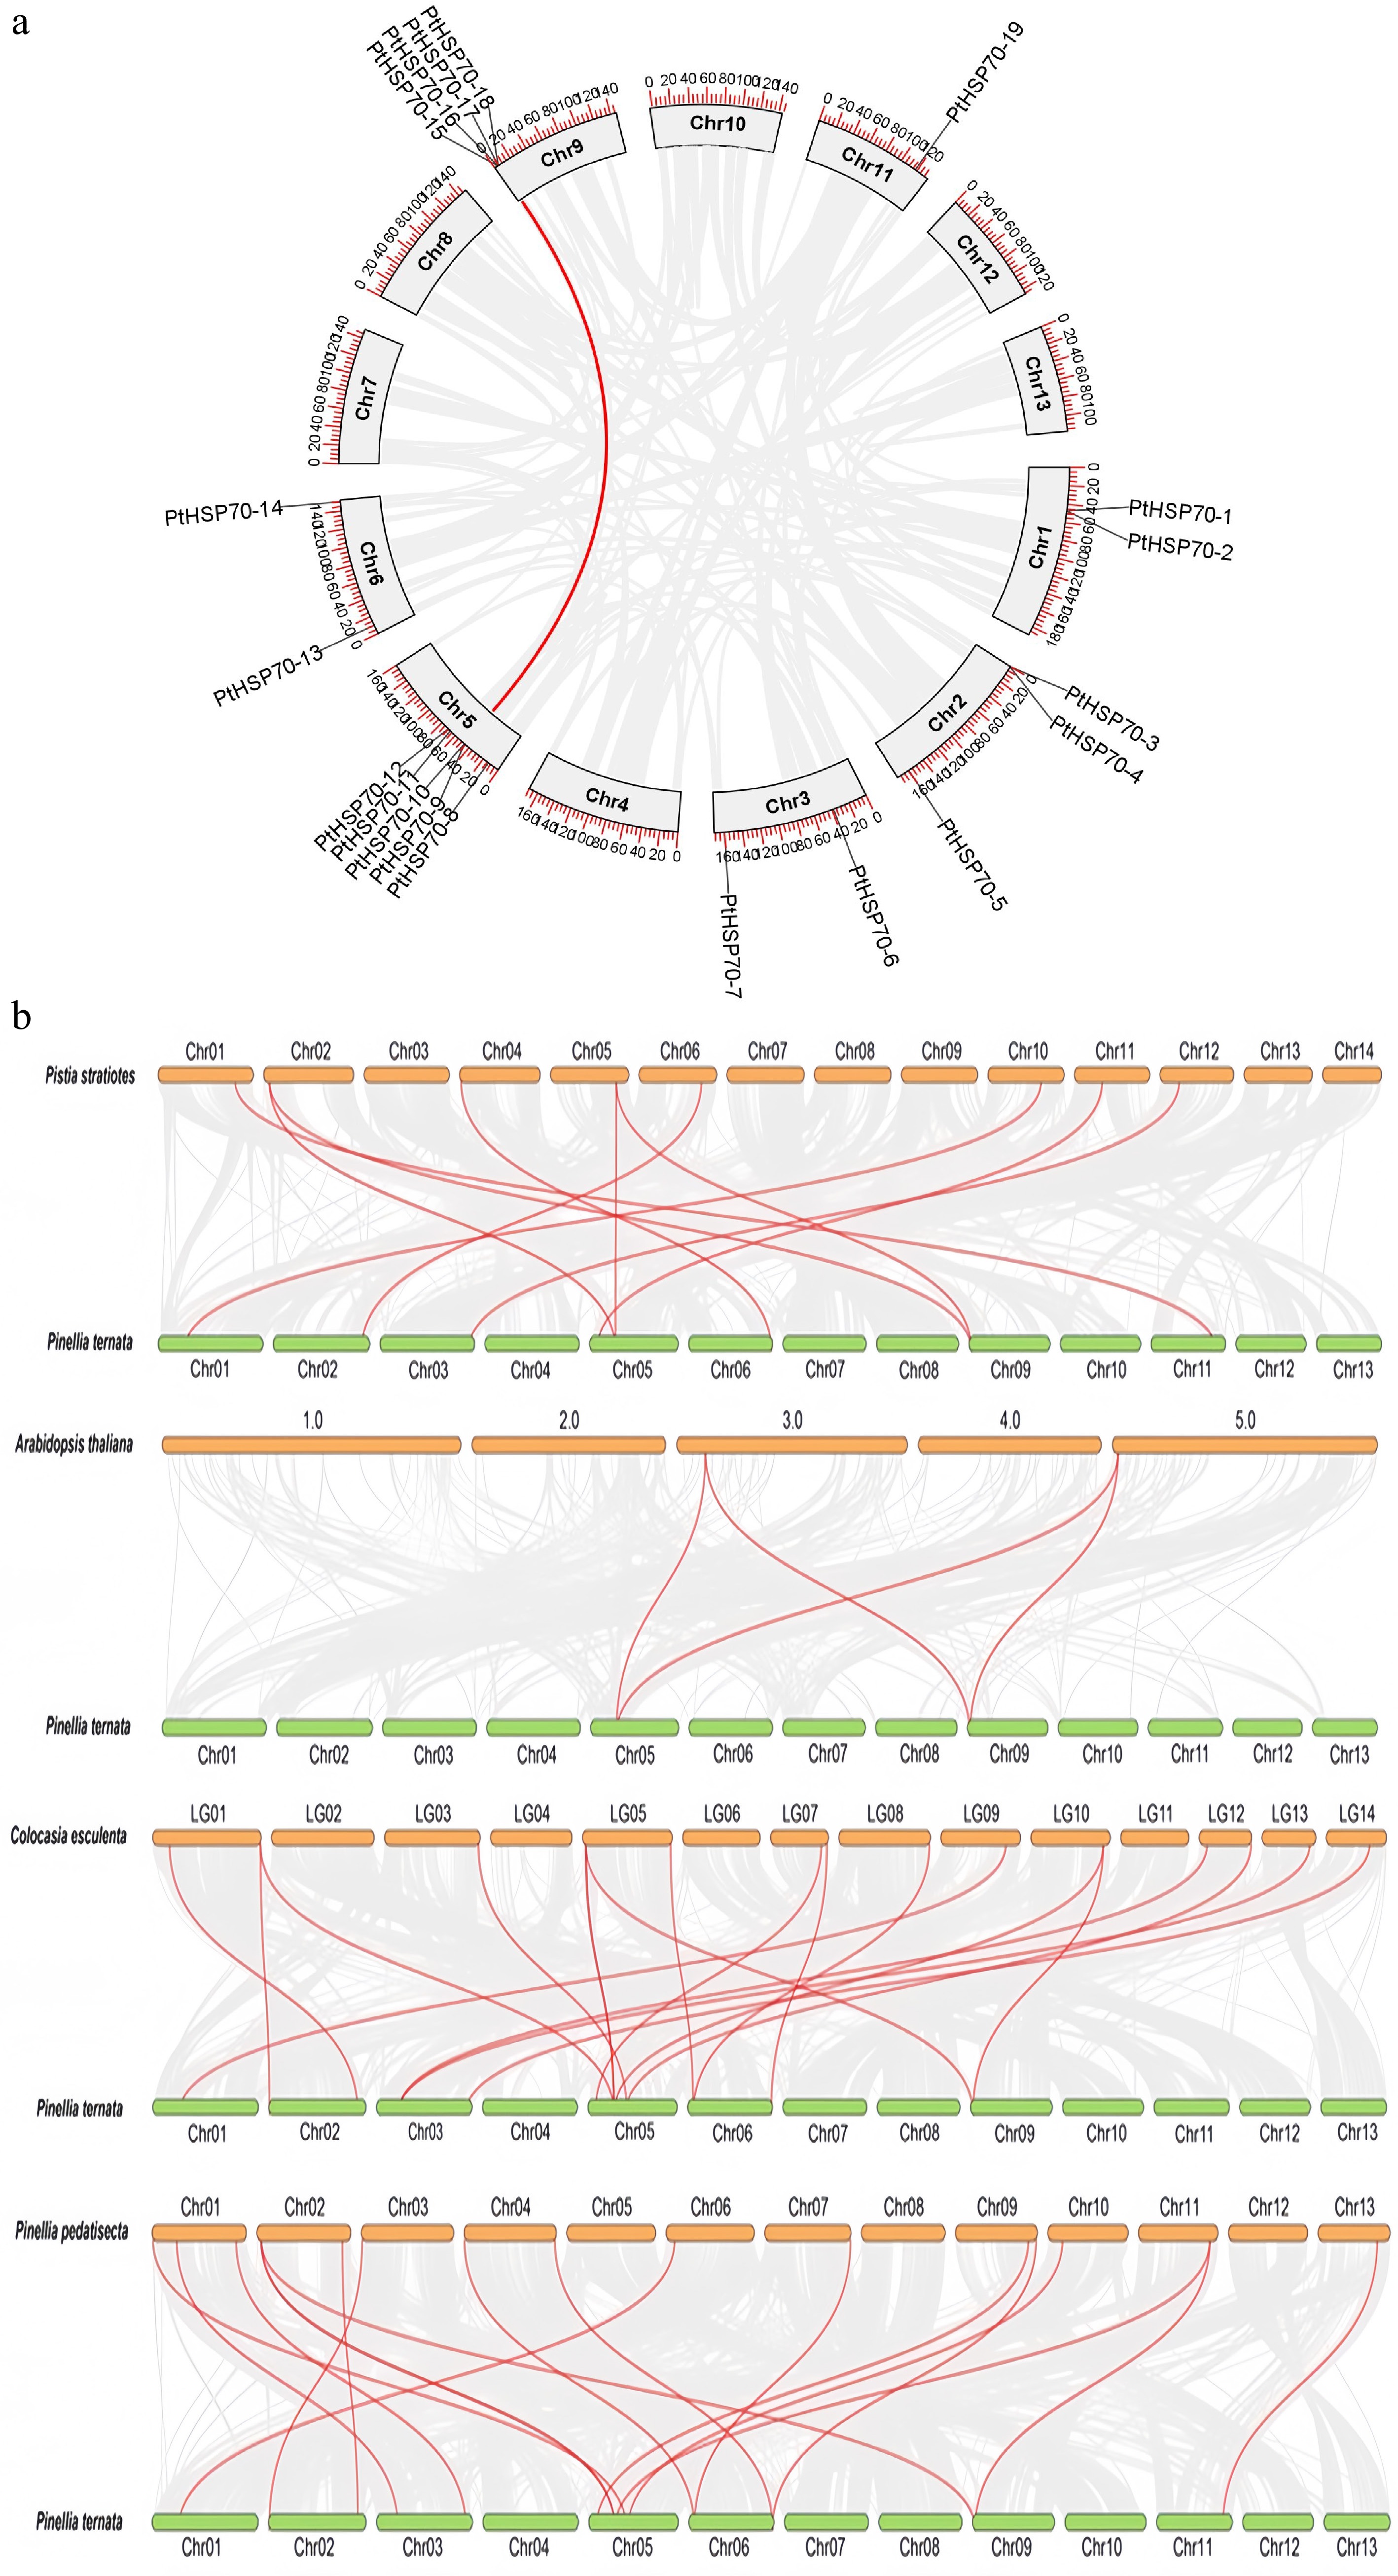
Figure 4.
Collinearity analysis of the PtHSP70 gene family between P. ternata, P. stratiotes, A. thaliana, C. esculenta, and P. pedatisecta. (a) Intraspecific collinearity analysis of the PtHSP70 gene. Synteny analysis of PtHSP70 genes in P. ternata. Gray lines indicate all syntenic gene pairs in the P. ternata genome, and red lines indicate collinearity relationships among P. ternata PtHSP70 genes. Chr, chromosome. (b) Collinearity analysis of the PtHSP70 gene across different species. The green bars show the chromosomes of P. ternata, orange shows the different chromosomes within different species. Red lines show the orthologous pairs between the species, and gray lines represent collinearity blocks. The four species are P. stratiotes, A. thaliana, C. esculenta, and P. pedatisecta.
-
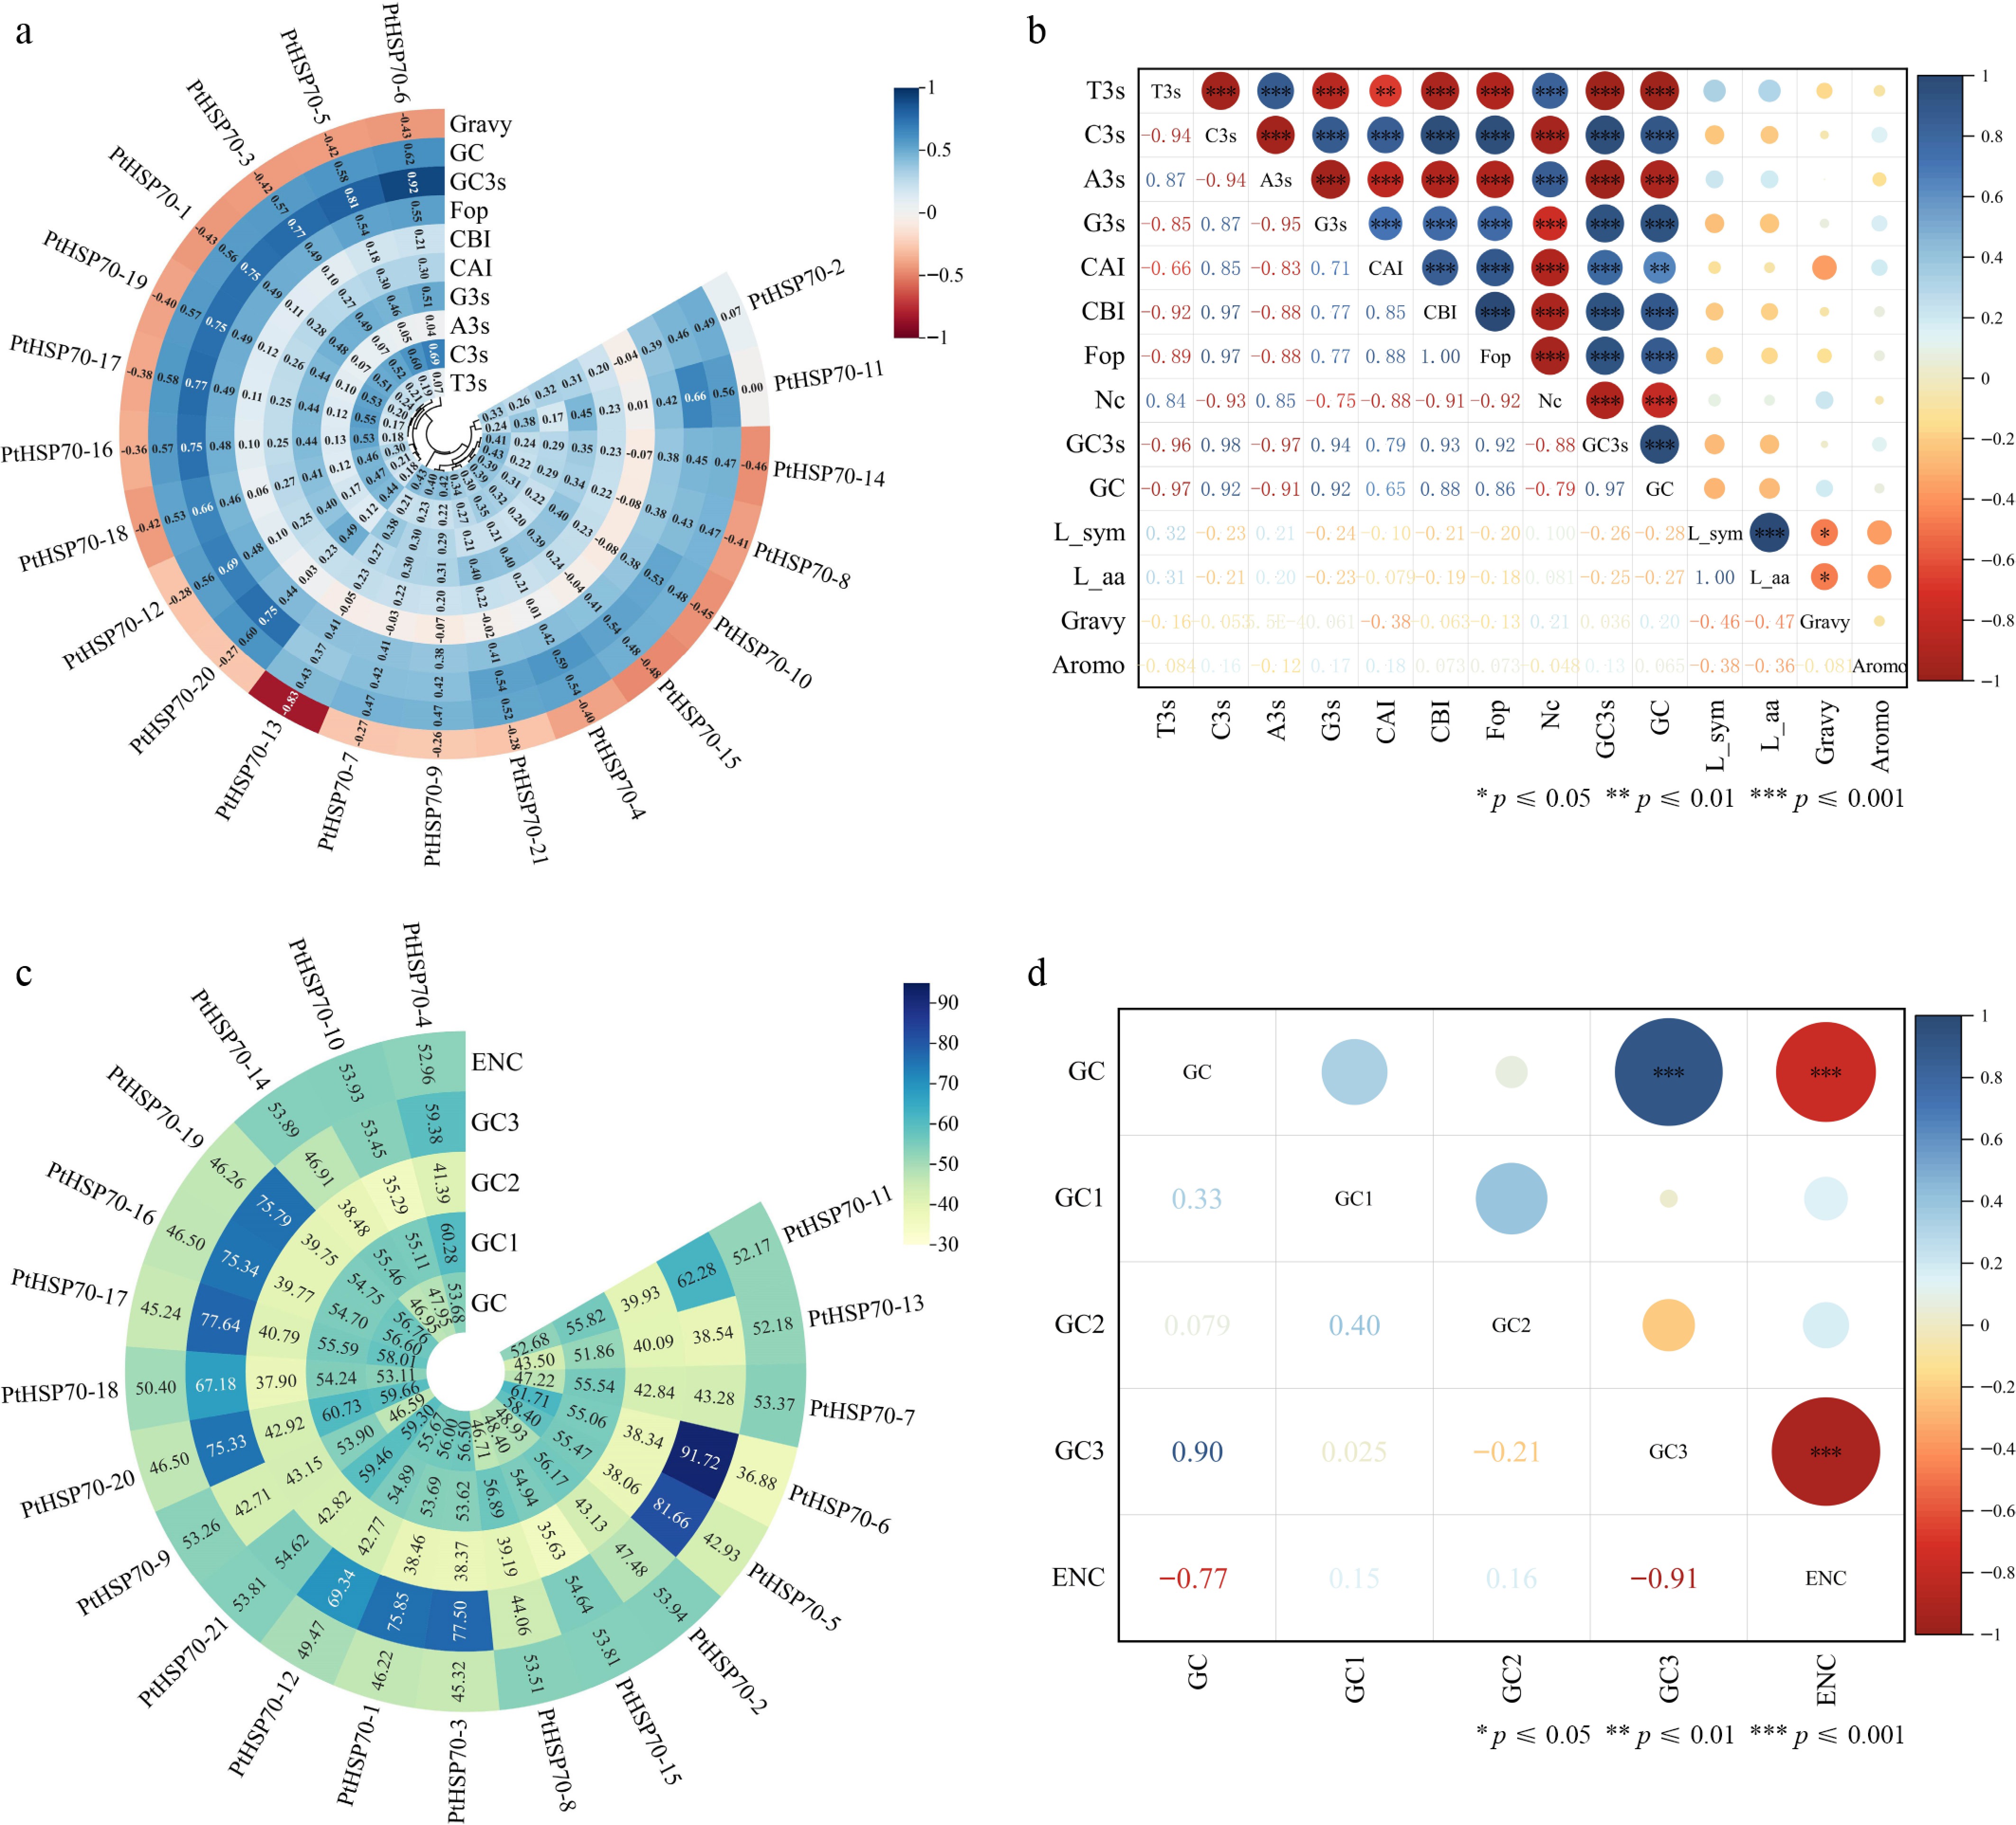
Figure 5.
Analysis of parameters related to codon usage bias. (a) Codon parameter analysis of the PtHSP70 gene family, including the Gravy value (Gravy), the frequency of the third base corresponding to synonymous codons (A3s, G3s, C3s, T3s), CAI, CBI, FOP, G + C content at the third codon position (GC3s), and total G + C content of the gene (GC). (b) and (d) Correlation analysis of HSP70 gene family codons, where L-sym represents the number of synonymous amino acids, L-aa denotes the length of the amino acid sequence, and Aromo refers to the frequency of aromatic amino acids. (c) Codon base composition of the HSP70 gene family, including G + C content at the first (GC1), second (GC2), and third (GC3) codon positions, as well as the ENC. (a) and (c) were analyzed using Codon W and CUSP tools; (b) and (d) were constructed using Origin software.
-
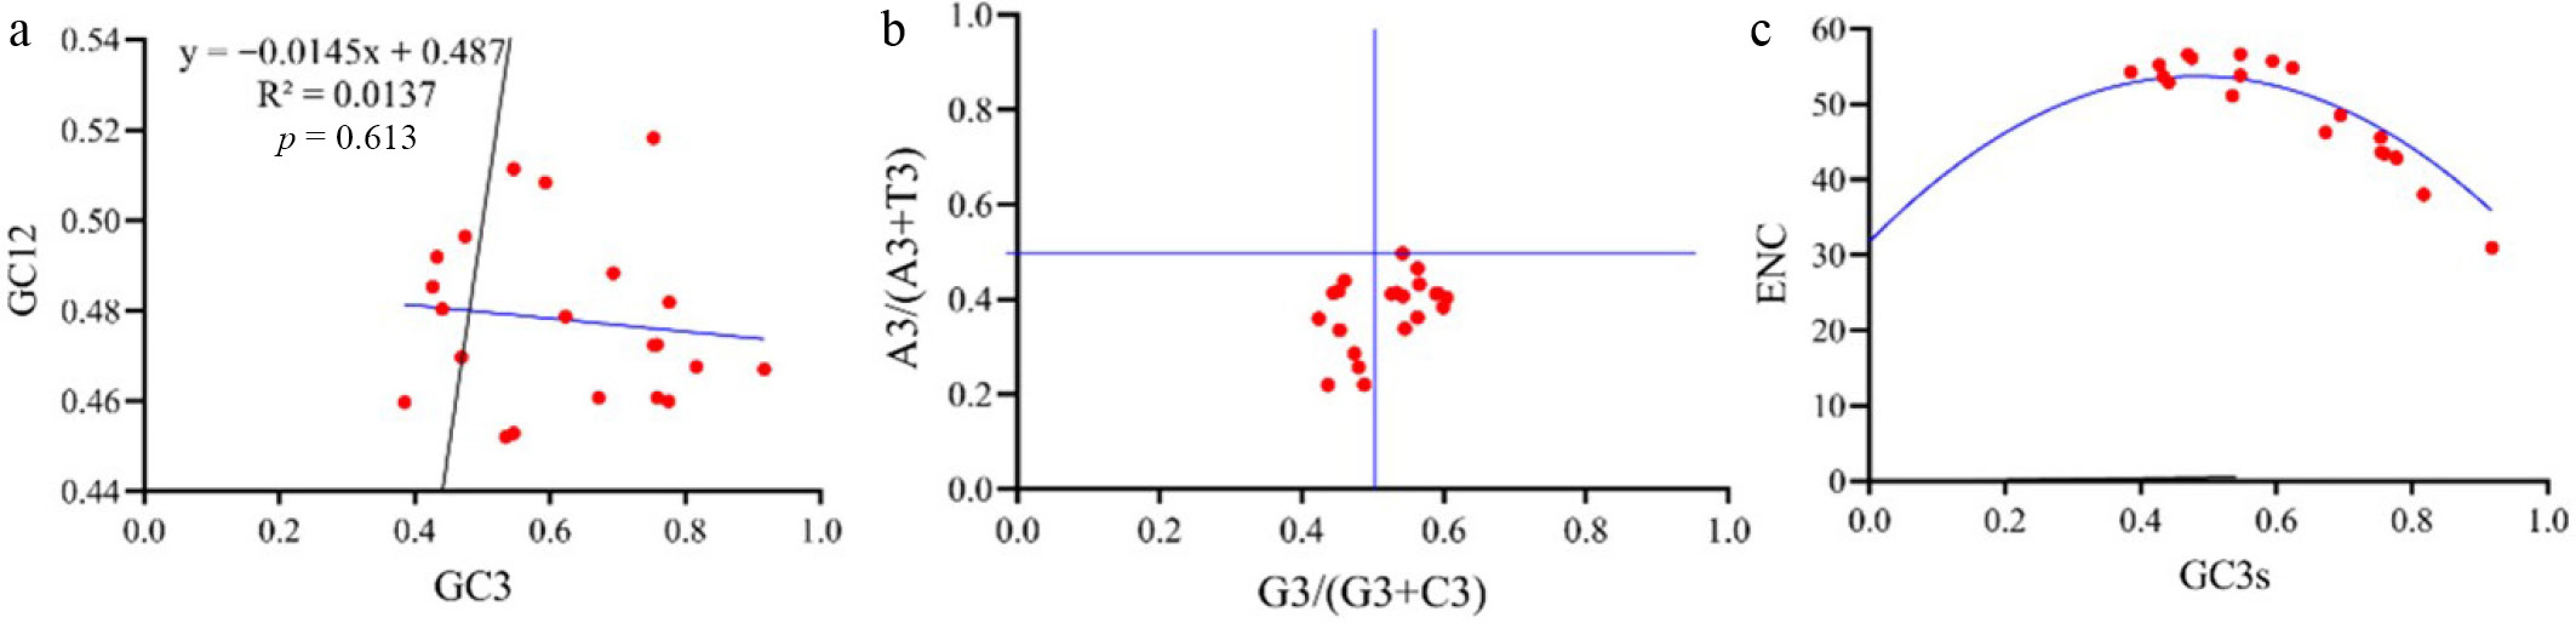
Figure 6.
(a) Neutrality plot analysis (the x axis is the frequency of the codon at the first and second position of G/C, and the y axis is the frequency of the codon at the third position of G/C). (b) PR2 bias plot analysis, with G3/(G3 + C3) as the x-axis and A3/(A3 + T3) as the y-axis. G3, C3, A3, and T3 are the contents of G, C, A, and T at the third codon position, respectively to get the PR2 plot (parity rule 2-plot) diagram. (c) ENC plot analysis using ENC as the ordinate and the C and G content (GC3) of the codon at Position 3 as the abscissa to draw a scatter plot to obtain the ENC plot.
-
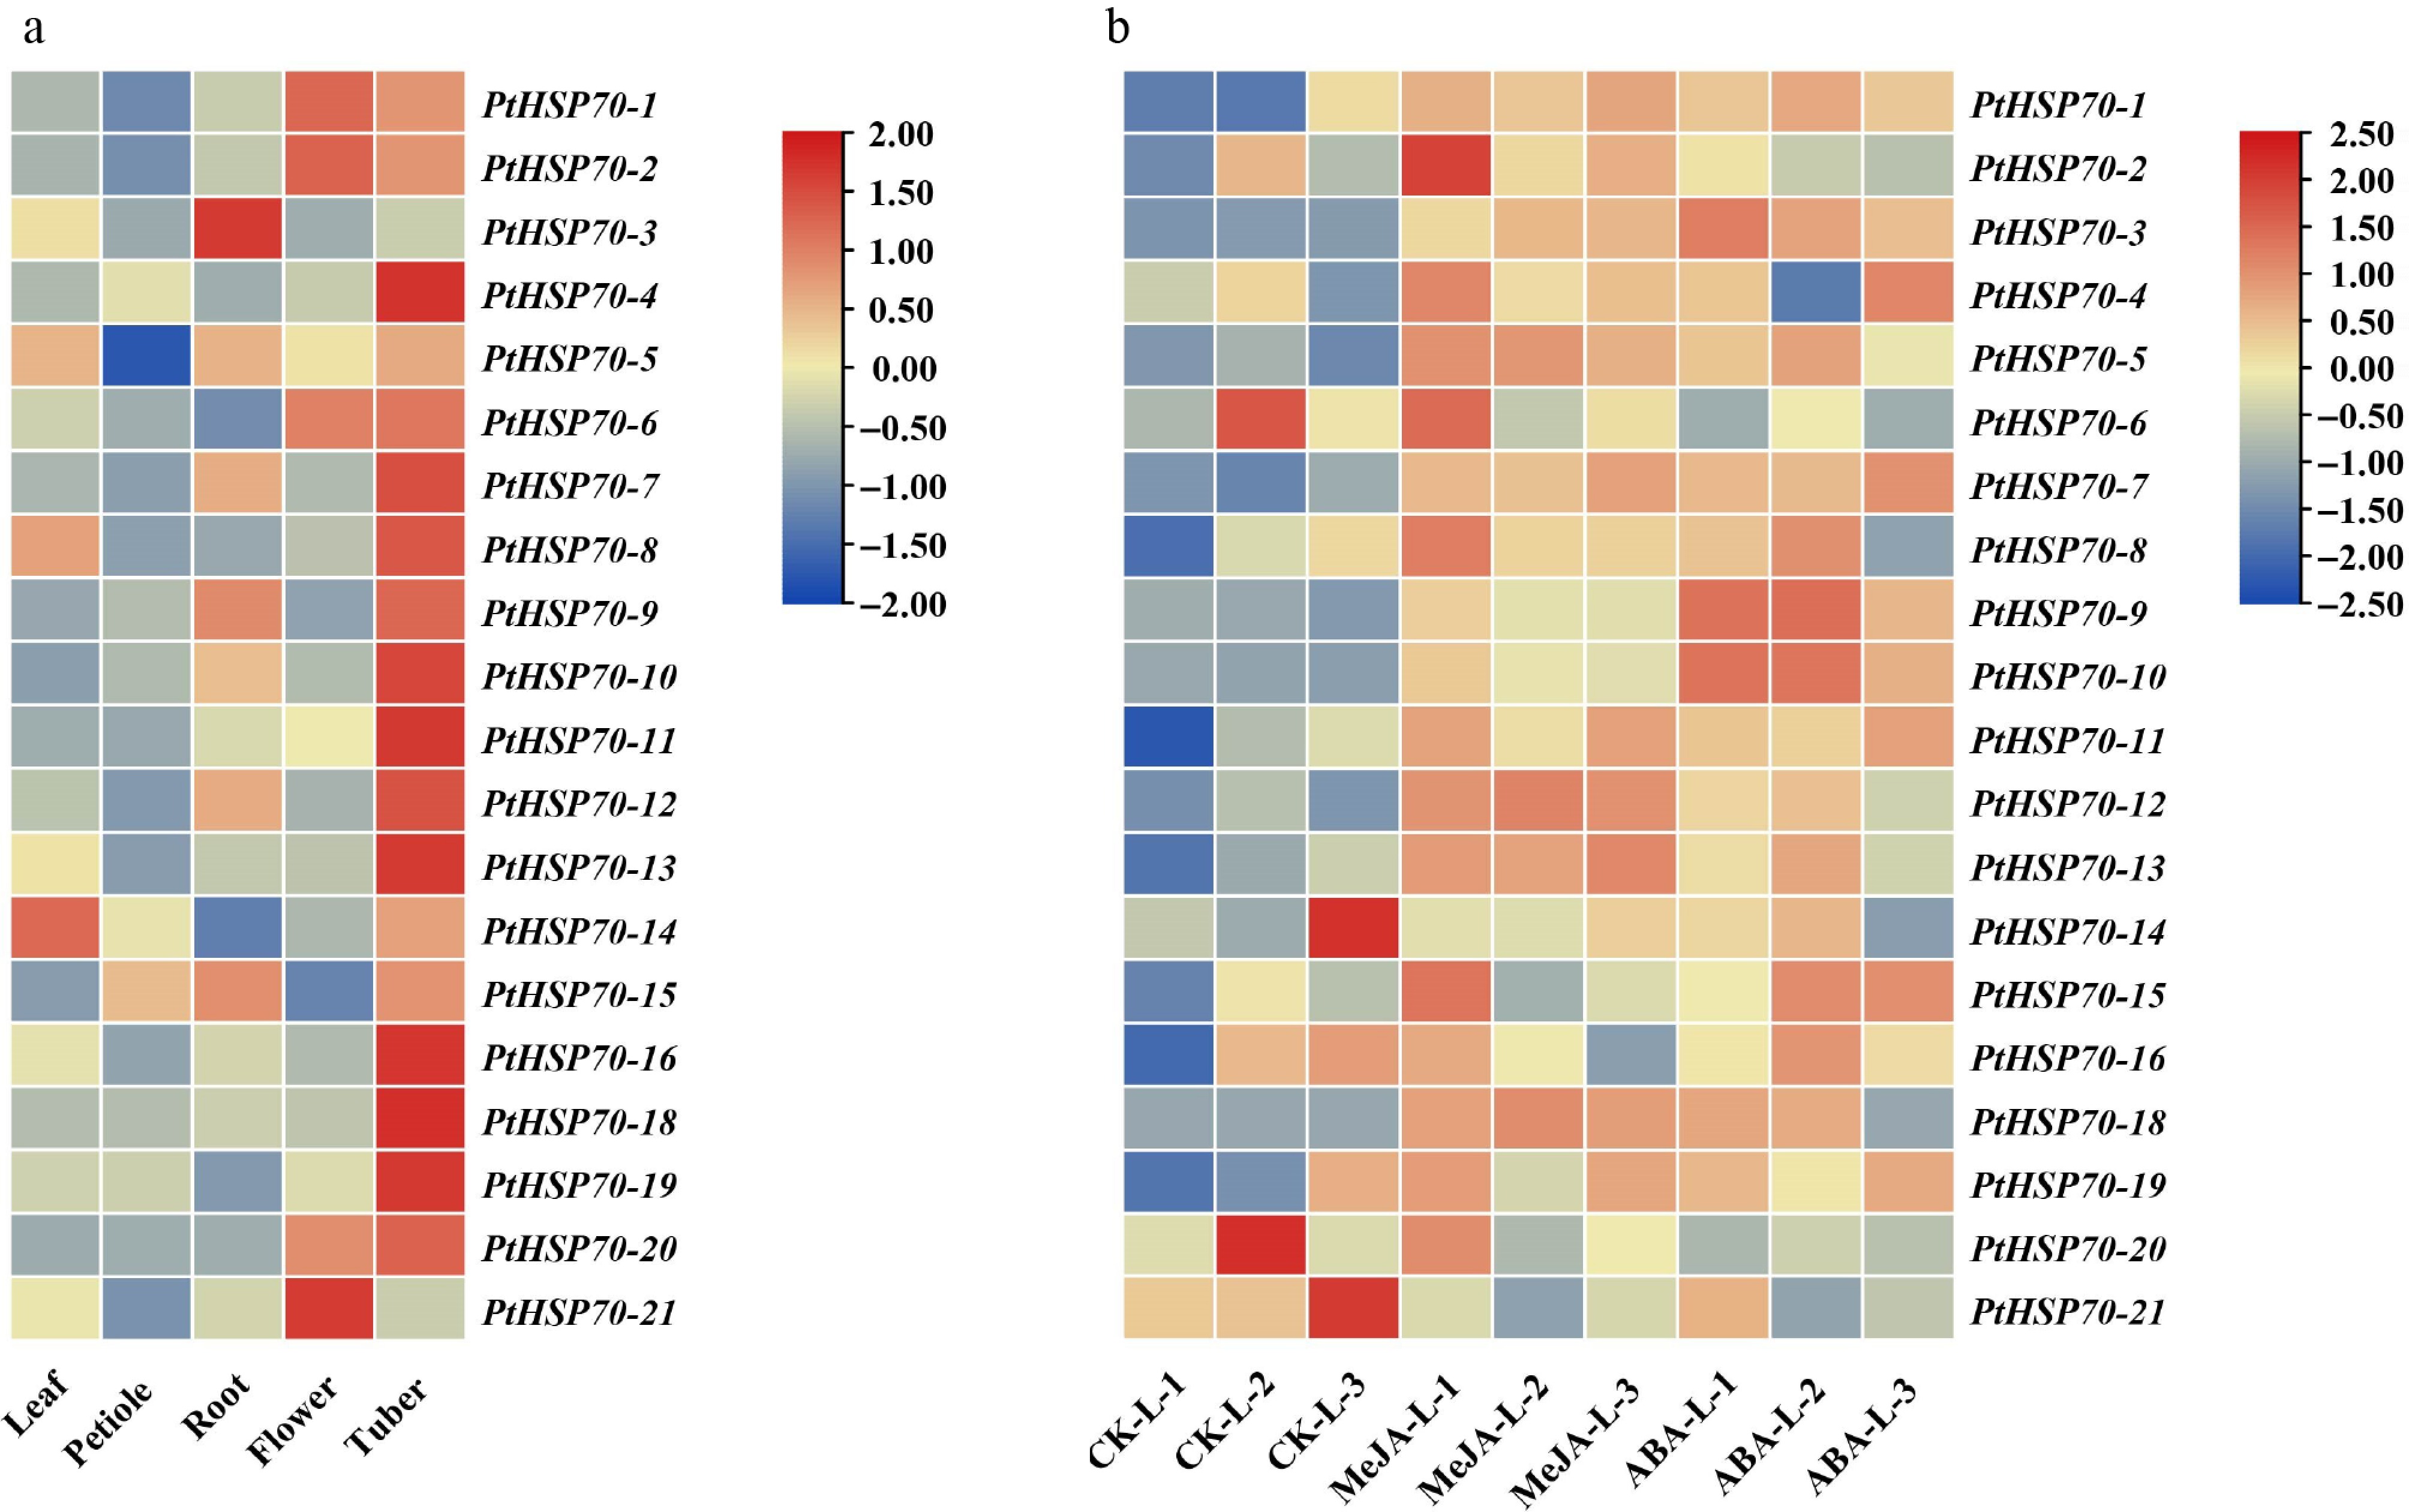
Figure 7.
Expression profiles of PtHSP70 genes in different tissues and in response to phytohormone treatments. (a) Tissue-specific expression profiles of PtHSP70 genes in P. ternata (leaf, petiole, root, flower, and tuber). The color scale on the right represents the expression level, with red indicating high transcript abundance and blue indicating low transcript abundance. (b) Expression patterns of PtHSP70 genes under MeJA and ABA treatments. The heatmap shows the relative expression levels (log2 fold change) of 21 PtHSP70 genes in P. ternata under control (CK), 100 μM MeJA, and 100 μM ABA treatments (three biological replicates per treatment). Color intensity reflects the magnitude of expression: Red denotes upregulation (maximum log2 fold change = 2.50), blue denotes downregulation (minimum log2 fold change = −2.50), and yellow indicates no significant change (log2 fold change ≈ 0).
-
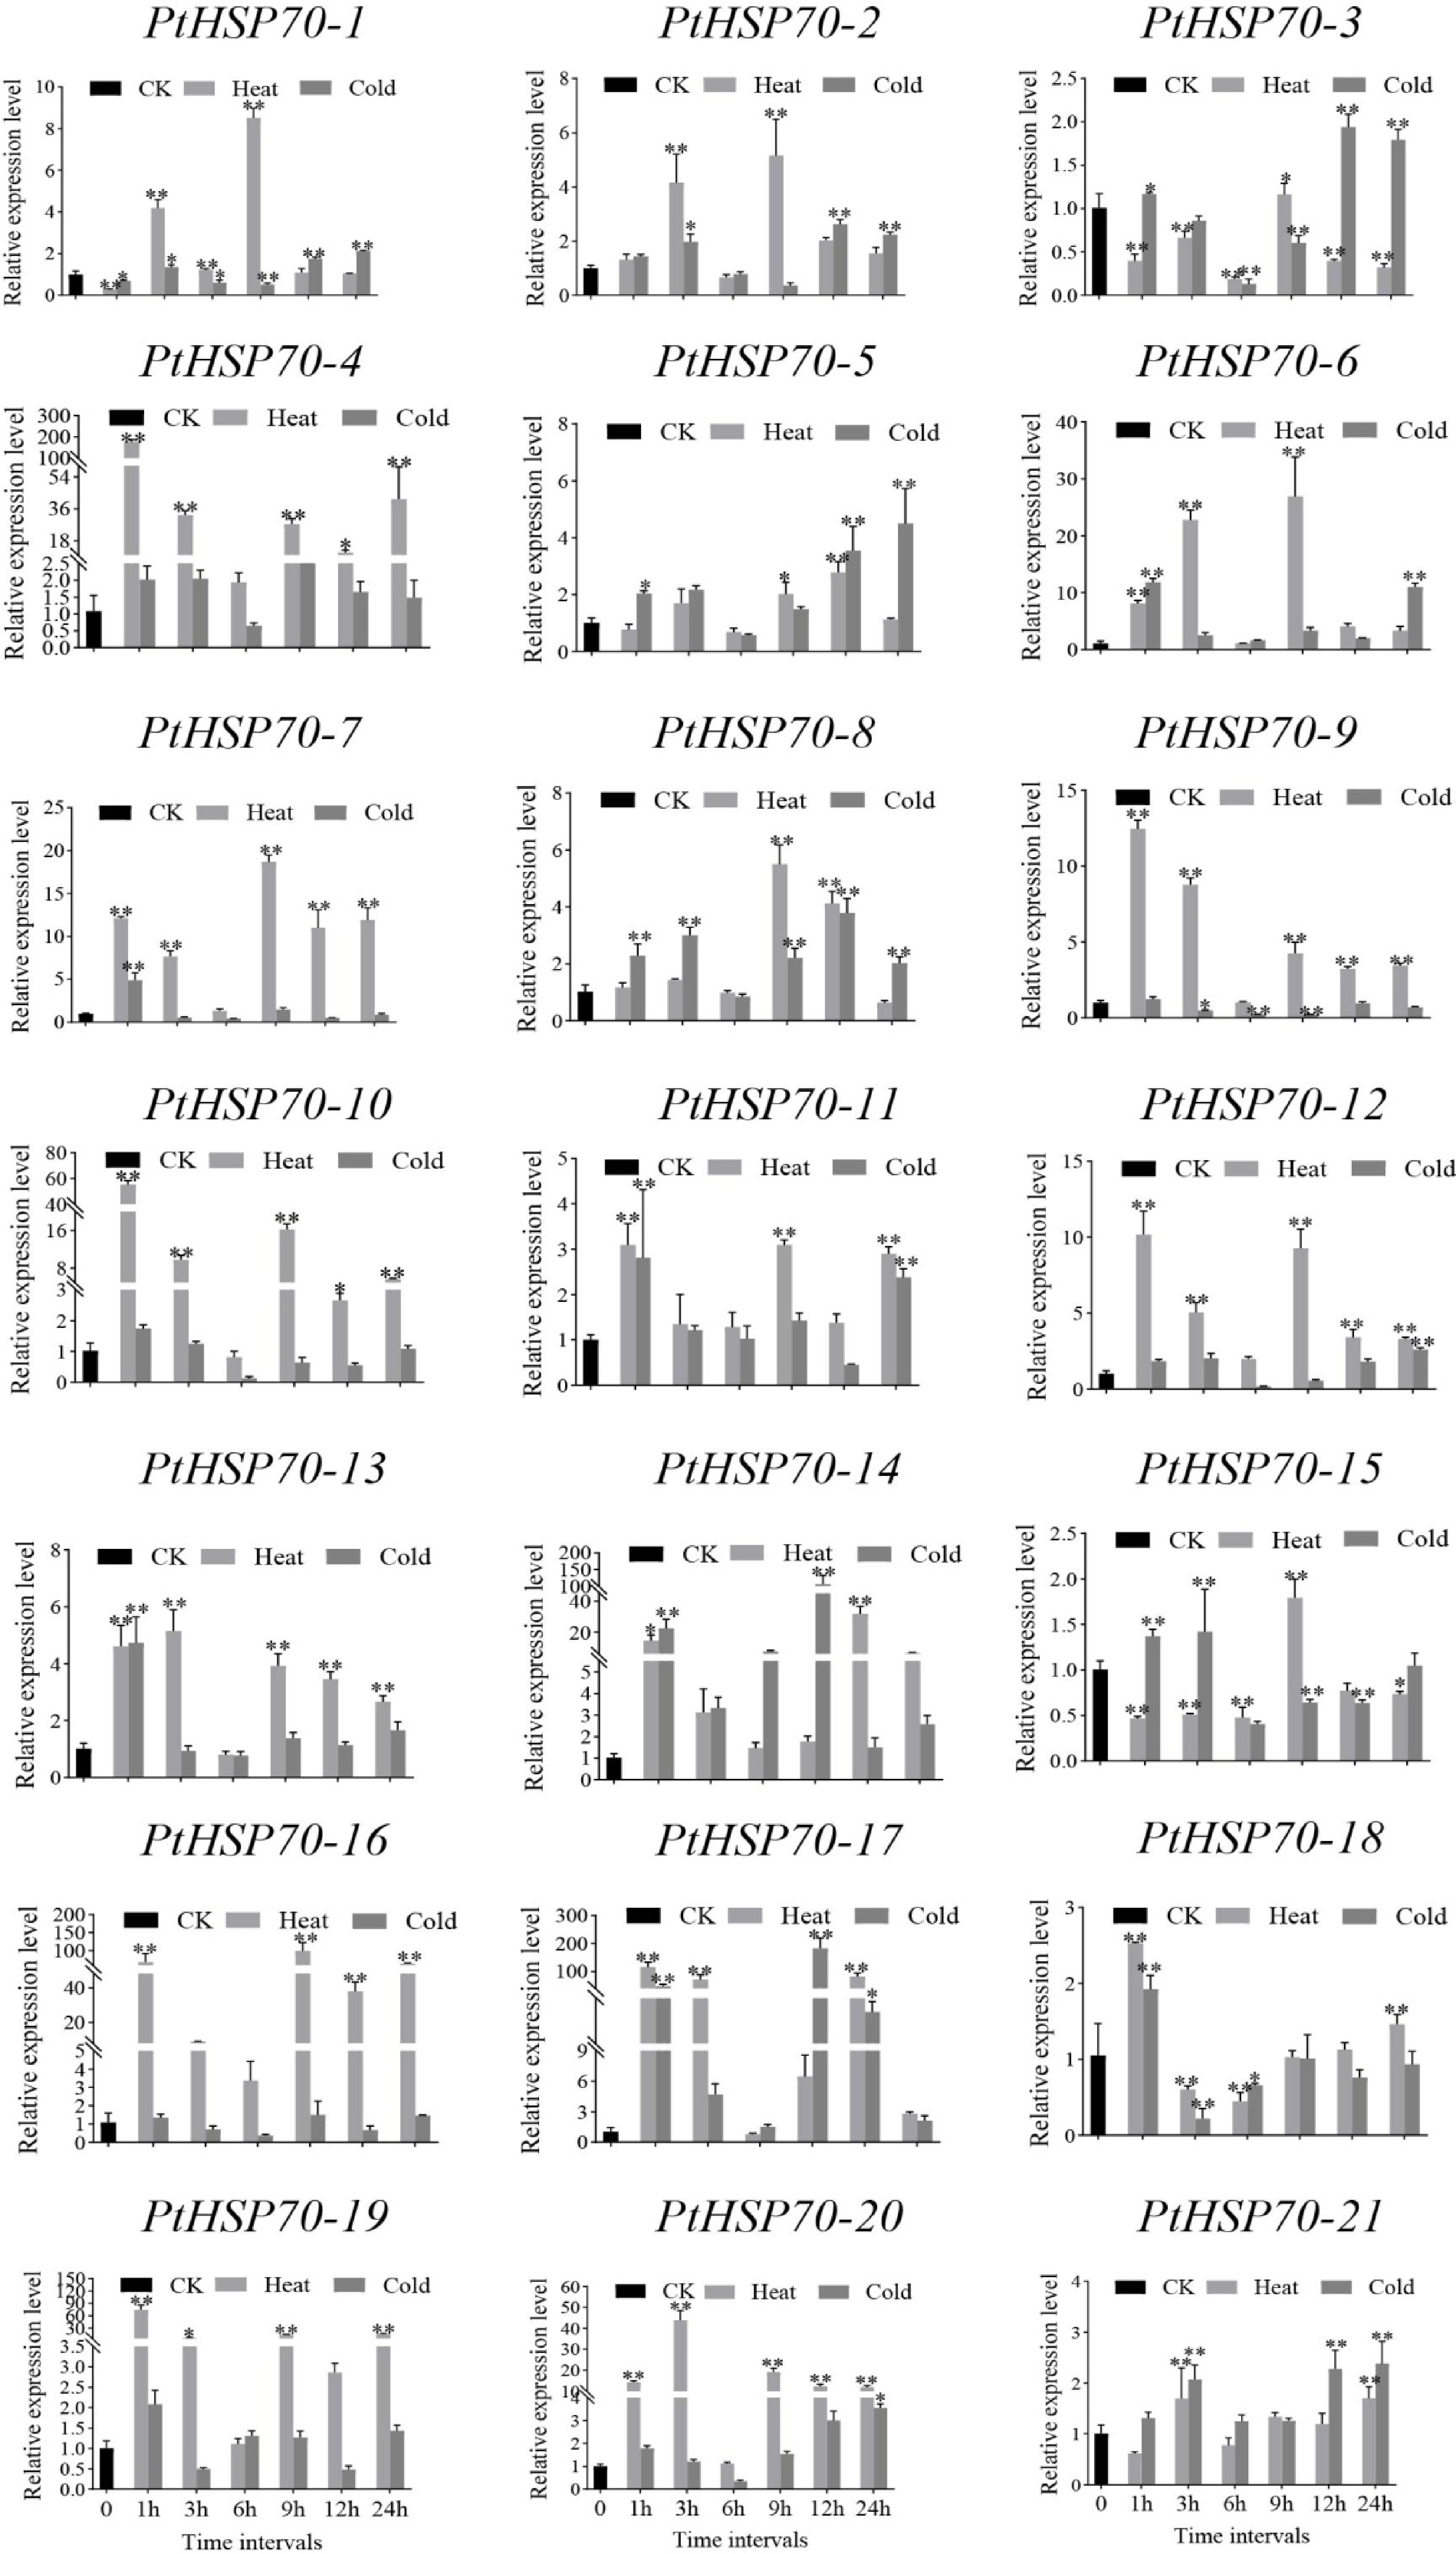
Figure 8.
Gene expression of 21 PtHSP70s under individual cold or heat stress at 0, 3, 6, 9, 12, and 24 h were analyzed using real-time qPCR.
Figures
(8)
Tables
(0)