-
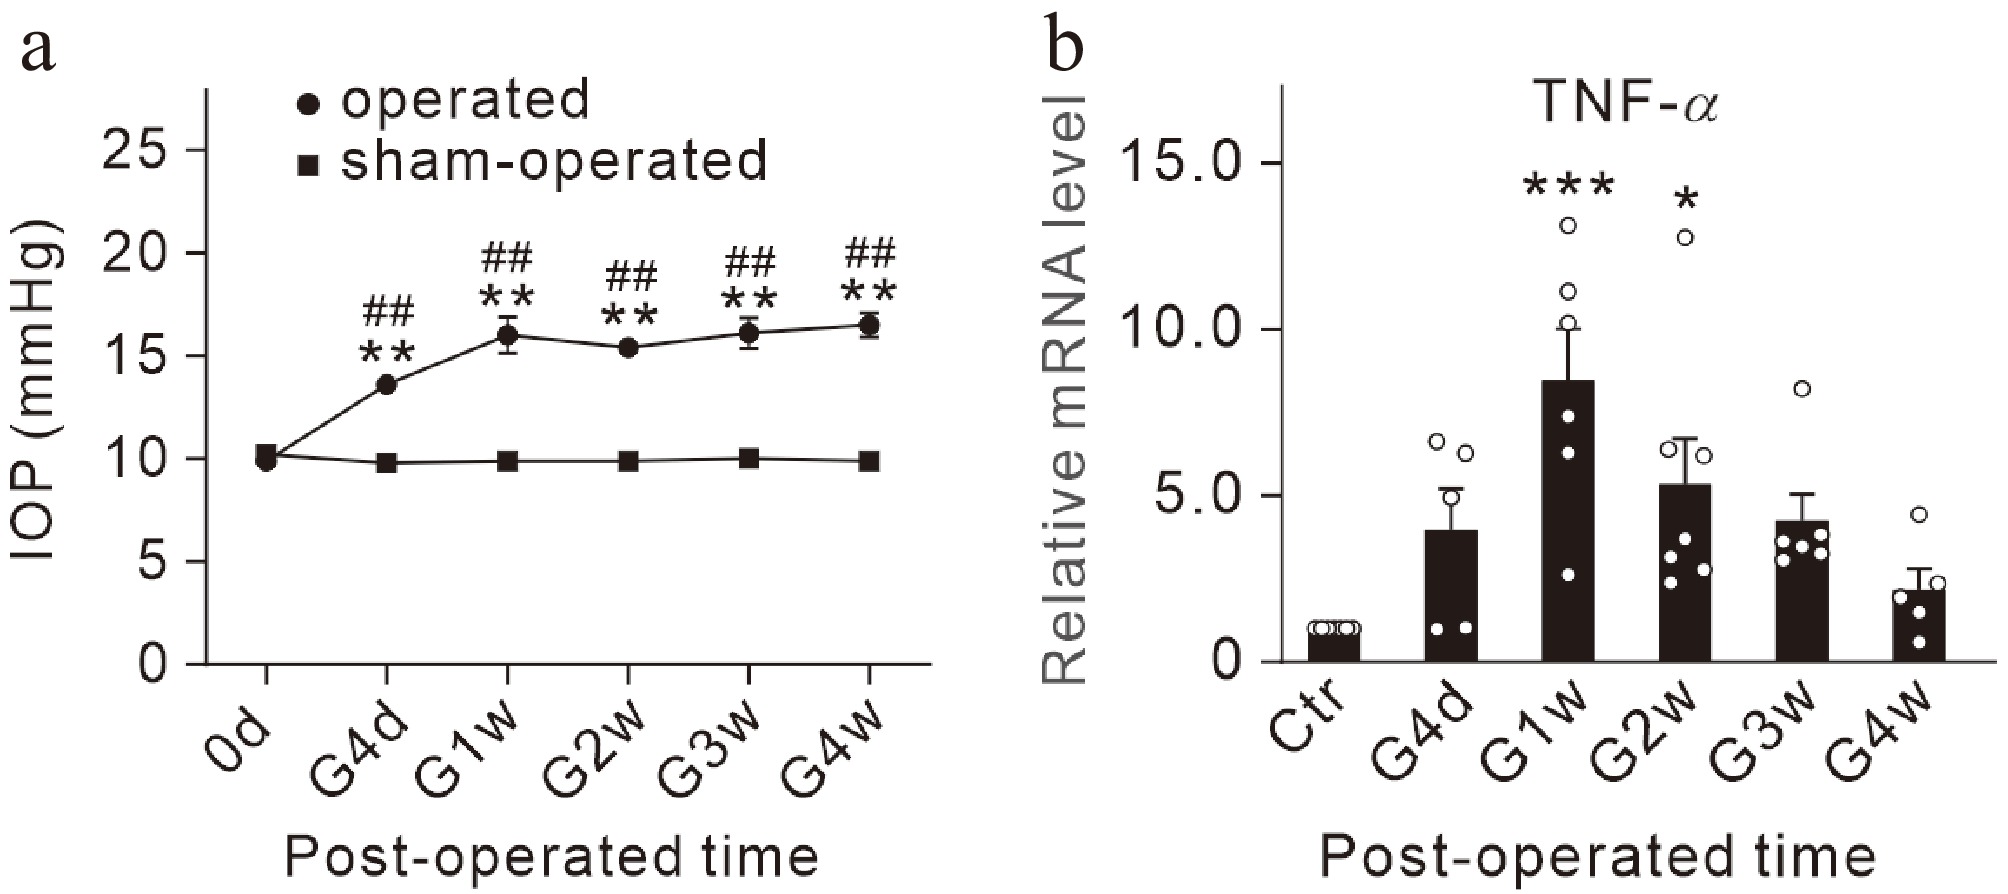
Figure 1.
Dynamic changes in mRNA levels of TNF-α in COH retinas. (a) Changes of IOP values in sham-operated and operated eyes. n = 10 for each group. ** p < 0.01 vs. 0 d; ## p < 0.01 vs. sham-operated eyes at the same time point. (b) Bar graph summarizing the average TNF-α mRNA levels in COH mice at different post-operational times. n = 5~7 for each group; * p < 0.05, and *** p < 0.001 vs. the data before operation (control, Ctr).
-
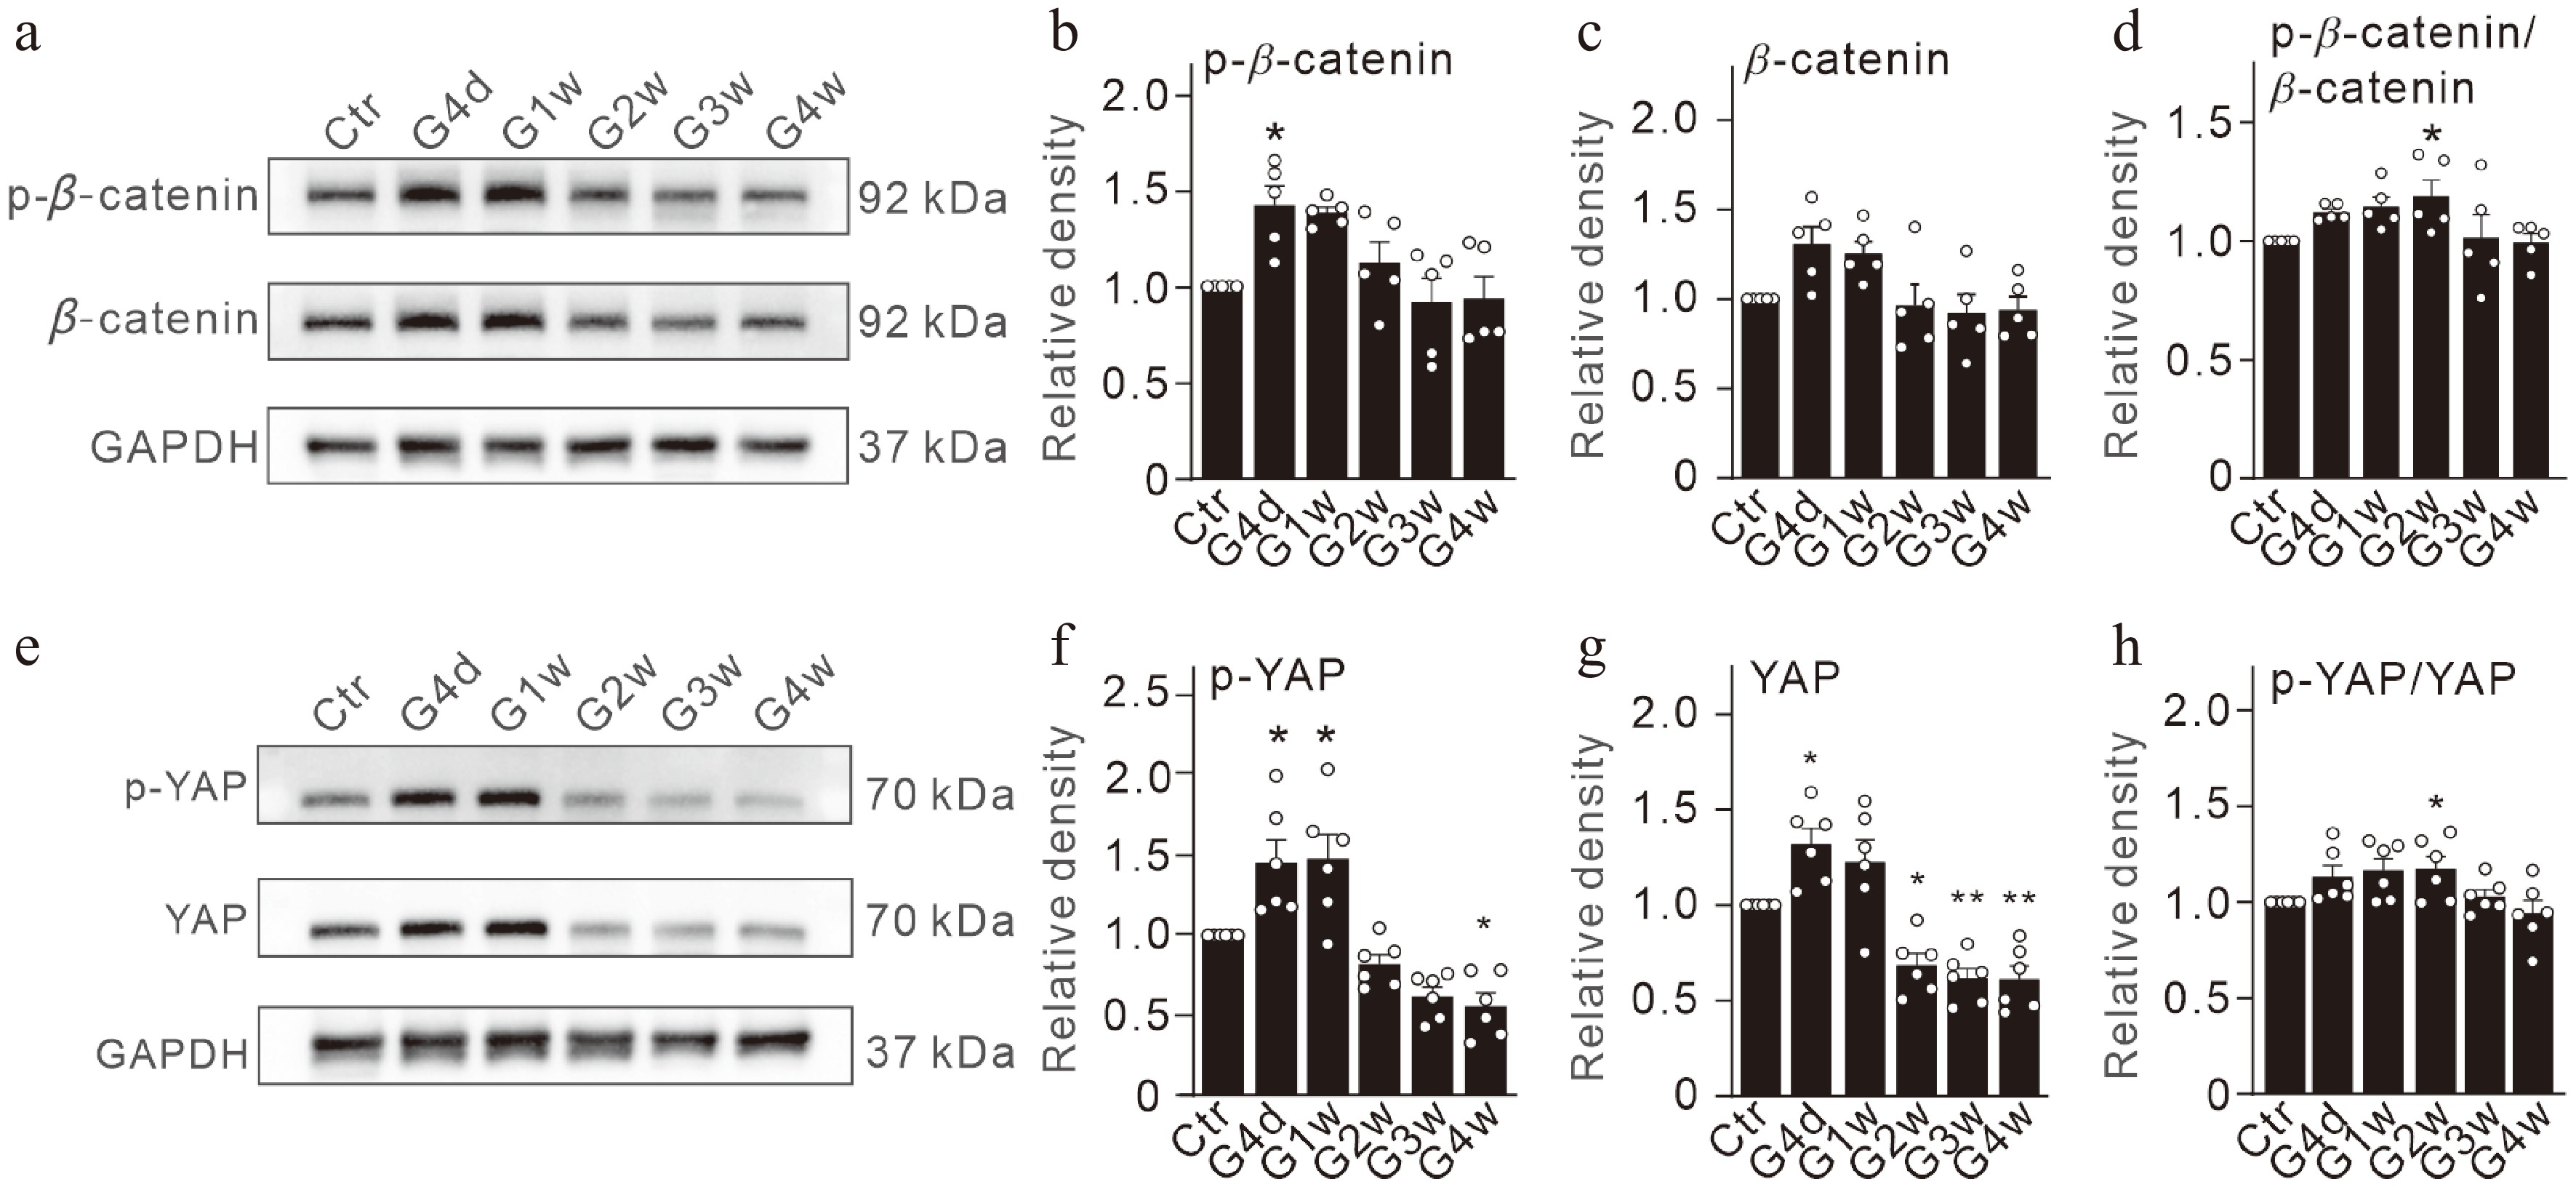
Figure 2.
Changes in the expression of β-catenin and YAP in COH retinas. (a) Representative immunoblots showing changes in p-β-catenin and β-catenin in retinas at different times after the operation (G4d, G1w, G2w, G3w, G4w). (b)−(d) Quantitative comparisons of the mean relative optical densities of immunoreactive bands of (b) p-β-catenin, (c) β-catenin, and (d) p-β-catenin/β-catenin ratios under the conditions as shown in panel (a). All data are normalized to their corresponding GAPDH and then to the control (Ctr). (e) Representative immunoblots showing changes in p-YAP and YAP in retinas at different times after the operation (G4d, G1w, G2w, G3w, G4w). (f)−(h) Quantitative comparisons of the mean relative optical densities of immunoreactive bands of (f) p-YAP, (g) YAP, and (h) p-YAP/YAP ratios under the conditions as shown in panel (e). All data are normalized to their corresponding GAPDH and then to Ctr. n = 5~6 for each group. * p < 0.05, and ** p < 0.01 vs. Ctr.
-
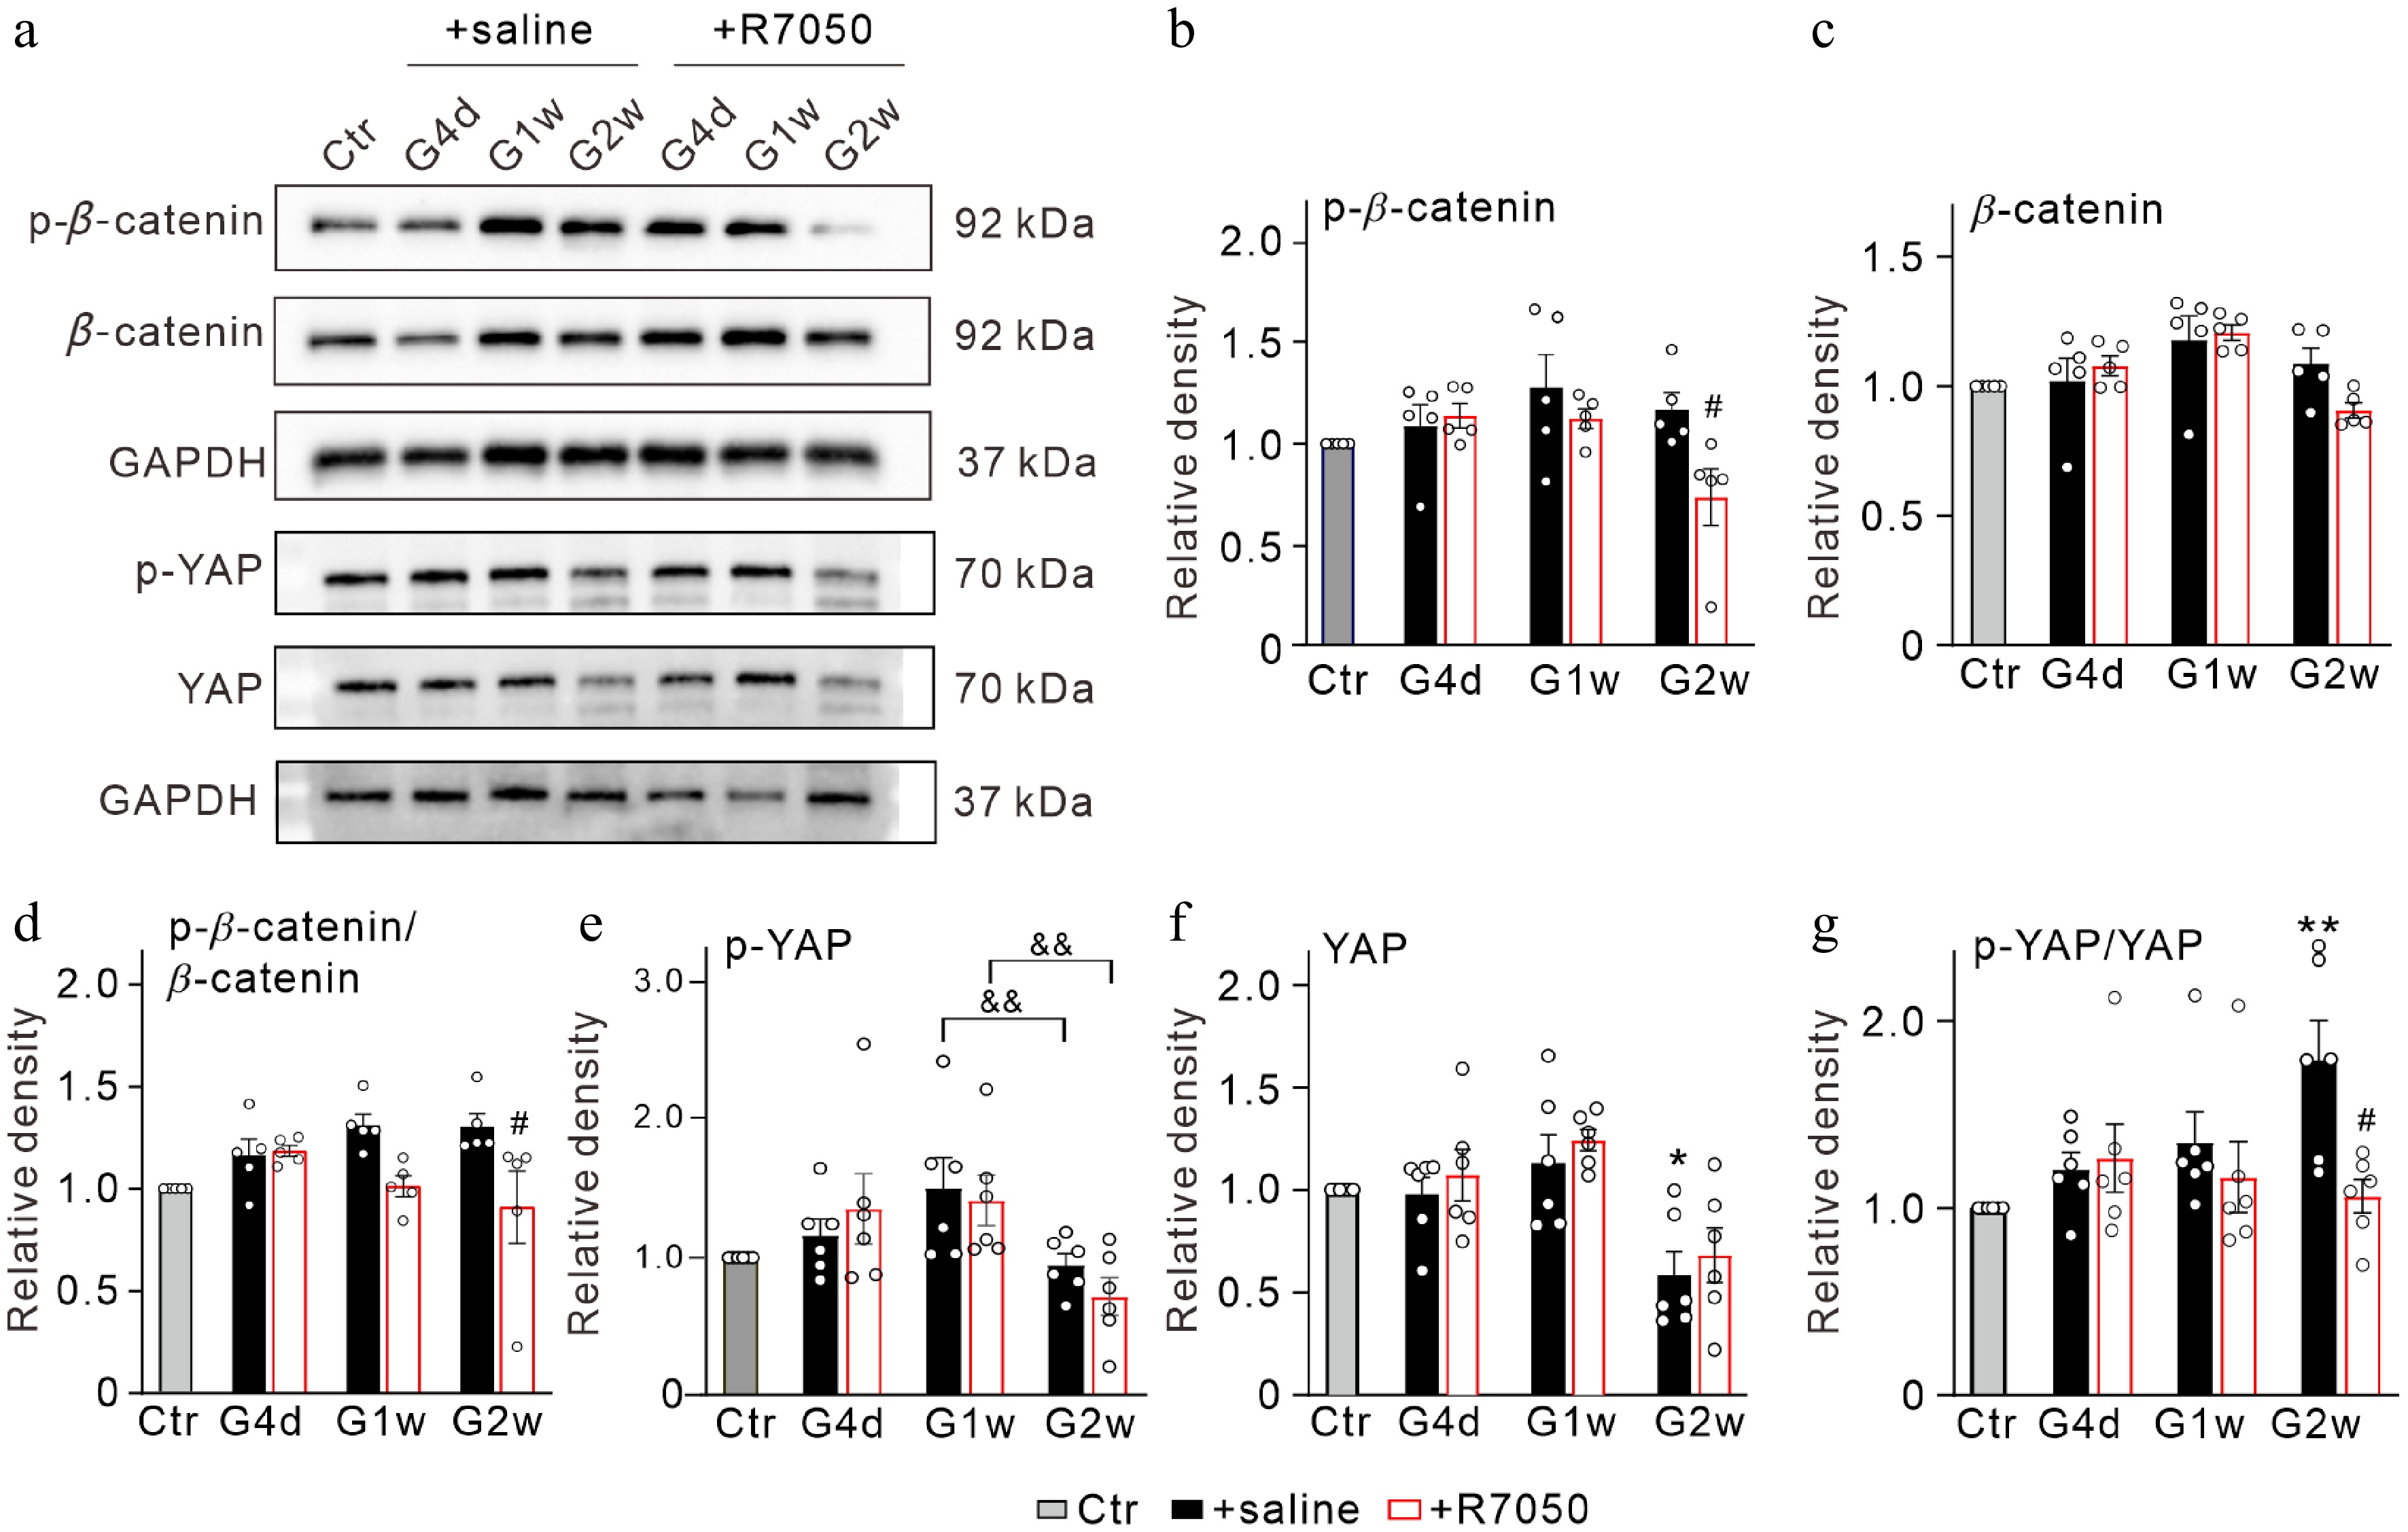
Figure 3.
TNF-α-mediated changes in β-catenin and YAP in COH retinas. (a) Representative immunoblots showing the changes in β-catenin and YAP expression in control (Ctr) and COH retinas with intravitreal injections of saline (2 μL) or 10 μM R7050 (2 μL) at different times postoperatively (G4d, G1w, G2w). (b)–(d) Bar charts comparing the average relative optical densities of immunoreactive bands of (b) p-β-catenin, (c) β-catenin, and (d) p-β-catenin/β-catenin ratios under the conditions as shown in panel (a). (e)–(g) Bar charts comparing the average relative optical densities of immunoreactive bands of (e) p-YAP, (f) YAP, and (g) p-YAP/YAP ratios under the conditions as shown in panel (a). All data are normalized to corresponding controls. n = 5~6 for each group. * p < 0.05, and ** p < 0.01 vs. Ctr; # p < 0.05 vs. corresponding + saline group at the same time point; && p < 0.01.
-
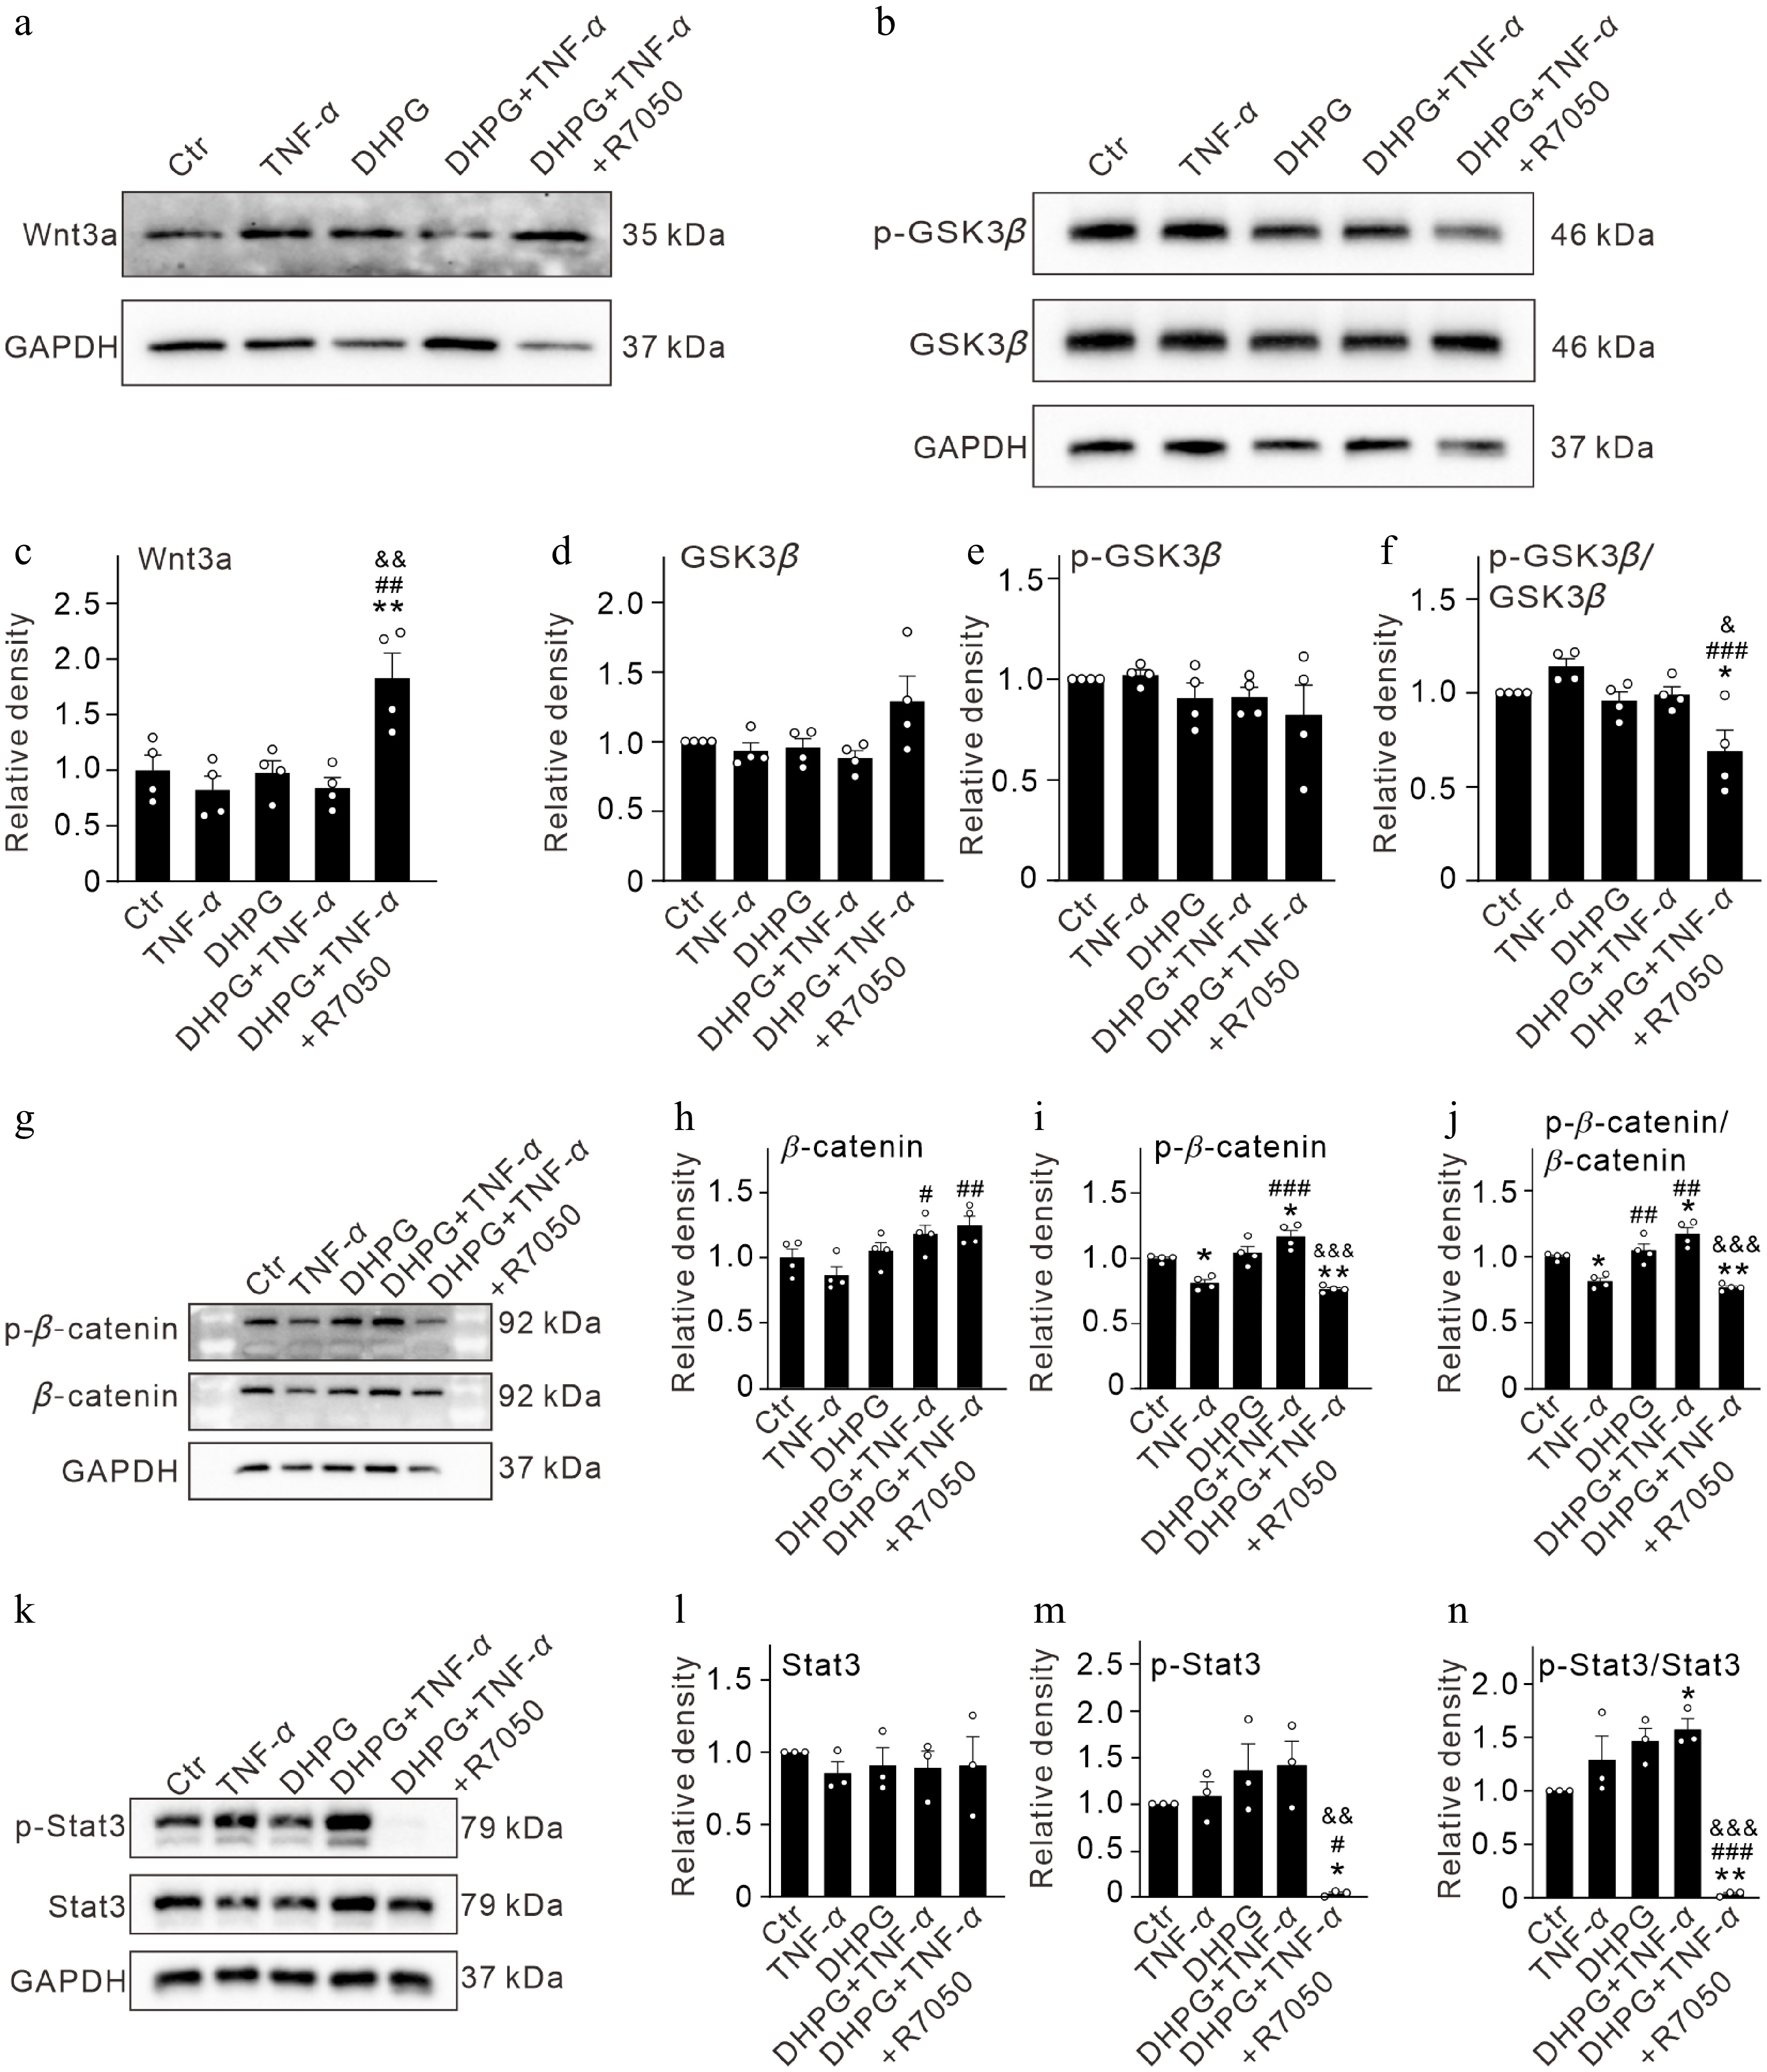
Figure 4.
TNF-α inhibits Wnt/β-catenin signaling pathways in activated Müller cells through activating TNFR1. (a) Representative immunoblots showing the changes in protein levels of Wnt3a in control (Ctr) and activated Müller cells (pretreated by 100 μM DHPG for 12 h) after treatment with TNF-α (10 ng/mL) and TNF-α + R7050 (10 μM) for 24 h. (b) Bar graphs summarizing the quantification of the average optical density of immunoreactive bands of Wnt3a proteins under different conditions as shown in panel (a). (c) Representative immunoblots showing the changes in protein levels of p-GSK3β and GSK3β in control (Ctr) and activated Müller cells (pretreated by 100 μM DHPG for 12 h) after treatment with TNF-α (10 ng/mL) and TNF-α + R7050 (10 μM) for 24 h. (d)–(f) Bar graphs summarizing the quantification of the average optical density of immunoreactive bands of p-GSK3β and GSK3β proteins, and p-GSK3β/GSK3β ratios under different conditions as shown in panel (c). (g) Representative immunoblots showing the changes in protein levels of p-catenin and catenin in control (Ctr) and activated Müller cells (pretreated by 100 μM DHPG for 12 h) after treatment with TNF-α (10 ng/mL) and TNF-α + R7050 (10 μM) for 24 h. (h)–(j) Bar graphs summarizing the quantification of the average optical density of immunoreactive bands of p-β-catenin and β-catenin proteins, and p-β-catenin/β-catenin ratios under different conditions as shown in panel (g). (k) Representative immunoblots showing the changes in protein levels of p-Stat3 and Stat3 in control (Ctr) and activated Müller cells (pretreated by 100 μM DHPG for 12 h) after treatment with TNF-α (10 ng/mL) and TNF-α + R7050 (10 μM) for 24 h. (h)–(j) Bar graphs summarizing the quantification of the average optical density of immunoreactive bands of p-Stat3 and Stat3 proteins, and p-Stat3/Stat3 ratios under different conditions as shown in panel (k). n = 3–4 for each group. * p < 0.05, and ** p < 0.01 vs. Ctr. ## p < 0.01, ### p < 0.001 vs. TNF-α. & p < 0.05, && p < 0.01, &&& p < 0.001 vs. DHPG + TNF-α.
-
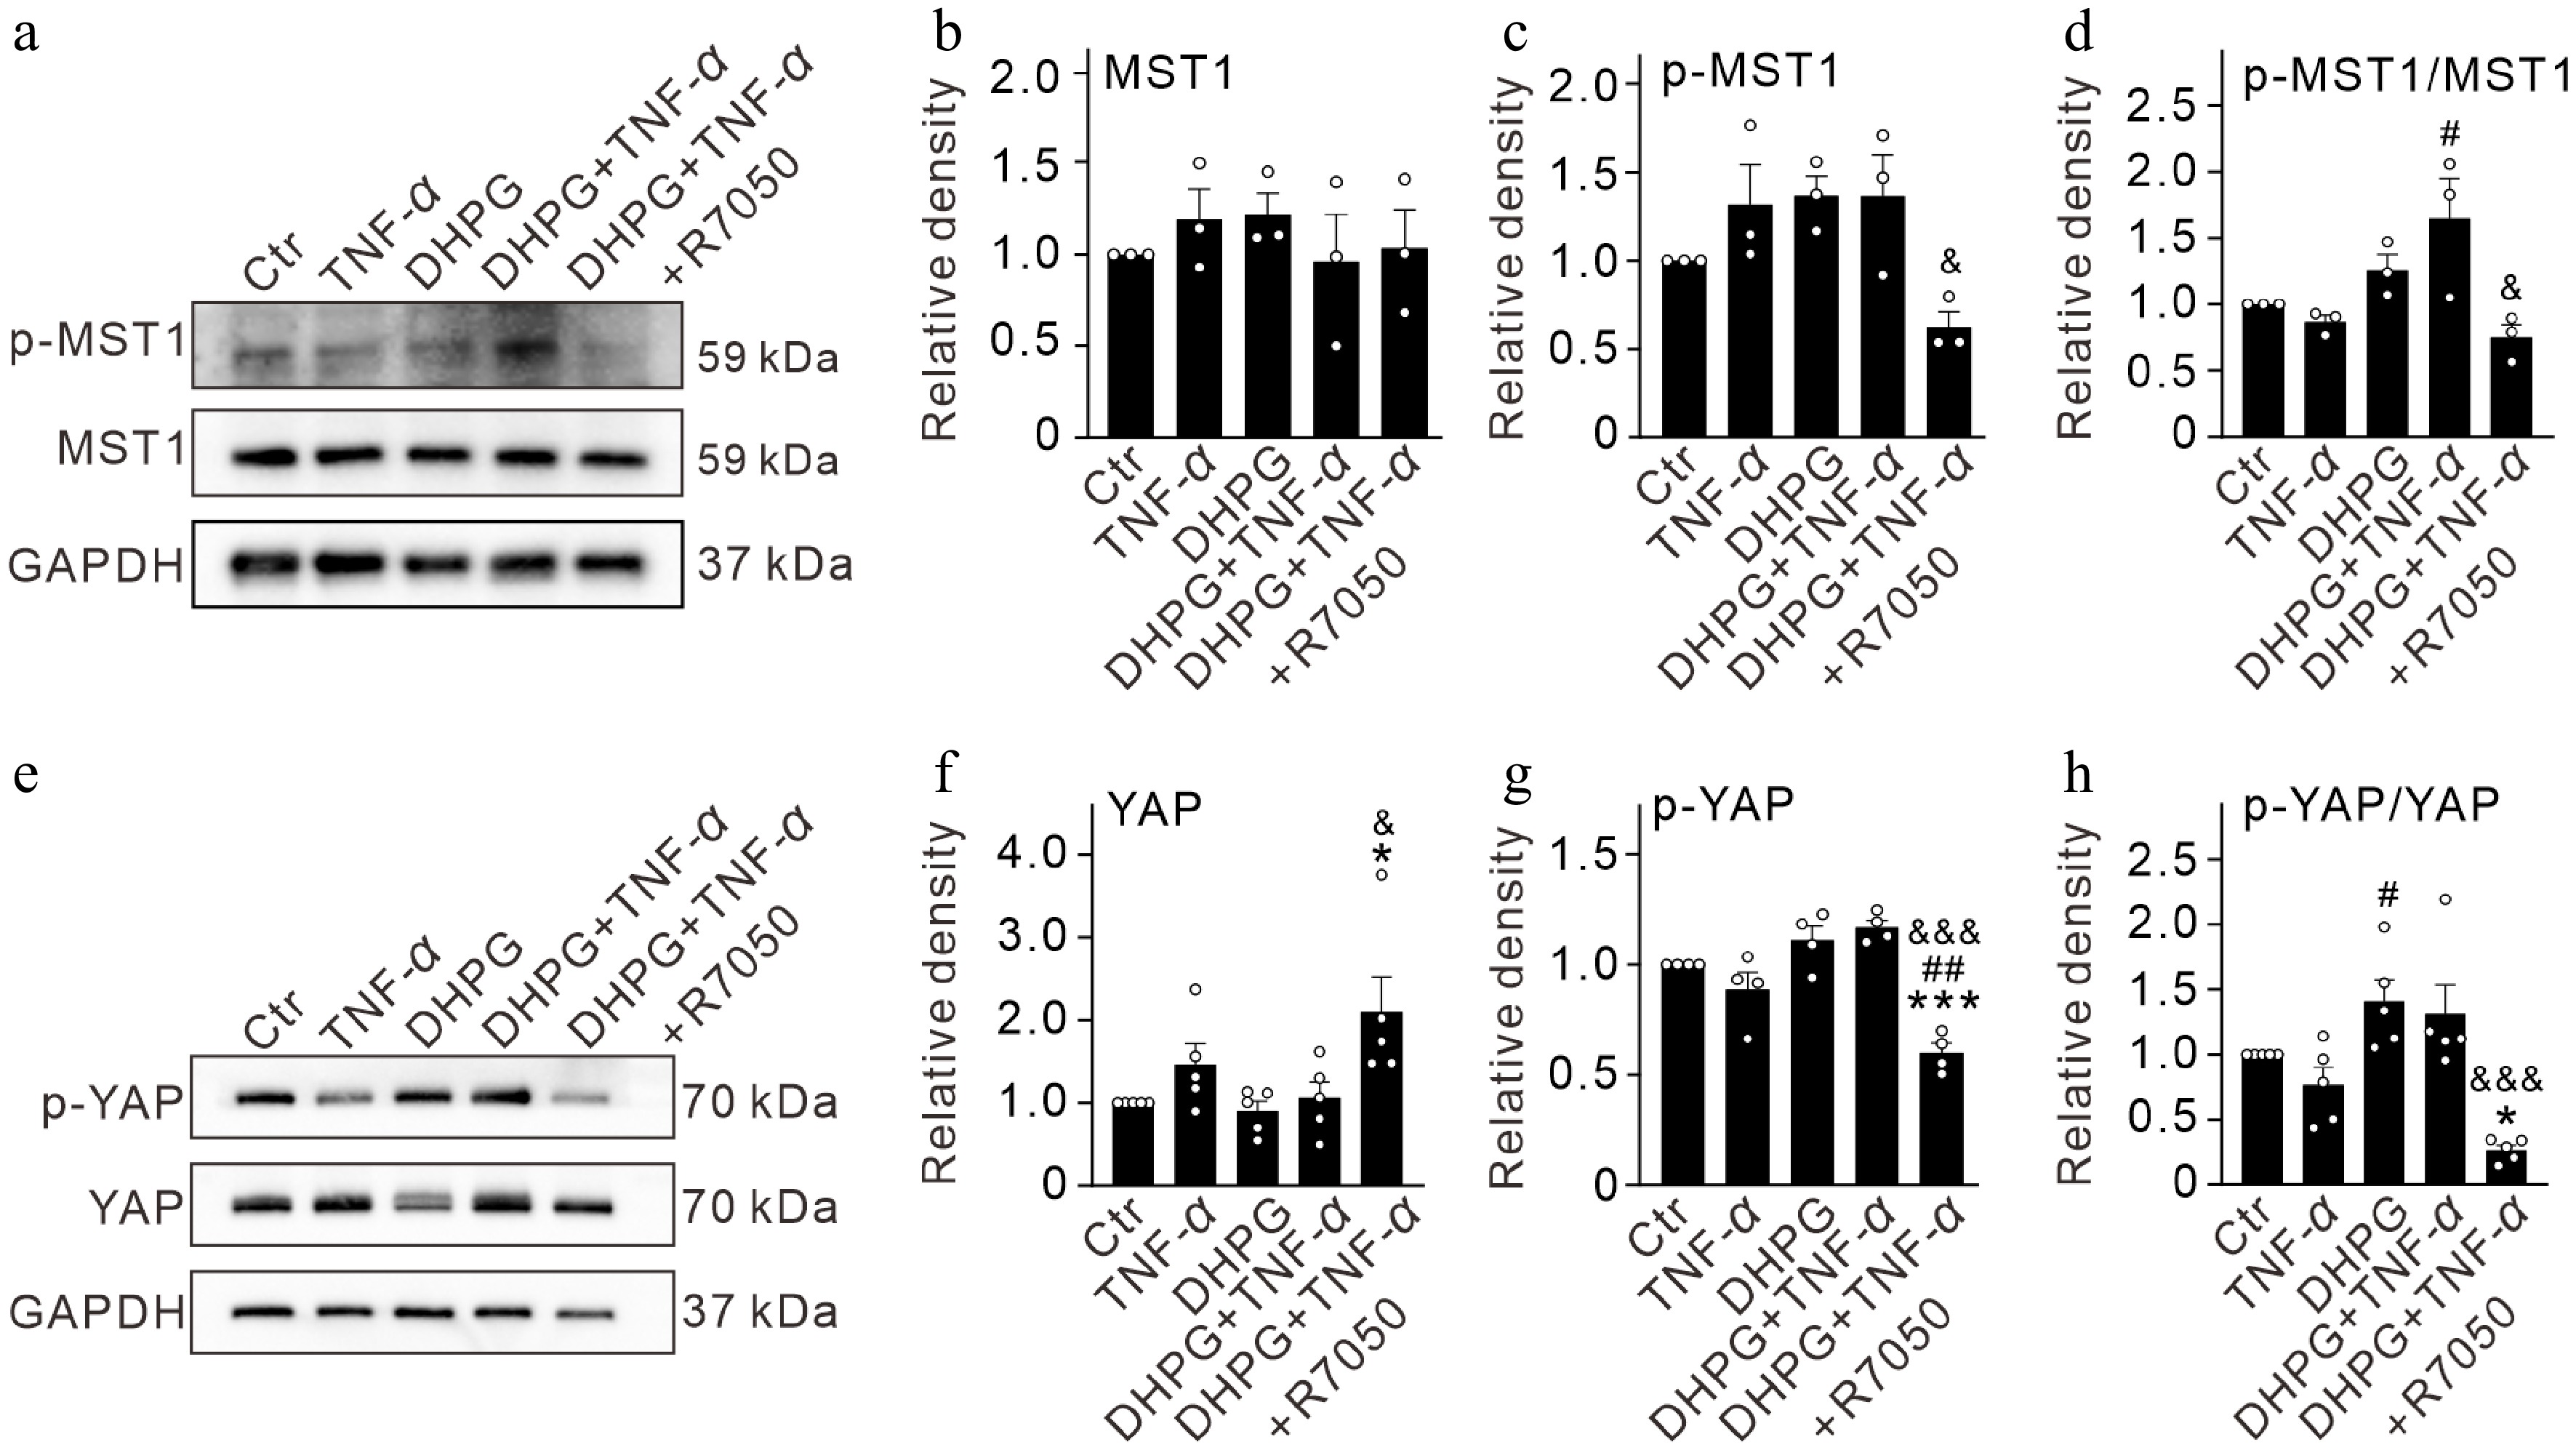
Figure 5.
TNF-α induced activation of Hippo signaling pathways in activated Müller cells by binding TNFR1 in vitro. (a) Representative immunoblots showing the changes in protein levels of p-MST1 and MST1 in control (Ctr) and activated Müller cells (pretreated by 100 μM DHPG for 12 h) after treatment with TNF-α (10 ng/mL) and TNF-α + R7050 (10 μM) for 24 h. (b)–(d) Bar graphs comparing the average optical density of the immunoreactive bands of MST1, p-MST1, and p-MST1/MST1 ratios under different conditions. (e) Representative immunoblots showing the changes in protein levels of p-YAP and YAP in control (Ctr) and activated Müller cells (pretreated by 100 μM DHPG for 12 h) after treatment with TNF-α (10 ng/mL) and TNF-α + R7050 (10 μM) for 24 h. (f)–(h) Bar graphs comparing the average optical density of the immunoreactive bands of YAP, p-YAP, and p-YAP/YAP ratios under different conditions. n = 3~5 for each group. * p < 0.05, and *** p < 0.001 vs. Ctr. # p < 0.05, and ## p < 0.01 vs. TNF-α, & p < 0.05, and &&& p < 0.001 vs. DHPG + TNF-α.
-
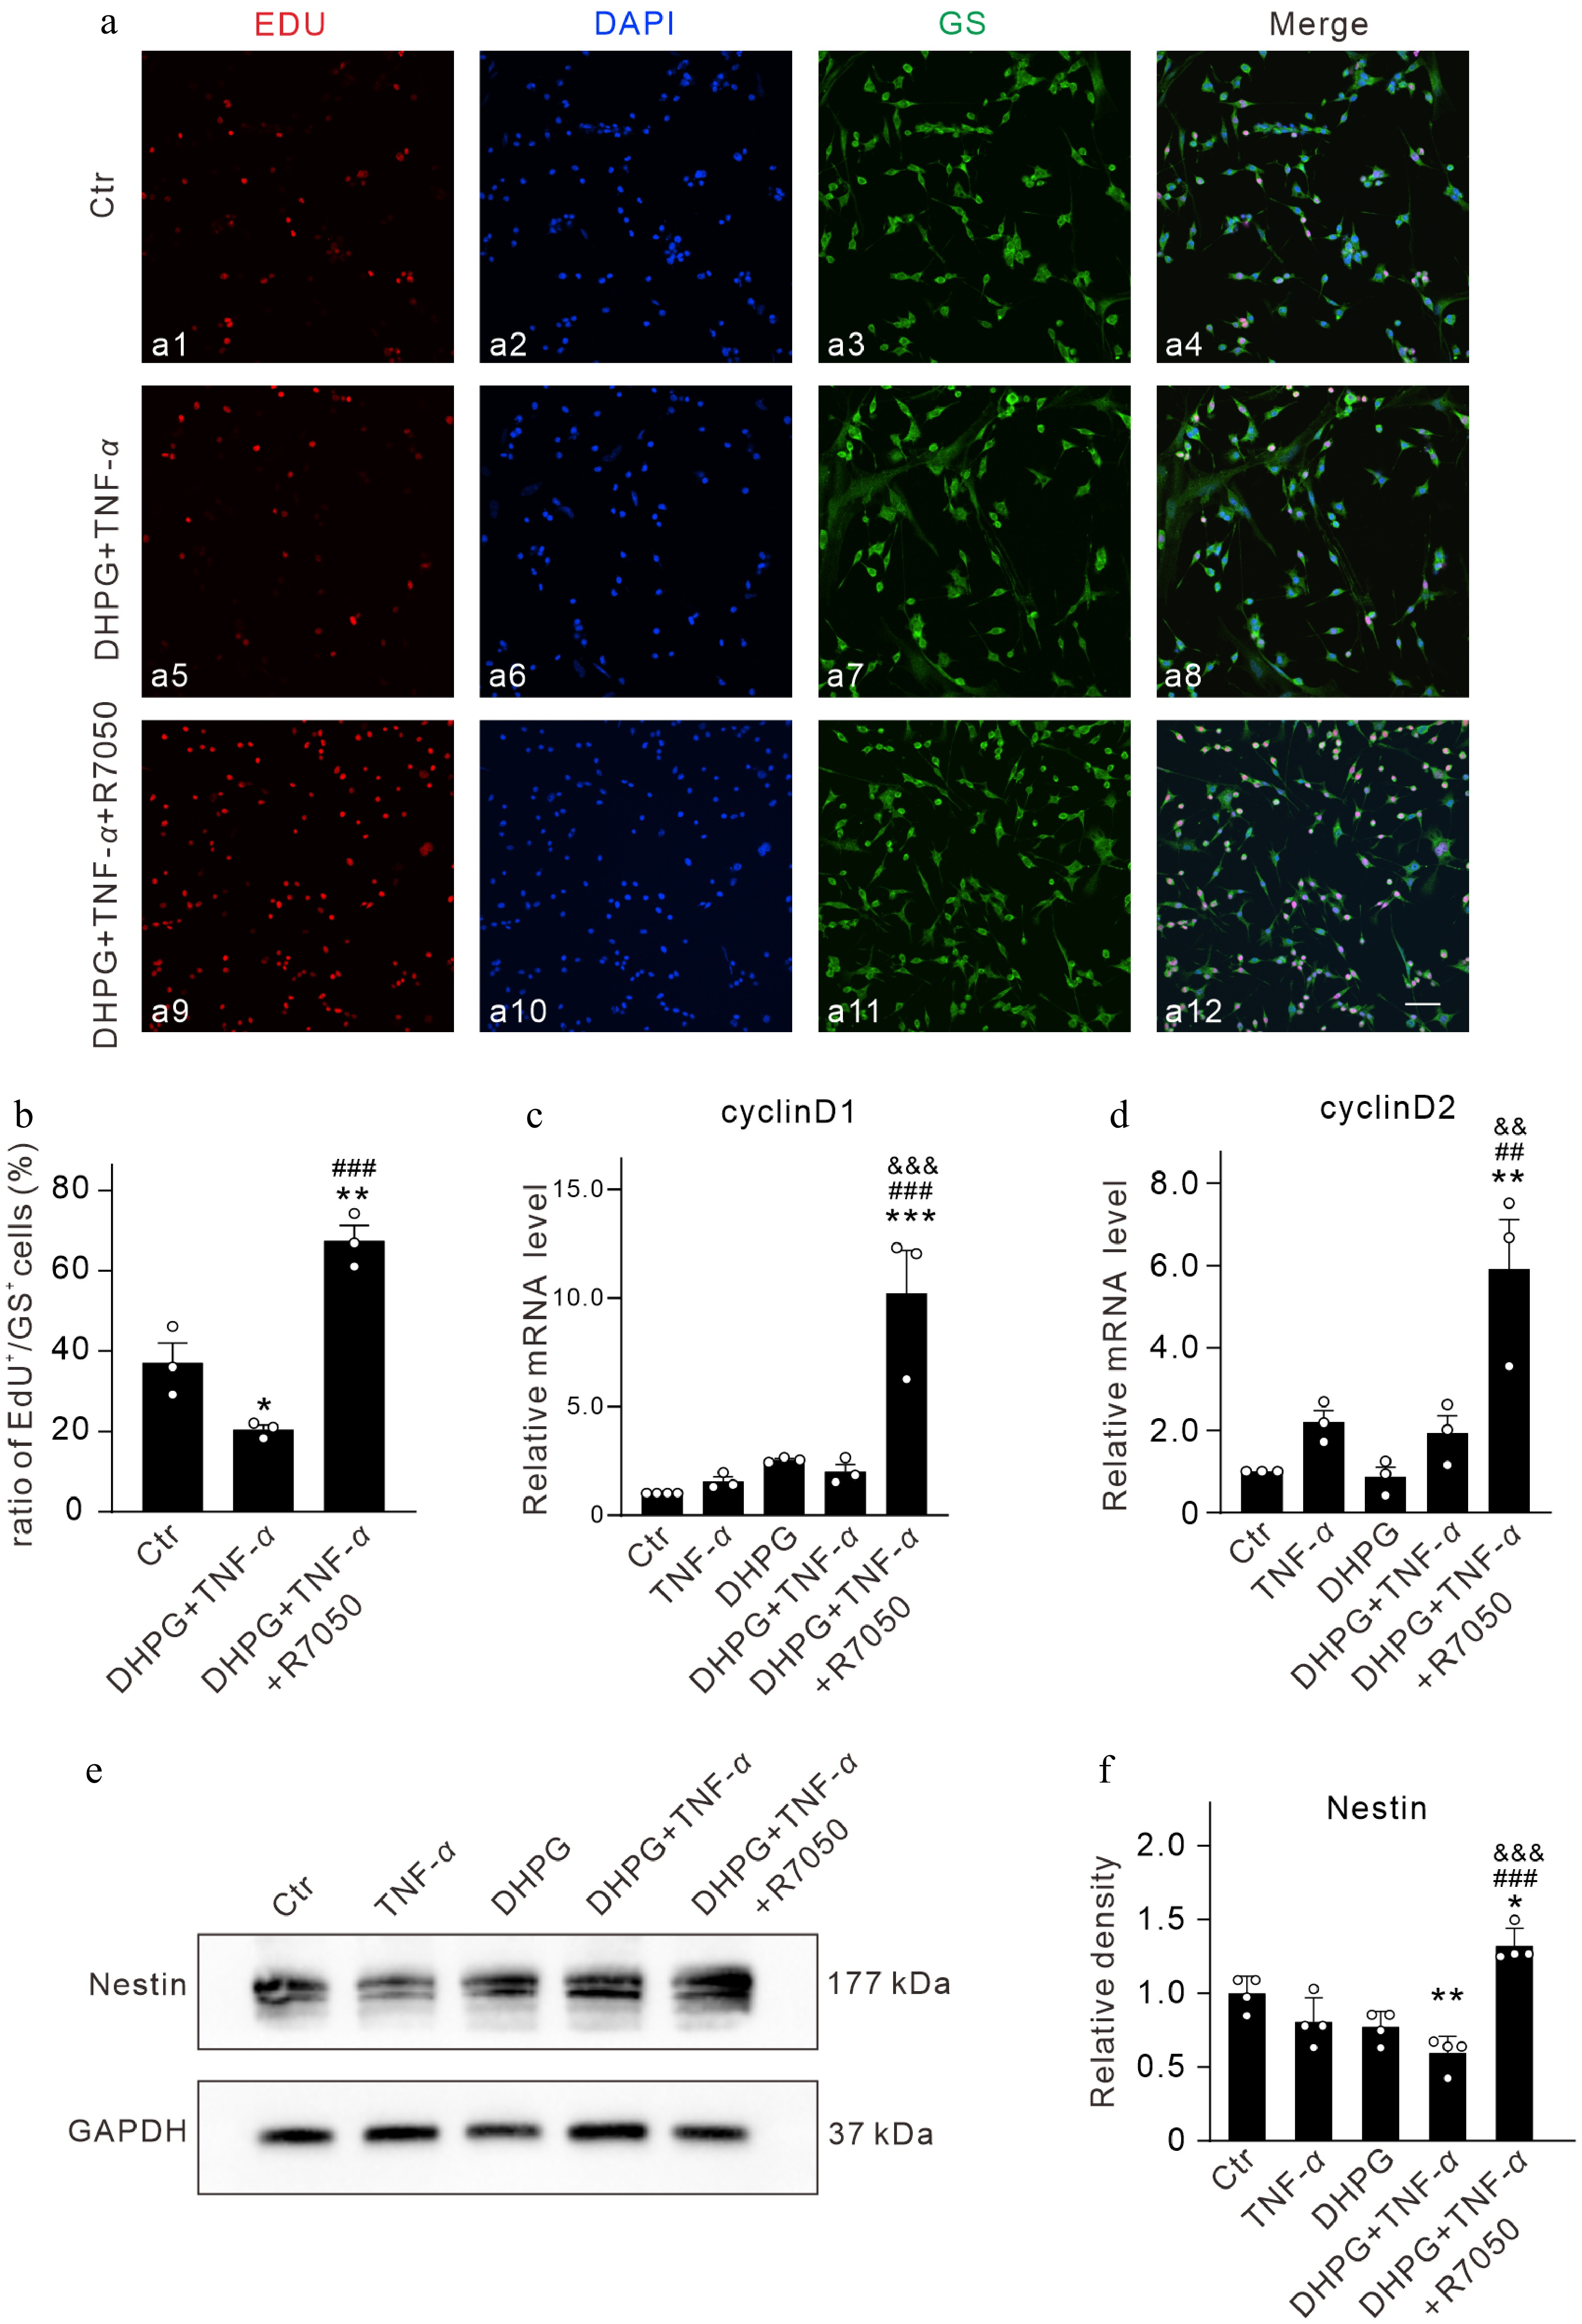
Figure 6.
TNF-α attenuates the proliferation and the ability of dedifferentiation of activated Müller cells via activating TNFR1 in vitro. (a) Representative images of EdU labeling in control (Ctr) and DHPG-activated Müller cells after treatment with TNF-α (10 ng/mL) and TNF-α + R7050 (10 μM) for 24 h. Nucleus were stained with DAPI. Scale bar is 100 μm for all images. (b) Summarized data showing the changes in percentage of Edu-labeled cells under different conditions. n = 3 for each group. * p < 0.05, and ** p < 0.01 vs. Ctr; ### p < 0.001 vs. DHPG + TNF-α. (c), (d) Bar graphs summarizing the average mRNA levels of (c) cyclinD1, and (d) cyclinD2 after 24 h of treatment with TNF-α and TNF-α + R7050. All data are normalized to corresponding controls. n = 3 for each group. ** p < 0.01, and *** p < 0.001 vs. Ctr. ## p < 0.01, and ### p < 0.001 vs. TNF-α. && p < 0.01, and &&& p < 0.001 vs. DHPG + TNF-α. (e) Representative immunoblots showing changes in Nestin expression in Ctr and DHPG-activated Müller cells after treatment with TNF-α (10 ng/mL) and TNF-α + R7050 (10 μM) for 24 h. (f) Bar graph quantifying the average density of Nestin immunoreactive bands under different conditions. All data are normalized to the Ctr. n = 4 for each group. * p < 0.05, and ** p < 0.01 vs. Ctr. ### p < 0.001 vs. TNF-α. &&& p < 0.001 vs. DHPG + TNF-α.
-
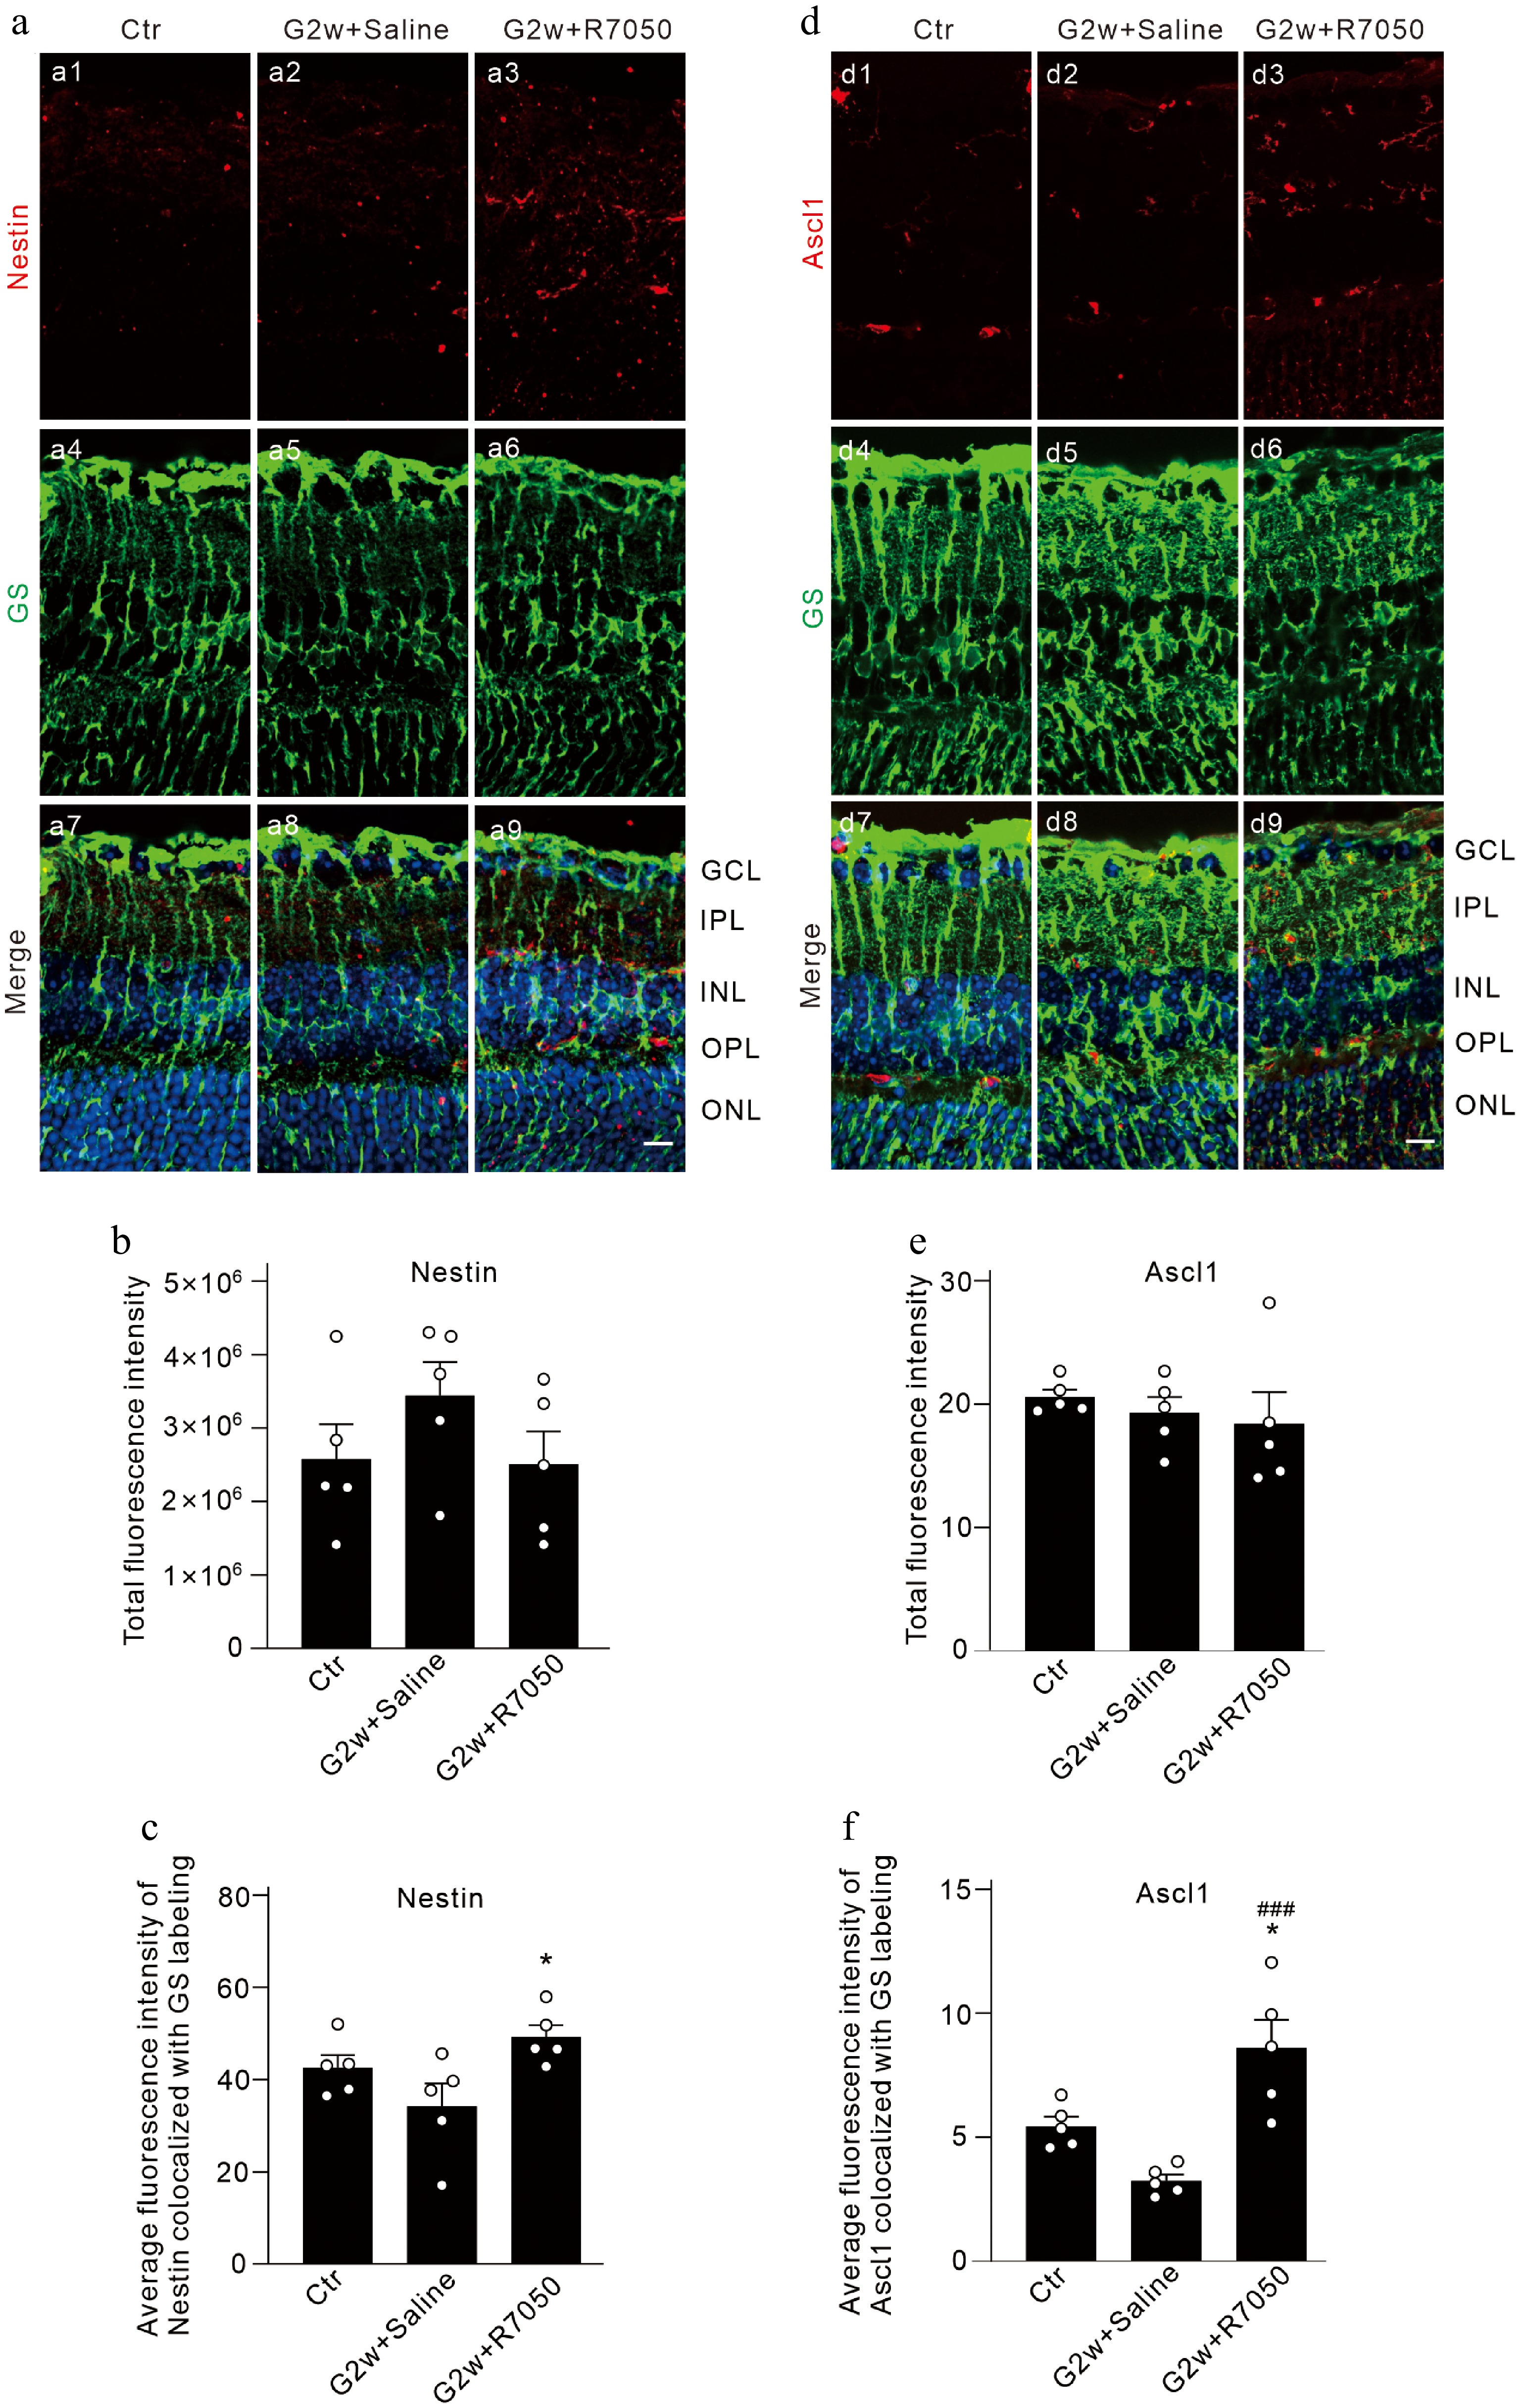
Figure 7.
TNF-α inhibits the transcriptional plasticity of COH retinal Müller cells toward stem cells. (a), (d) Representative images of (a) GS and Nestin, and (d) Ascl1 double immunofluorescence labeling in vertical sections of COH retinas with intravitreal injection of 2 μL of saline/10 μM R7050 at the 2-week time point after the operation (G2w), and retinal sections from sham-operated mice (control, Ctr). Scale bar: 10 μm for all images. (b), (e) Bar graphs comparing the average fluorescence intensity of (b) Nestin, and (e) Ascl1 immunofluorescent labeling. (c), (f) Bar graphs comparing the average fluorescence intensity of (c) Nestin, and (f) Ascl1 immunofluorescent labeling co-labeled with GS. n = 5 for each group. * p < 0.05 vs. Ctr. ### p < 0.001 vs. G2w + Saline. GCL: ganglion cell layer, IPL: inner plexiform layer, INL: inner nuclear layer, OPL: outer plexiform layer, ONL: outer nuclear layer.
Figures
(7)
Tables
(0)