-
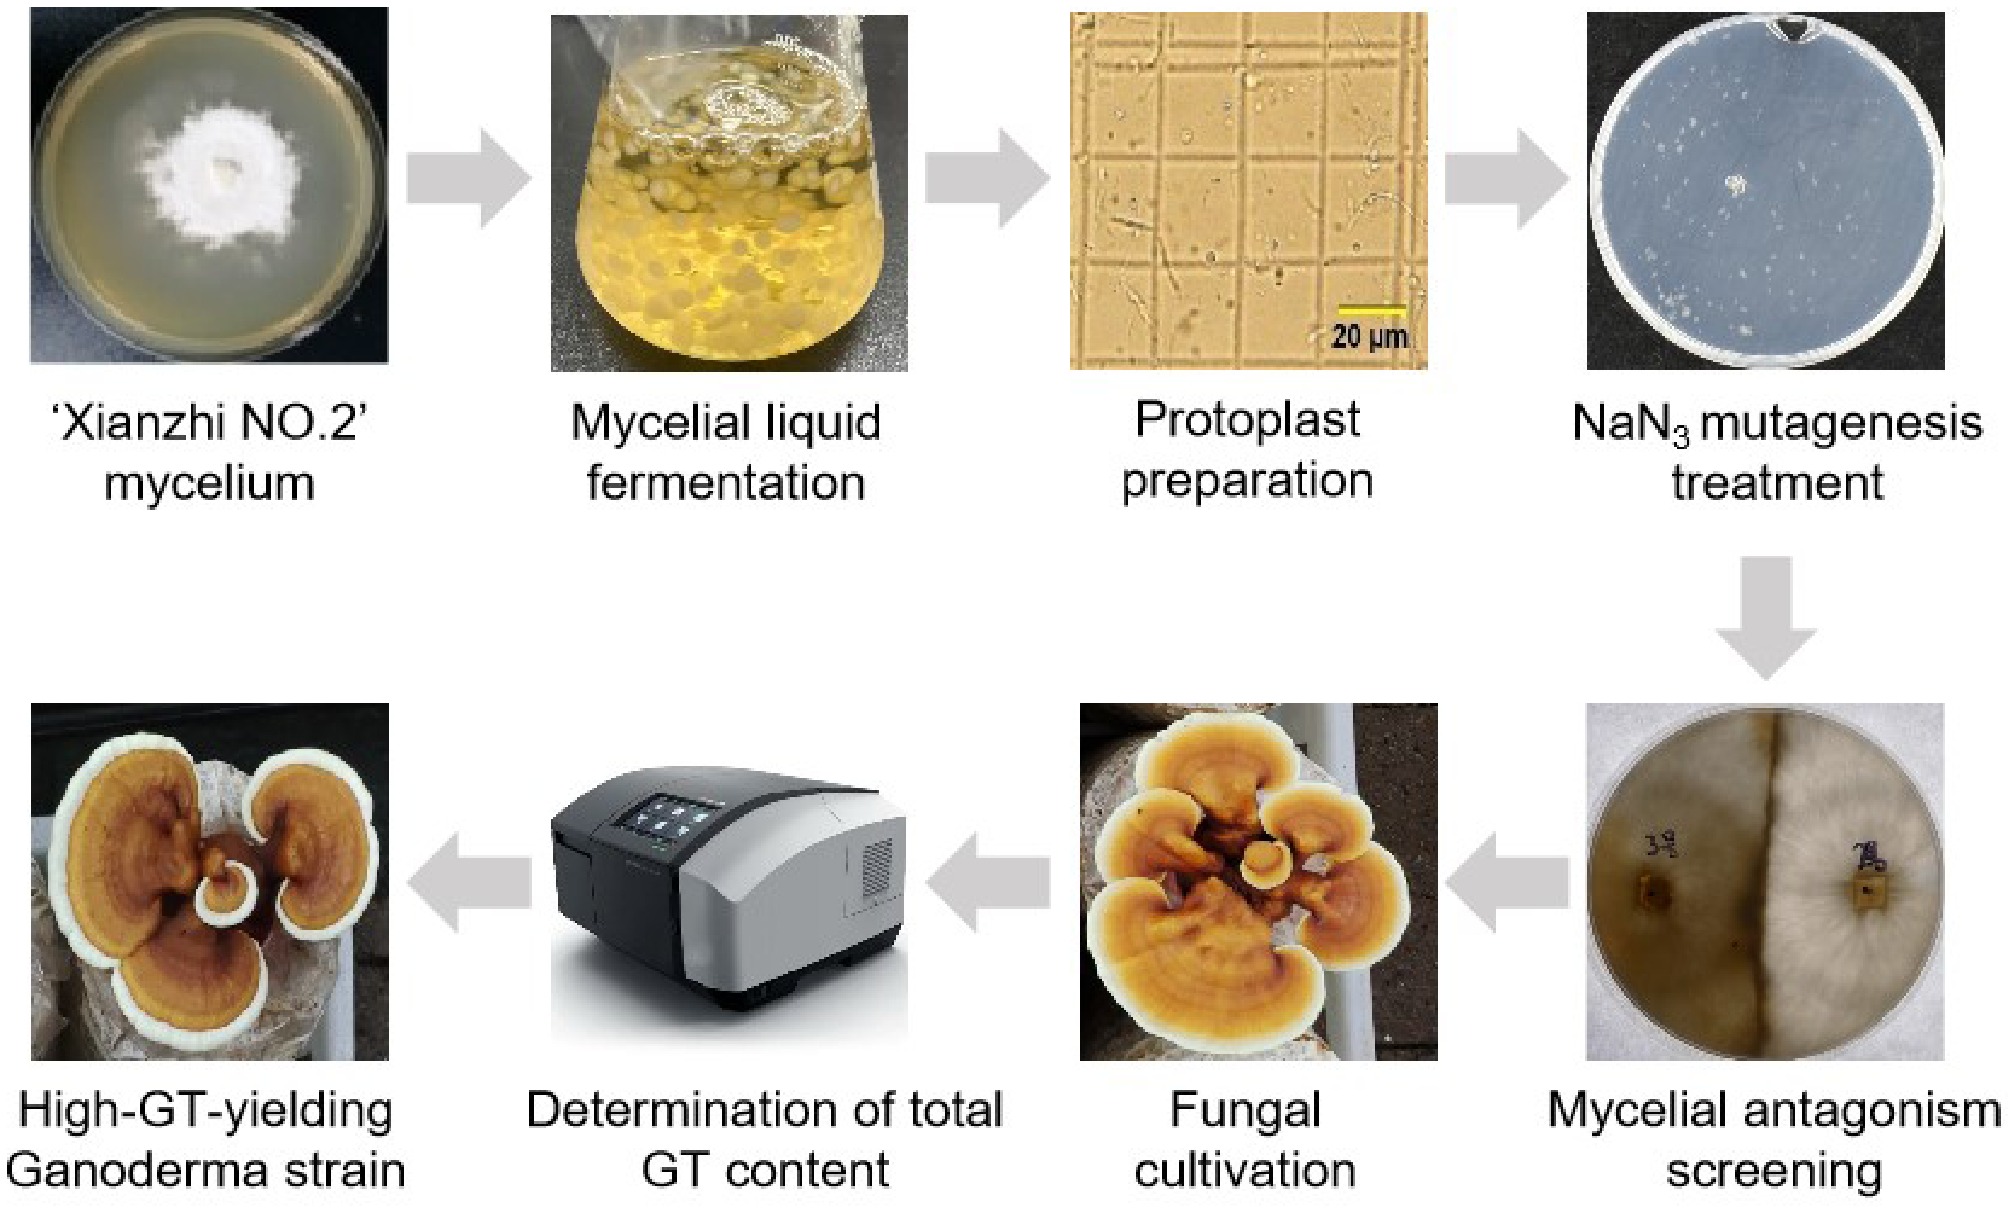
Figure 1.
Construction of a NaN3-induced mutant library of Ganoderma lucidum and screening for triterpene overproducers.
-
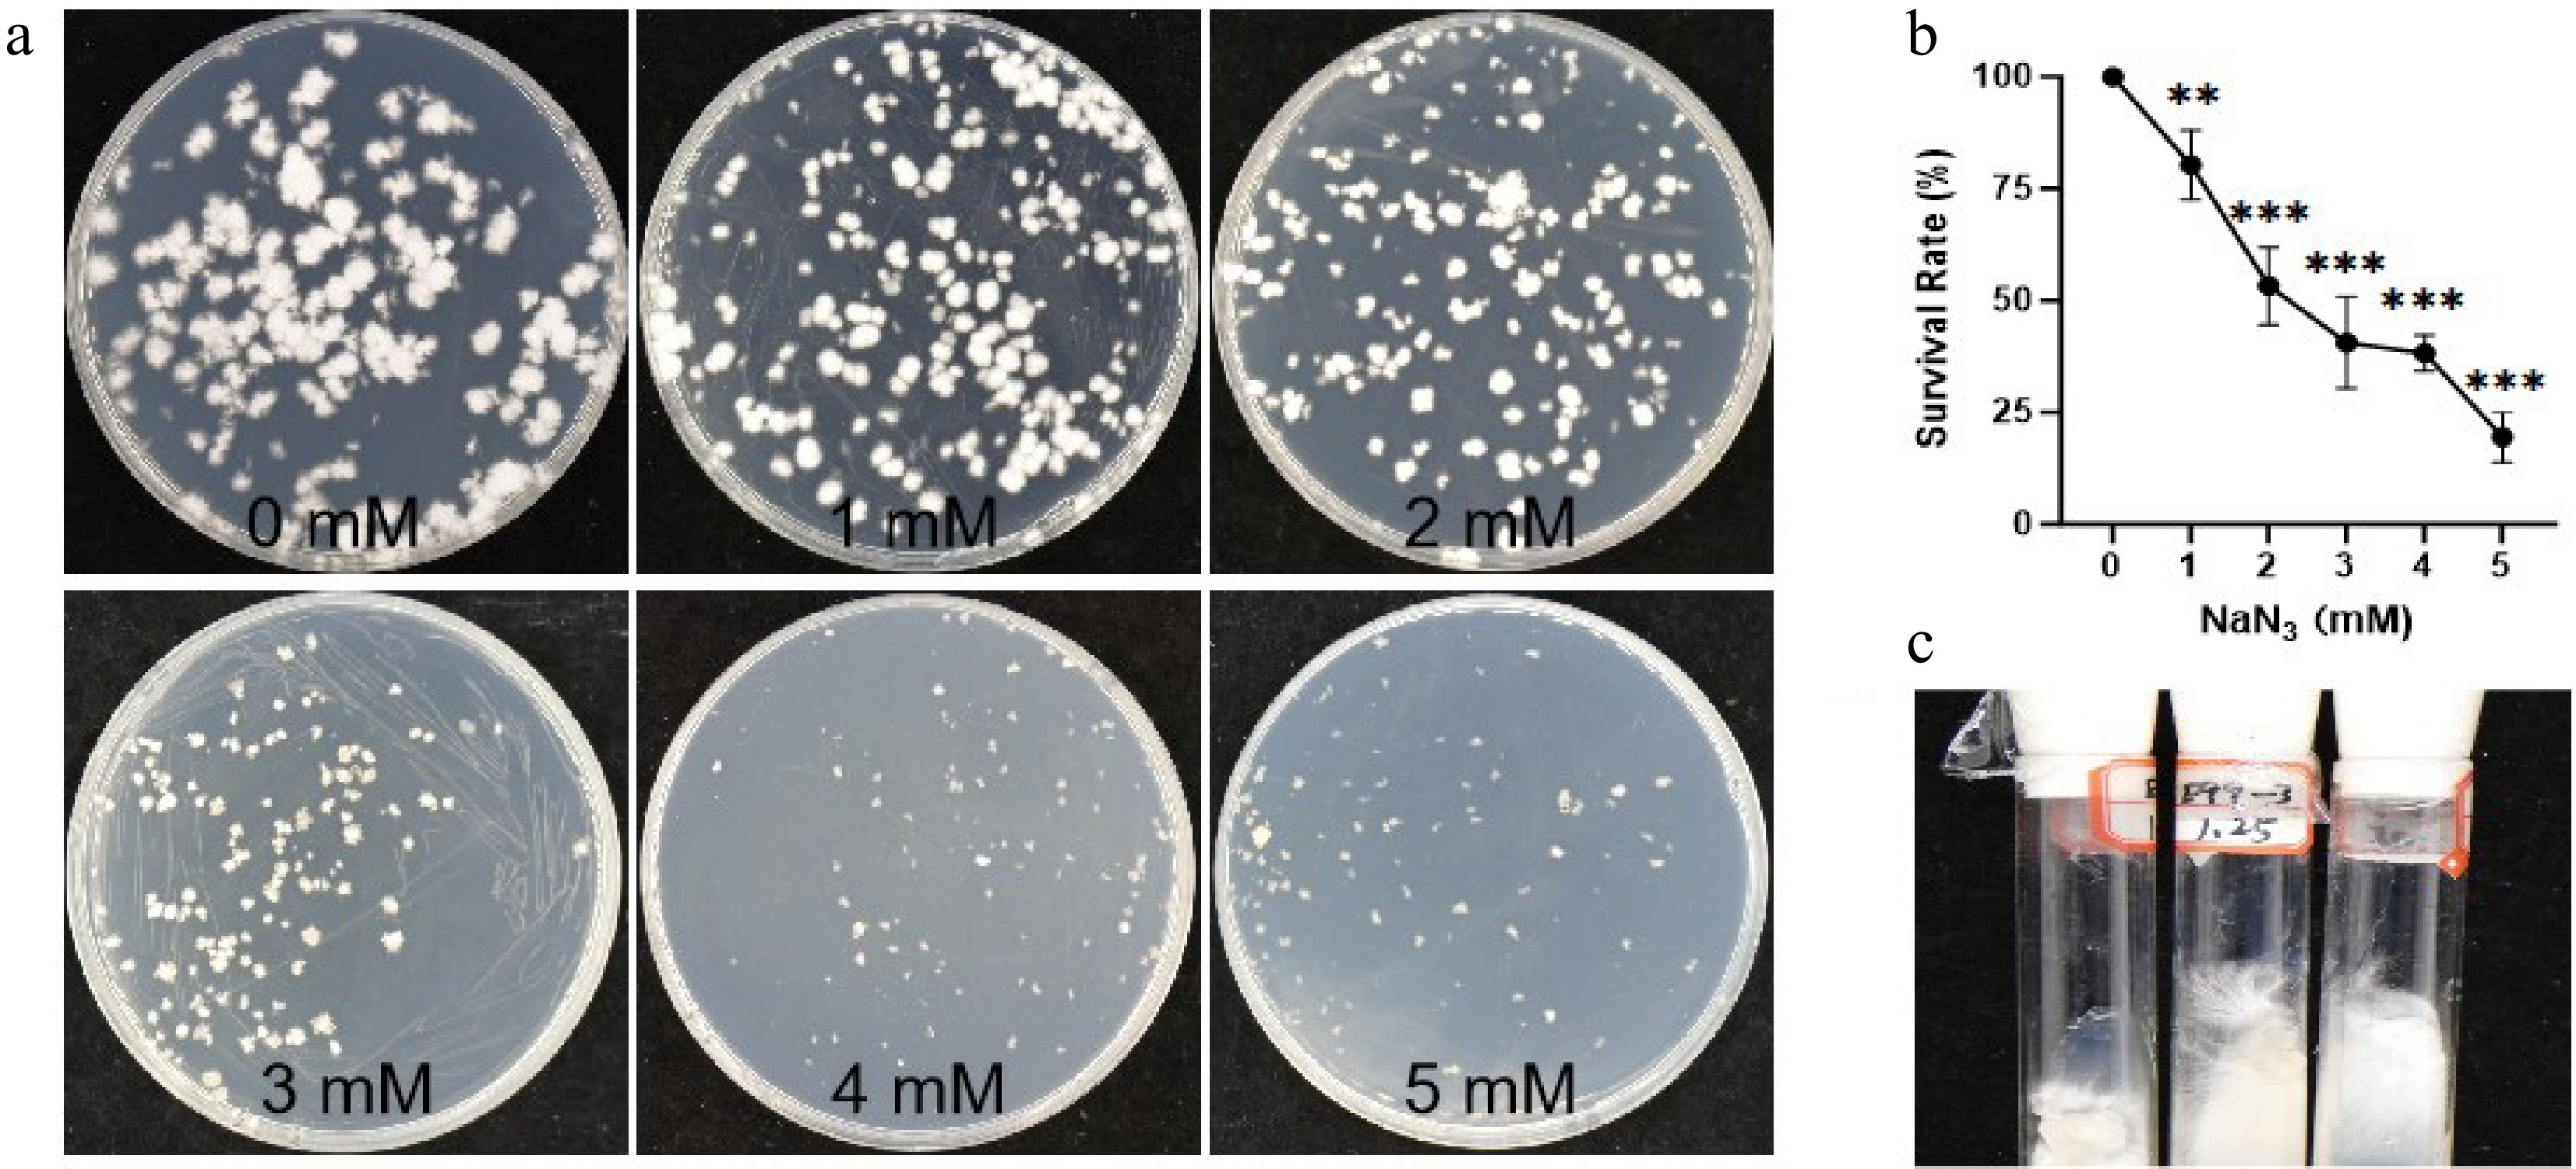
Figure 2.
Determining the LC50 through a NaN3 concentration gradient in Ganoderma lucidum protoplasts. (a) Mutagenesis and regeneration culture of protoplasts at different NaN3 concentration gradients (0, 1, 2, 3, 4, and 5 mM). (b) Survival rate (%) of G. lucidum at different NaN3 concentrations. The error bars indicate the standard deviations from three independent samples. ** p ≤ 0.01 indicates statistical significance, *** p ≤ 0.001 indicates statistical significance compared to the control group (CK). CK: G. lucidum strain 'Xianzhi No. 2'. (c) Scale-up cultivation of single colonies at the semi-lethal NaN3 concentration.
-
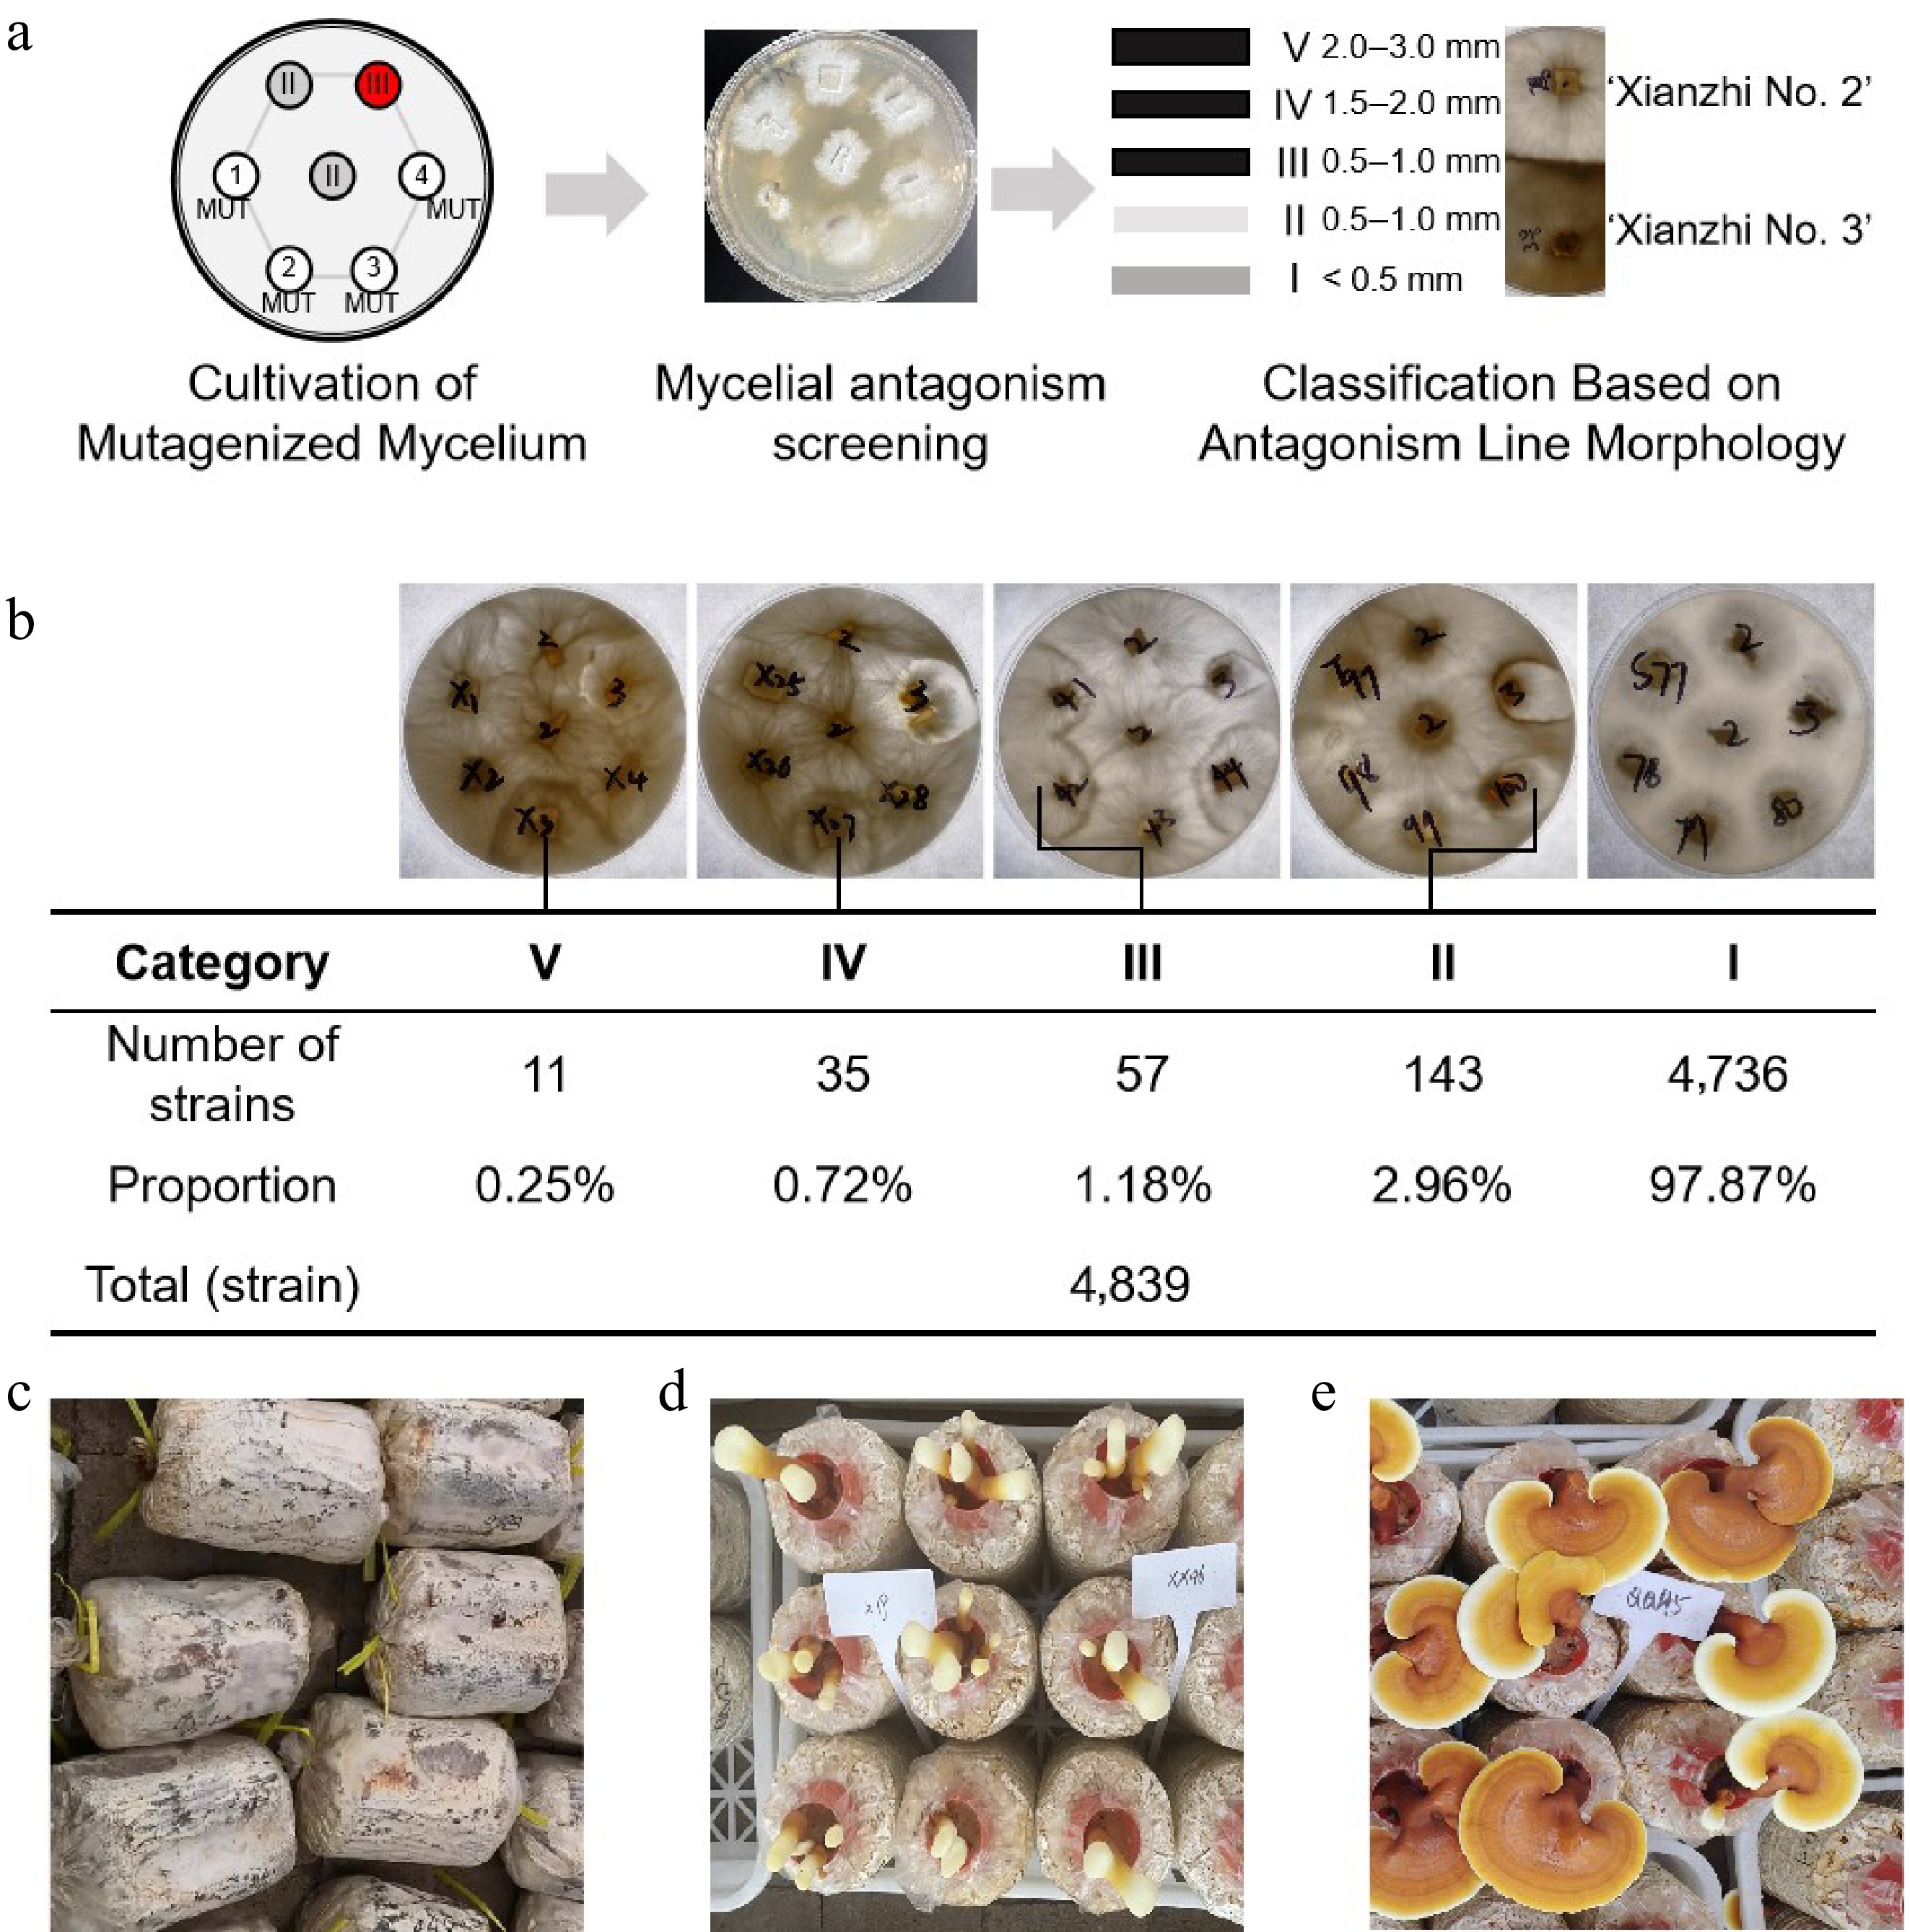
Figure 3.
Screening, cultivation, and selection of high-triterpenoid-yielding strains from NaN3-mutagenized Ganoderma lucidum. (a) Screening of G. lucidum mycelium with antagonistic phenotype. The grey circles represent the wild-type 'Xianzhi No. 2' strain; the red circles represent the wild-type 'Xianzhi No. 3' strain; and the numbers represent NaN3-induced mutant strains. (b) Screening and statistical analysis of antagonistic phenotypes in sodium azide-mutagenized Ganoderma strains. (c)−(e) Mycelial, photographic documentation, and observation of G. lucidum primordia and fruiting body growth stages.
-
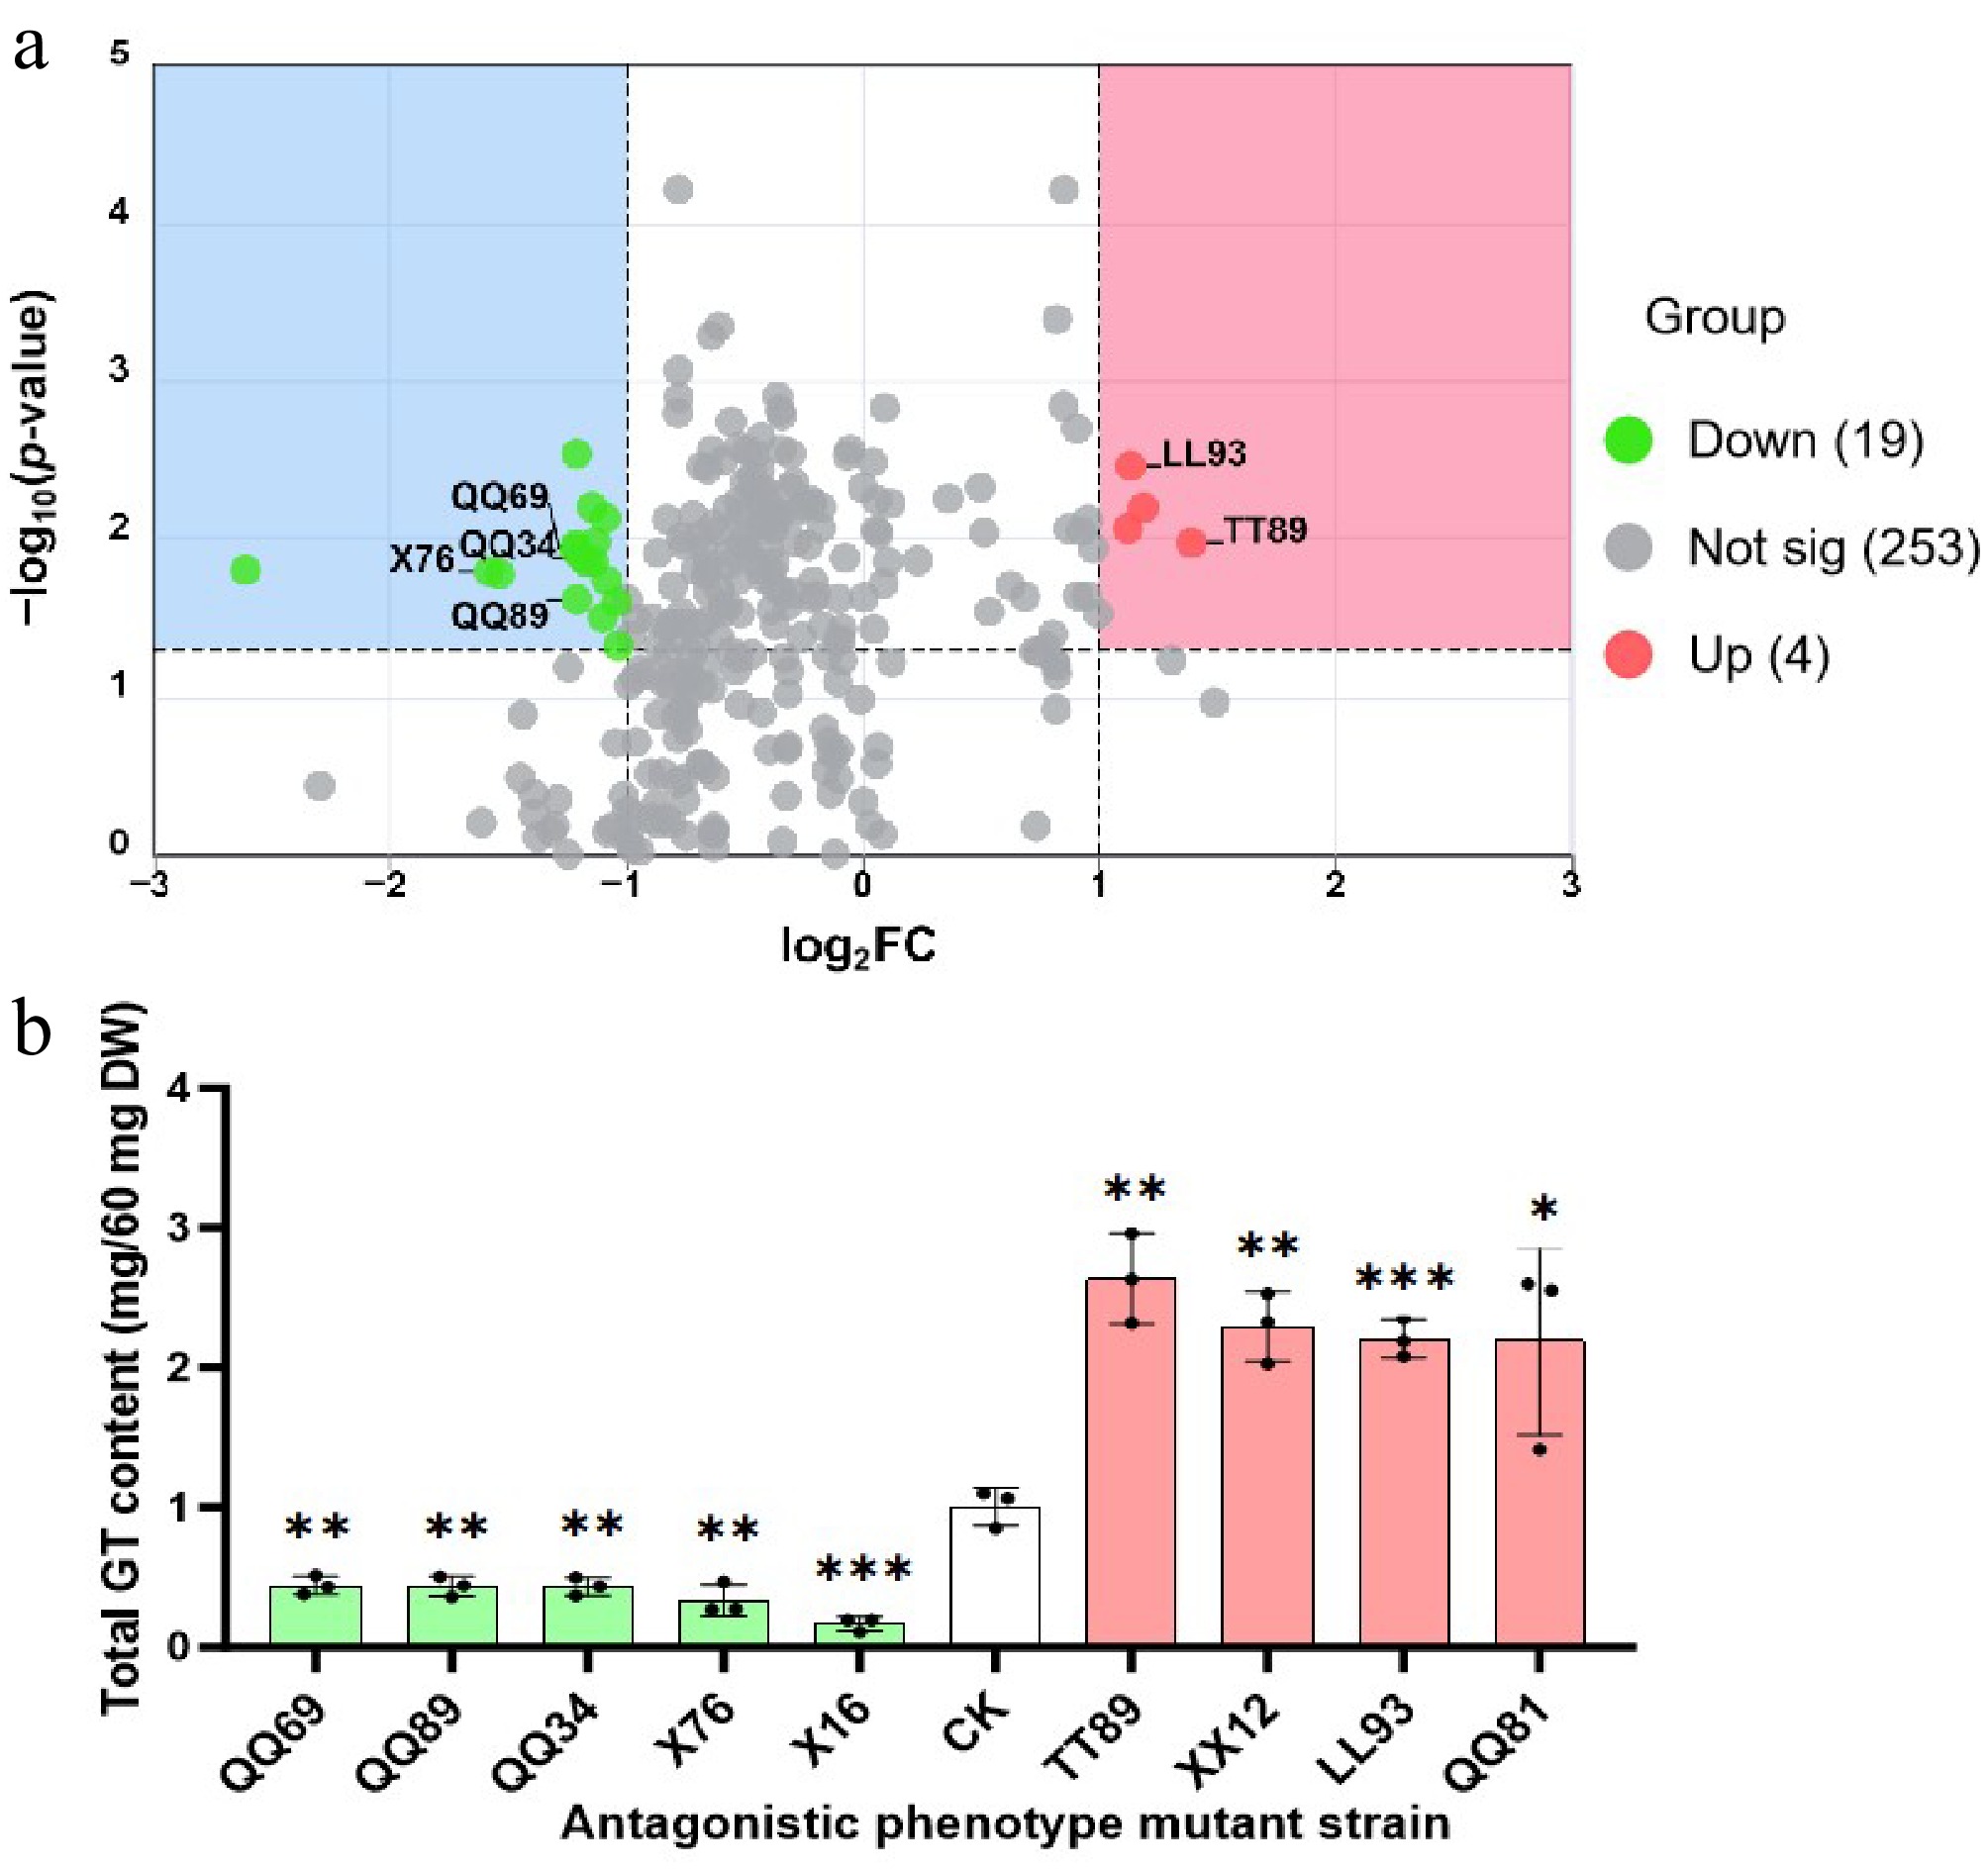
Figure 4.
Statistical analysis of total triterpenoid content in mutagenized strains. (a) Volcano plot of total triterpenoid content between G. lucidum high-triterpenoid-yielding mutants and the control group (CK). CK: G. lucidum strain 'Xianzhi No. 2'. This volcano plot illustrates the differential expression profiles of total triterpenoid content across 275 mutagenized strains. The x-axis represents the log2fold change |log2FC|, reflecting the relative abundance changes of triterpenoids between the two groups; the y-axis represents the −log10 p-value, which is used to evaluate statistical significance. Different metabolites with distinct significance levels and fold change magnitudes are distinguished by markers of varying colors and shapes in the plot: Red dots: represent strains with significant upregulation (p < 0.05 and log2FC > 1); Gray dots: represent strains with no substantial fold change or non-significant differences (|log2FC| ≤ 1 or p ≥ 0.05); Green dots: represent strains with significant downregulation (p < 0.05 and log2FC < −1). (b) Strains with significant differences in total triterpenoid content. Data are presented as mean ± standard deviation (mean ± SD) with three biological replicates per group (n = 3). The independent-samples t-test was performed to analyze the significance of differences between mutant strains and the control group (CK). * p ≤ 0.05 indicates a significant difference, ** p ≤ 0.01 indicates a highly significant difference, *** p ≤ 0.001 indicates an extremely significant difference, and ns indicates no significant difference (p > 0.05).
-
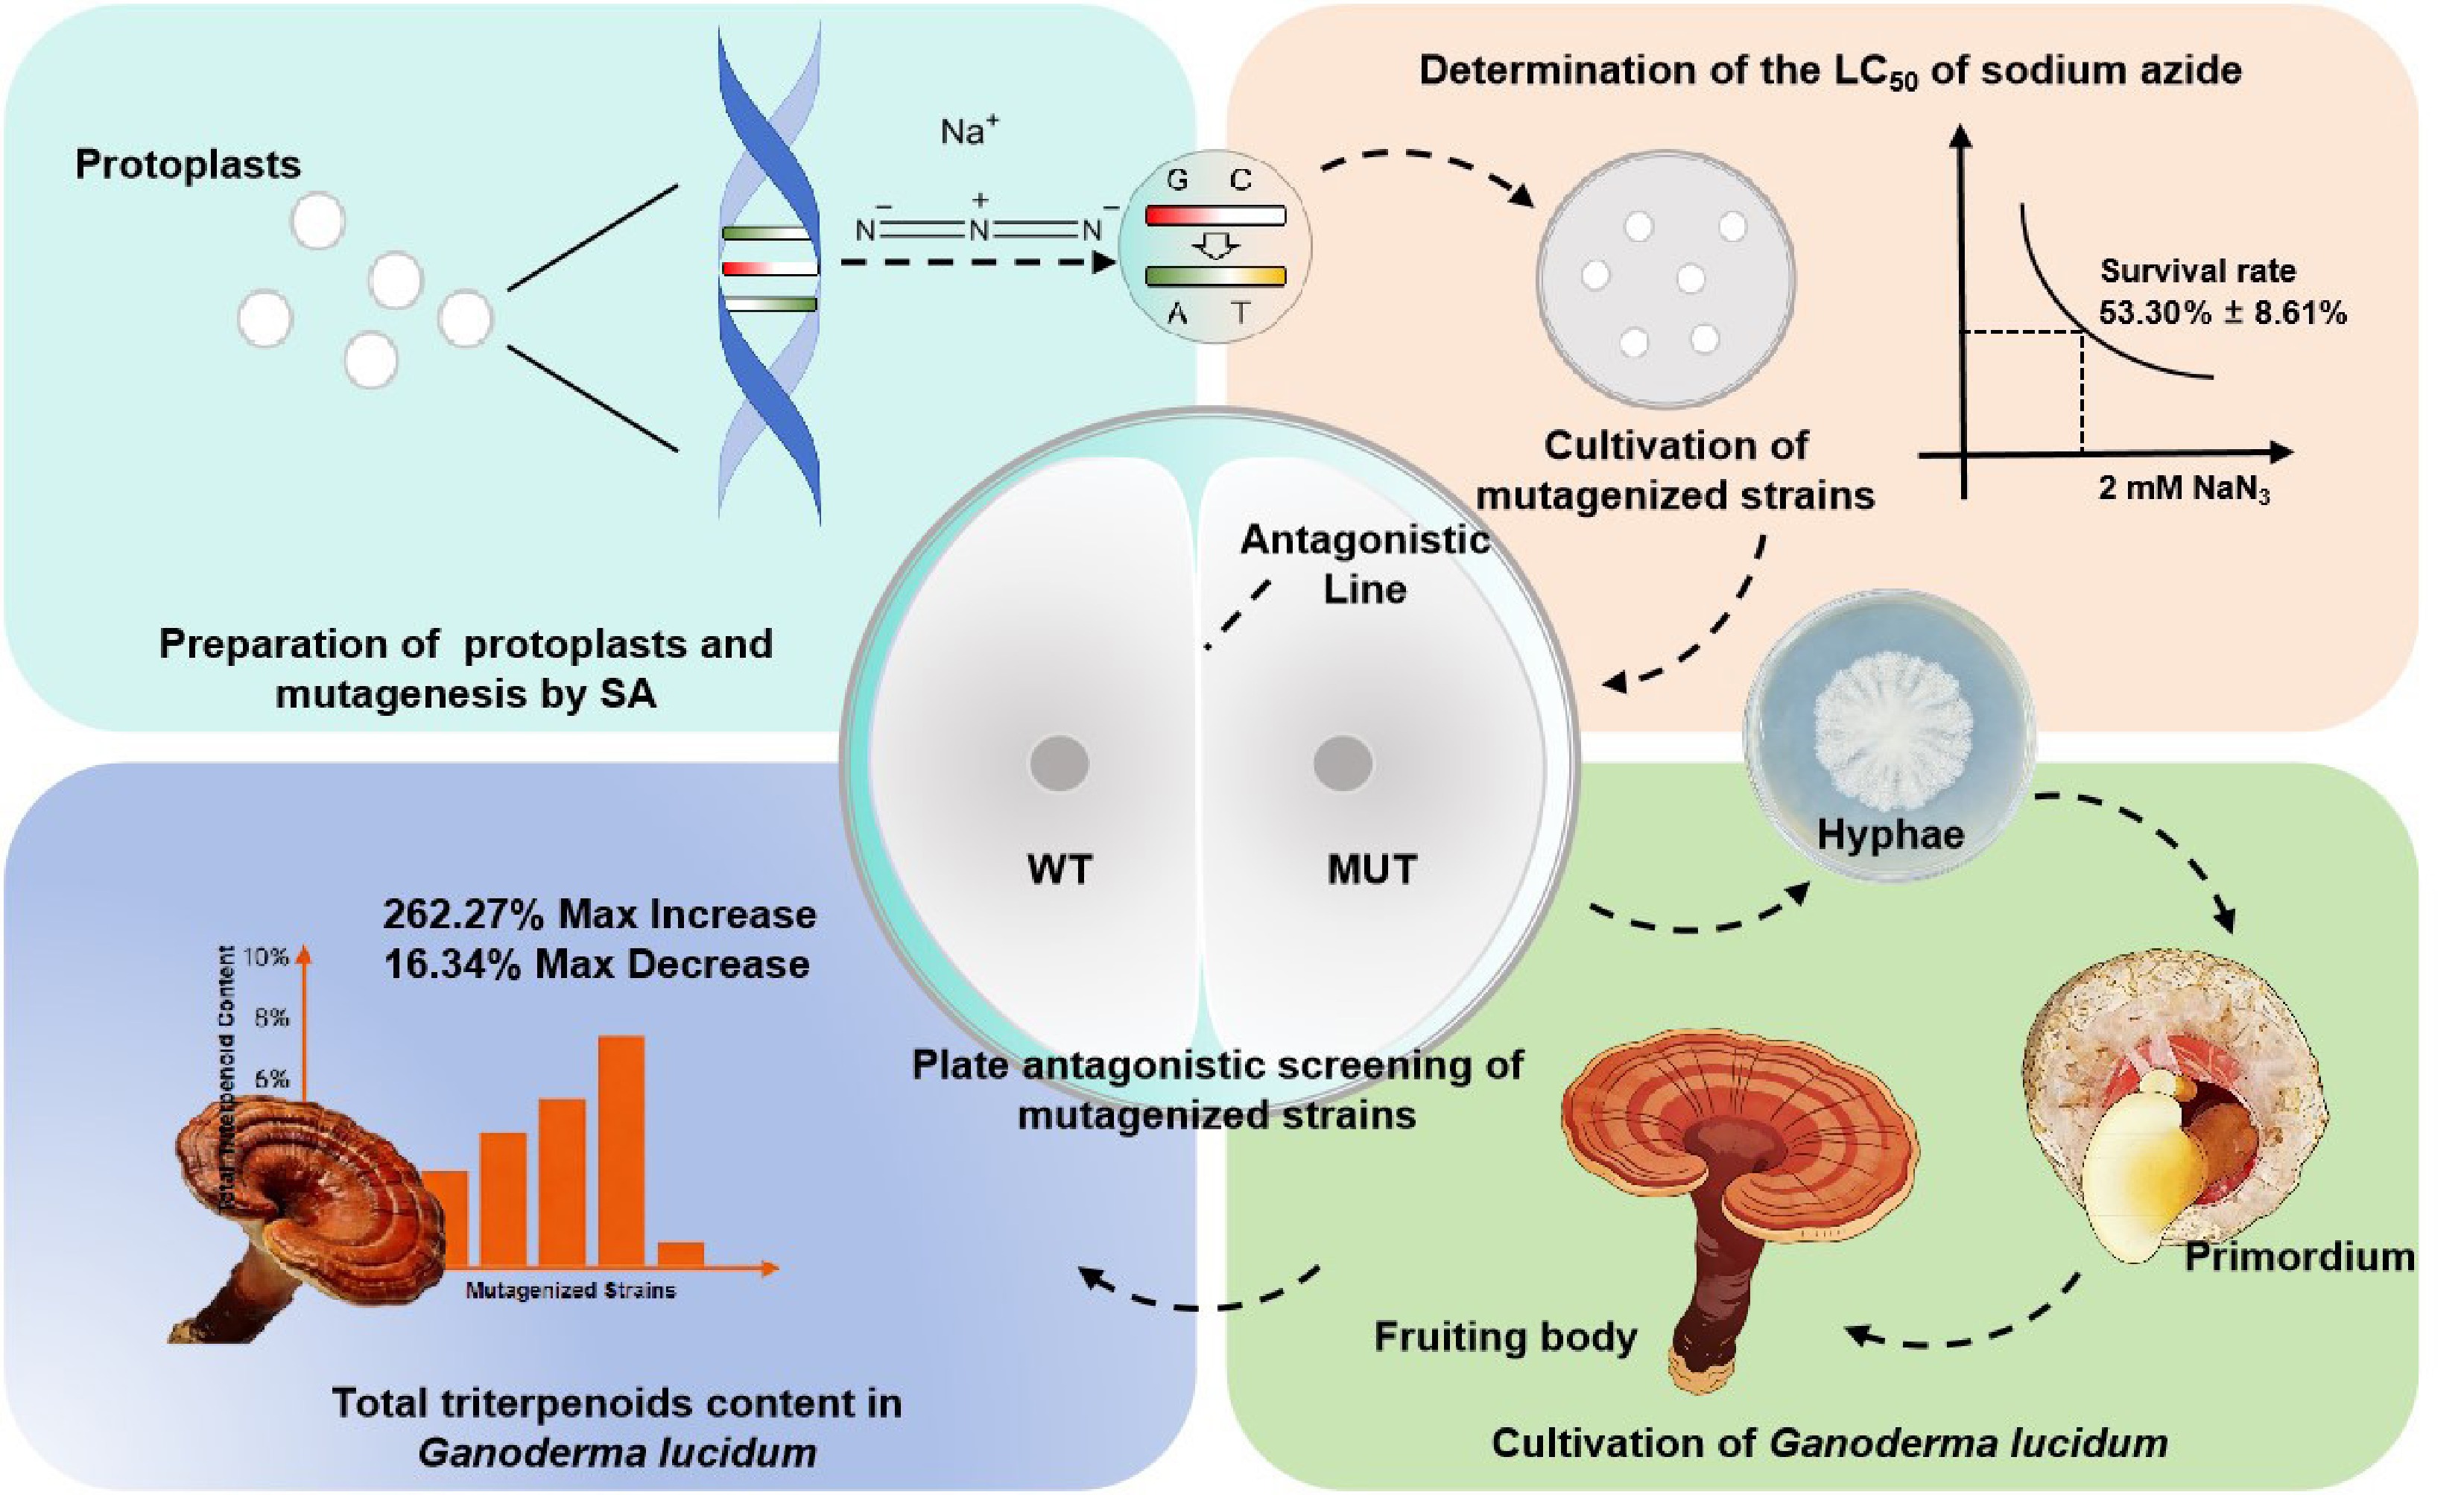
Figure 5.
Mutagenesis breeding with sodium azide and antagonistic screening of G. lucidum strains with high total triterpenoid content.
-
Treatment concentration
(mM)Biological replicate 1
(colonies)Biological replicate 2
(colonies)Biological replicate 3
(colonies)Relative regeneration
rate (%)0 > 300 254 261 100% 1 230 196 195 80.39 ± 7.74% 2 161 117 134 53.30 ± 8.61% 3 133 100 81 40.60 ± 10.22% 4 103 106 87 38.30 ± 3.97% 5 55 62 34 19.55 ± 5.66% Relative regeneration rate (%) = (Mean colony number of each treatment group/Mean colony number of the 0 mM control group) × 100%. Table 1.
Survival rate of Ganoderma lucidum protoplasts treated with different concentrations of sodium azide.
Figures
(5)
Tables
(1)