-
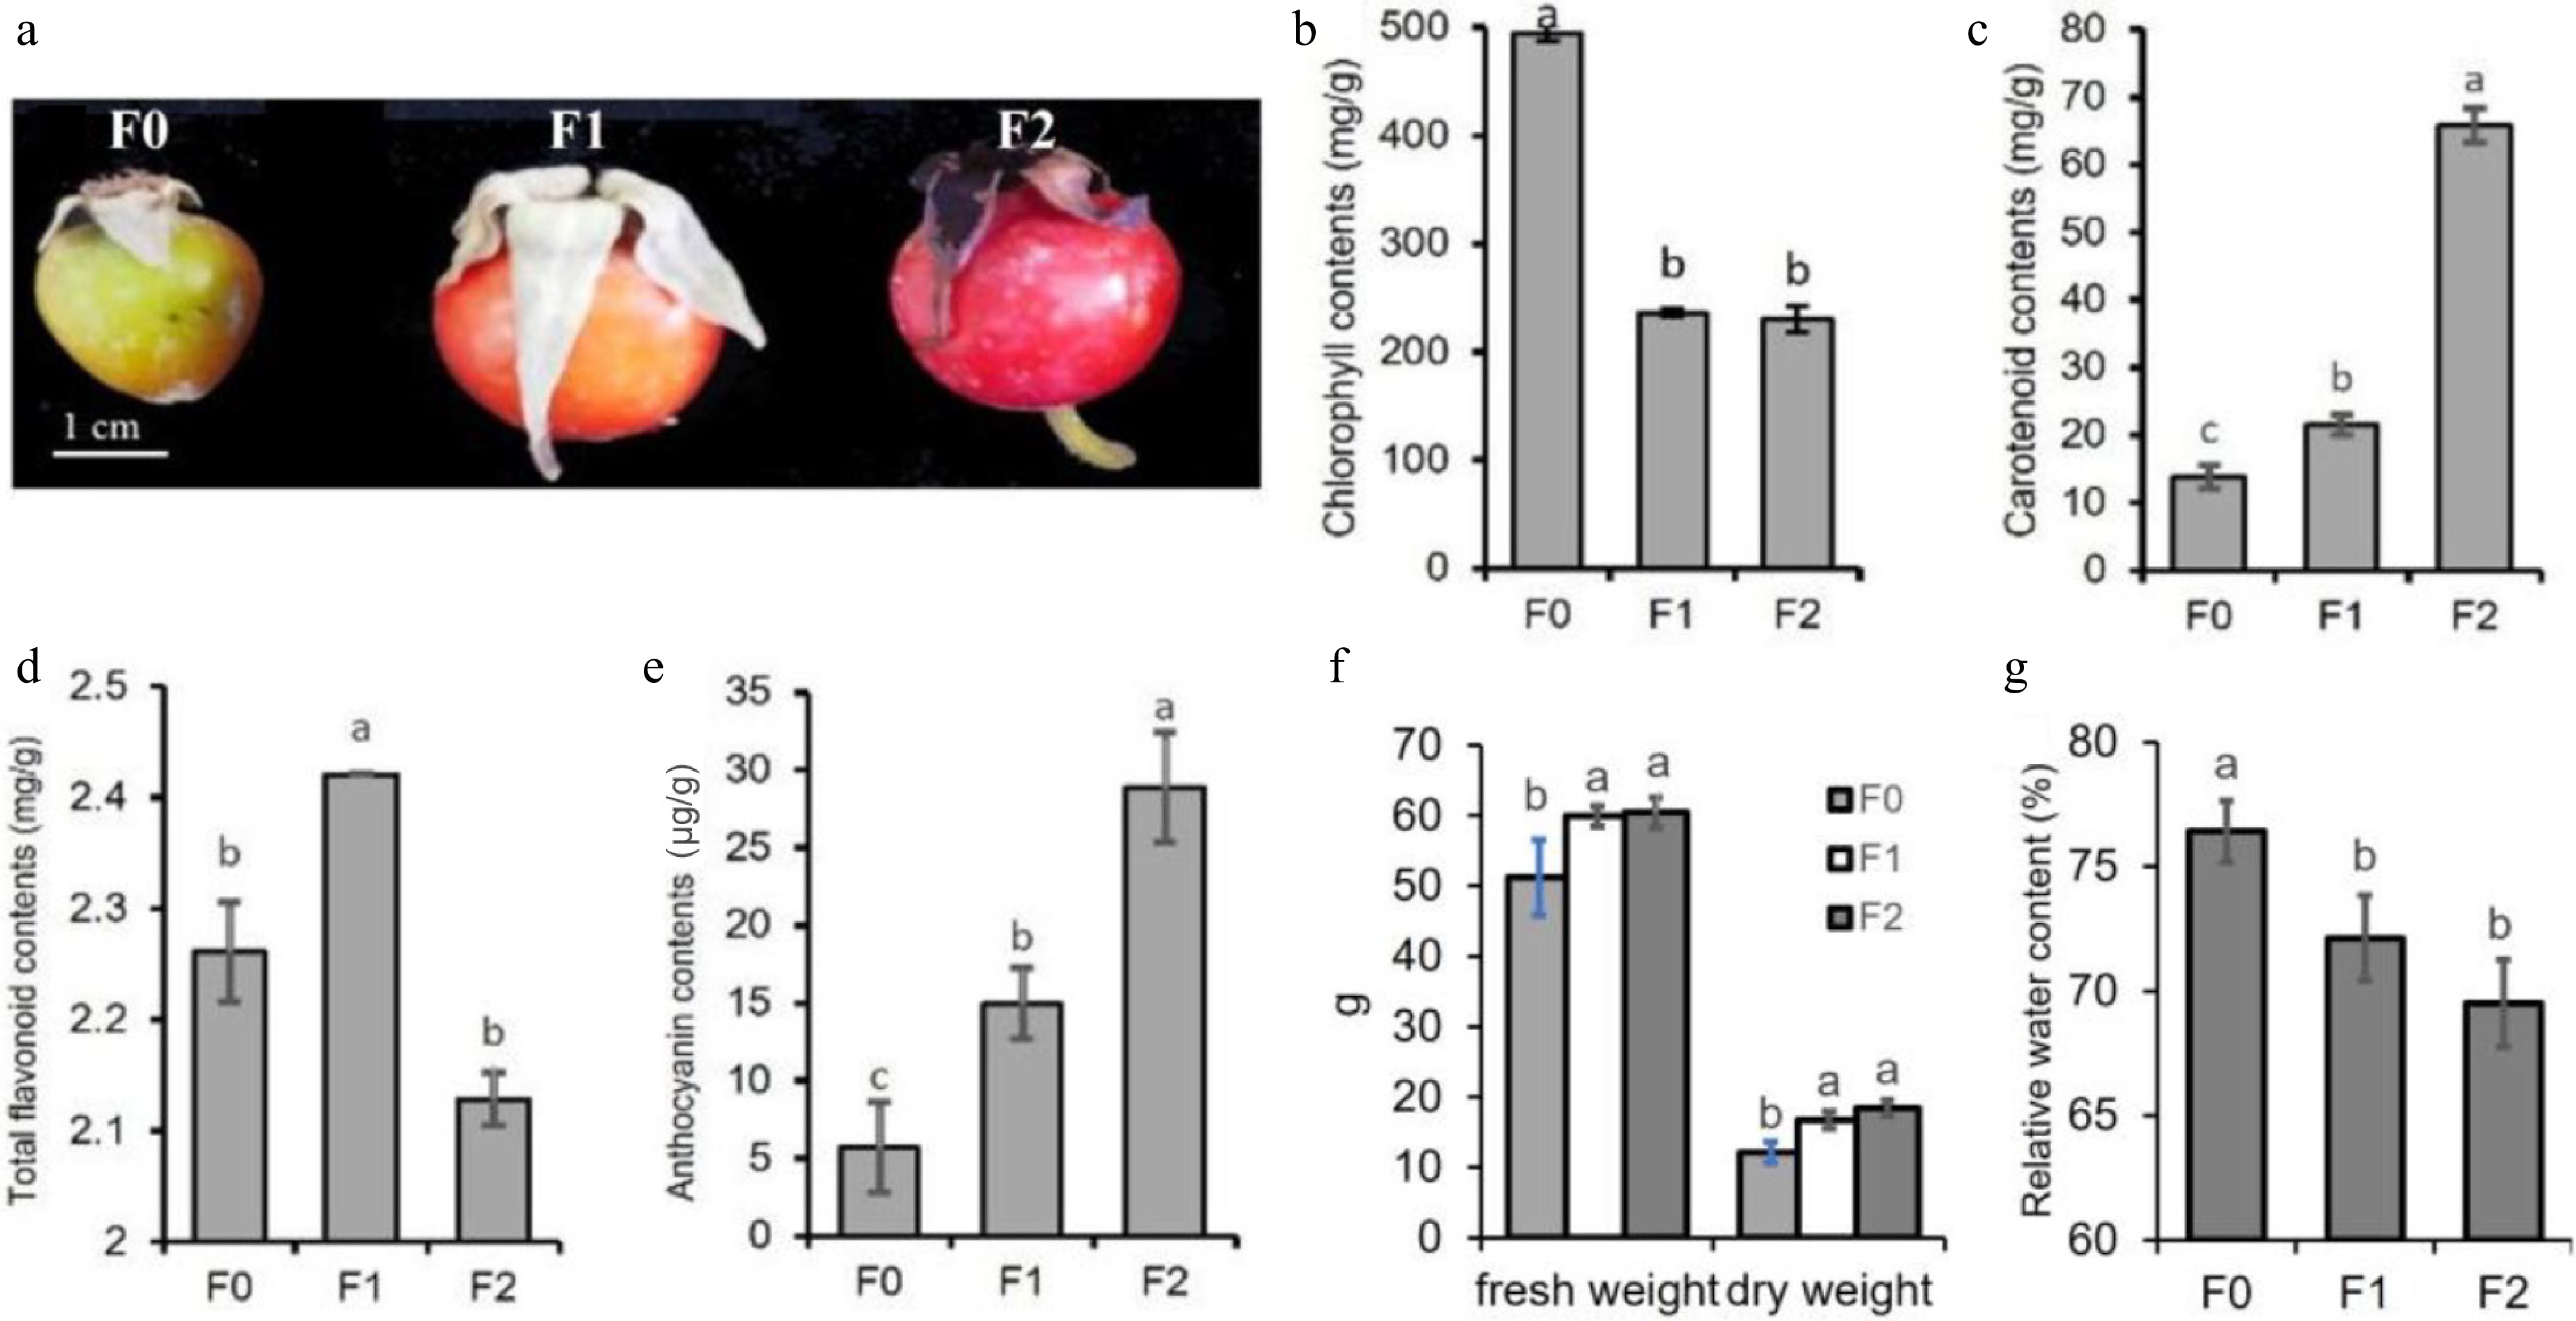
Figure 1.
The periods of hip harvest and the content of pigments in R. rugosa hips. (a) The periods of hip harvest. The period when the hip color changed from green to orange was identified as F0, the period when the hip turned into orange as F1, and the period when the hip turned red and softened as F2. (b) The content of chlorophyll. (c) The content of carotenoids. (d) The content of total flavonoids. (e) The content of anthocyanins. (f) The fresh and dry weight. (g) The relative water content.
-
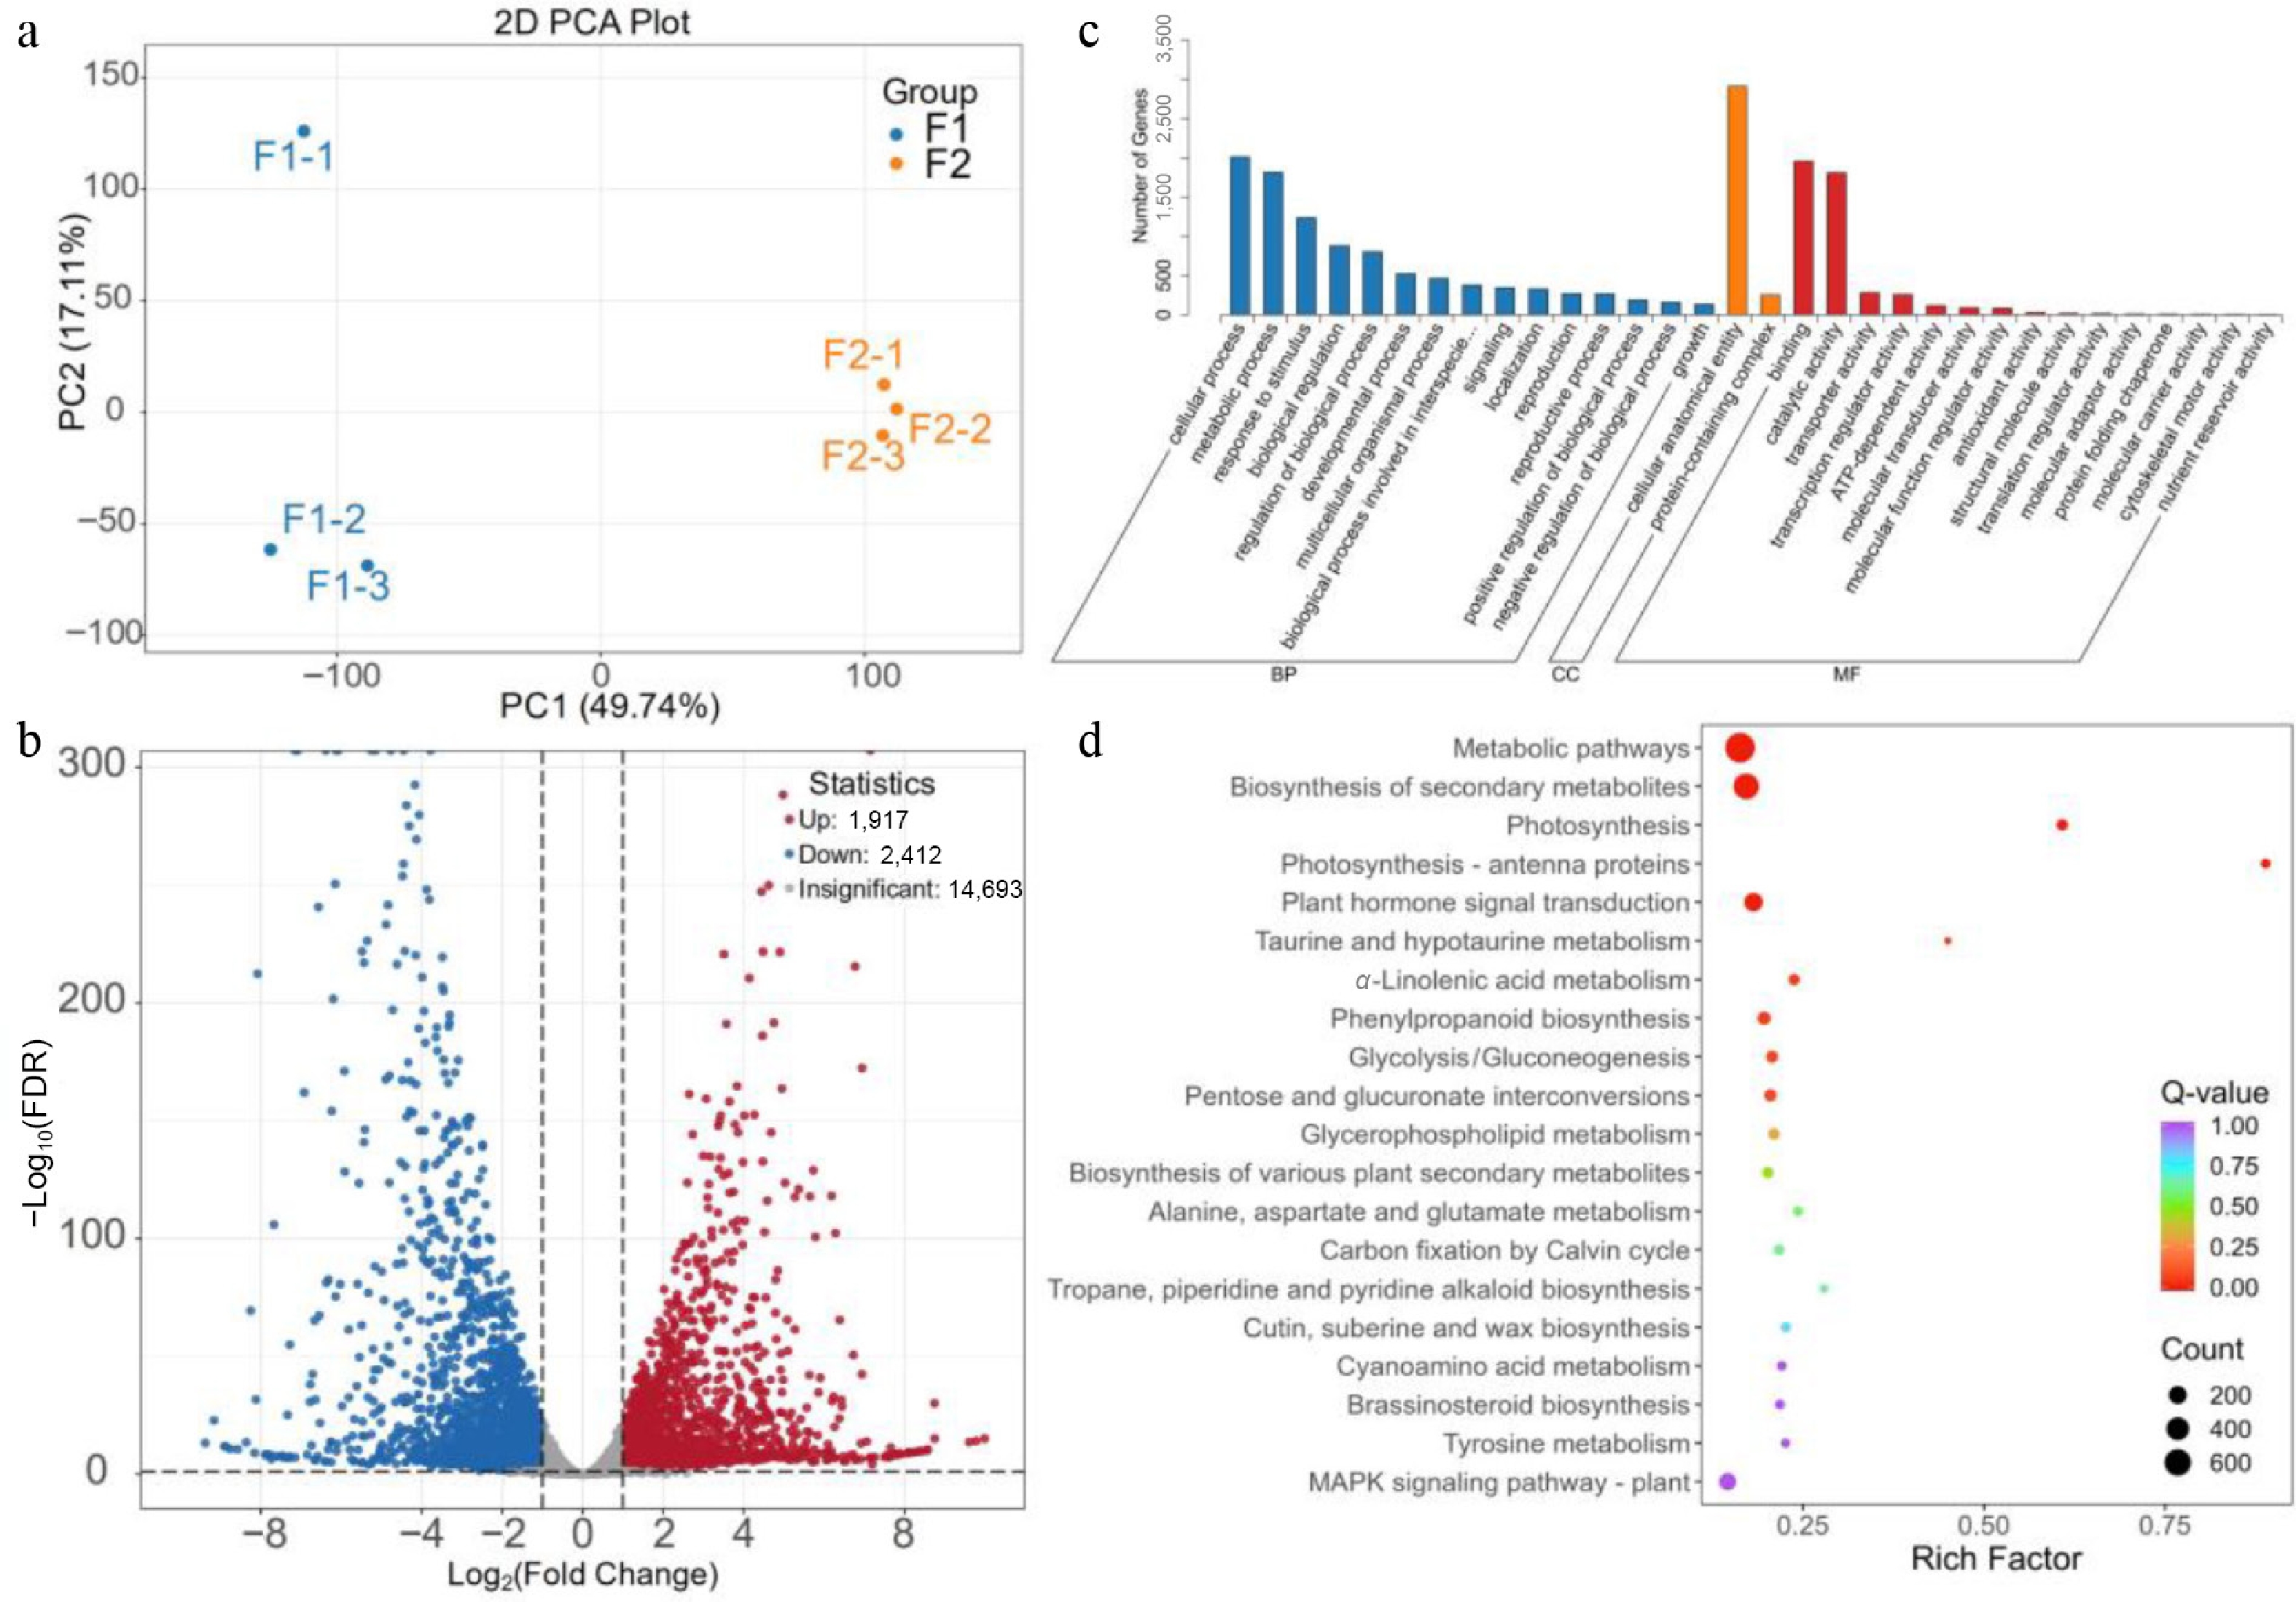
Figure 2.
Qualitative and quantitative analysis of the transcriptome data. (a) PCA analysis; (b) the volcano map of differentially expressed genes; (c) GO enrichment analysis; (d) KEGG enrichment analysis.
-
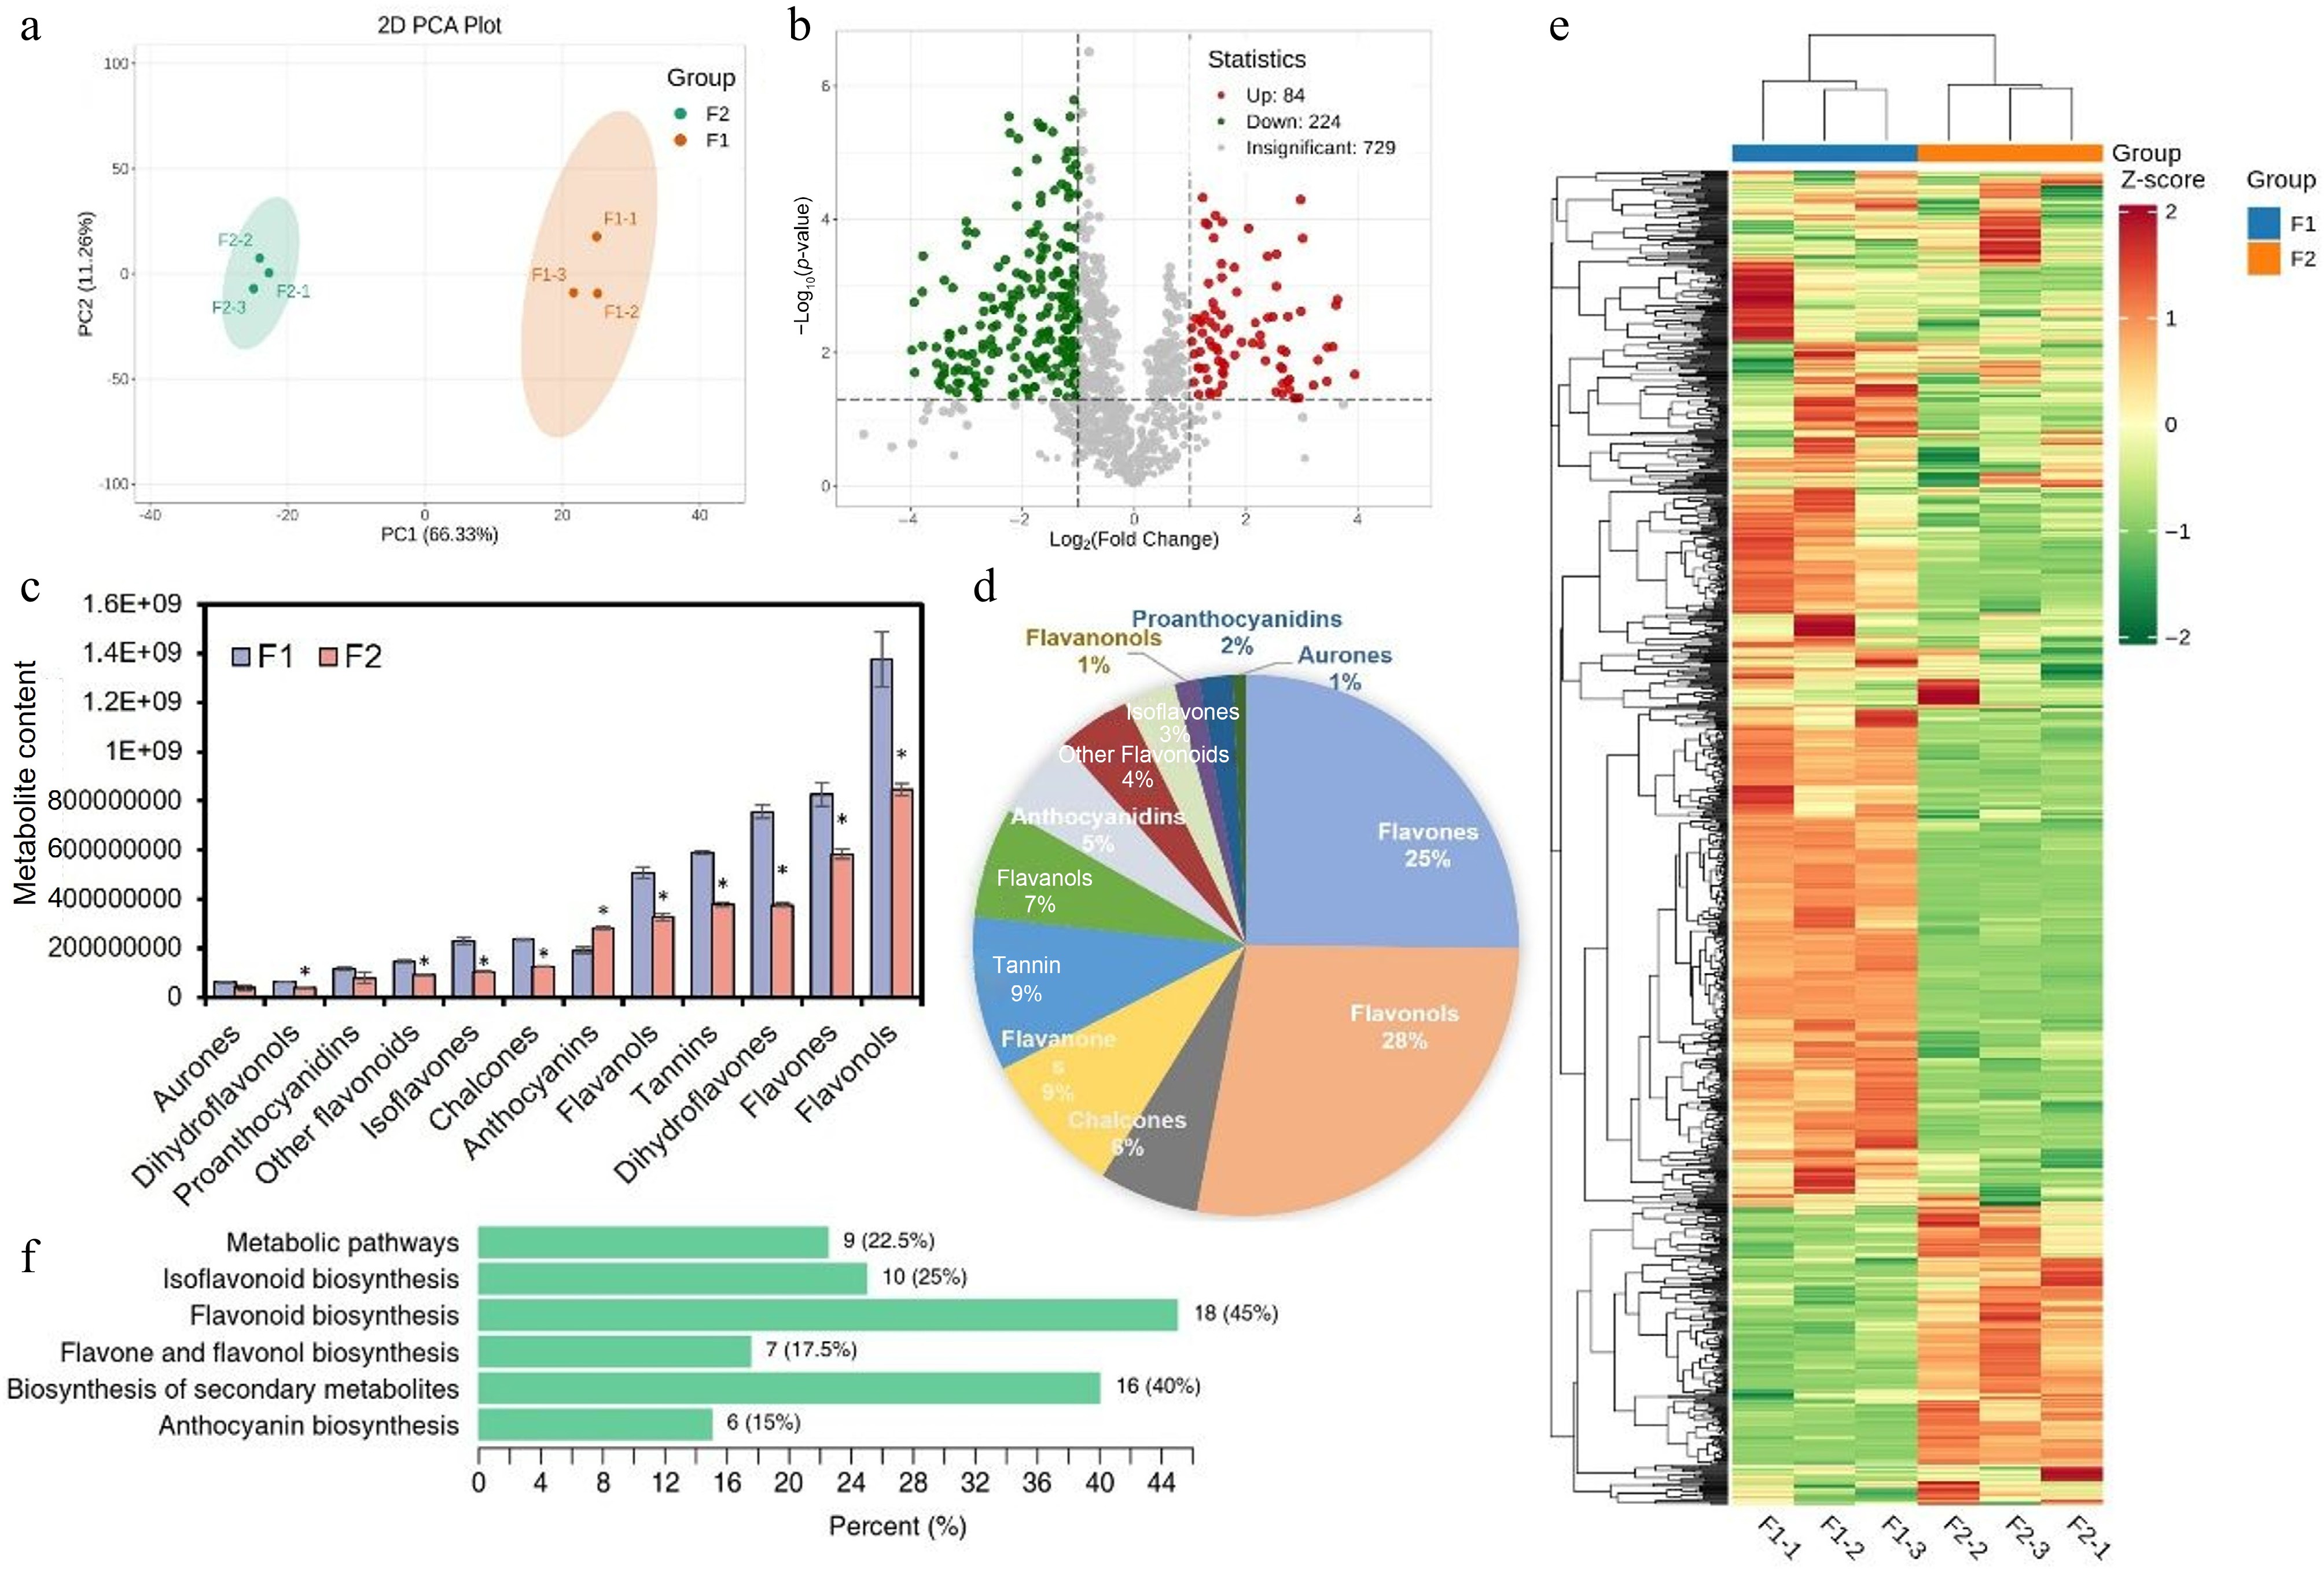
Figure 3.
Metabolome quality and differentially accumulated metabolites analysis. (a) PCA; (b) number of differential metabolites and up/downregulation; (c) changes in the content of various flavonoid components; (d) the proportion of various flavonoid components; (e) the heatmap of differential metabolites, with green representing downregulated metabolites, red representing upregulated metabolites; and (f) KEGG classification. The x-axis represents the proportion of each substance category. The y-axis represents the pathway. The numbers outside and inside the parentheses indicate the substance type and its percentage, respectively.
-
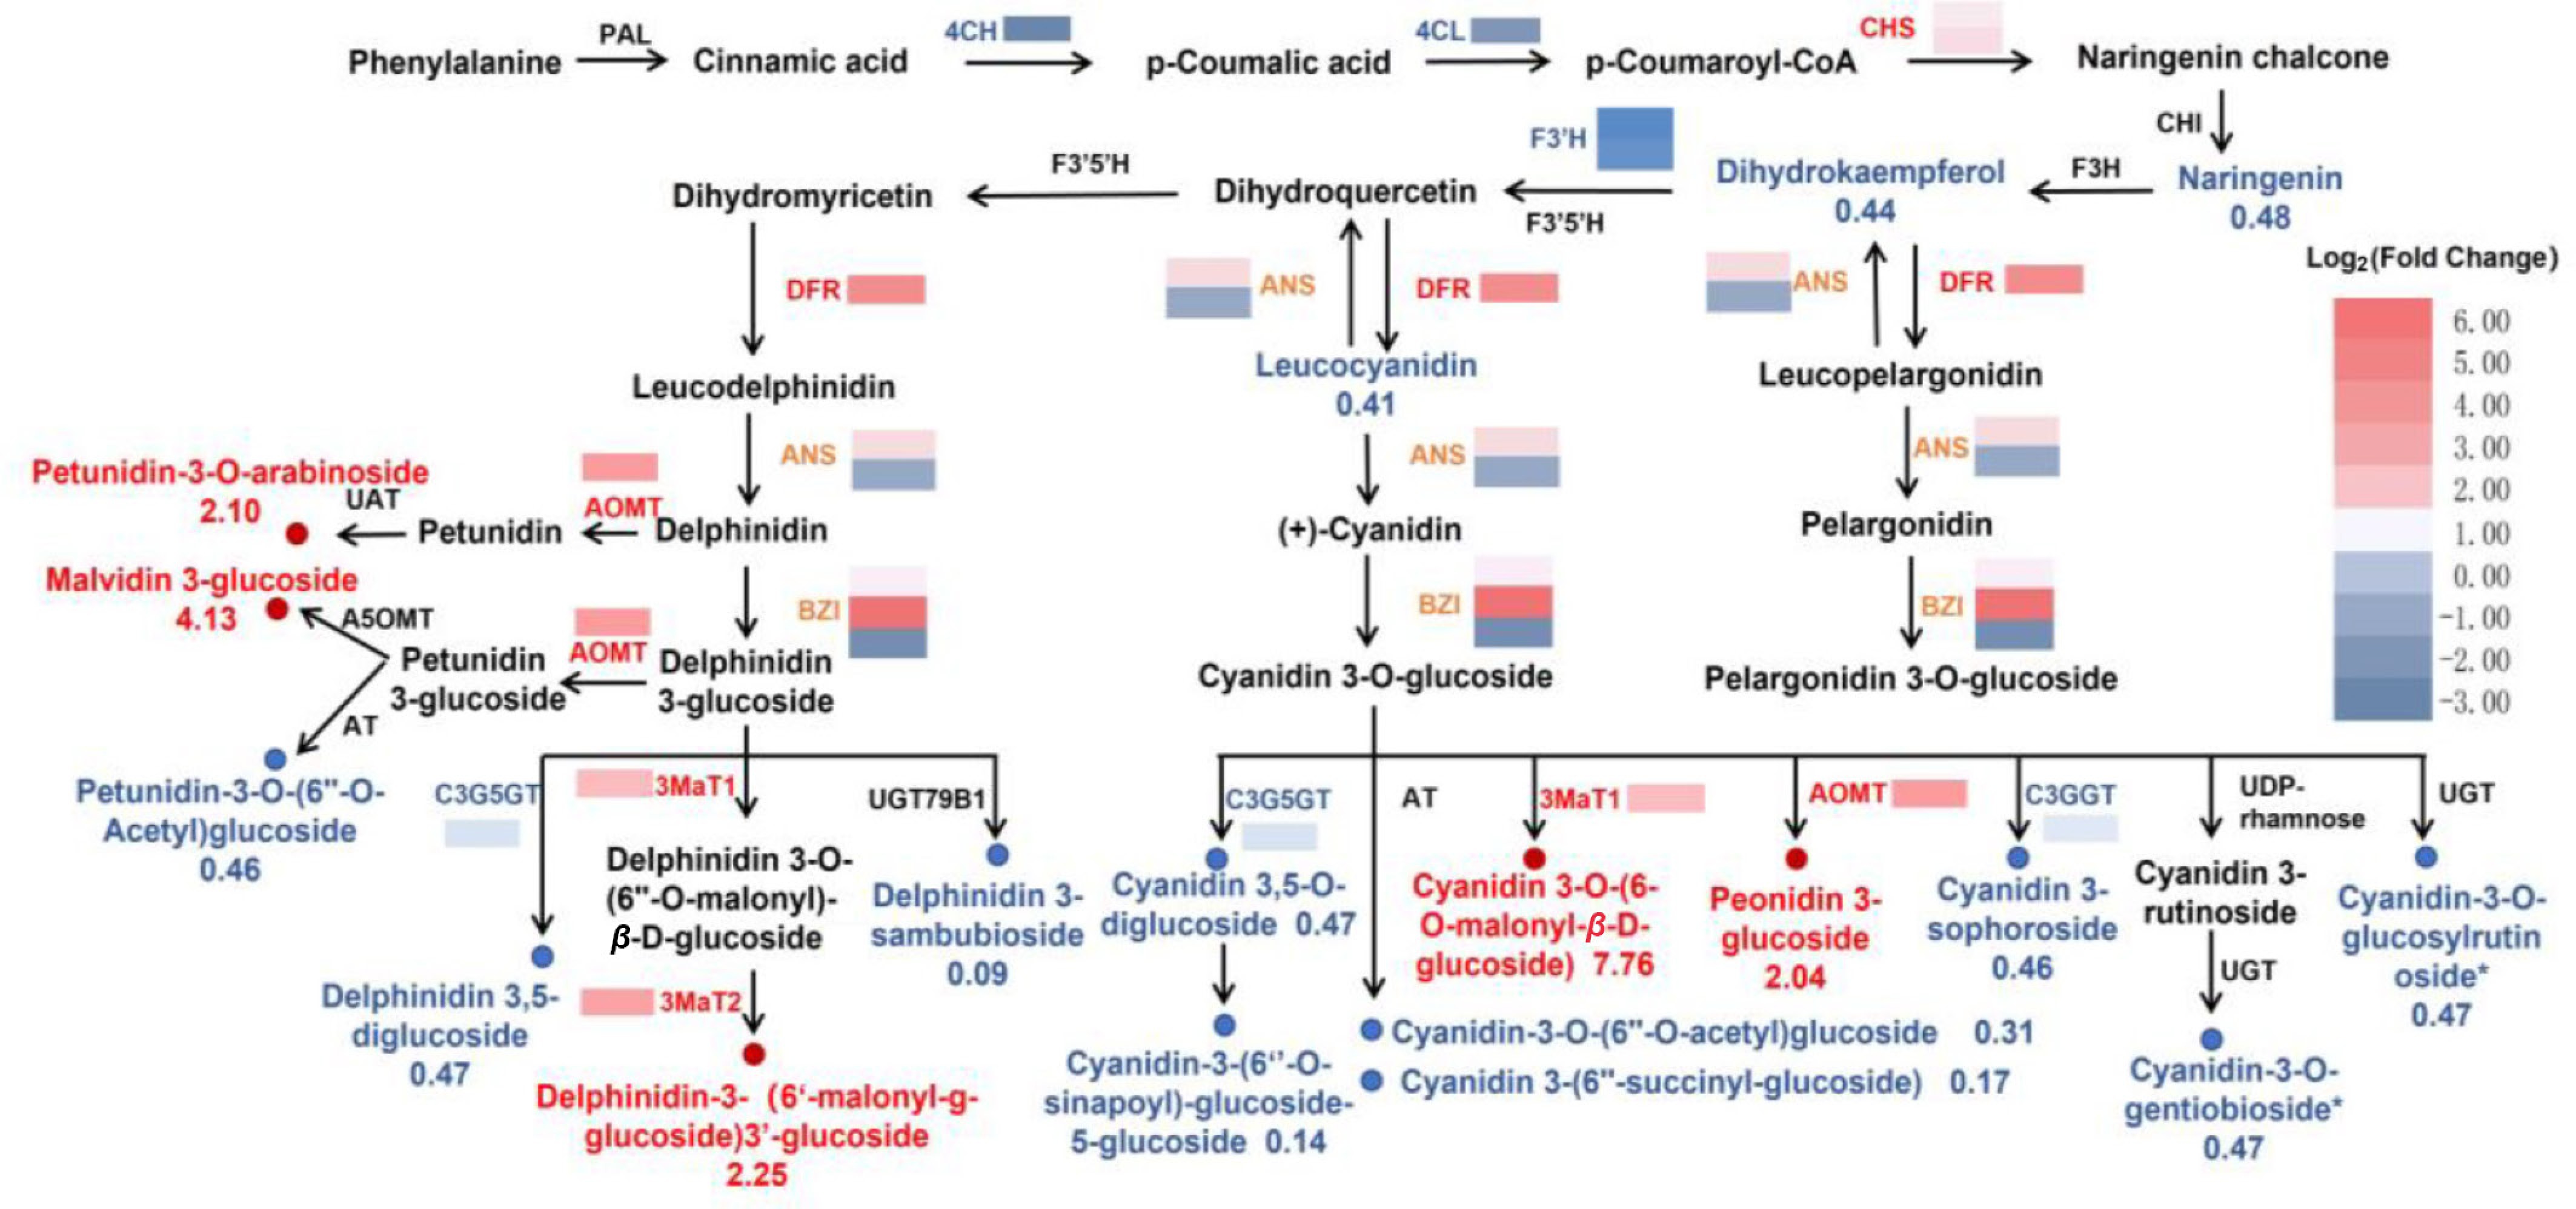
Figure 4.
Reconstruction of the anthocyanin biosynthetic pathway with differentially expressed enzyme genes (DEGs) and metabolites (DAMs) in F2 vs. F1.
-
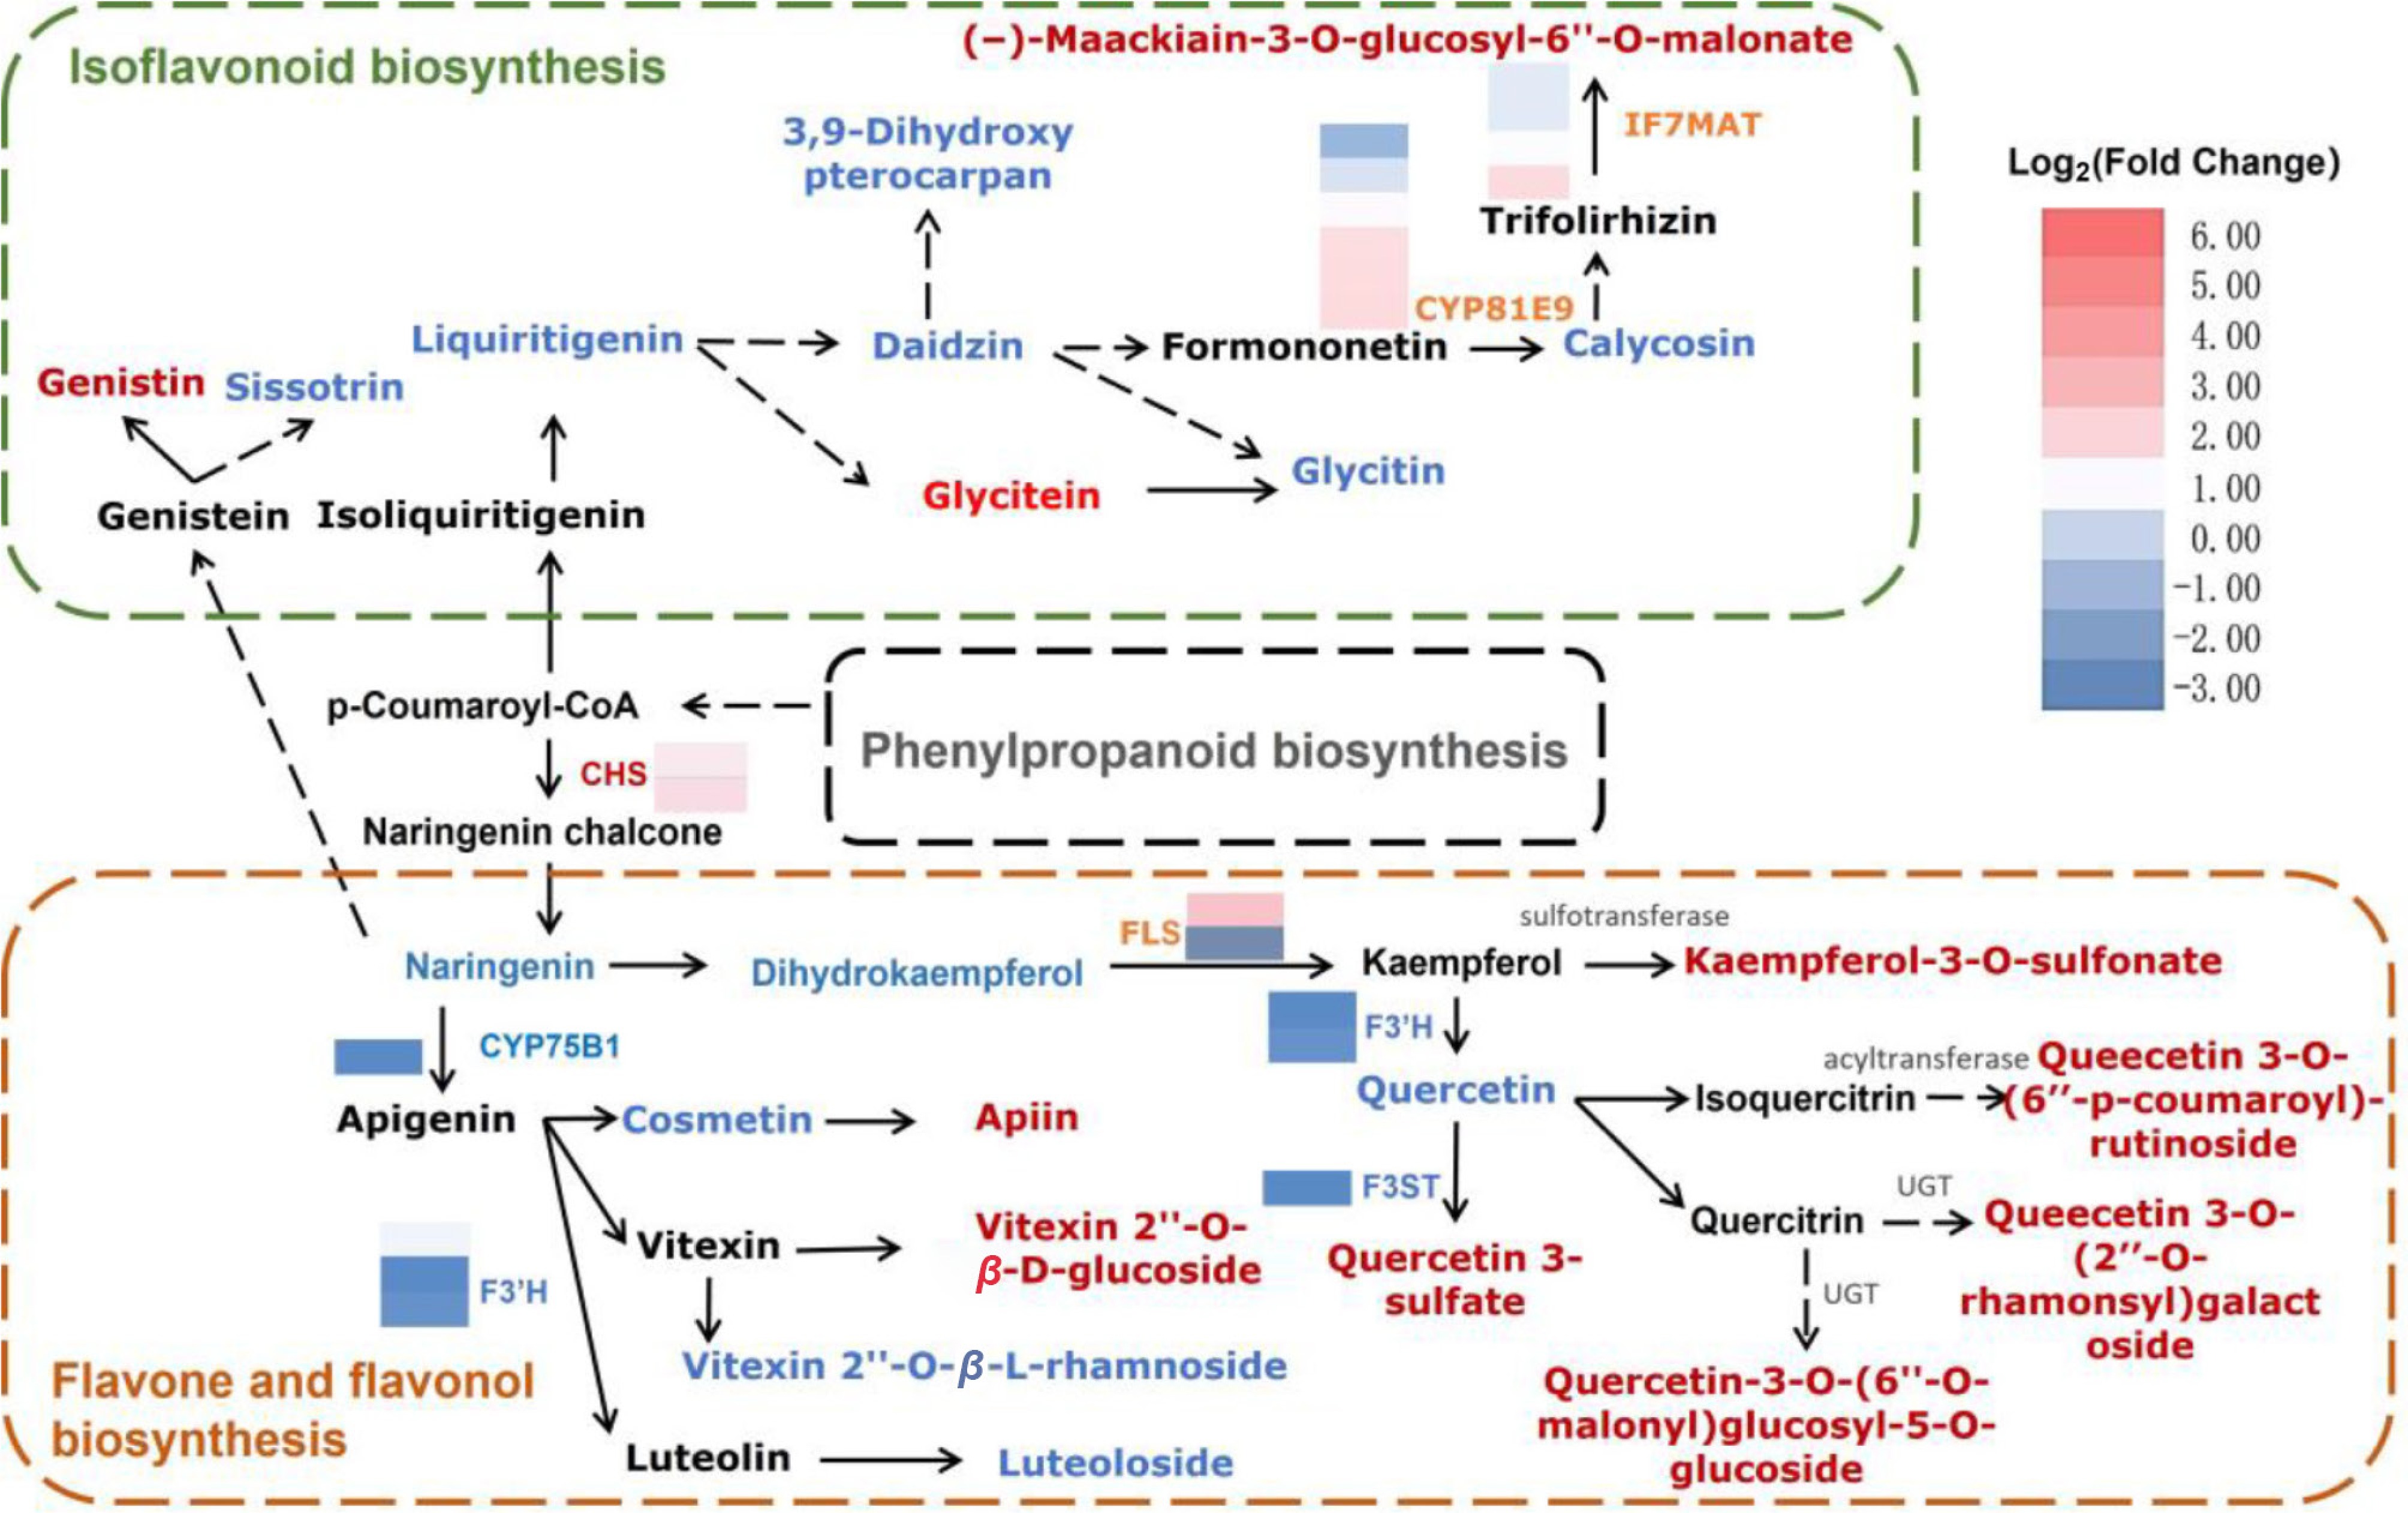
Figure 5.
Reconstruction of the flavone and flavonol biosynthetic pathway with differentially expressed enzyme genes (DEGs) and metabolites (DAMs) in F2 vs. F1.
-
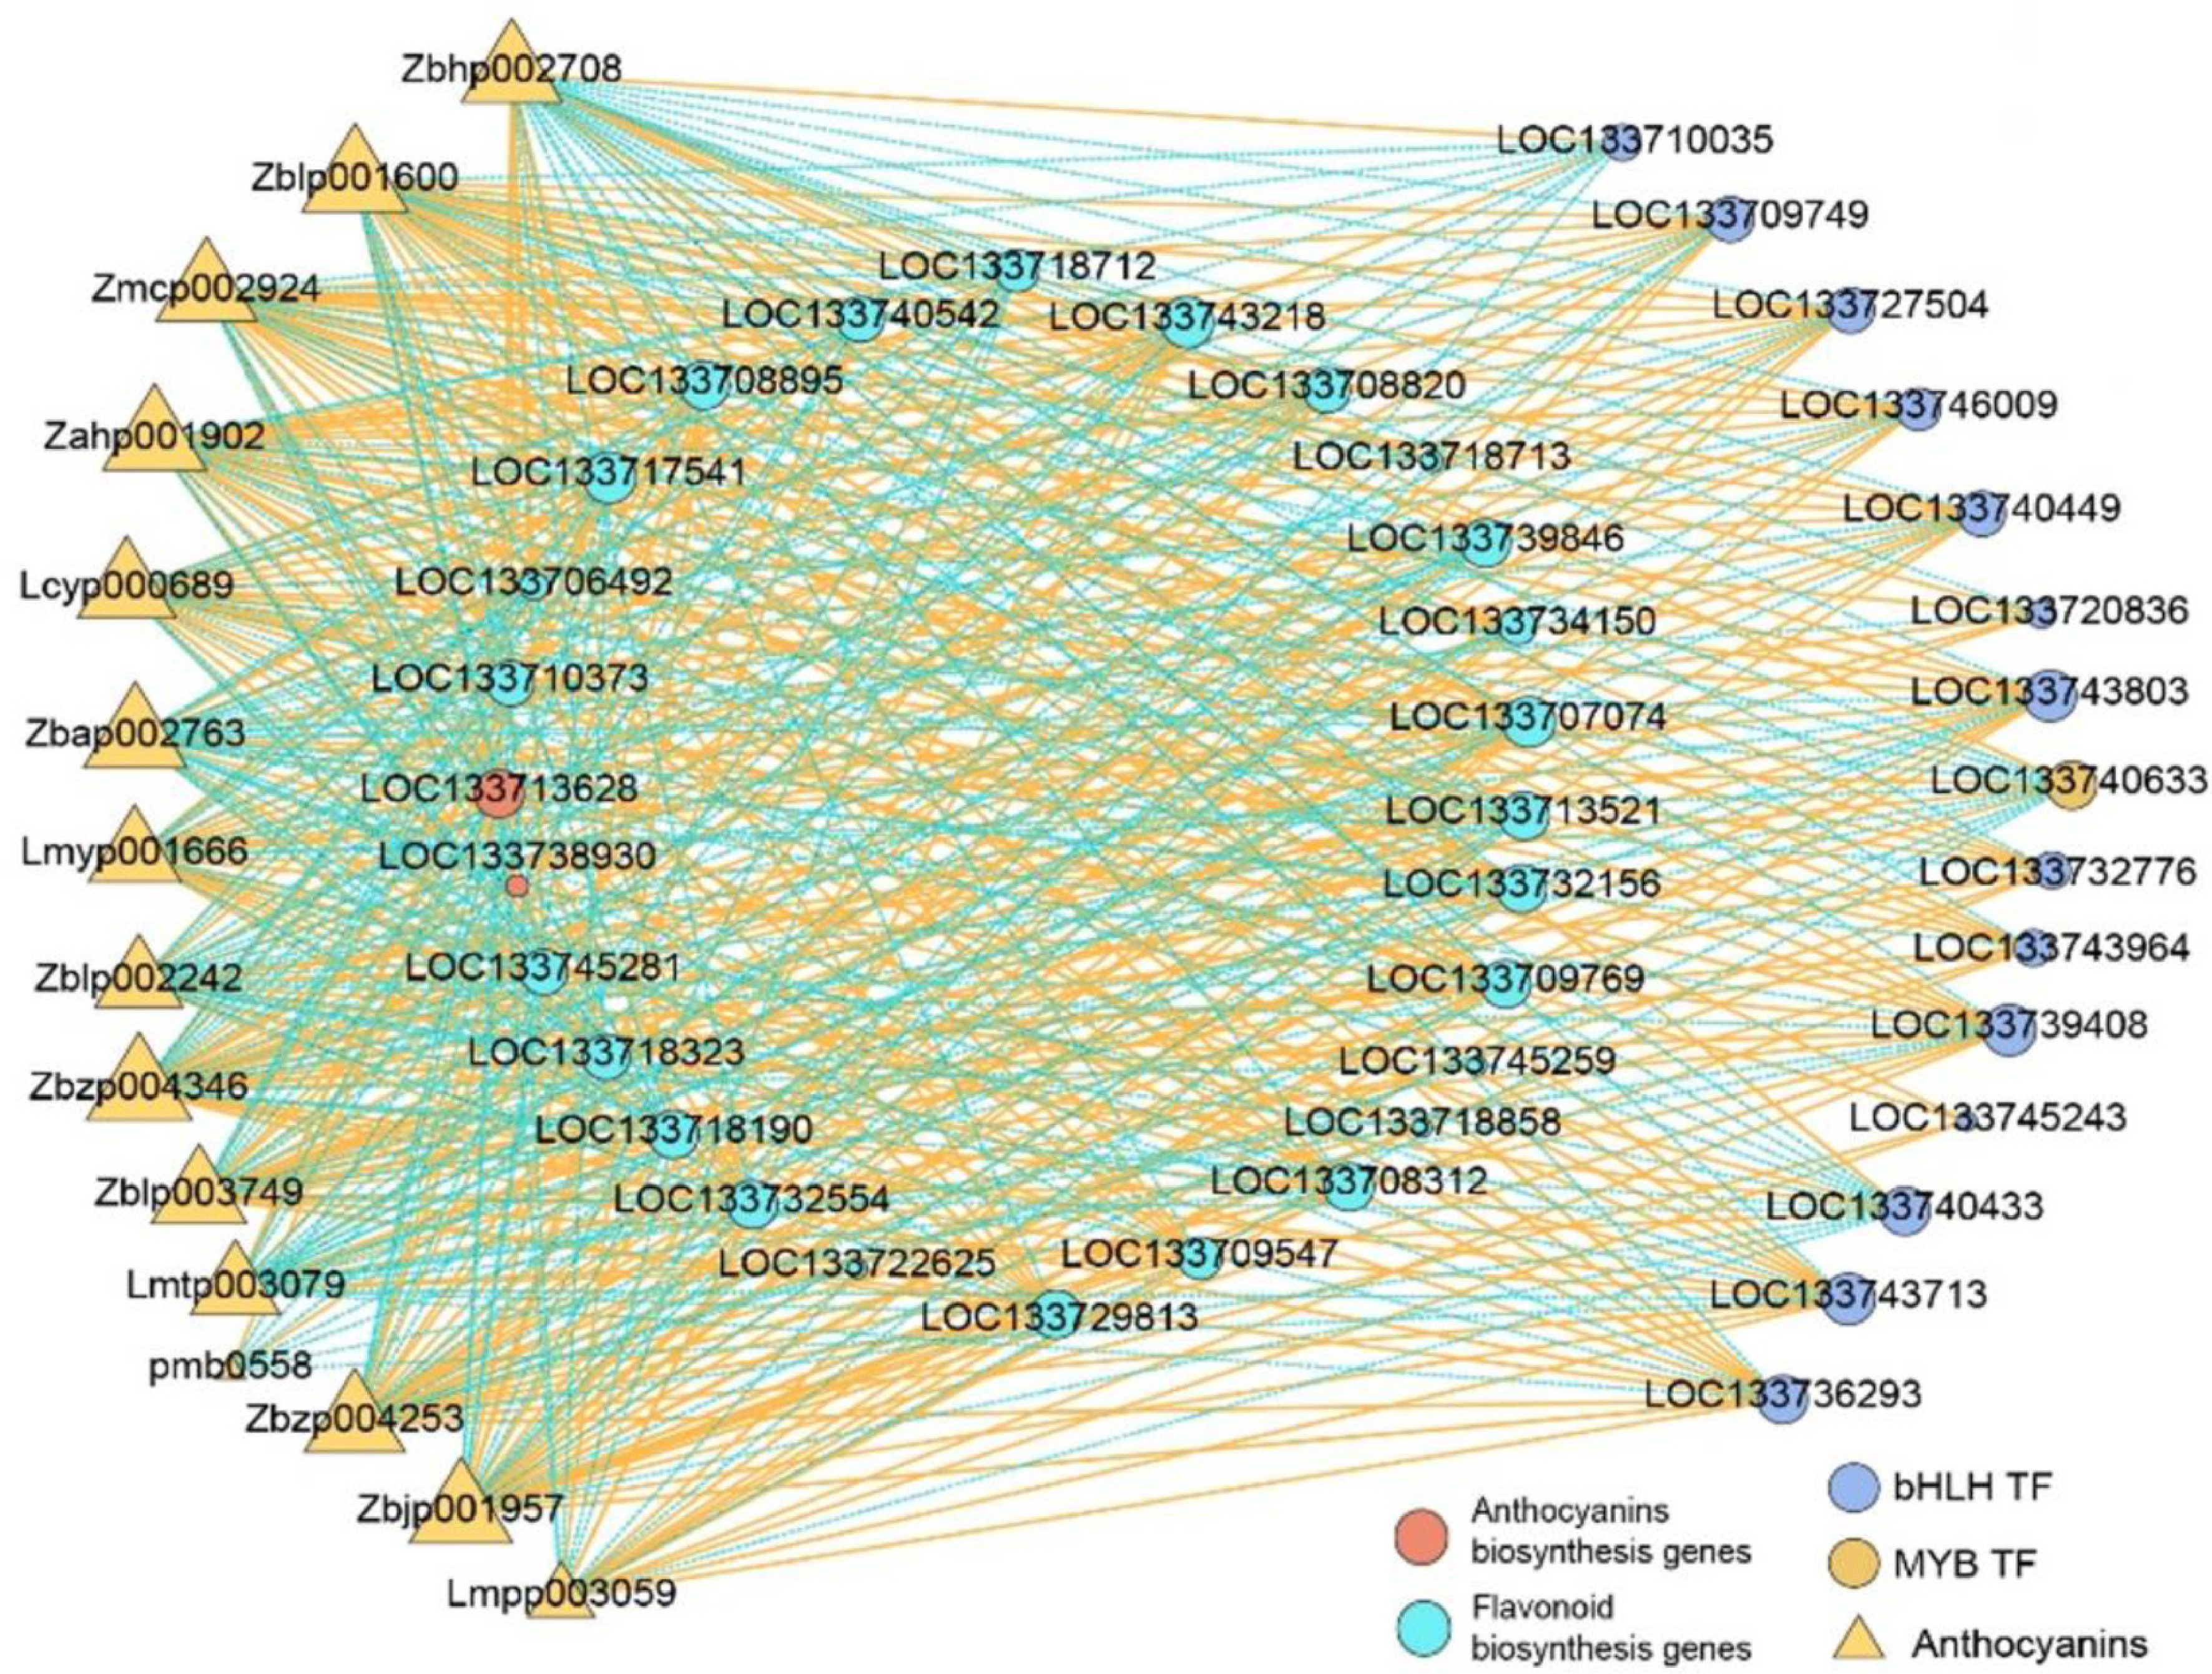
Figure 6.
The co-expression analysis of MYB and bHLH TFs (|Fold change | ≥ 4), DEGs, and DAMs involved in anthocyanin biosynthesis in F2 vs. F1. R was more than 0.9 and less than −0.9, with p < 0.05.
-
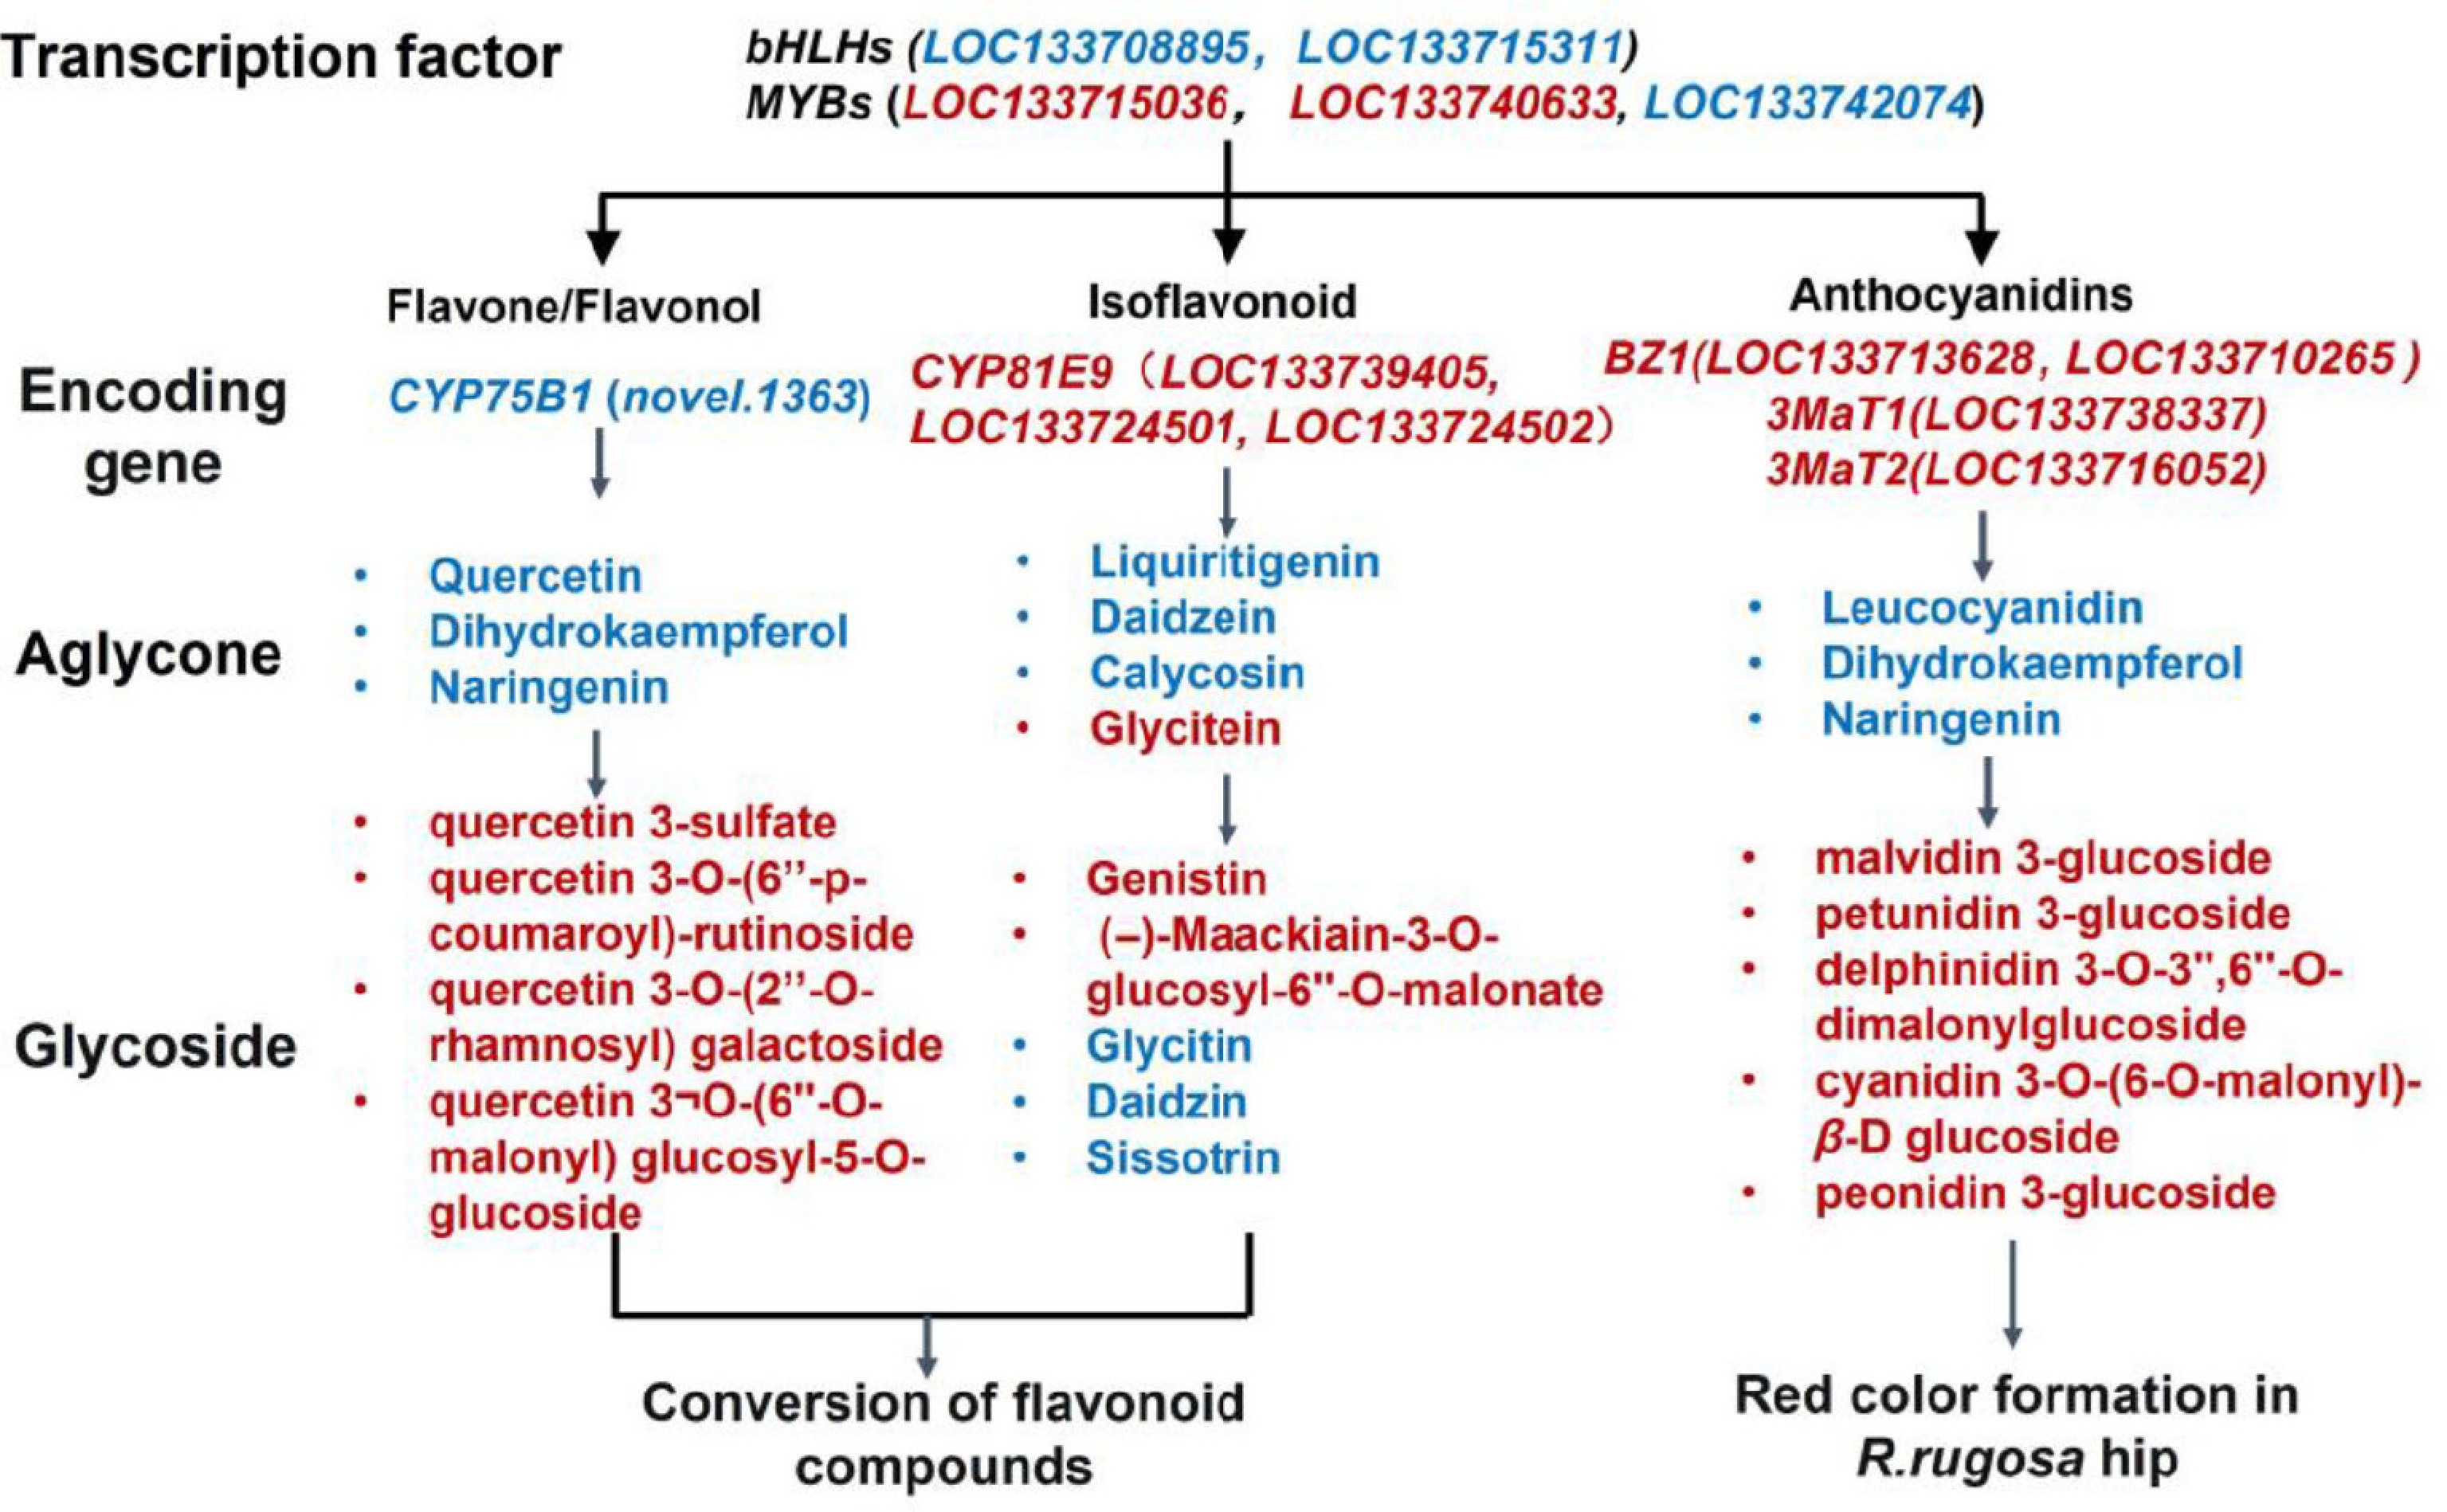
Figure 7.
Core regulatory model diagram of flavonoid metabolism during R. rugosa hip ripening. Red and blue roman font indicates significantly upregulated and downregulated metabolites, respectively. Red and blue italic font indicates significantly upregulated and downregulated genes, respectively.
Figures
(7)
Tables
(0)