-
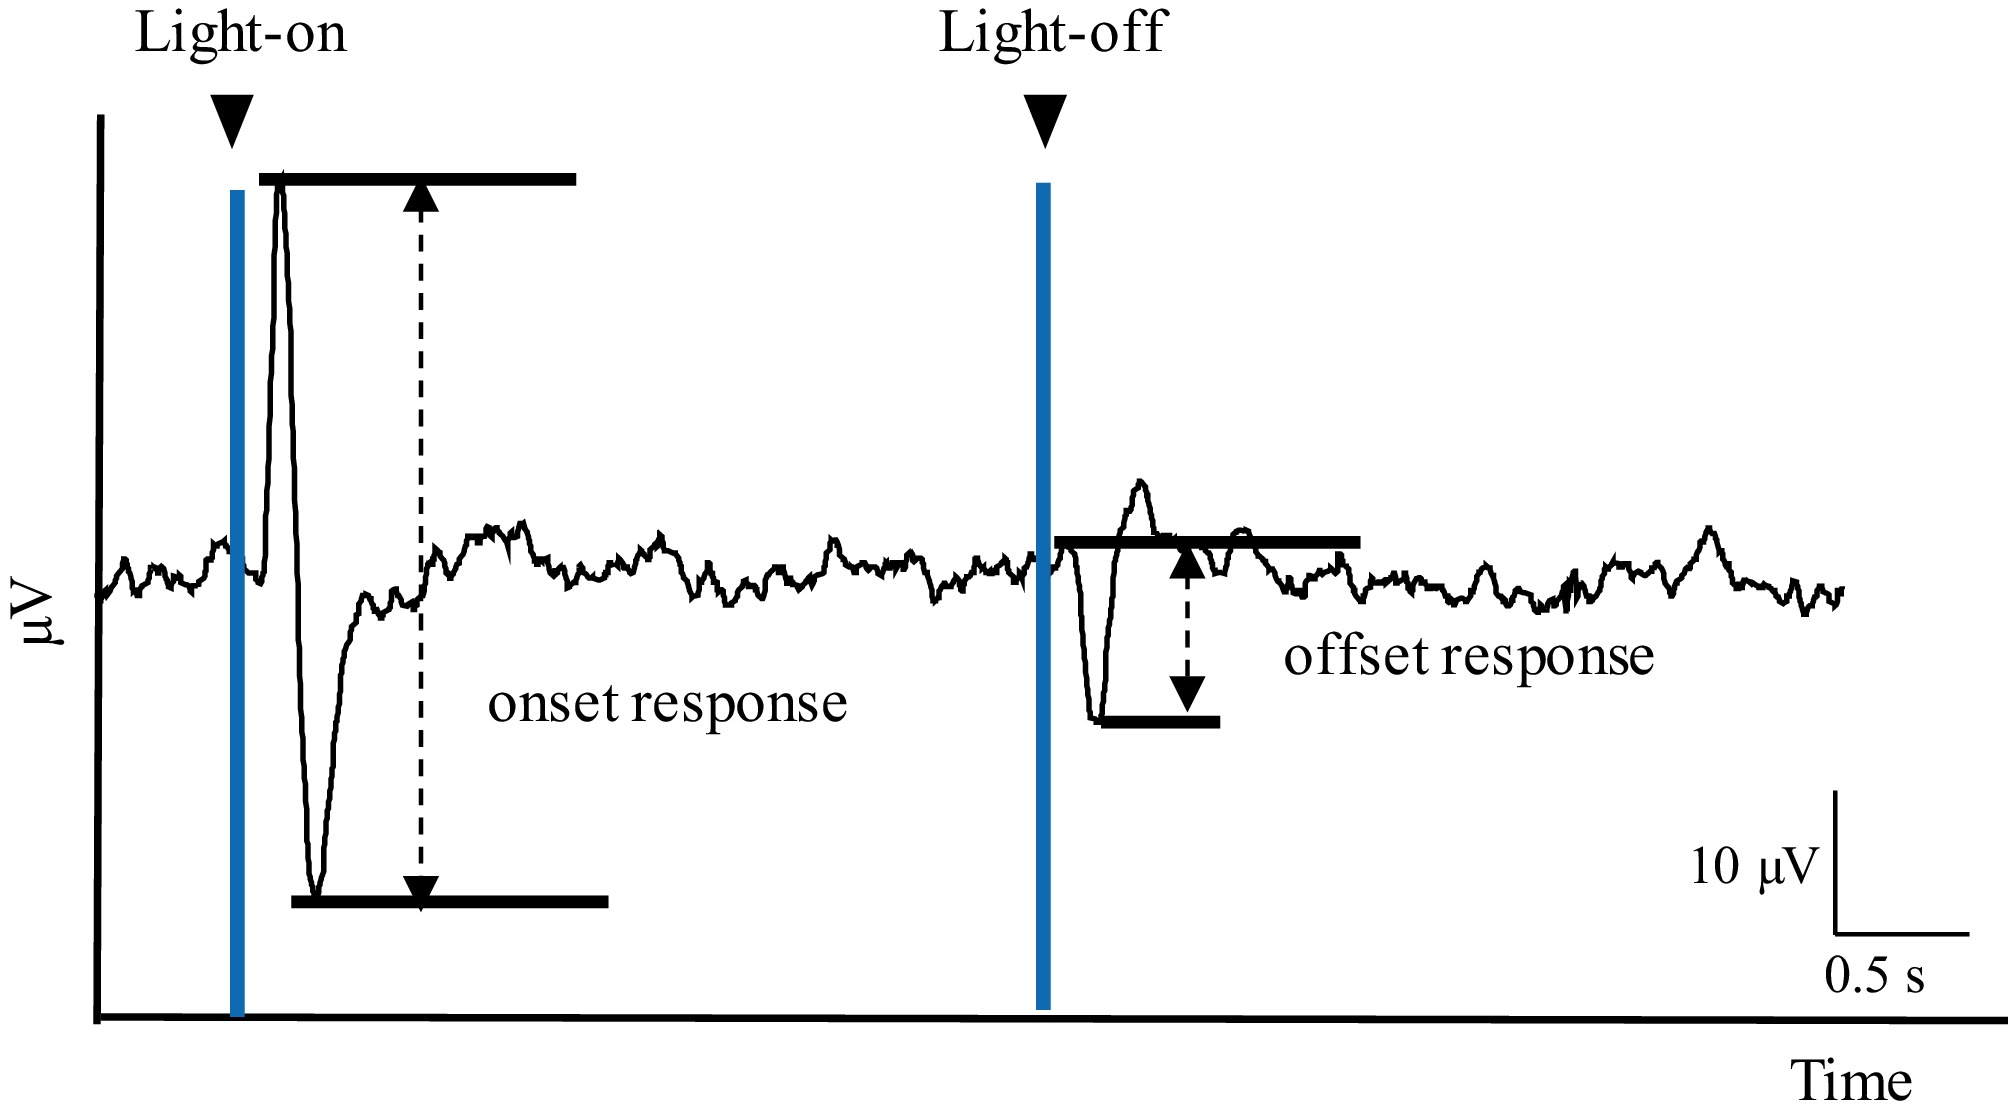
Figure 1.
Example of an ERG showing the assessment of the different types of responses recorded in the retina. The difference between the positive and the negative peak elicited by the stimulus' onset (light-on) was measured to obtain the onset response's amplitude. The amplitude of the offset response to the stimulus was obtained by measuring the negative peak elicited by the stimulus' offset (light-off).
-
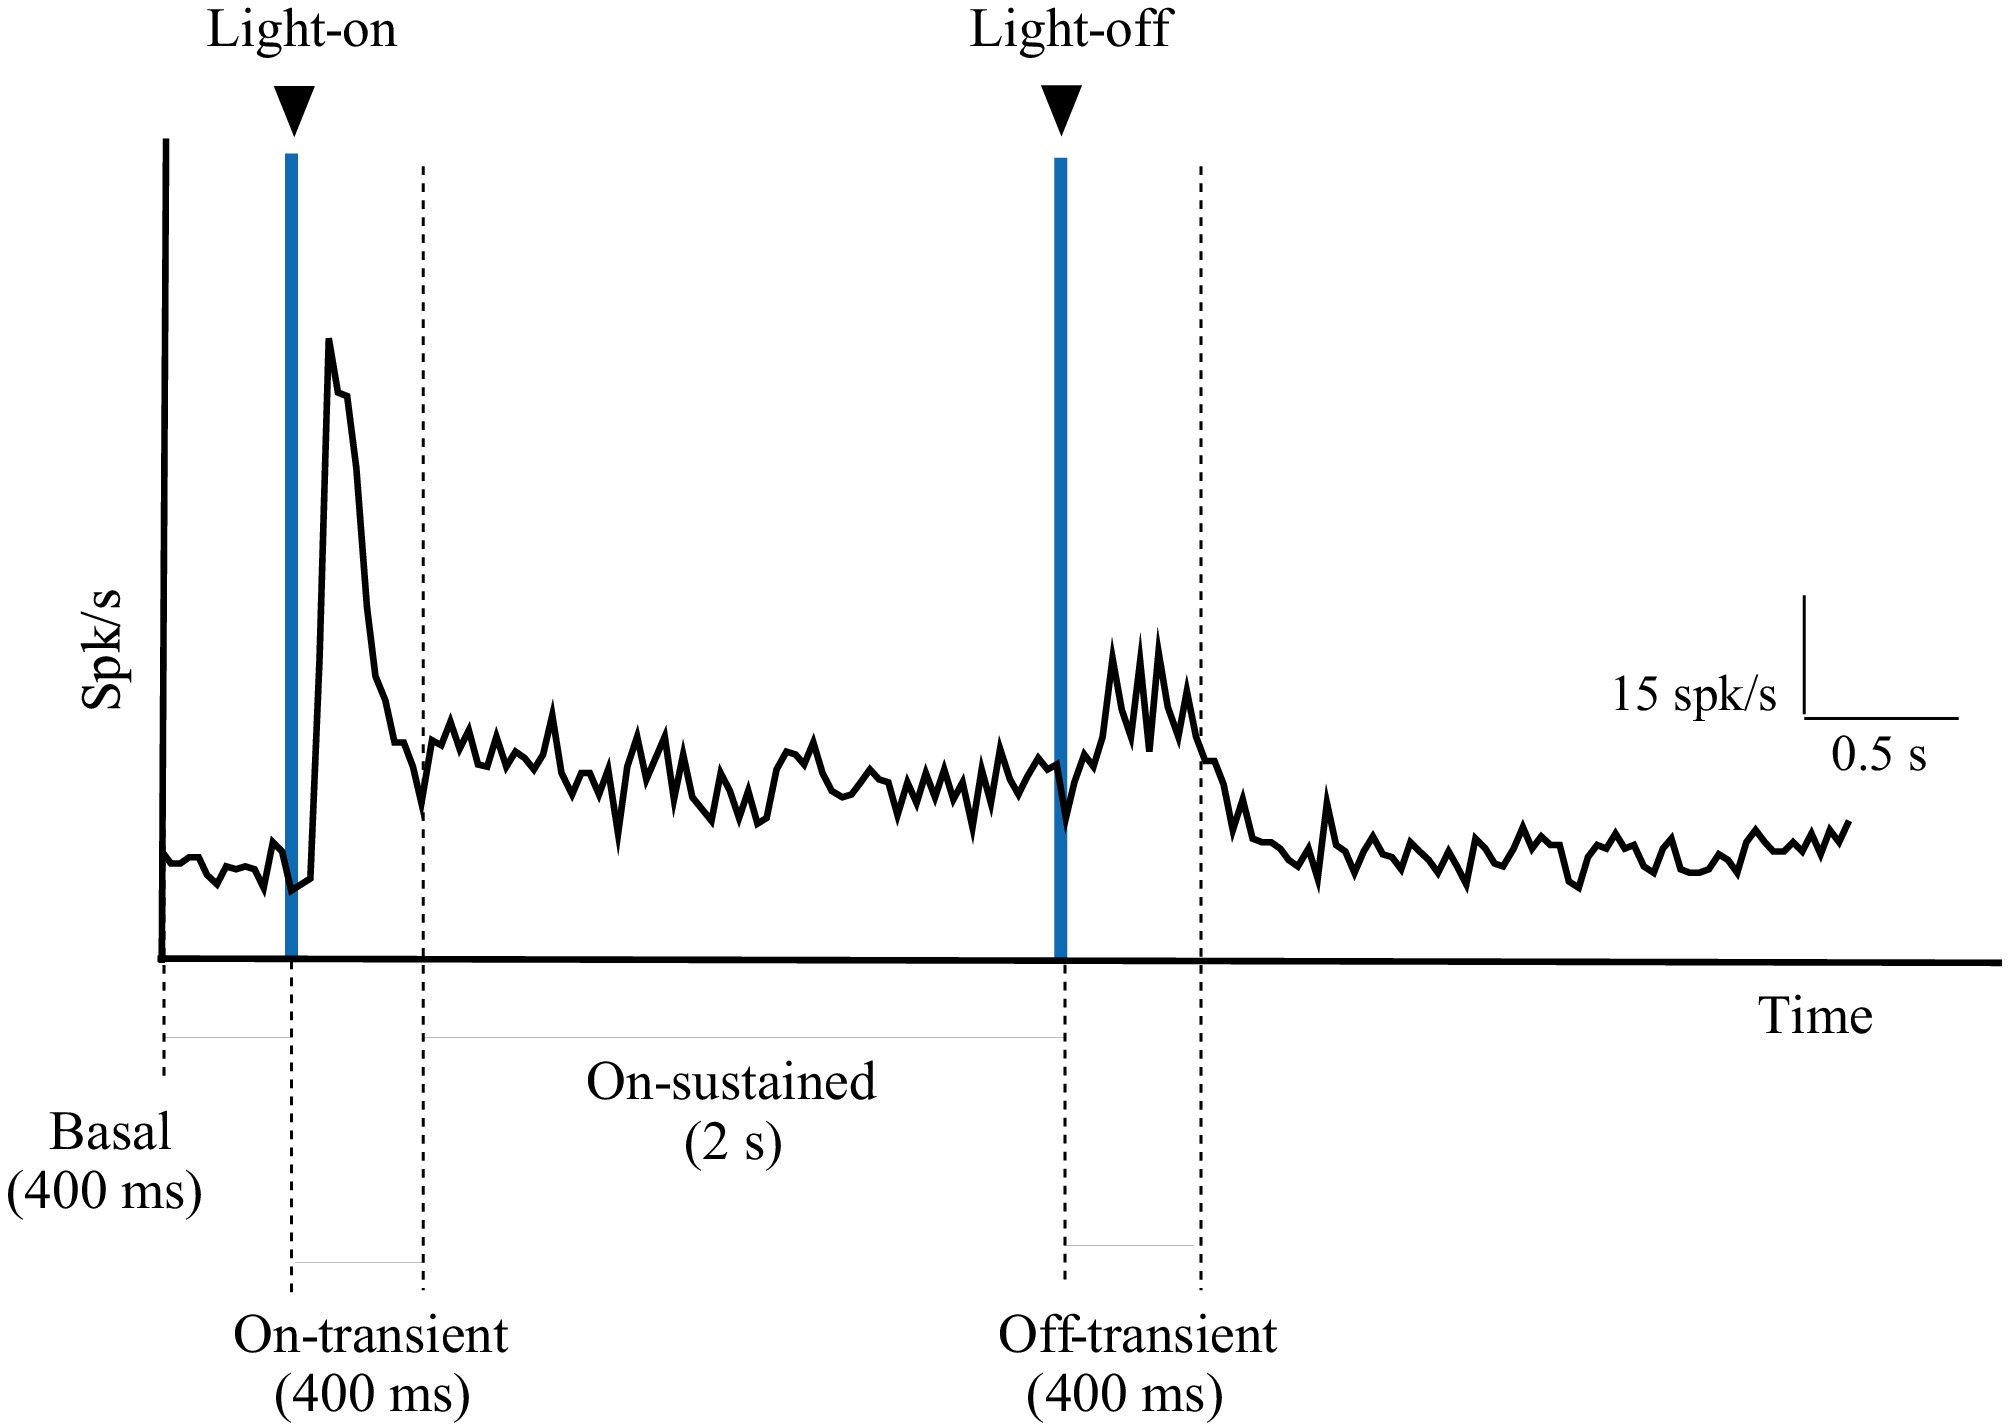
Figure 2.
Example of a histogram showing the assessment of the different types of responses recorded in the SC. The basal response was the activity recorded 400 ms before the stimulus's onset (light-on). The transient response (On–transient) was considered to be the phasic response elicited 400 ms after the stimulus' onset. The sustained response (On–sustained) was considered to be the tonic response to light between 400 ms and 2 s after the stimulus's onset. The phasic response elicited by the stimulus' offset (light-off) was considered to be the transient response (Off–transient).
-
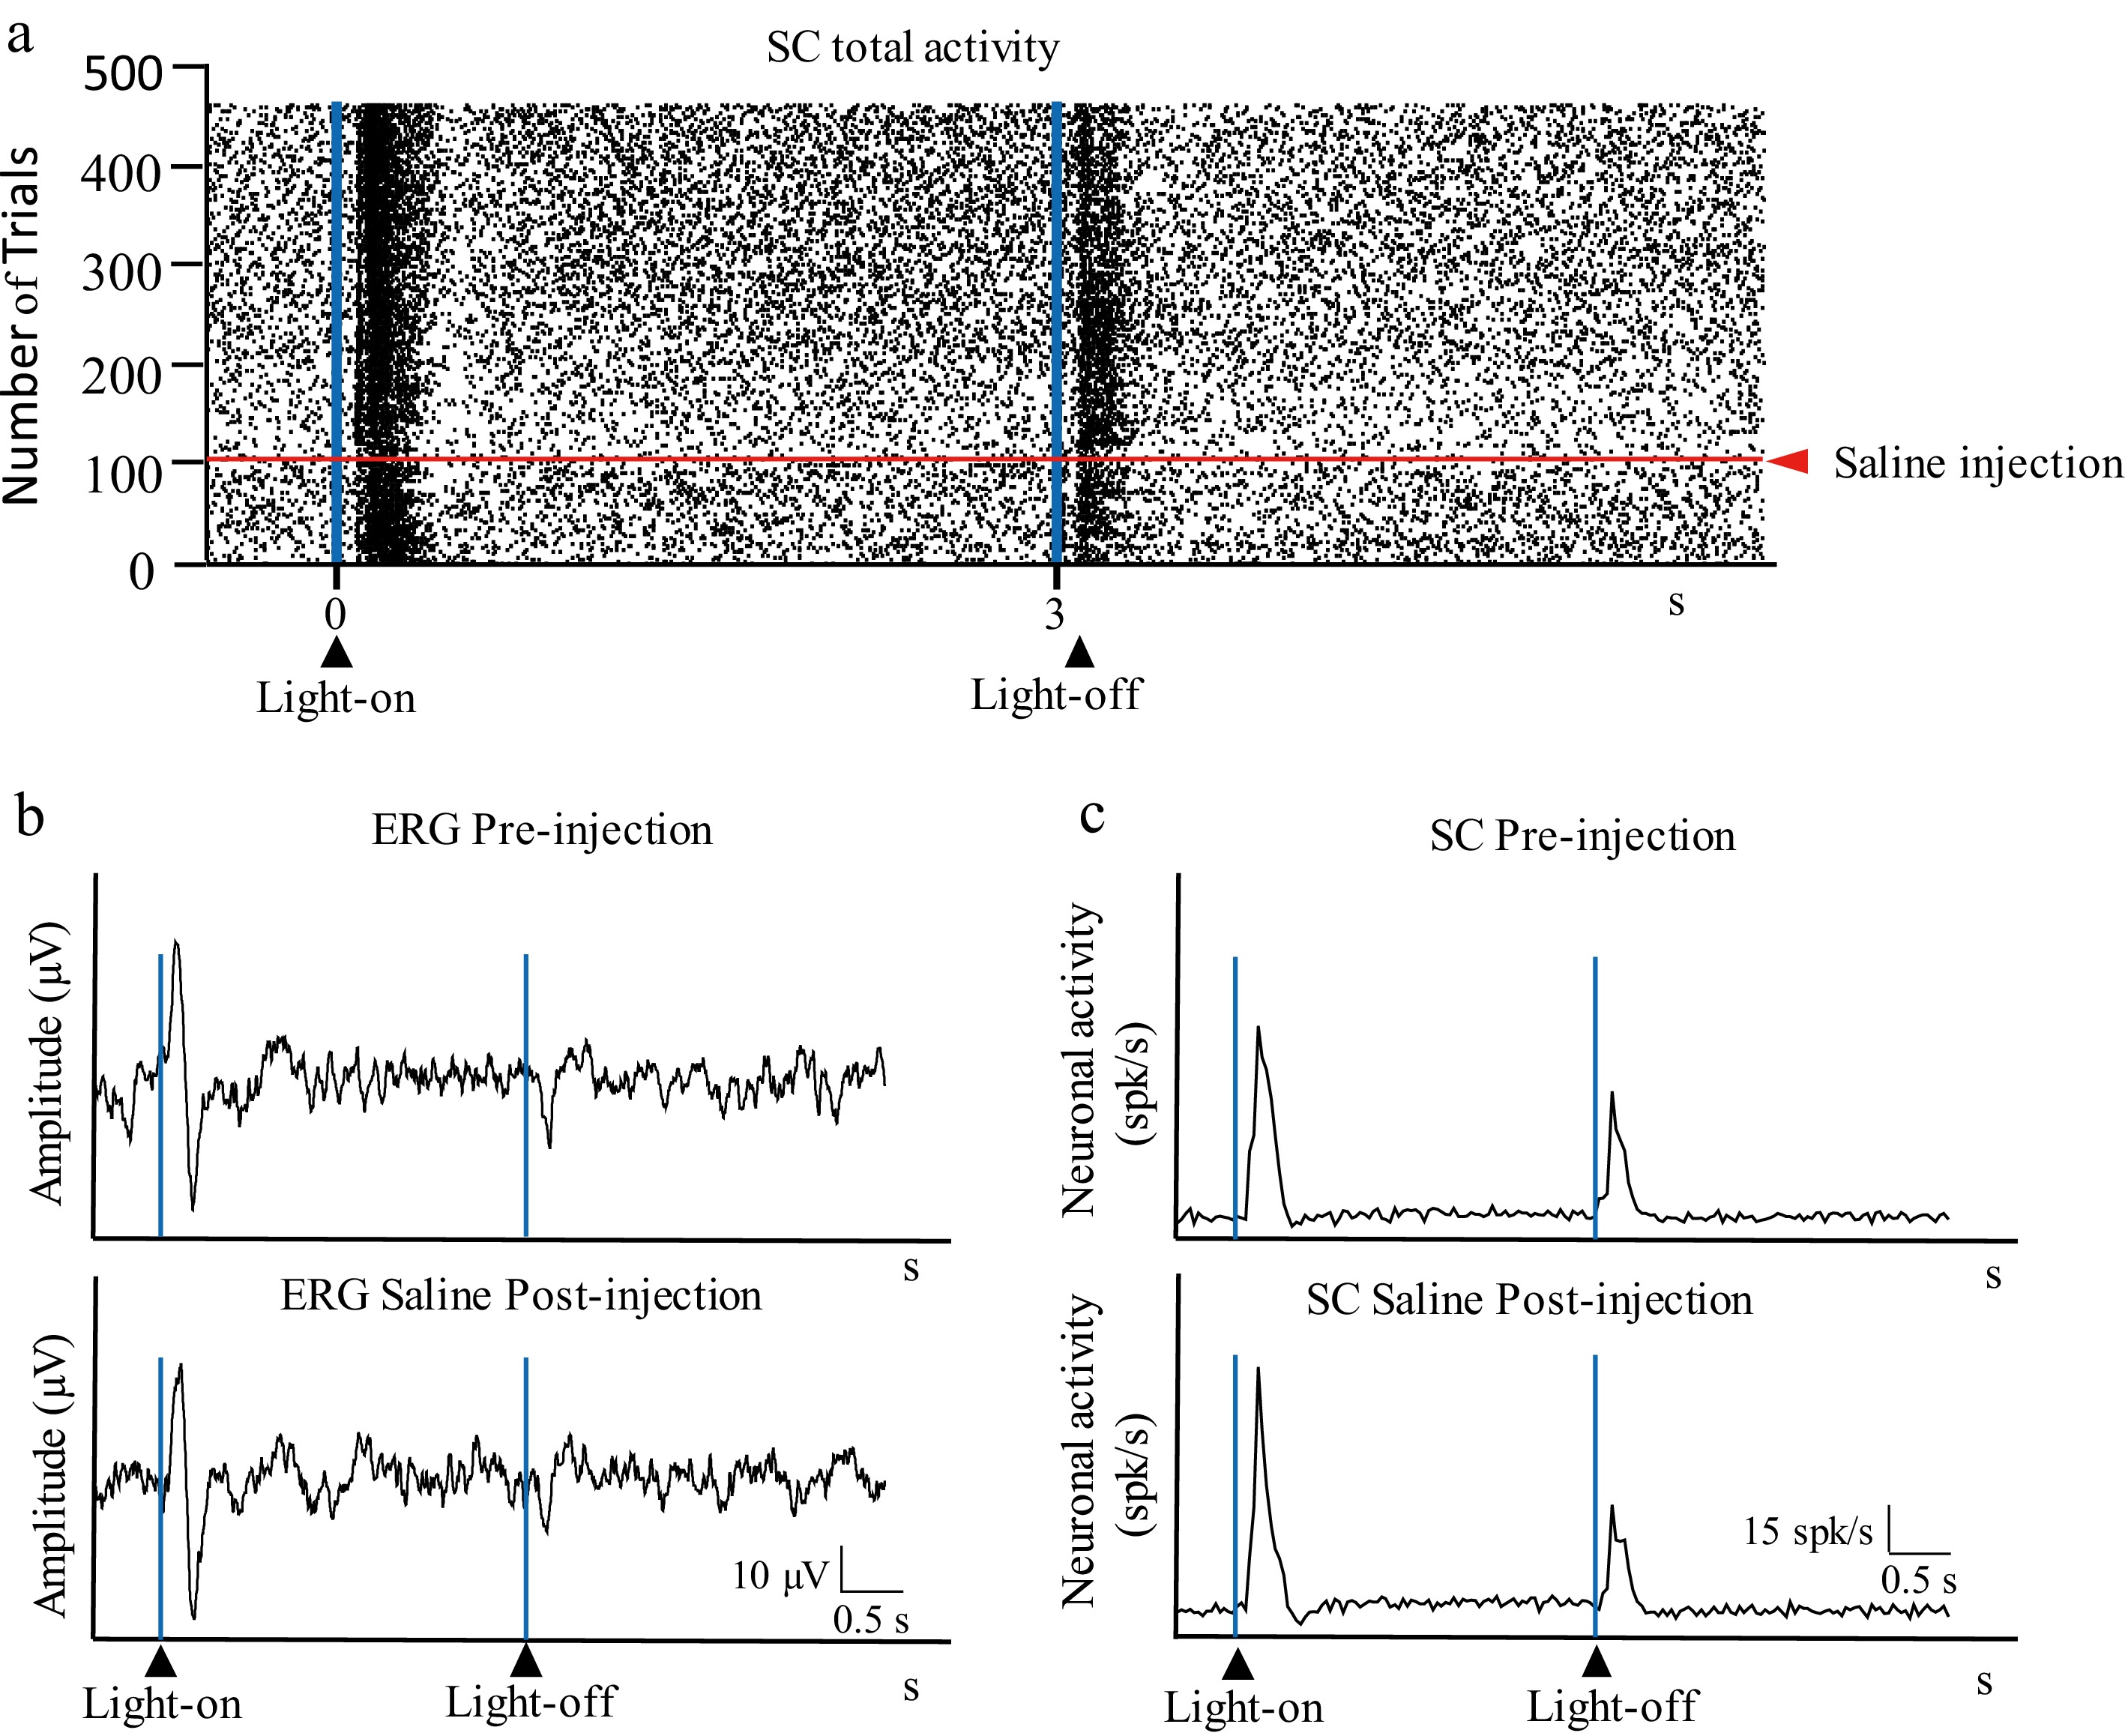
Figure 3.
Intravitreal injection of saline. (a) Raster showing the activity in the superior colliculus (SC, total activity) before and after intravitreal of 5 µL of saline. (b) Retinal activity before (ERG pre-injection) and after (ERG post-injection) the intravitreal injection of saline. (c) Histogram showing the activity in the SC before (SC pre-injection) and after (SC post-injection) intravitreal injection of saline; the vertical axis indicates the average spikes/s of the trials shown in (a).
-
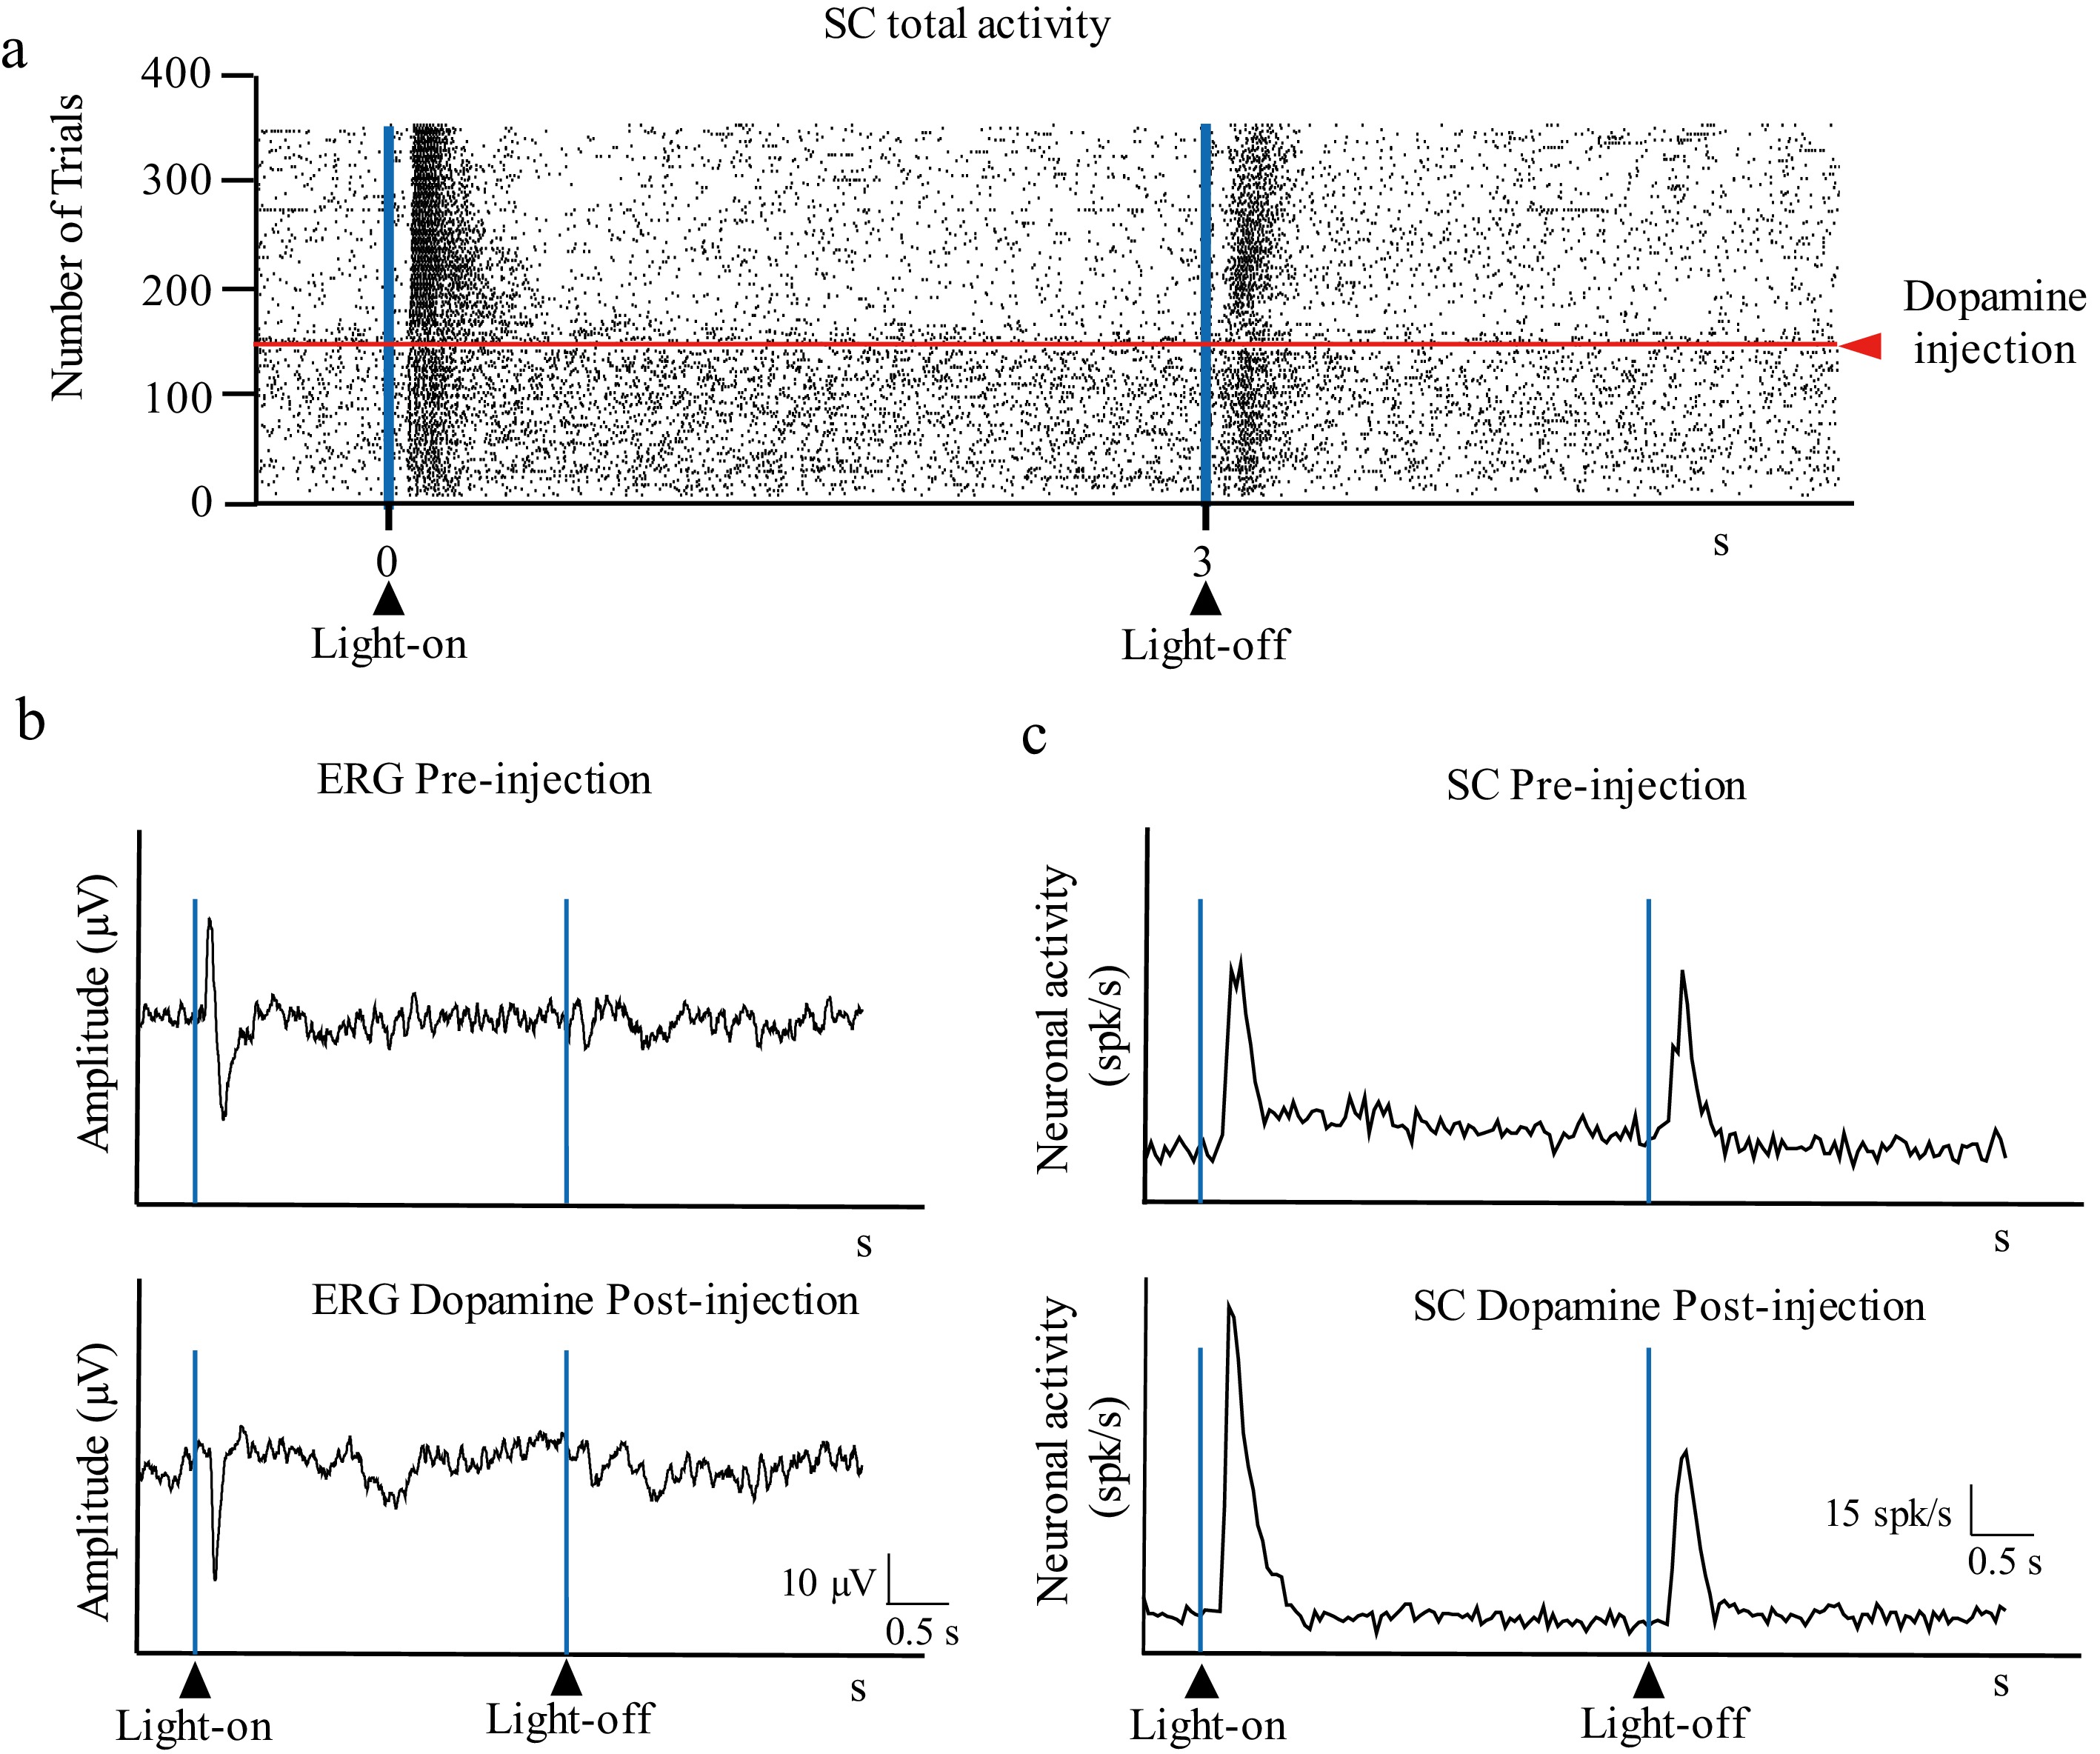
Figure 4.
Effect of intravitreal injection of DA on visual responses. (a) Raster showing the activity in the SC (total activity) before and after intravitreal injection of 5 µL dopamine. (b) Retinal activity before (ERG pre-injection) and after (ERG post-injection) injection of DA (32 mg/mL) intravitreal injection. (c) Histogram showing the activity in the SC (pre-injection) and after (post-injection) intravitreal injection of DA; the vertical axis indicates the average spikes/s of the trials shown in (a).
-
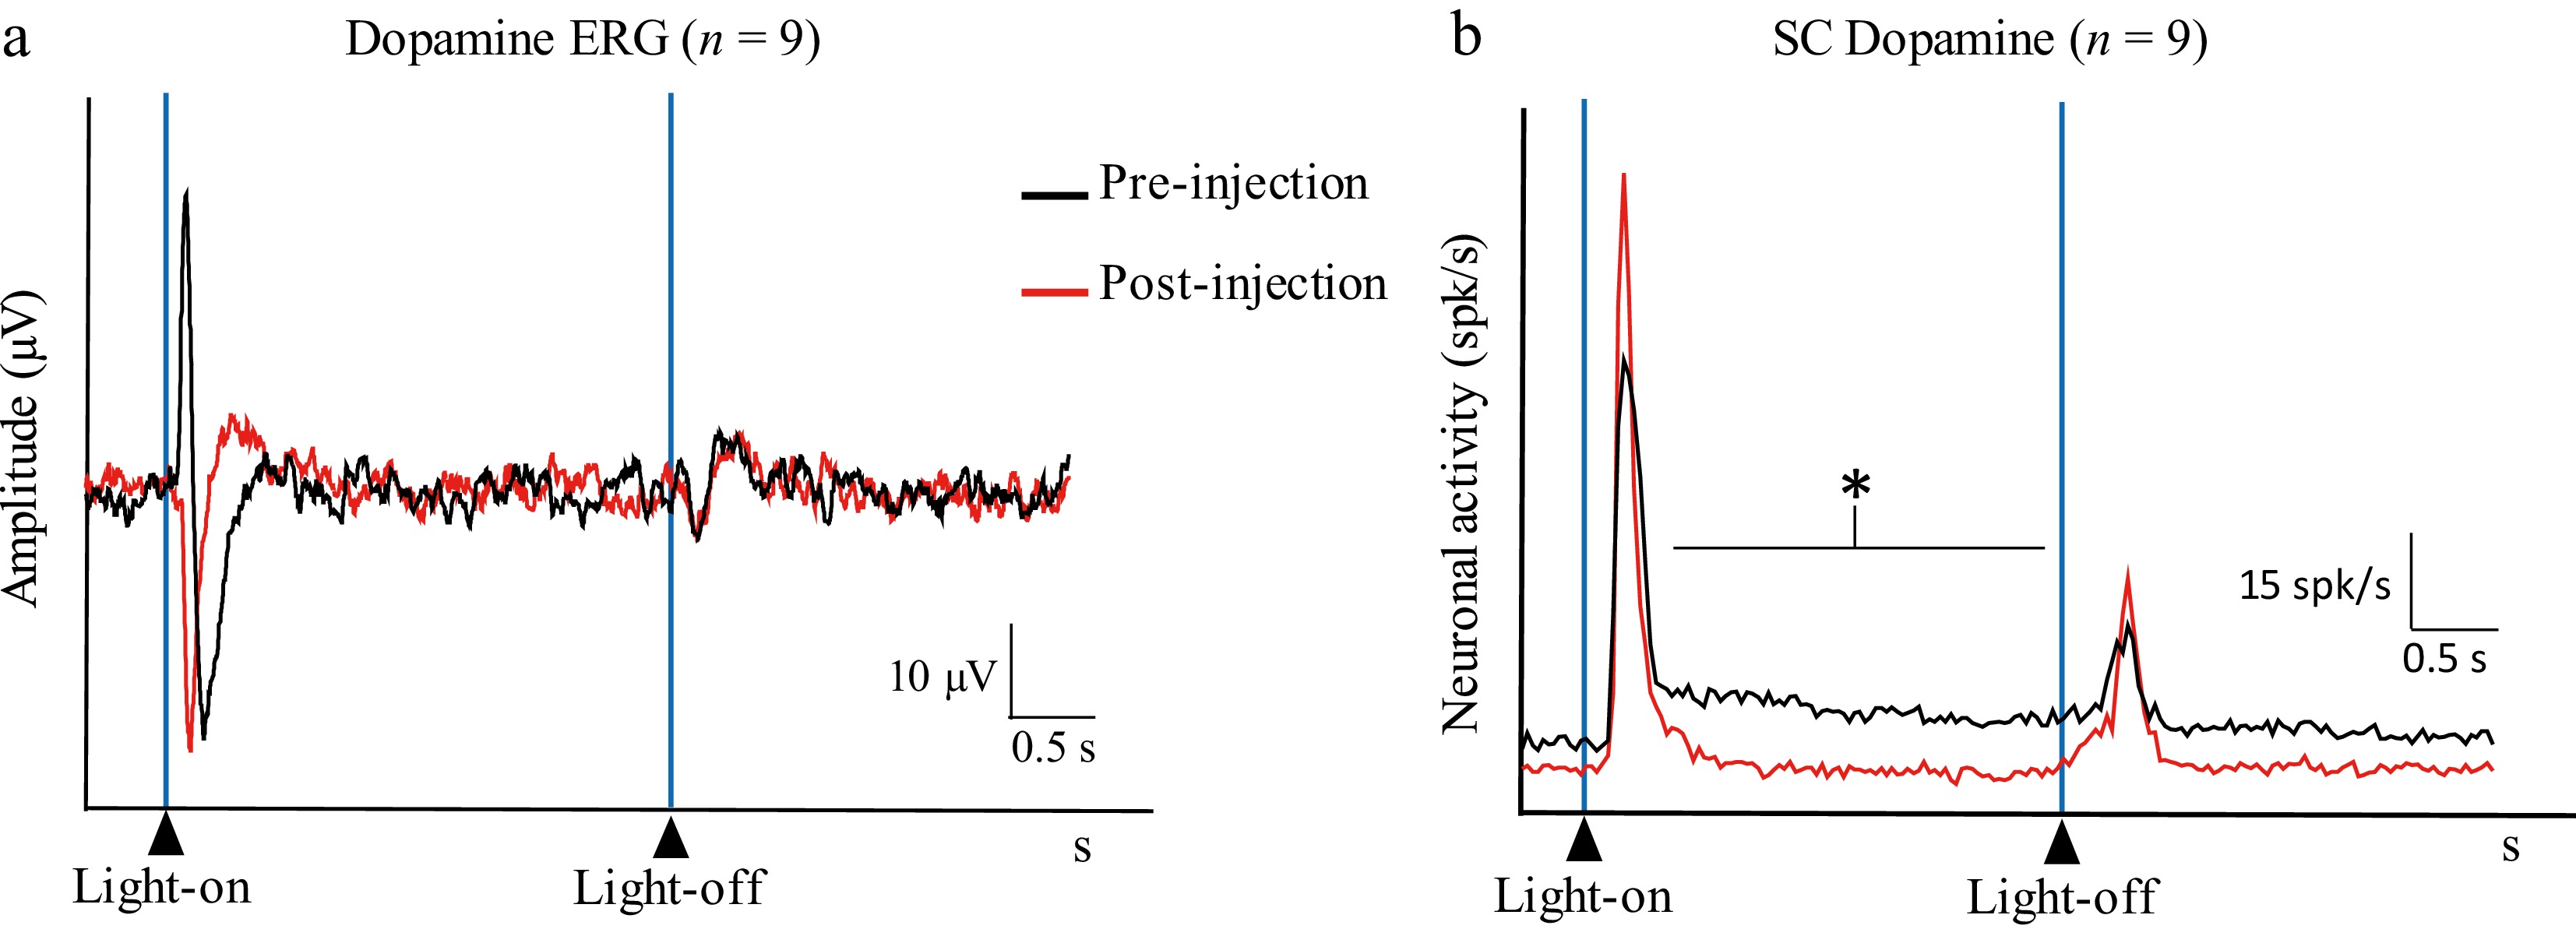
Figure 5.
DA population histograms showing (a) the retinal activity (Dopamine ERG) and (b) the activity in the SC (Dopamine SC) before (pre-injection; black line) and after (post-injection; red line) intravitreal injection of DA (32 mg/mL) (average of n = 9 multiunit recordings made in nine different animals) (* p < 0.05).
-
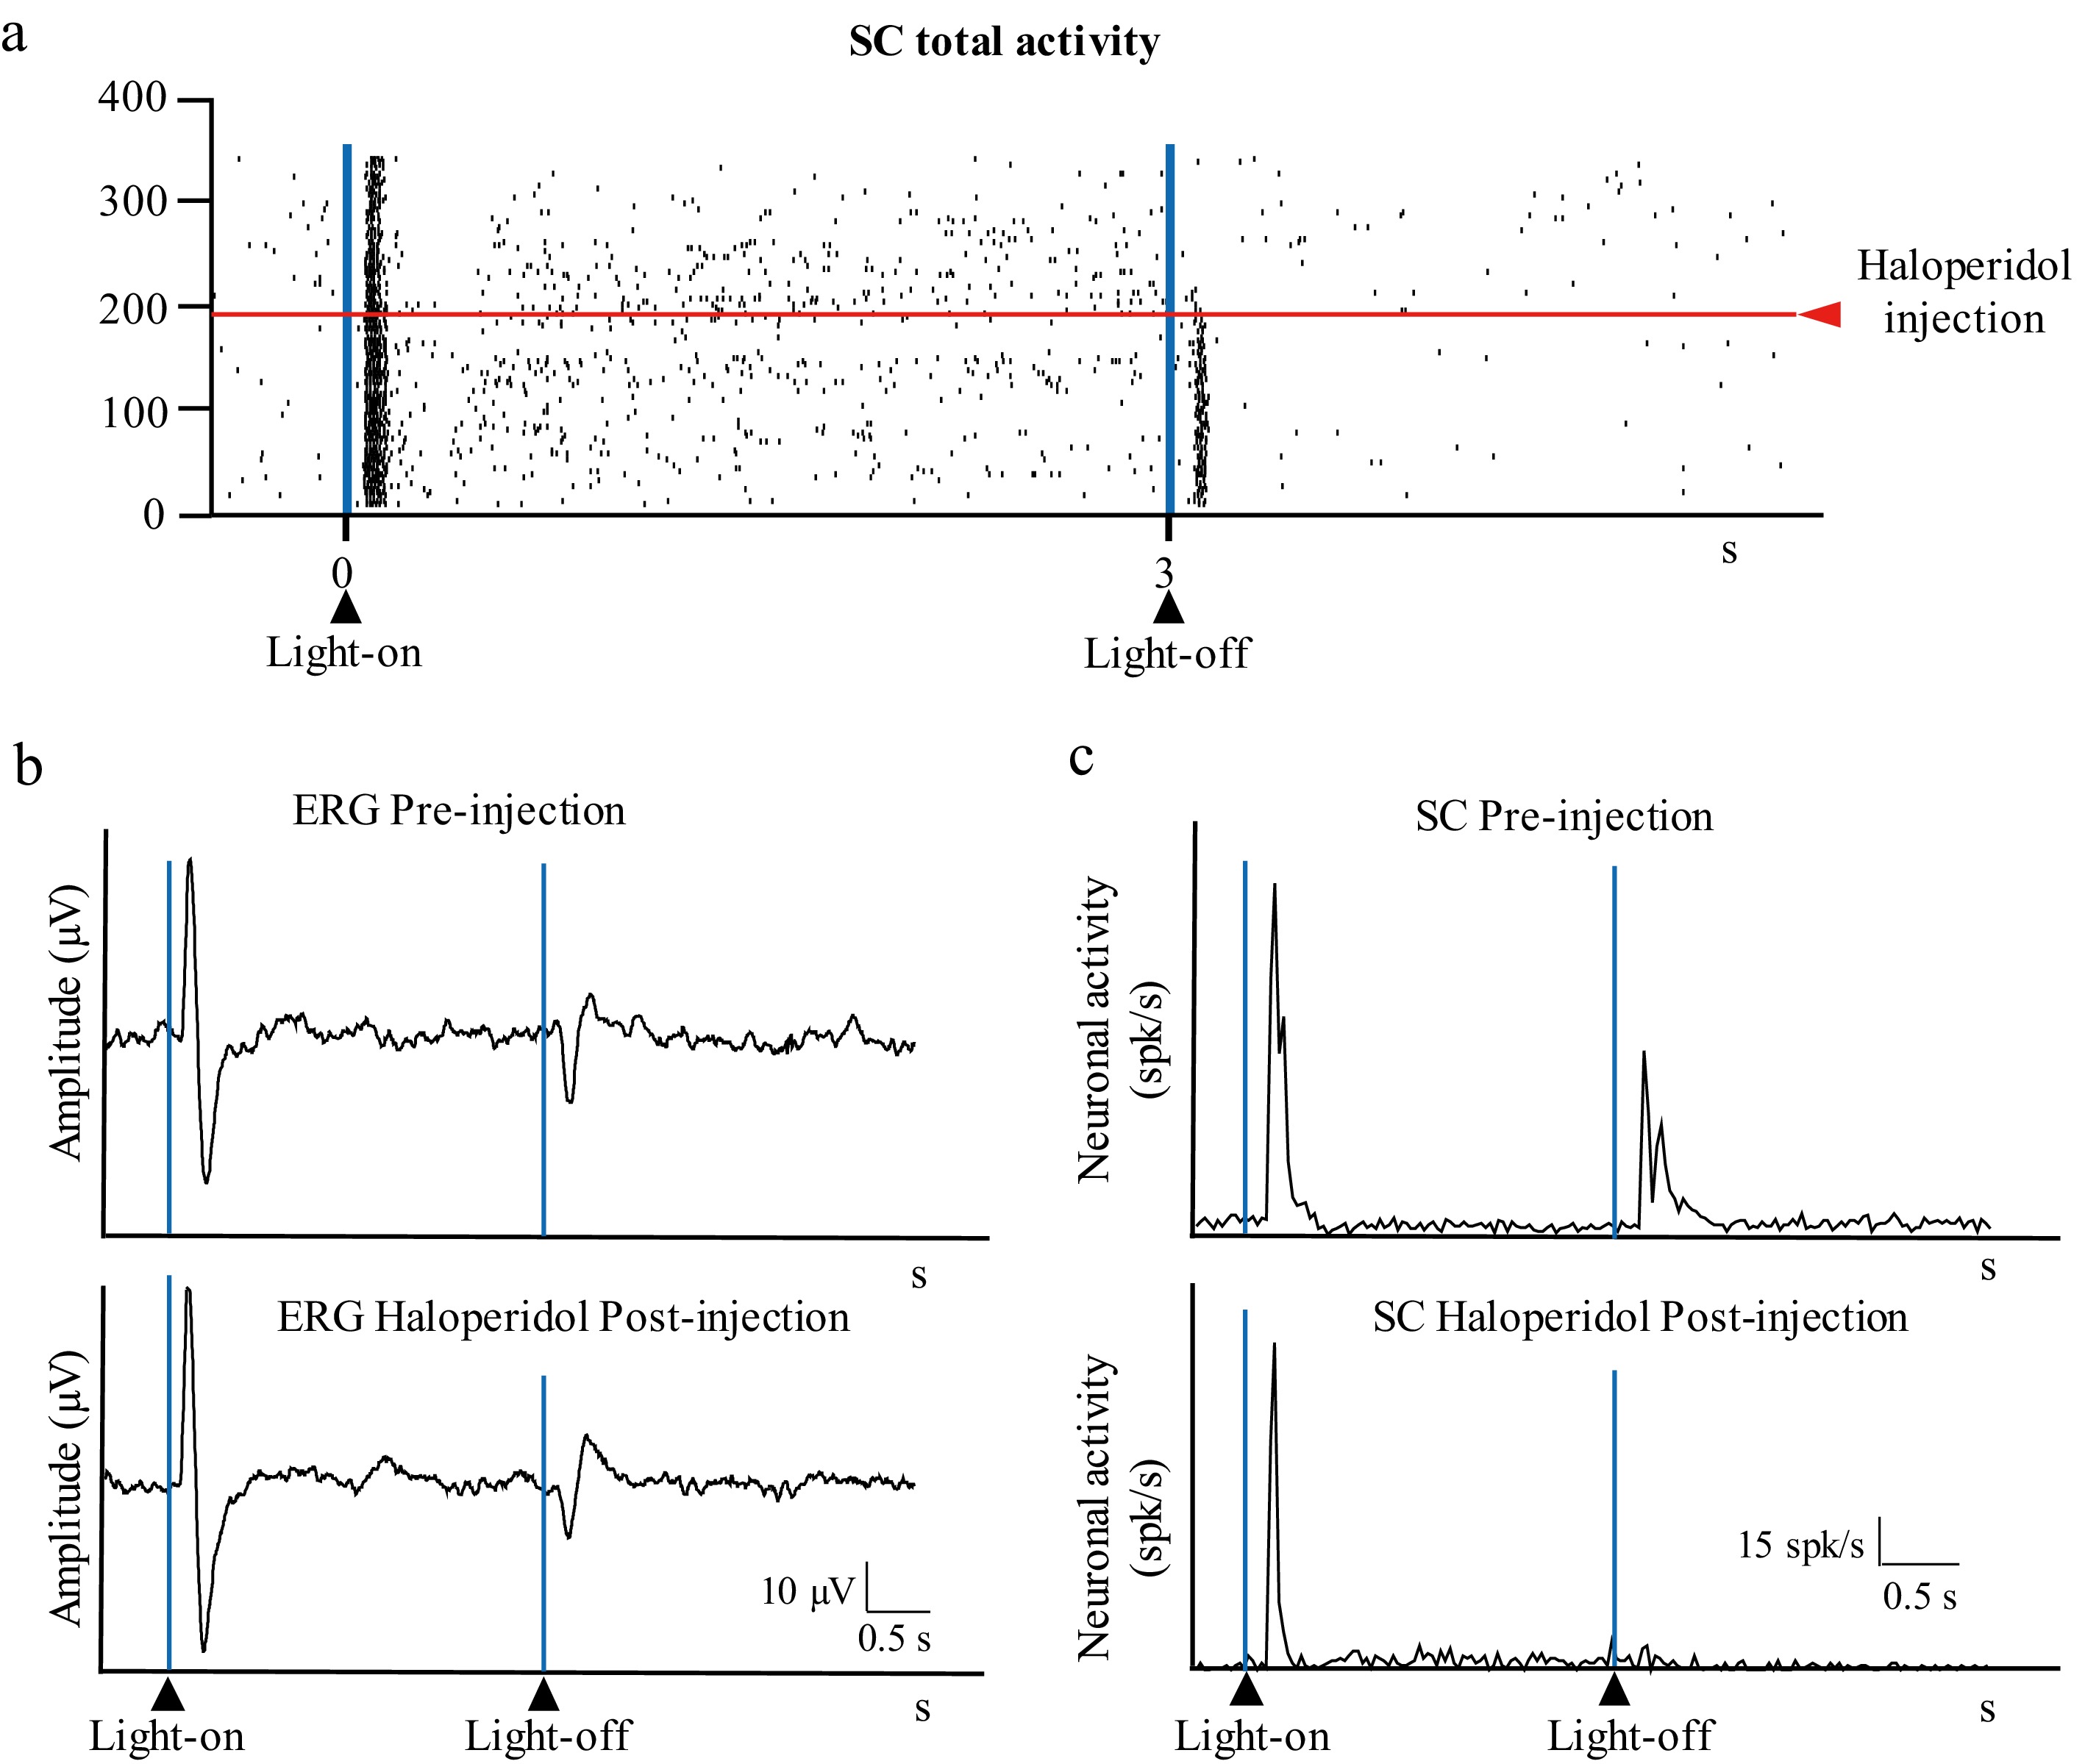
Figure 6.
Effect of HA intravitreal injection on visual responses. (a) Raster showing the activity in the SC (total activity) before and after intravitreal of 5 µL HA. (b) Retinal activity before (ERG pre-injection) and after (ERG haloperidol post-injection) the intravitreal injection. (c) Histogram showing the activity in the SC before (SC pre-injection) and after (SC haloperidol post-injection) intravitreal injection of HA (0.66 mM); the vertical axis indicates the average spikes/s of the trials shown in (a).
-
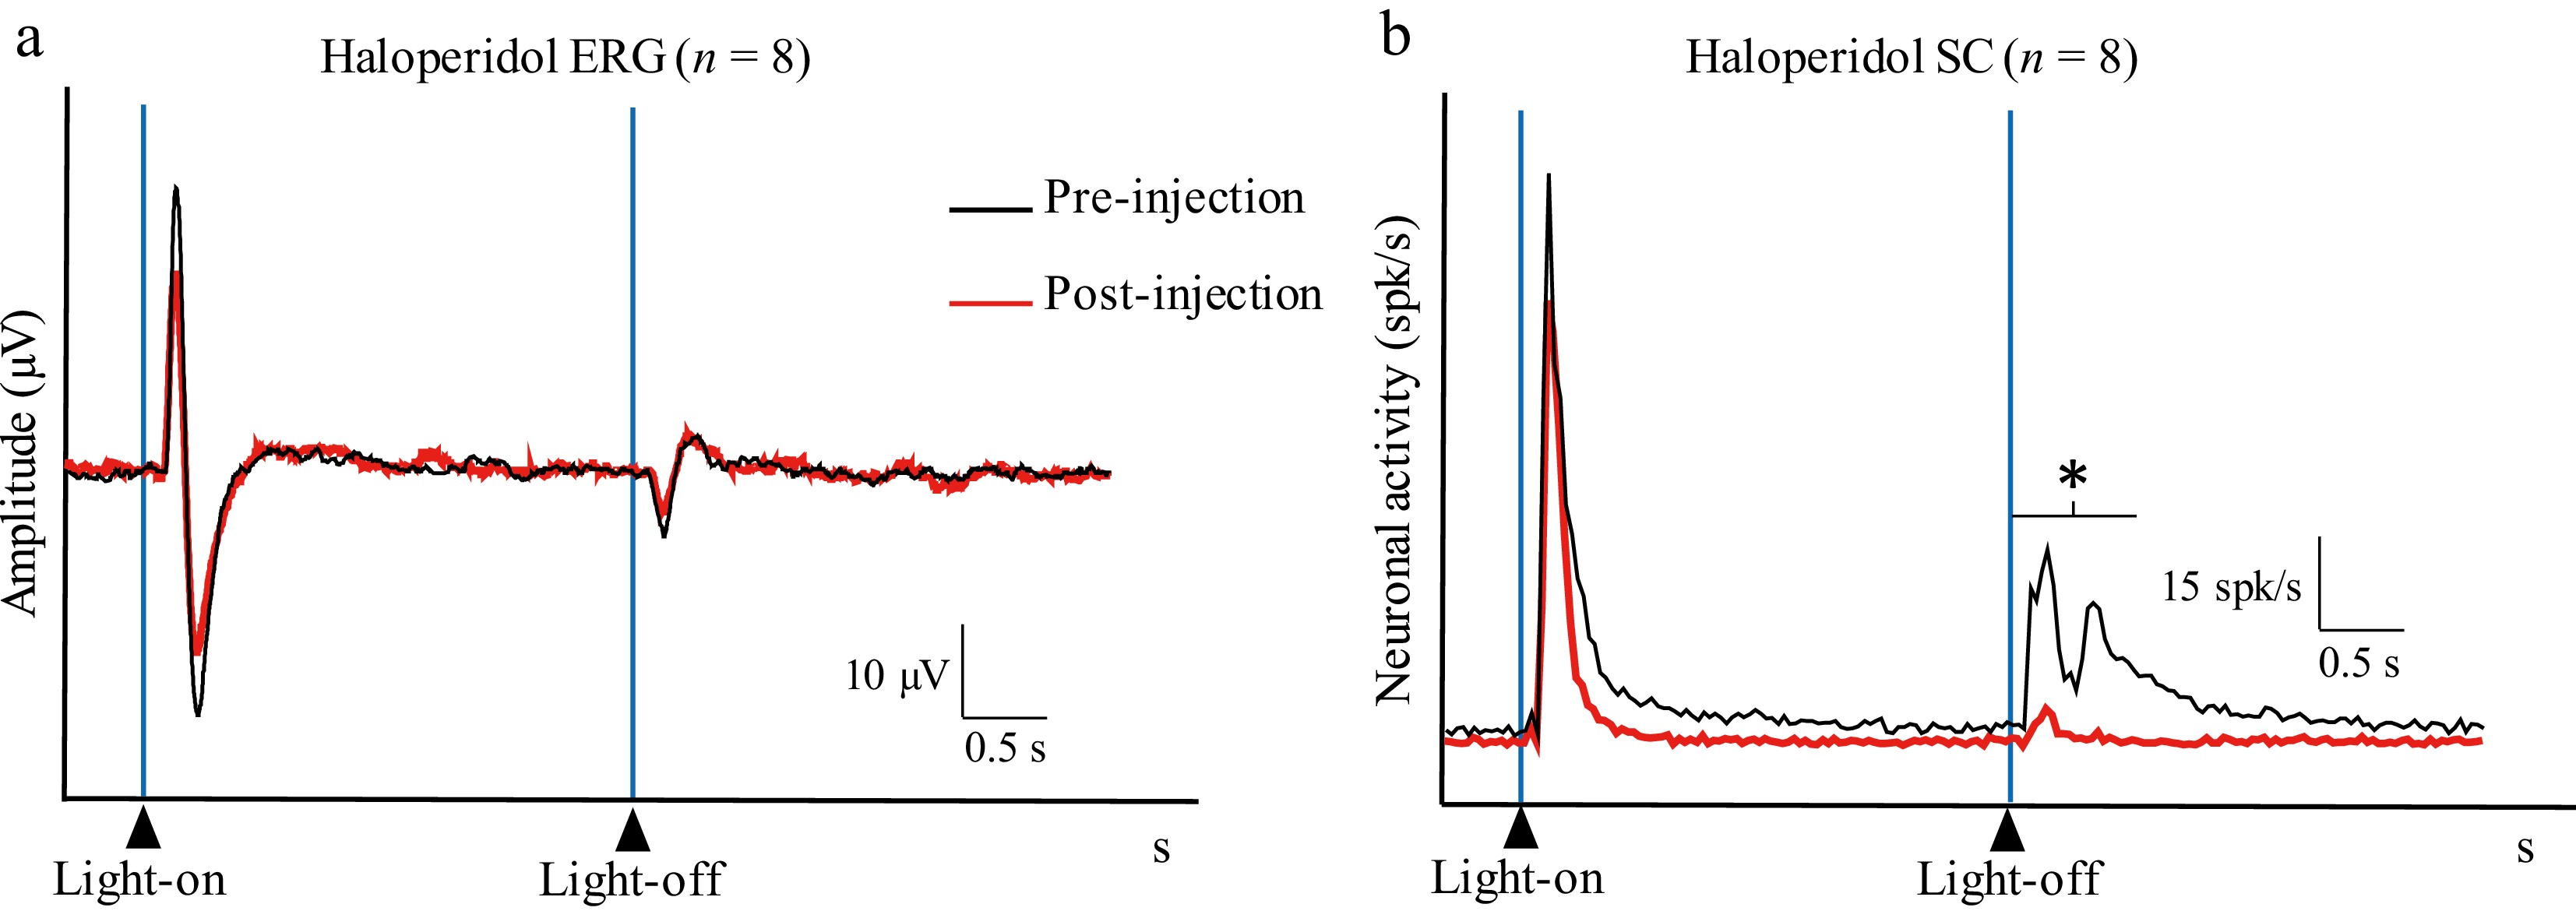
Figure 7.
HA population histograms showing (a) the retinal activity (Haloperidol ERG) and (b) the activity in the SC (Haloperidol SC) before (pre-injection; black line) and after (post-injection; red line) intravitreal injection of HA (0.66 mM) (average of n = 8 multiunit recordings made in 8 different animals) (* p < 0.05).
-
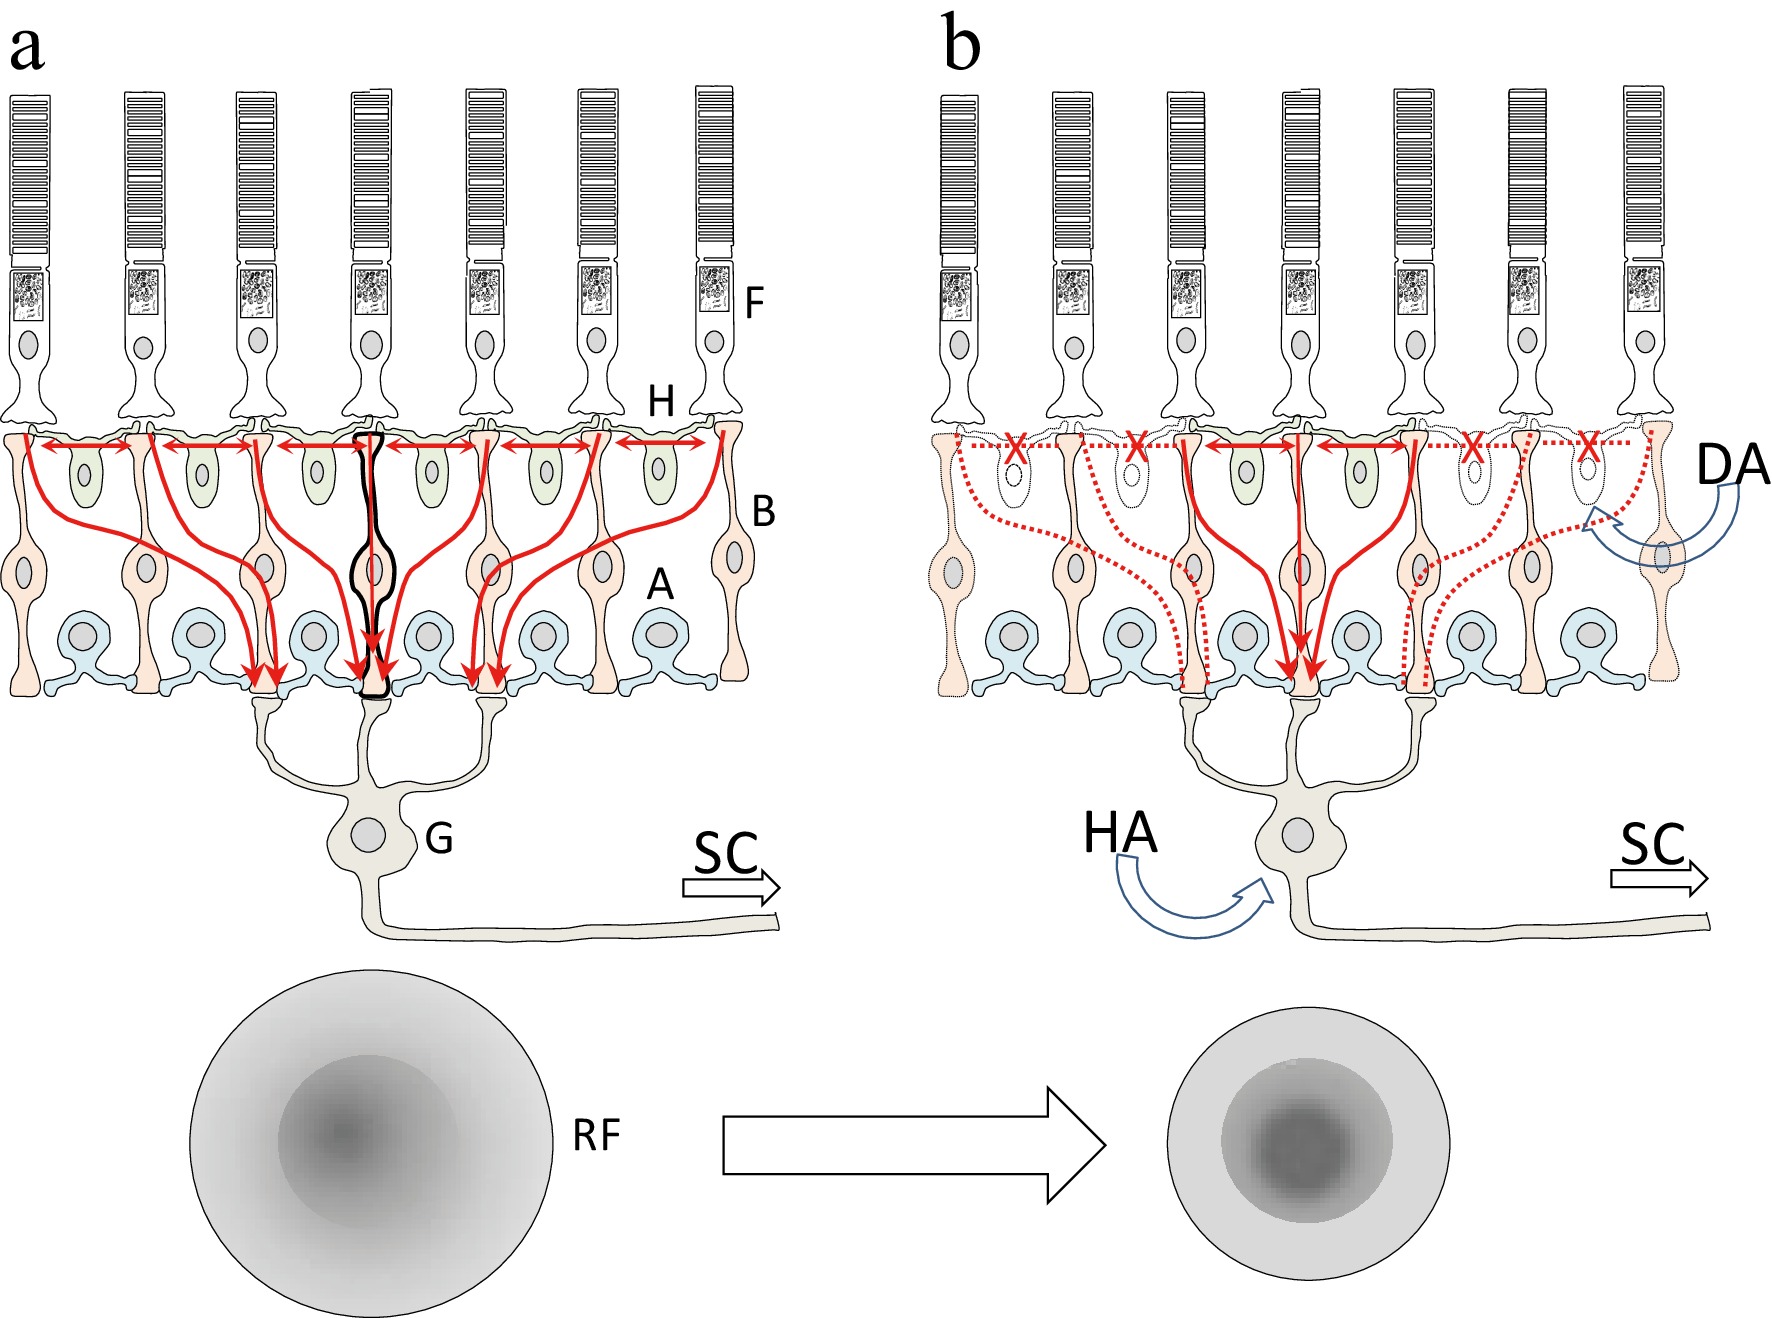
Figure 8.
Diagram illustrating the proposed mechanism of an intravitreal injection of DA. The receptive fields of the retinal ganglion cells (G) exhibit a center-surround organization with opposing effects, which is the basis of contrast sensitivity. Horizontal cells (H) play an important role in shaping these receptive fields by horizontally connecting photoreceptors (F) and bipolar cells (B). Dopamine may act on the DA receptors of the horizontal cells, thereby altering the center-surround structure of the ganglion cells' receptive fields and consequently modifying their contrast sensitivity. Haloperidol may also induce changes in the receptive fields' structure, acting primarily on the ganglion cells responsible for the off-response in the SC. Vertical red arrows indicate the vertical flow of signals from the photoreceptors to a ganglion cell, whereas horizontal red arrows indicate the horizontal flow of signals mediated by horizontal cells. (a) Under normal conditions, signals from several photoreceptors converge onto a single ganglion cell (red arrows). (b) After intravitreal injection of DA, horizontal cell connections are disrupted (crossed horizontal dotted red lines), leading to changes in the vertical flow of signals (vertical red dotted lines) and altering the center-surround structure of the ganglion cells' receptive fields. RF: schematic representation of the receptive field of a ganglion cell with a centre-surround organization. A, amacrine cells; DA, dopamine; HA, haloperidol; SC, superior colliculus.
Figures
(8)
Tables
(0)