-
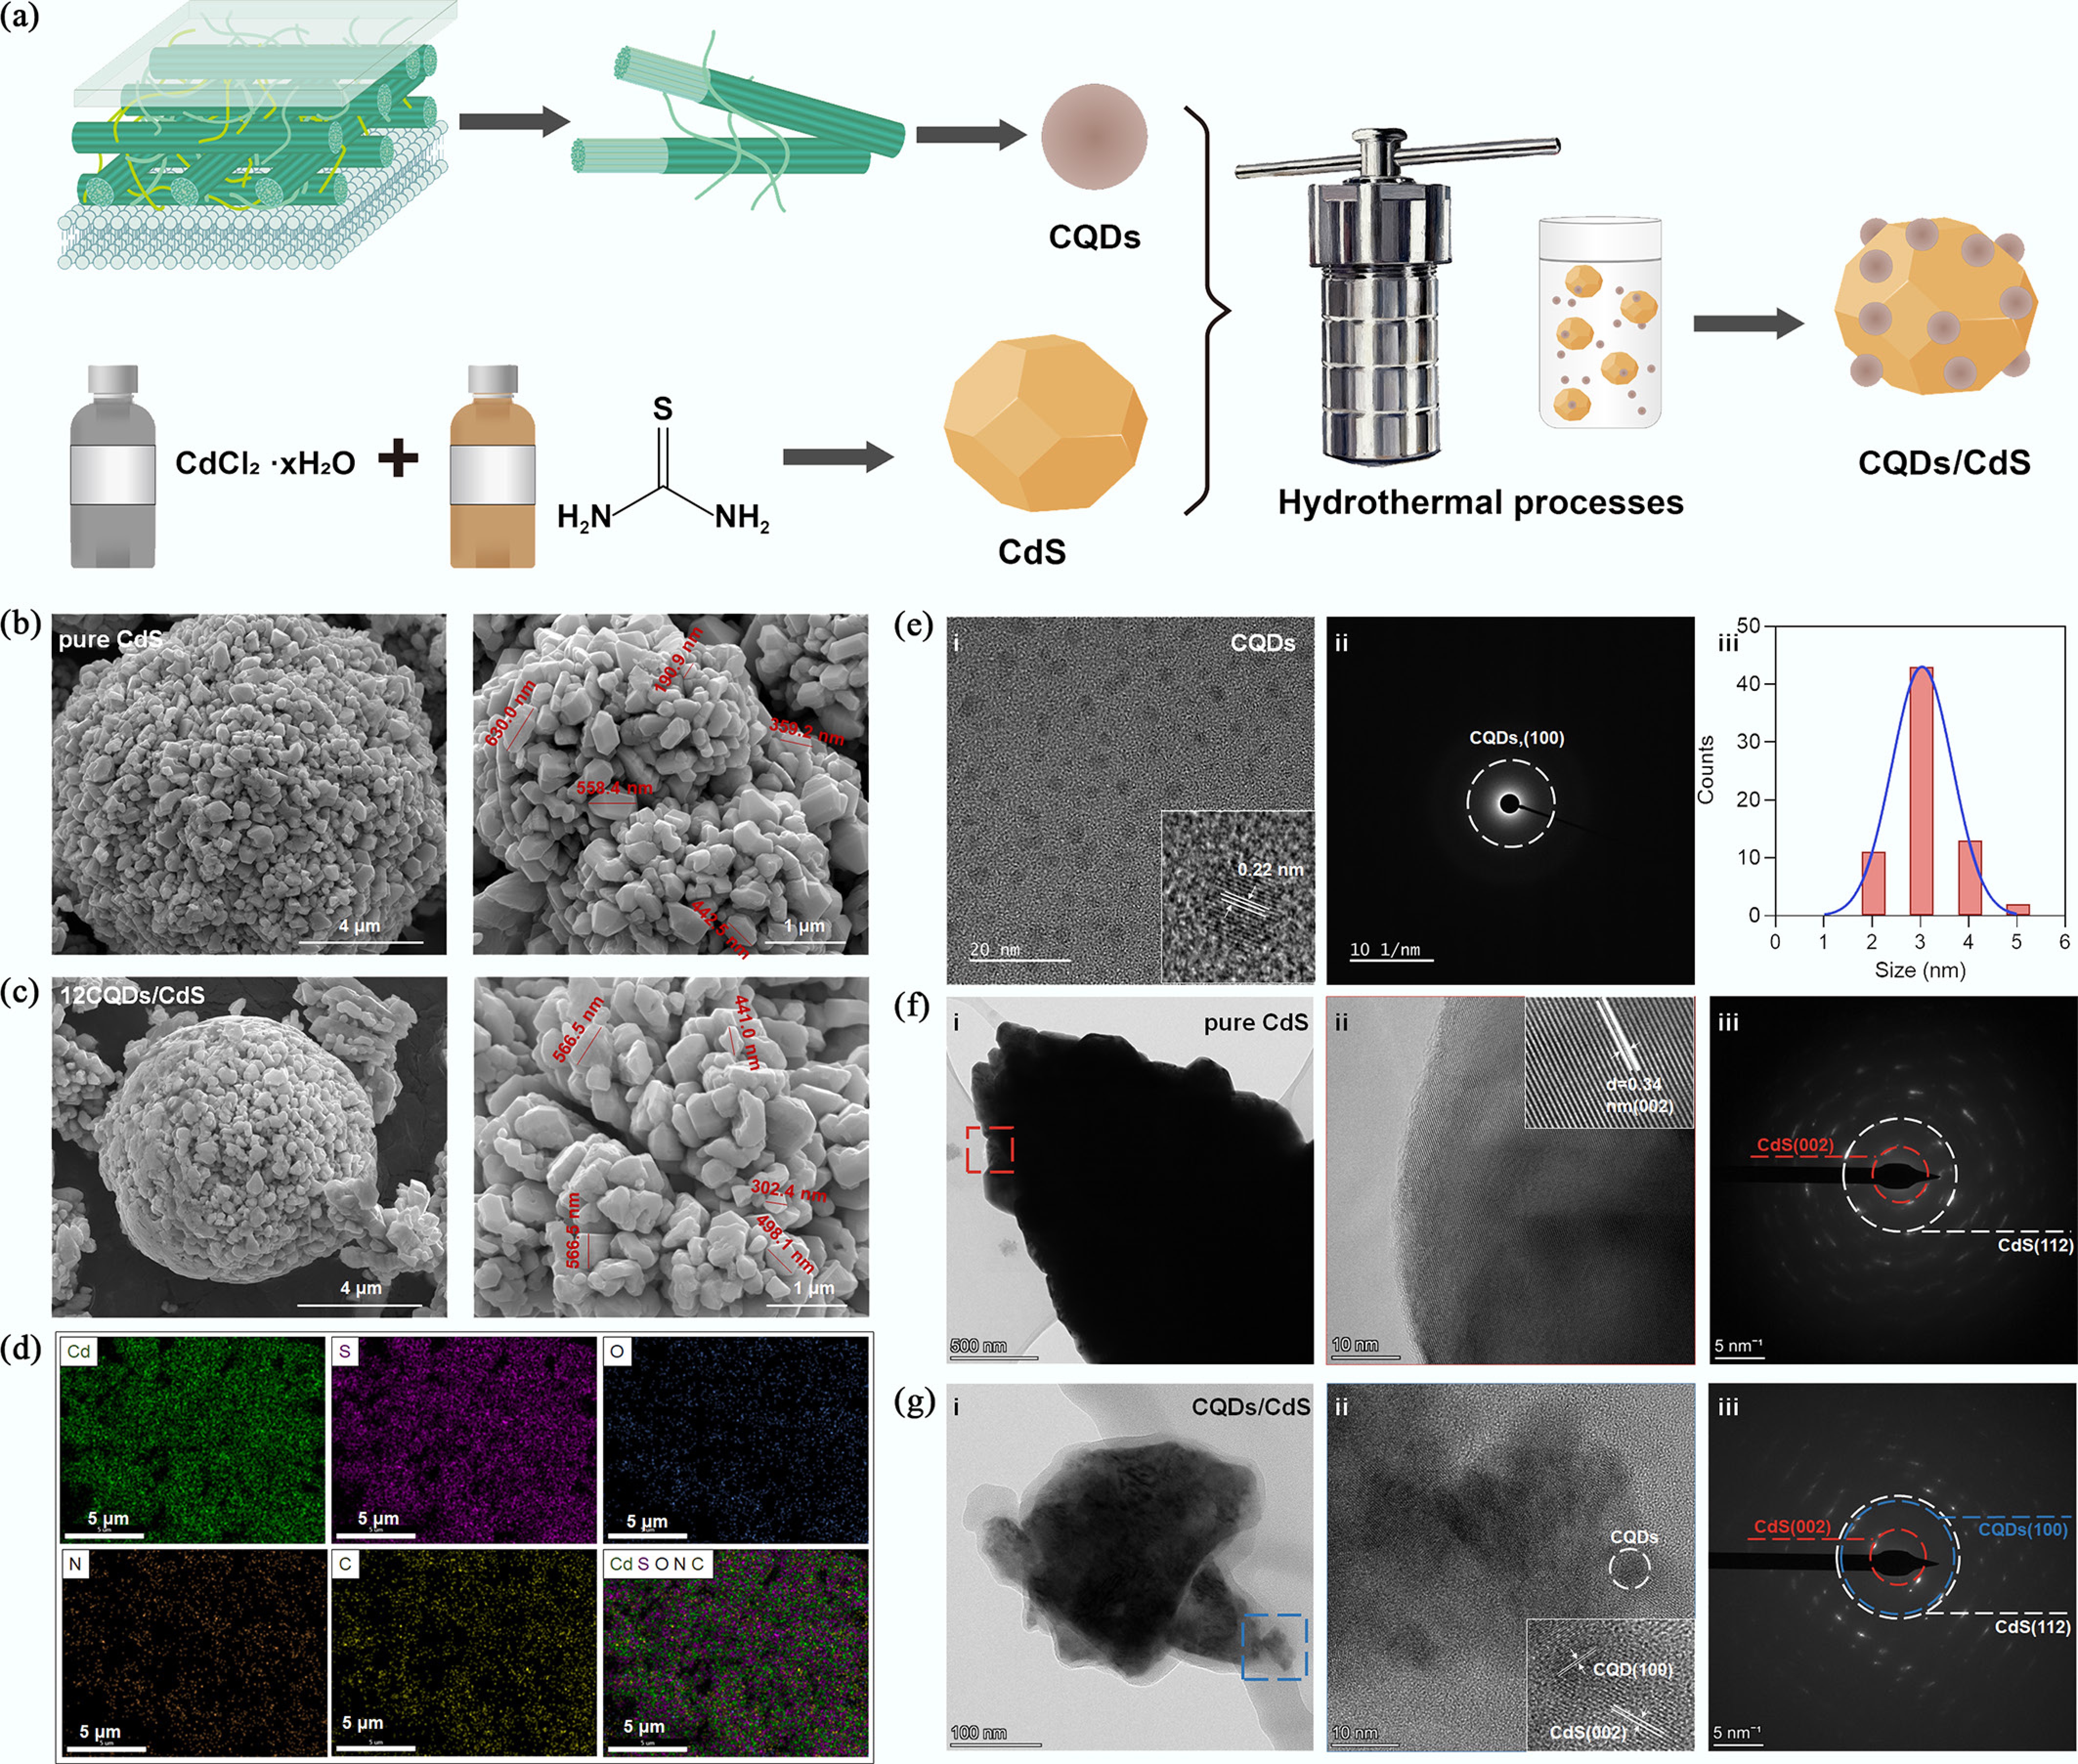
Figure 1.
(a) The schematic illustration of fabrication process of CQDs/CdS; SEM images of (b) pure CdS, and (c) 12CQDs/CdS; (d) EDX mapping of 12CQDs/CdS; (e) i. HRTEM, ii. SAED pattern, and iii. particle size distribution of CQDs; (f) i & ii. HRTEM, and iii. SAED pattern of pure CdS; (g) i & ii. HRTEM, and iii. SAED pattern of CQDs/CdS.
-
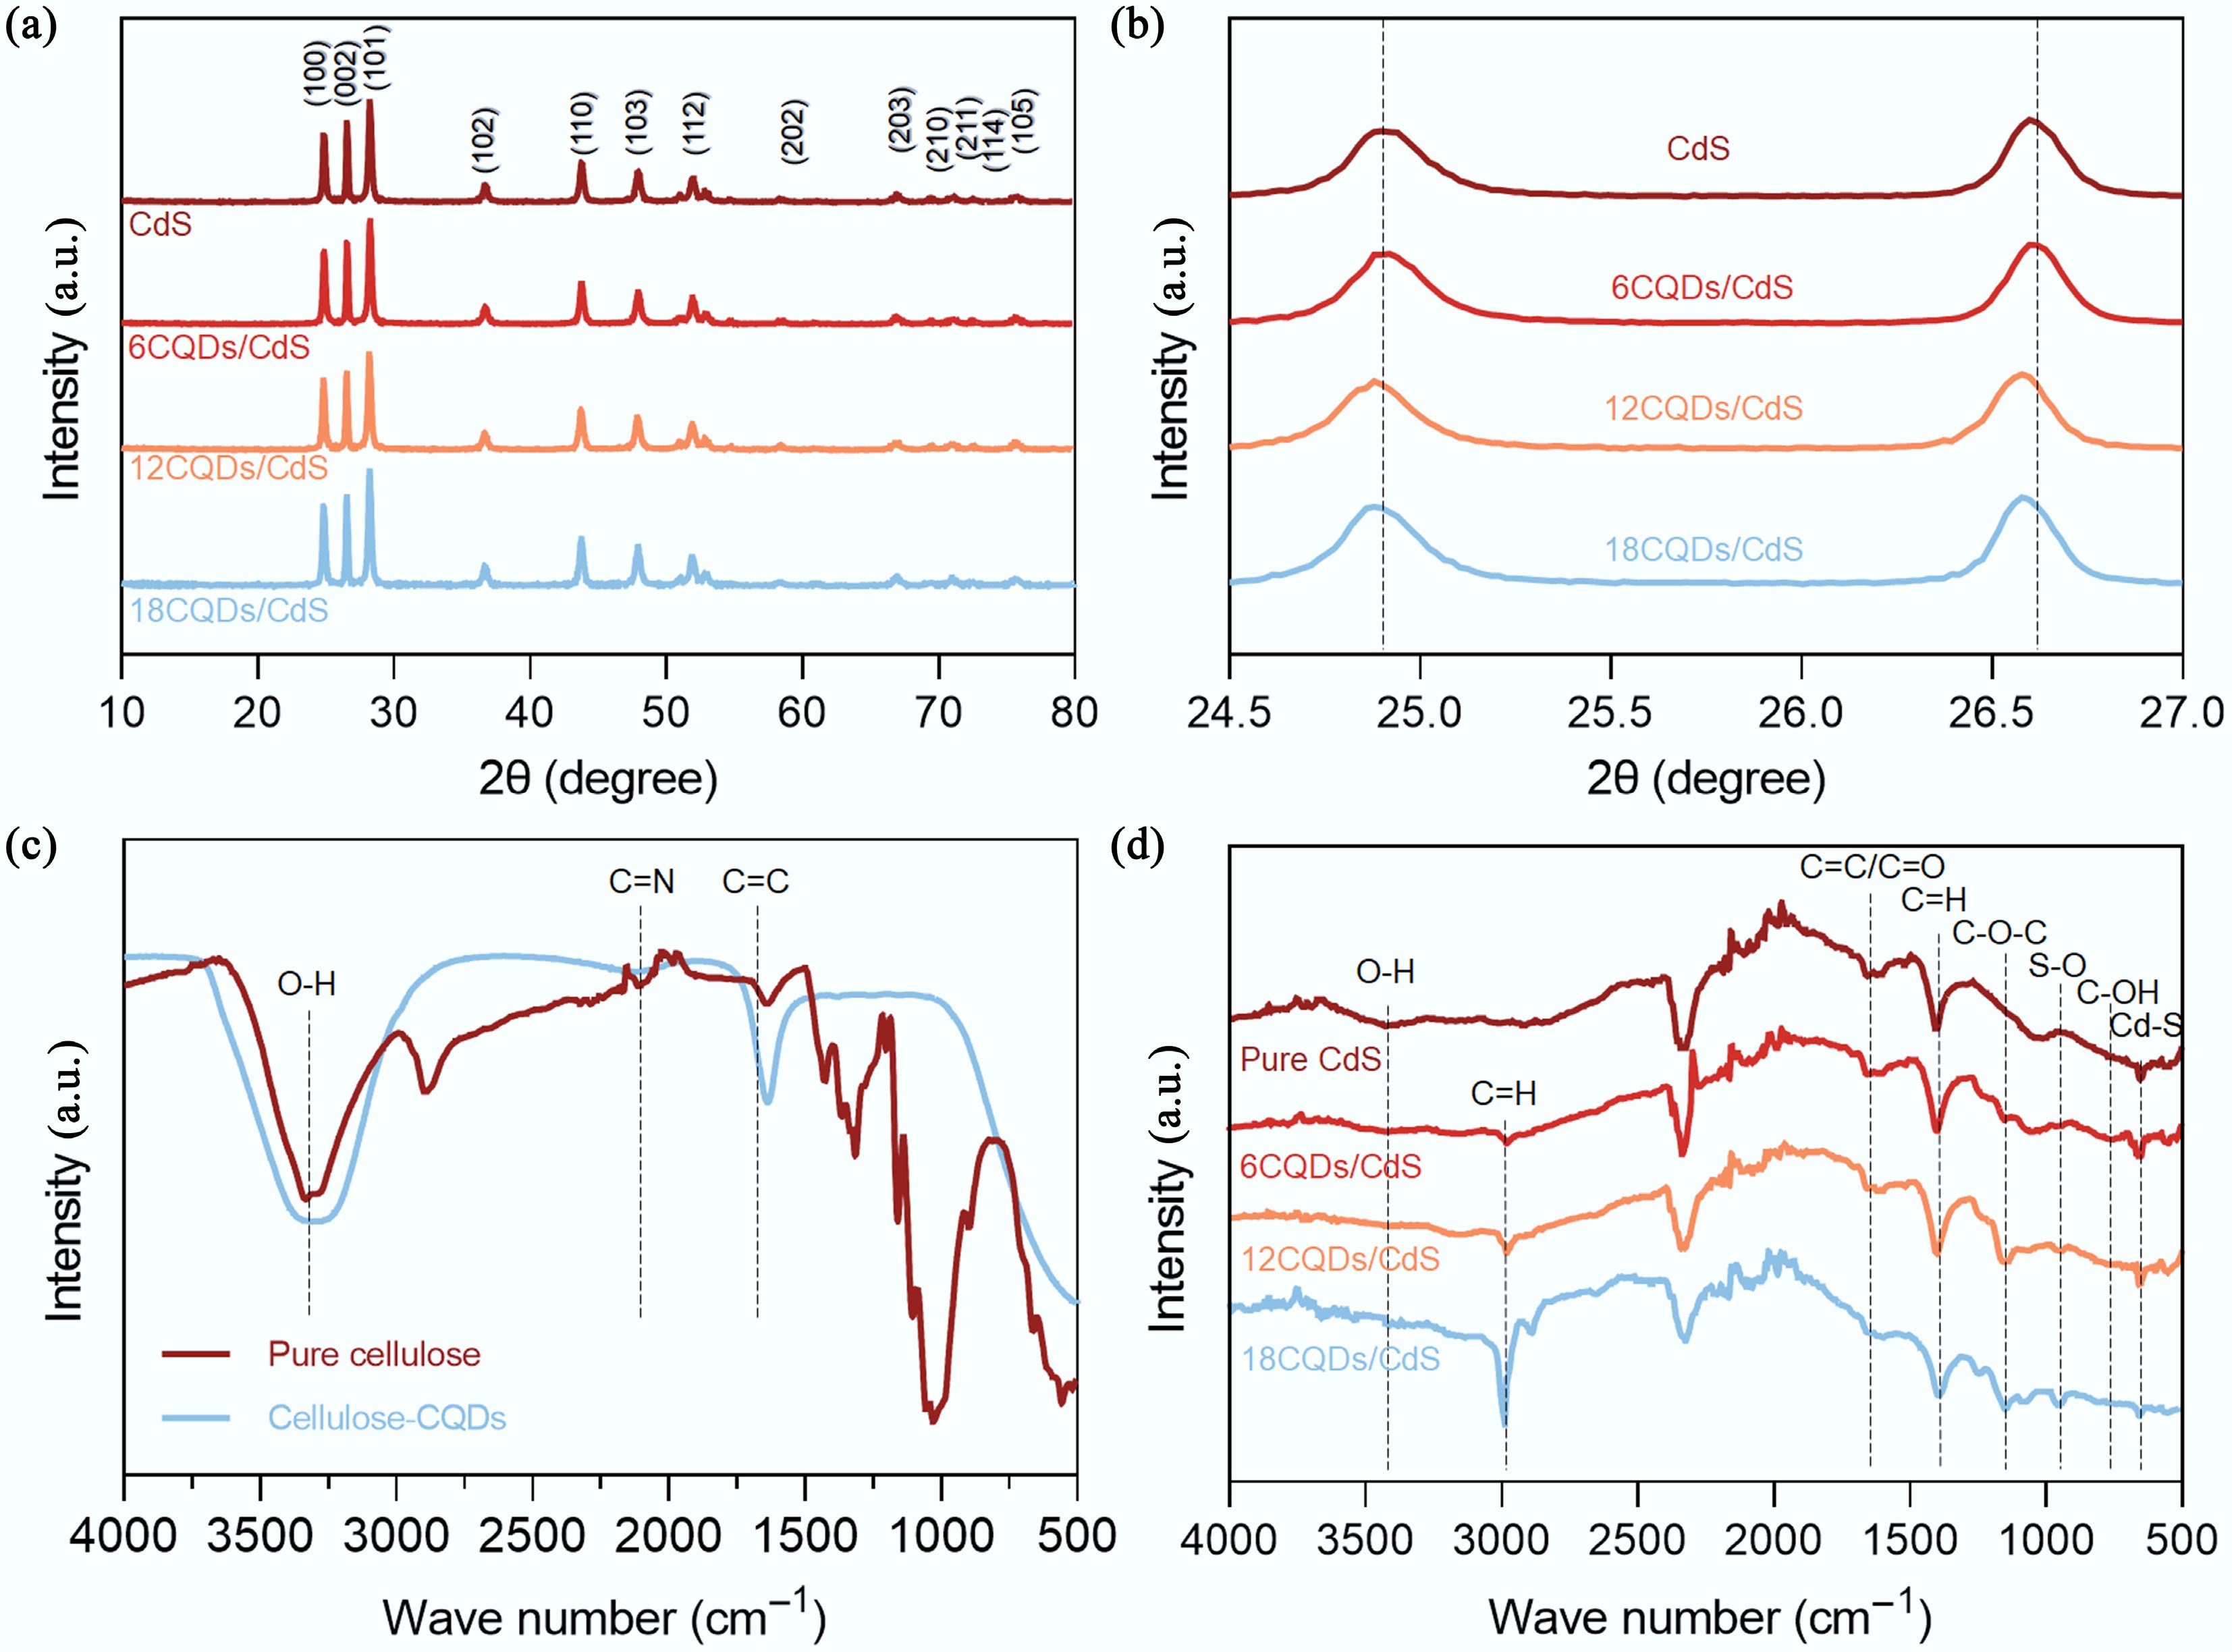
Figure 2.
(a) Full range XRD pattern, and (b) high-resolution XRD pattern of CQDs/CdS composites; (c) FTIR spectrum of pure cellulose and cellulose-derived CQDs, and (d) of pure CdS, and CQDs/CdS.
-
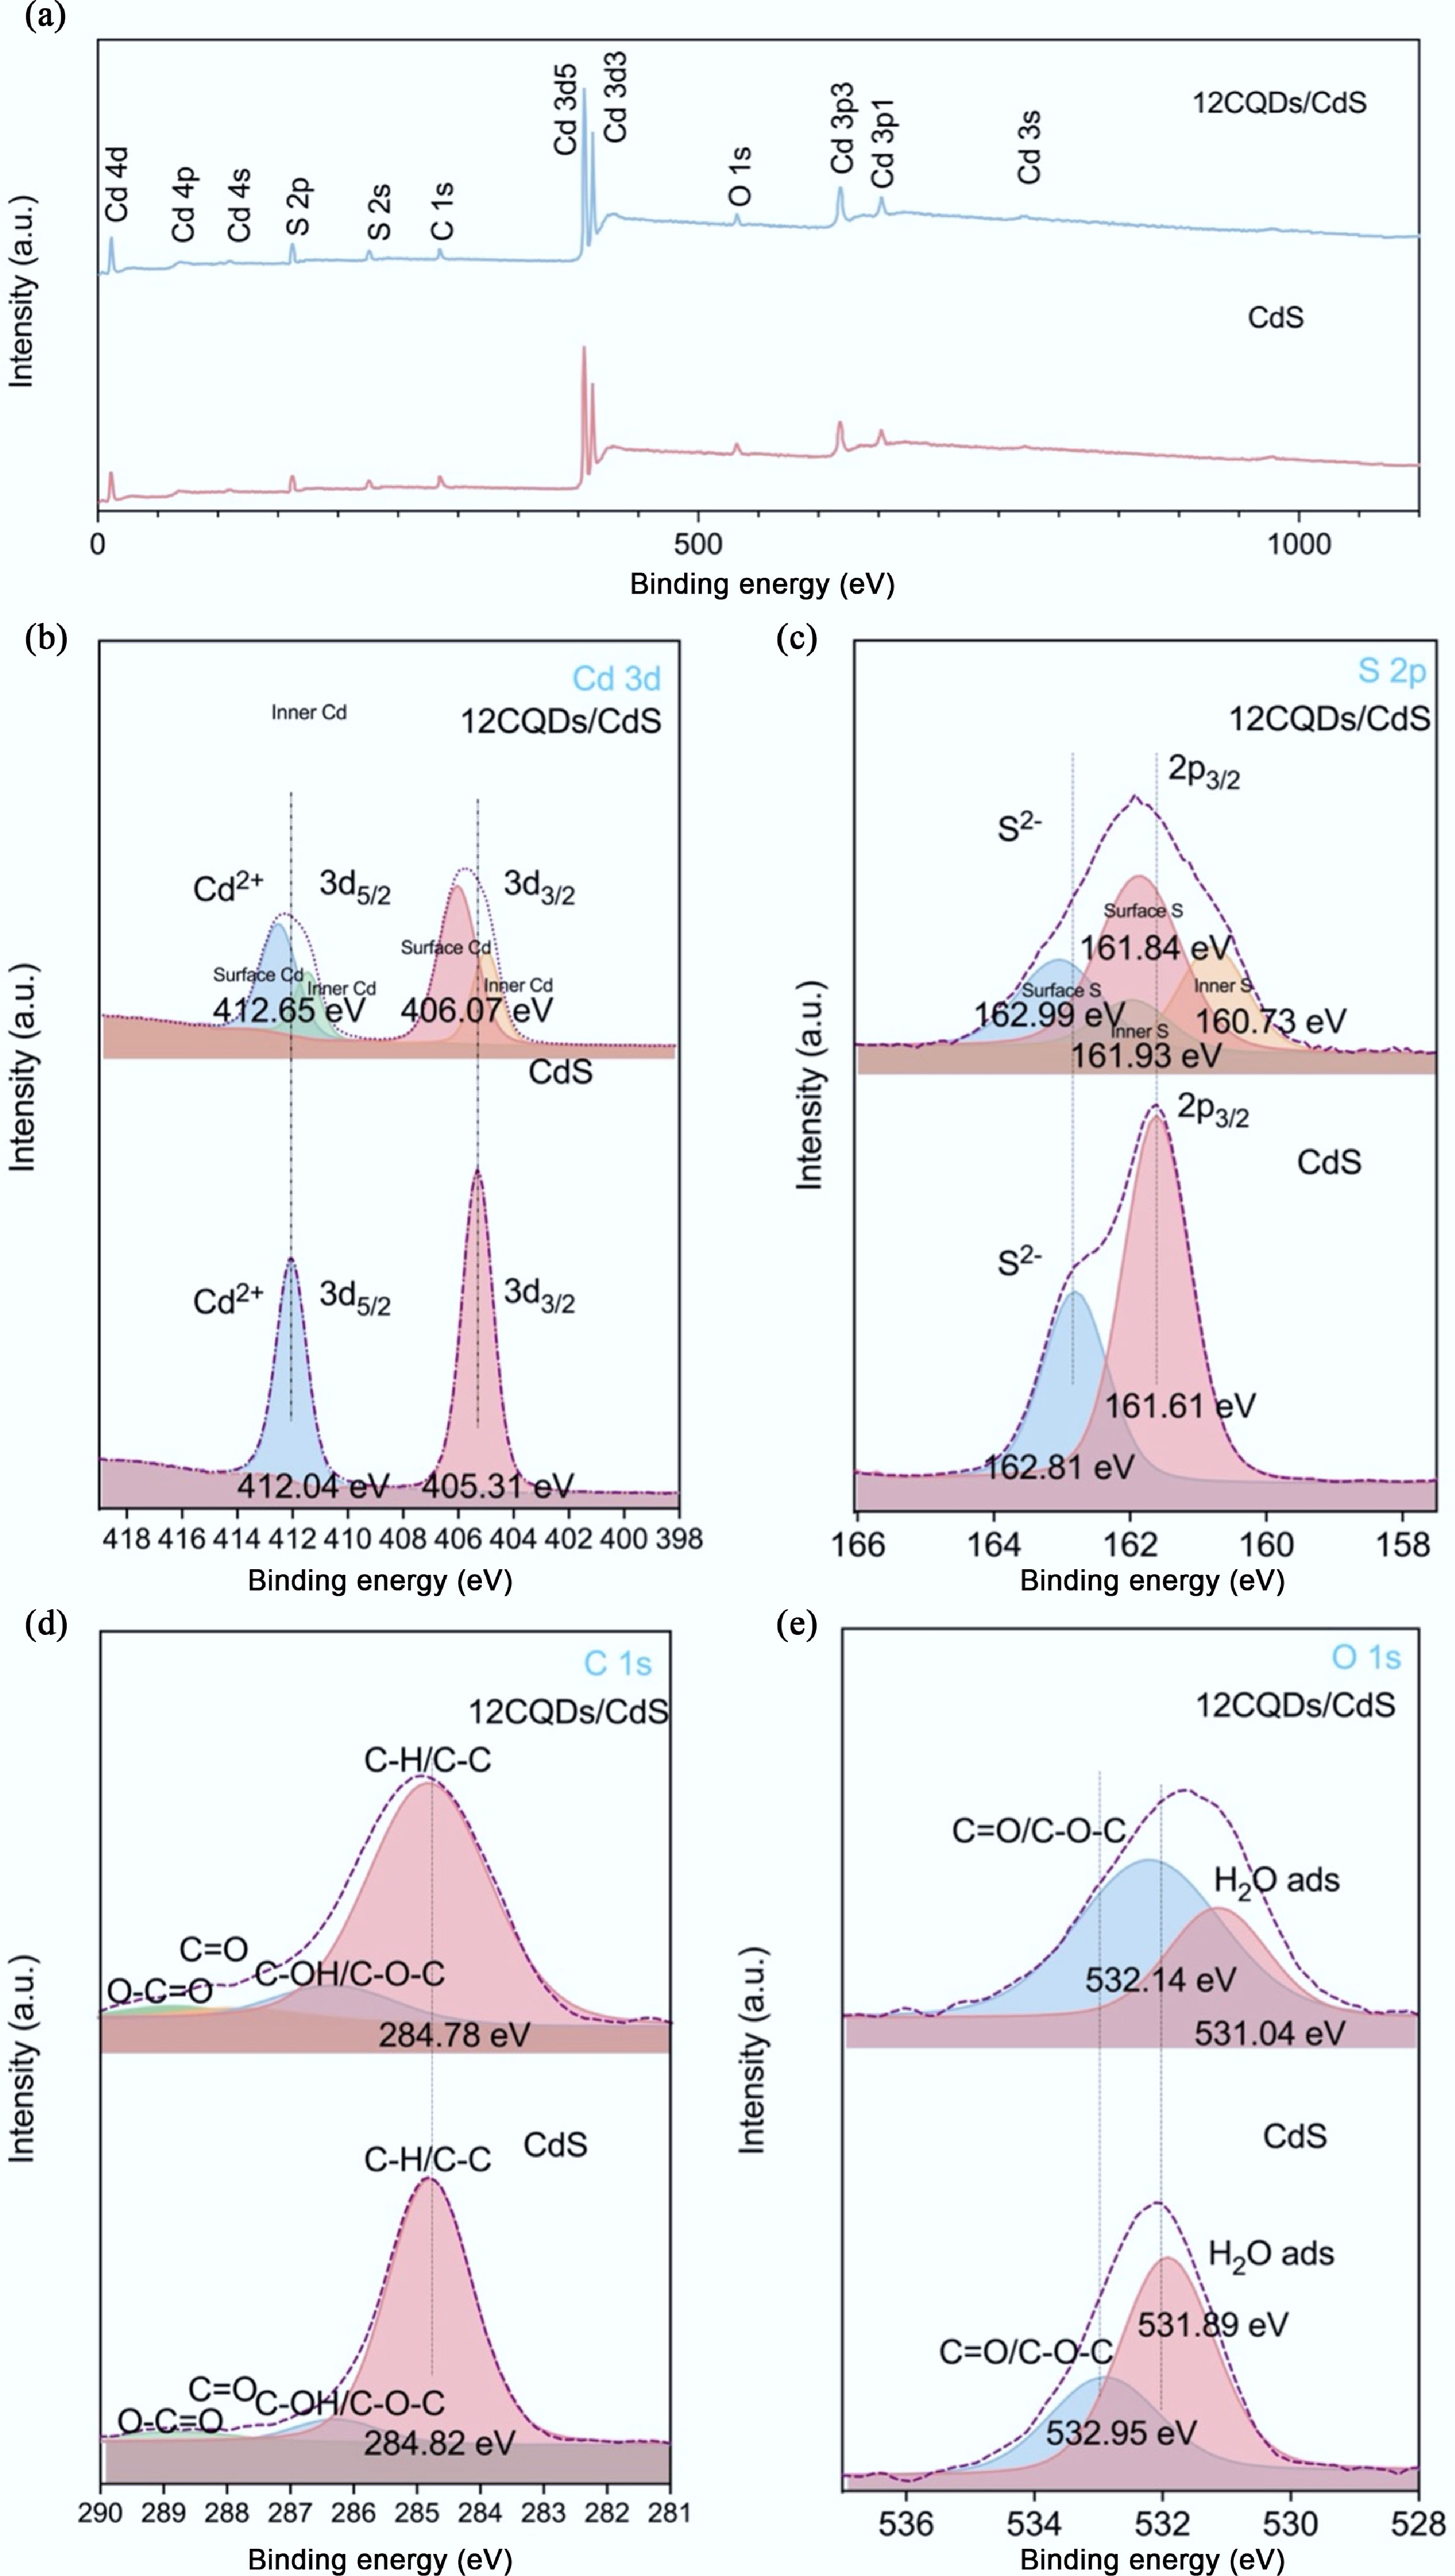
Figure 3.
(a) XPS survey spectrum of pure CdS, and 12CQDs/CdS. High-resolution XPS spectrum of (b) Cd 3d, (c) S 2p, (d) C 1s, and (e) O 1s.
-
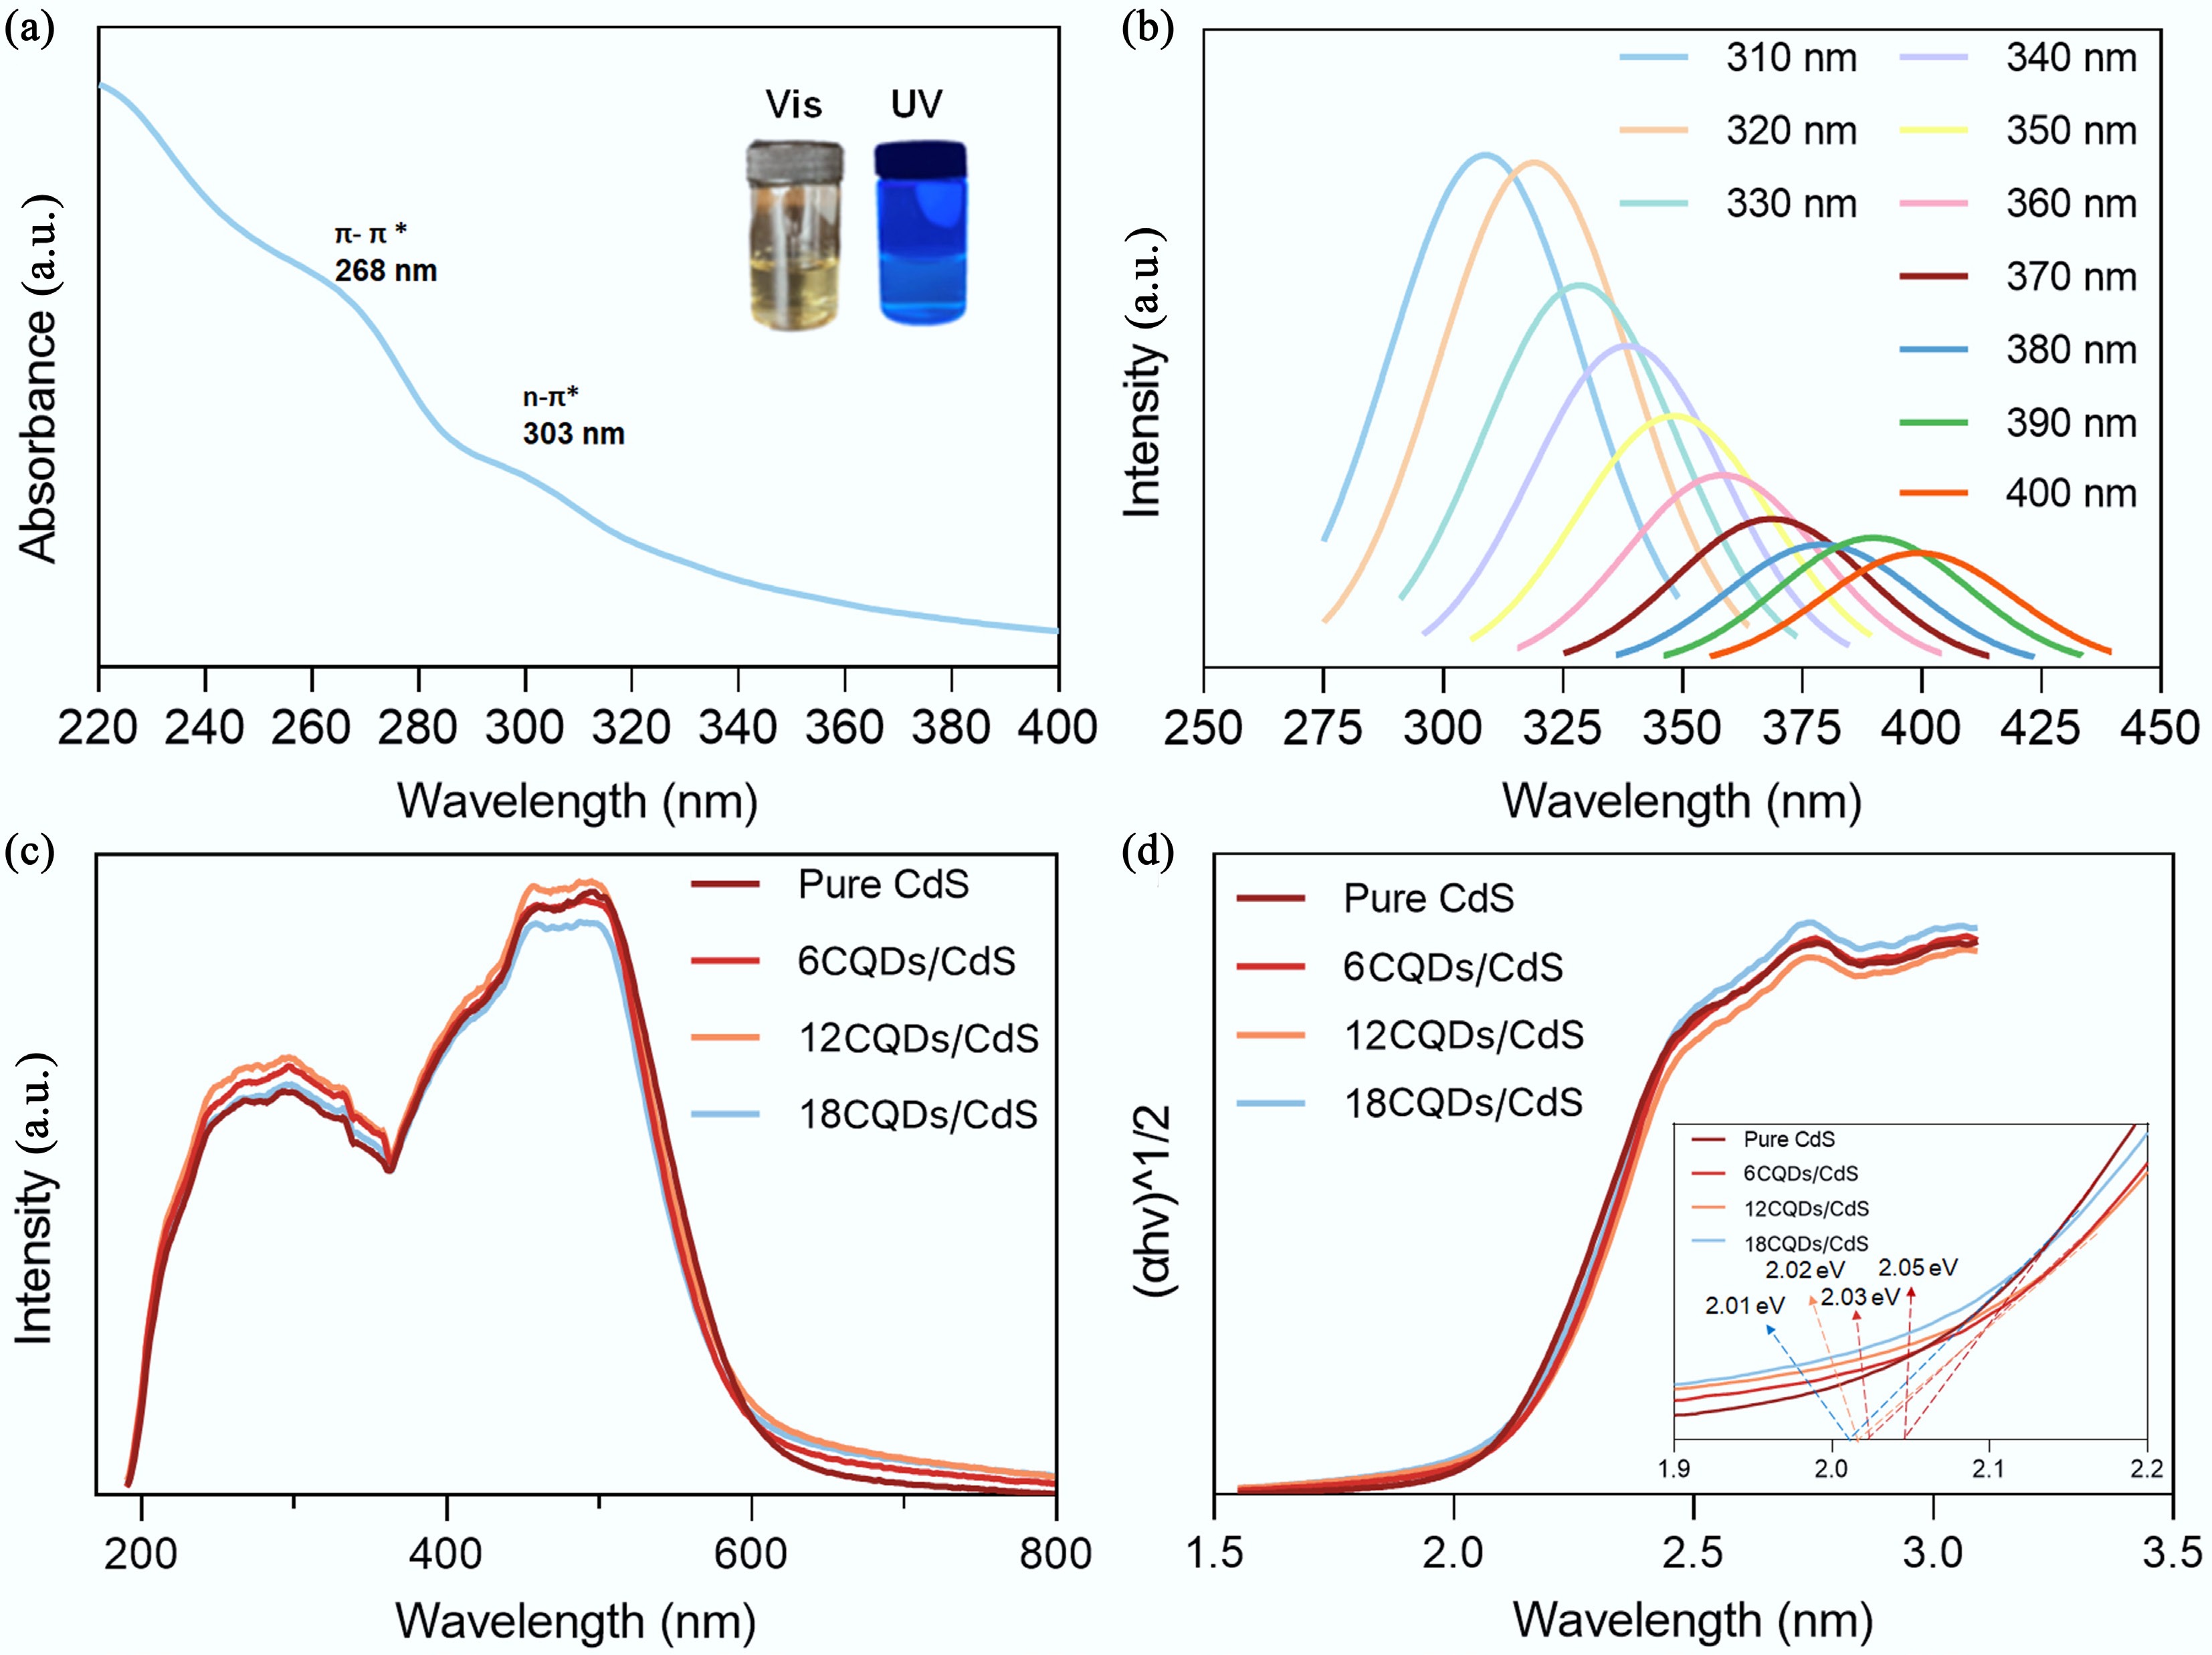
Figure 4.
(a) UV-vis spectrum; (b) PL spectrum of CQDs at excitation wavelength from 310 to 400 nm; (c) UV-vis DRS spectrum, and (d) Tauc plot of pure CdS, 6CQDs/CdS, 12CQDs/CdS, and 18CQDs/CdS.
-
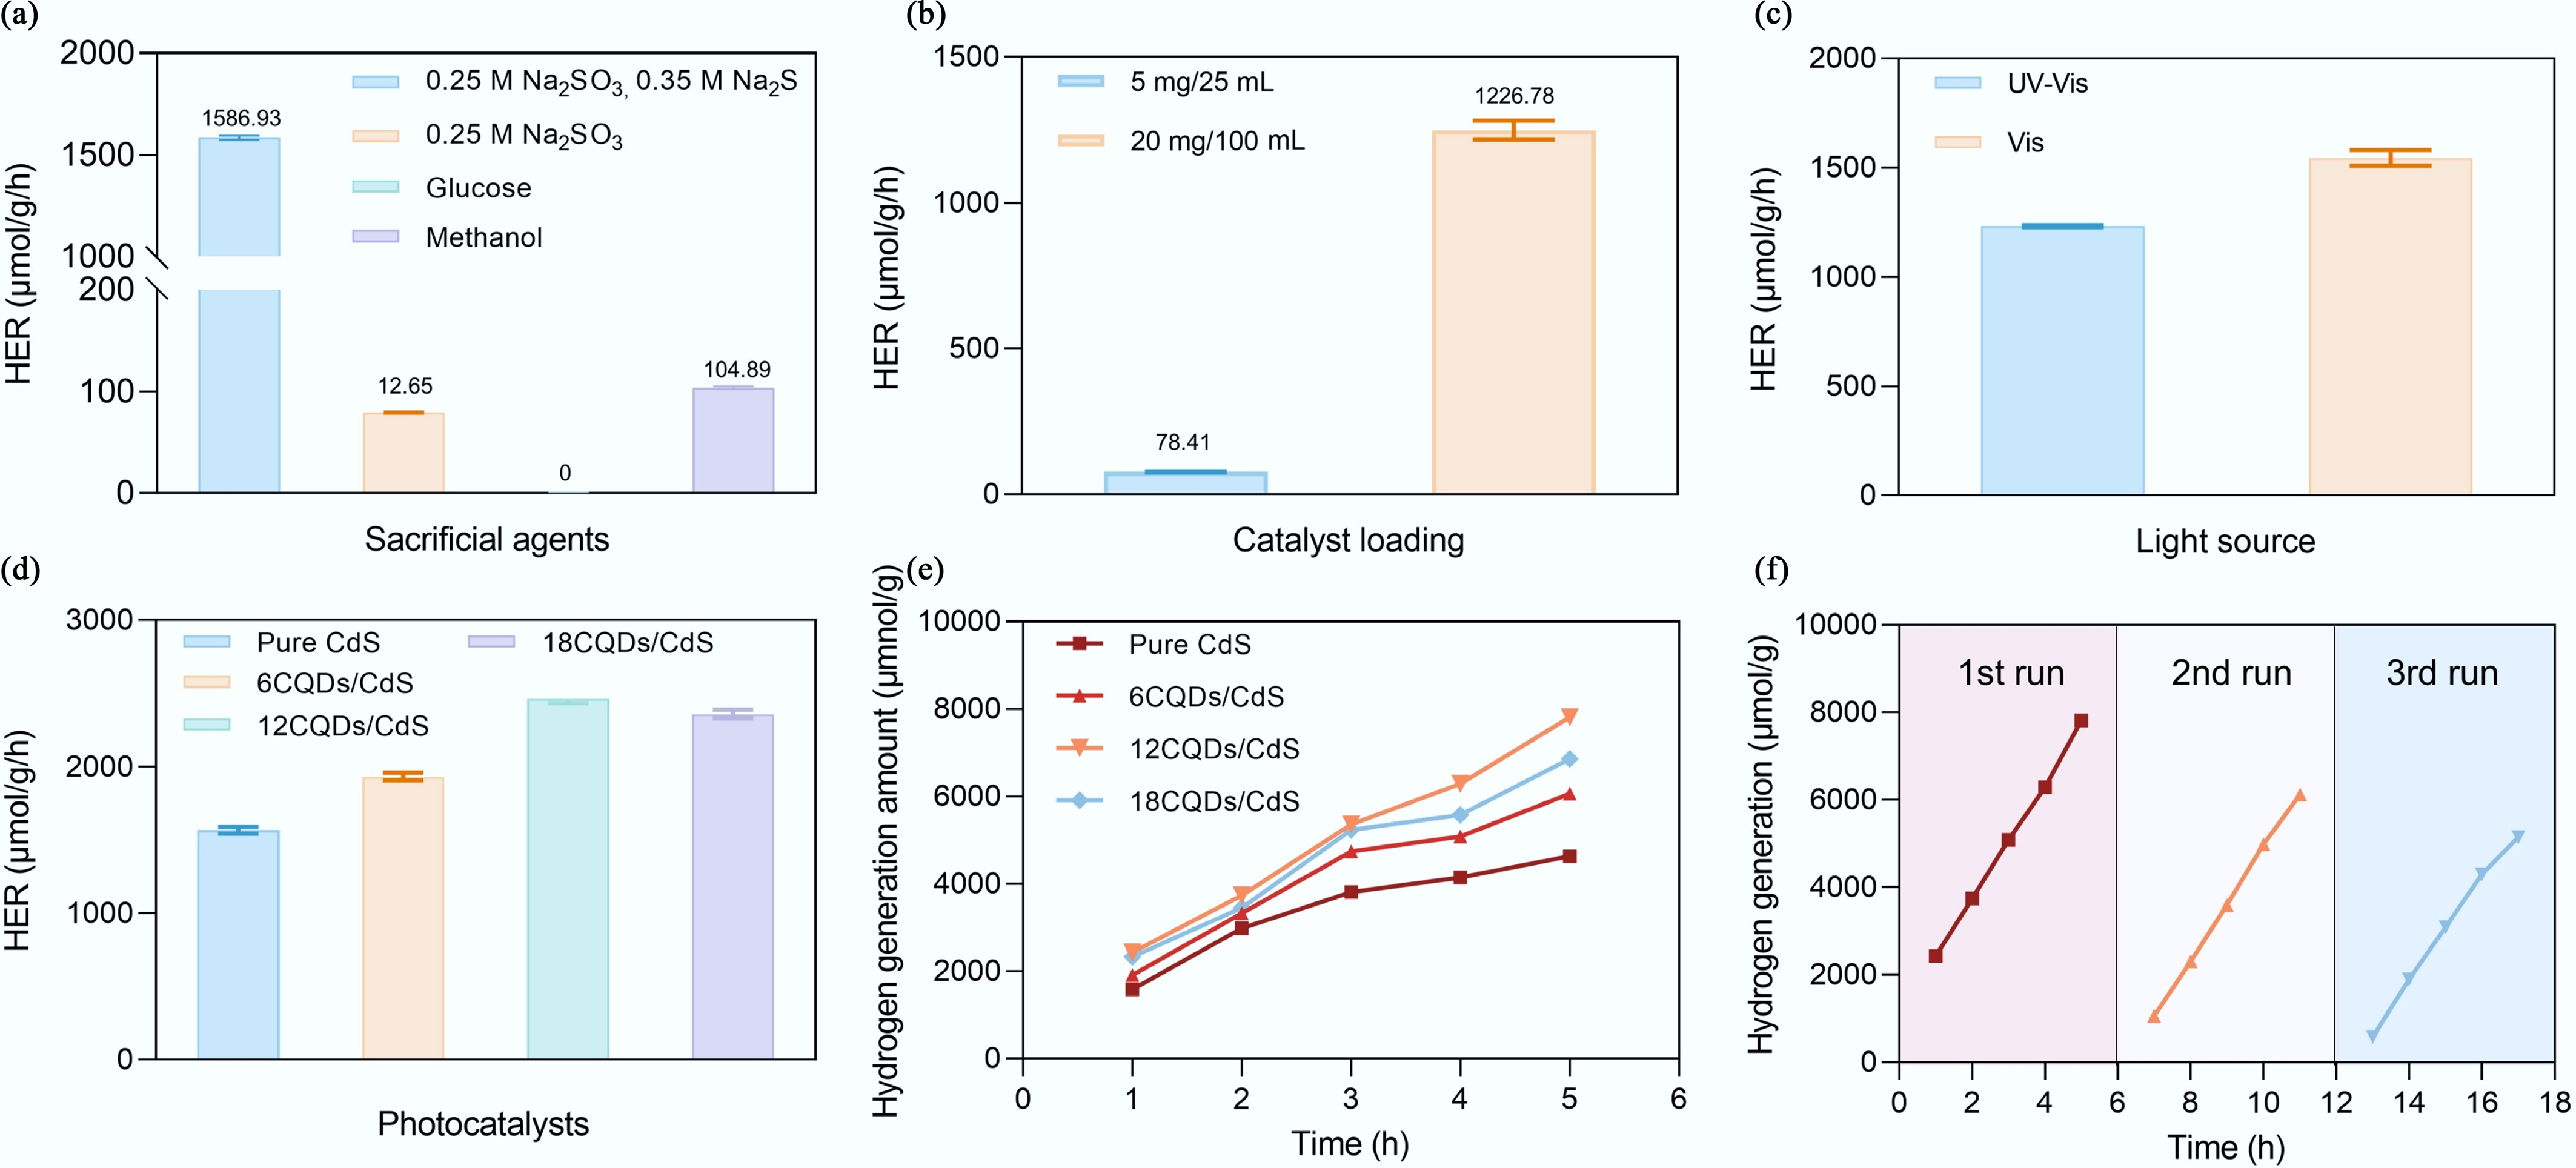
Figure 5.
(a) Photocatalytic H2 evolution rate of CdS with different sacrificing agents; (b) HER of CdS loading at 5 mg/25 mL, and 20 mg/100 mL (UV-vis light irradiation); (c) HER of CdS under UV-vis and vis light irradiation (20 mg/100 mL); (d) HER of different CdS based catalyst; (e) time-dependent photocatalytic H2 evolution profiles over 1–5 h; (f) photostability and reusability performance of the 12CQDs/CdS composite.
-
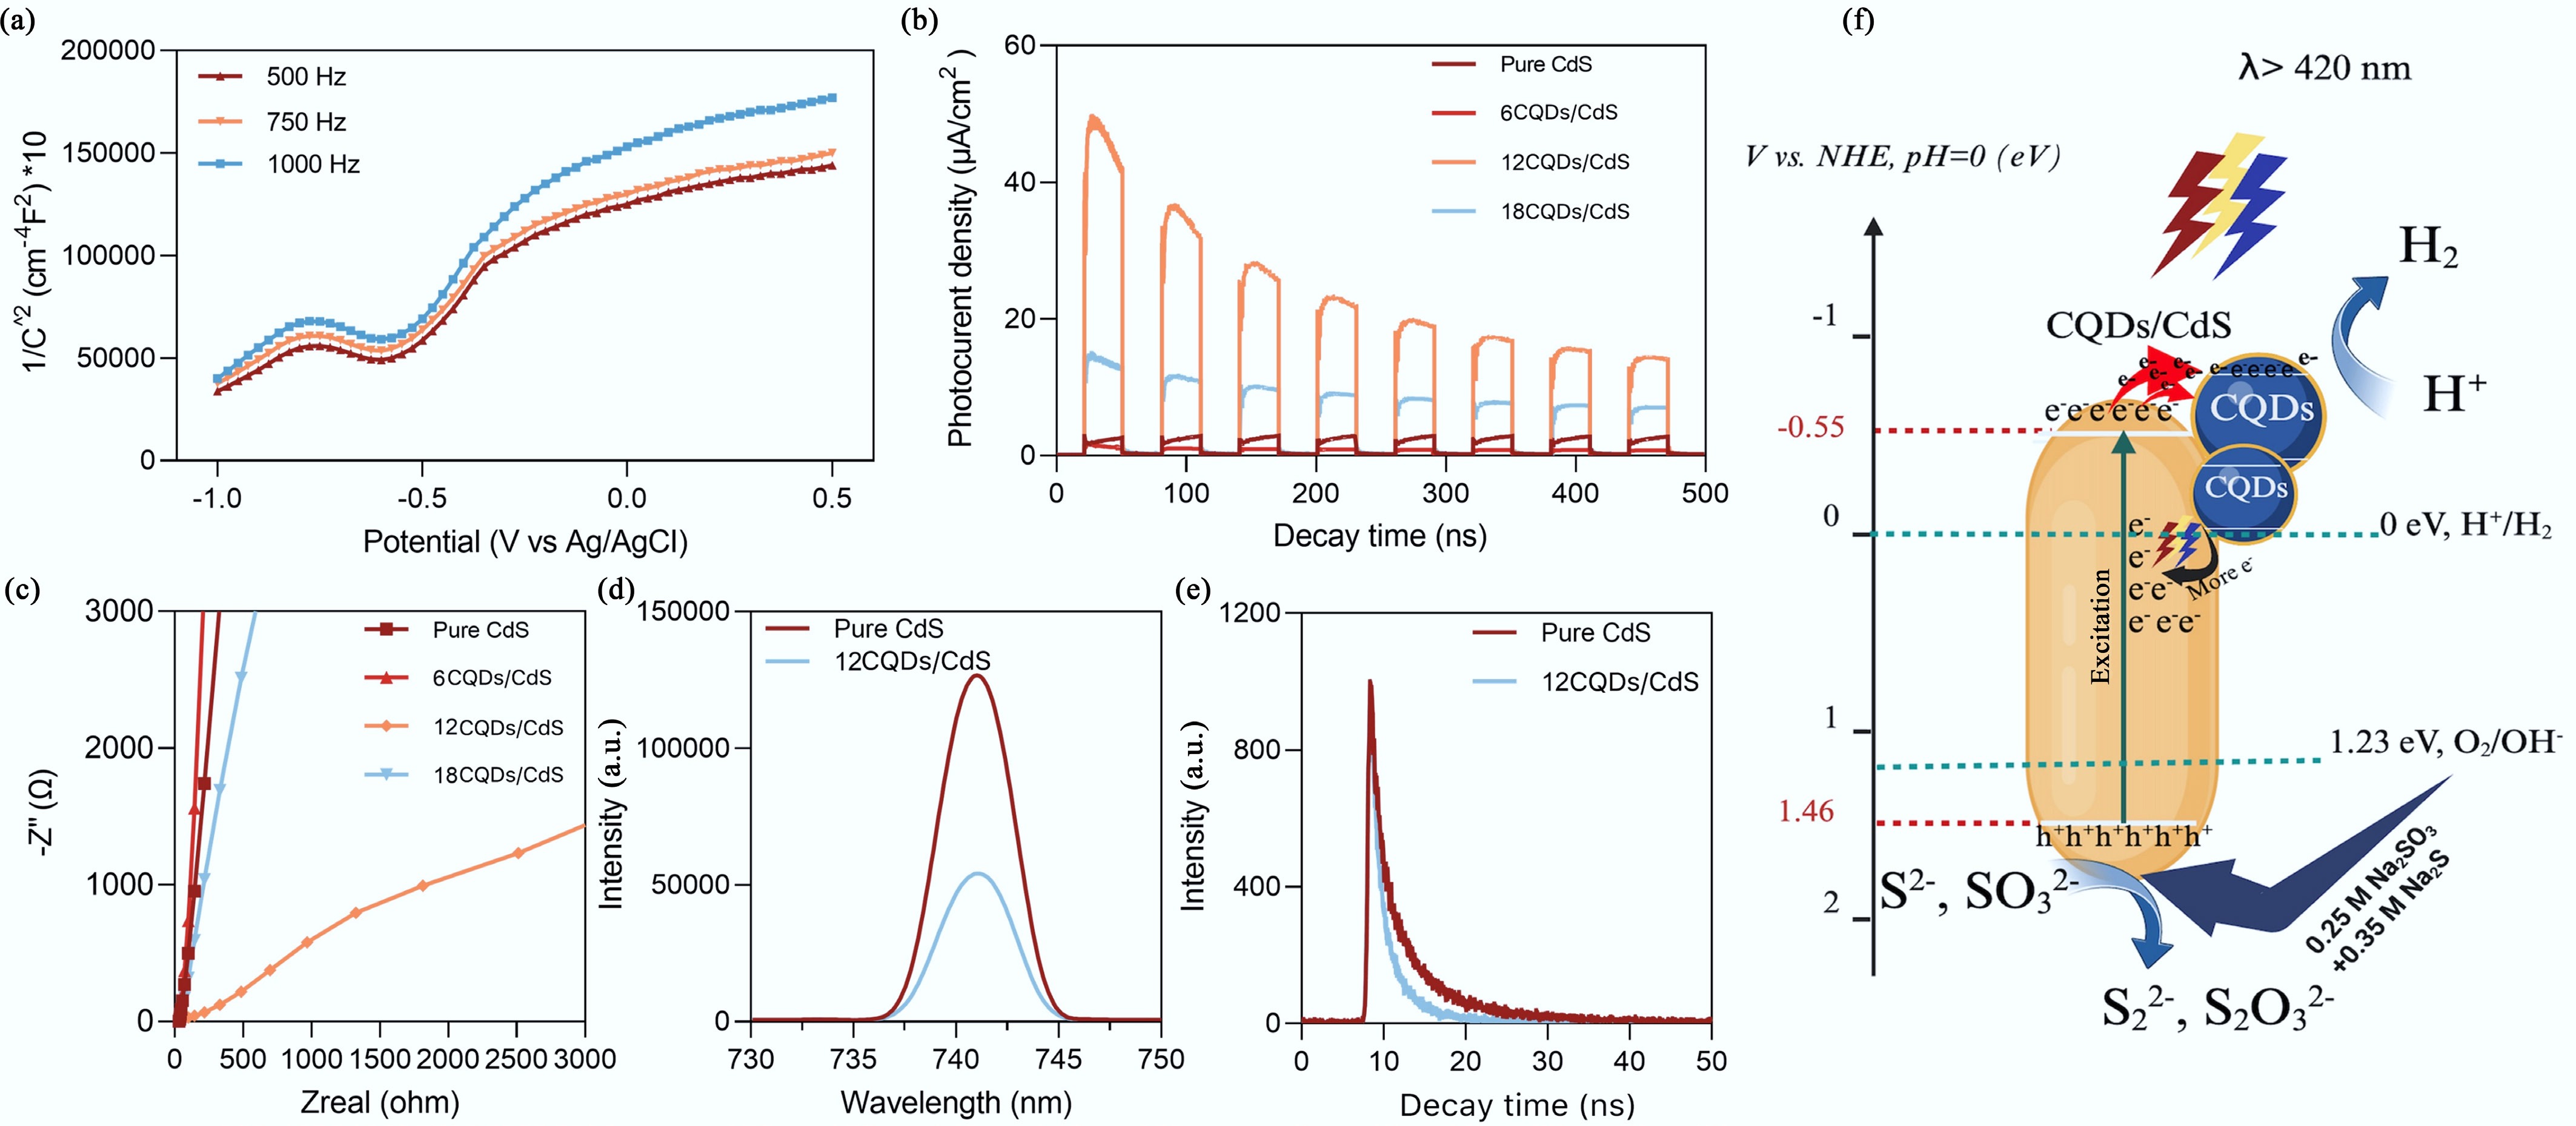
Figure 6.
(a) Mott-Schottky of pure CdS; (b) transient photocurrent response; (c) Nyquist plot; (d) steady-state photoluminescence (PL); (e) time-resolved photoluminescence (TRPL) spectra; (f) schematic representation of the photocatalytic H2 evolution mechanism of CQDs/CdS composite.
Figures
(6)
Tables
(0)