-
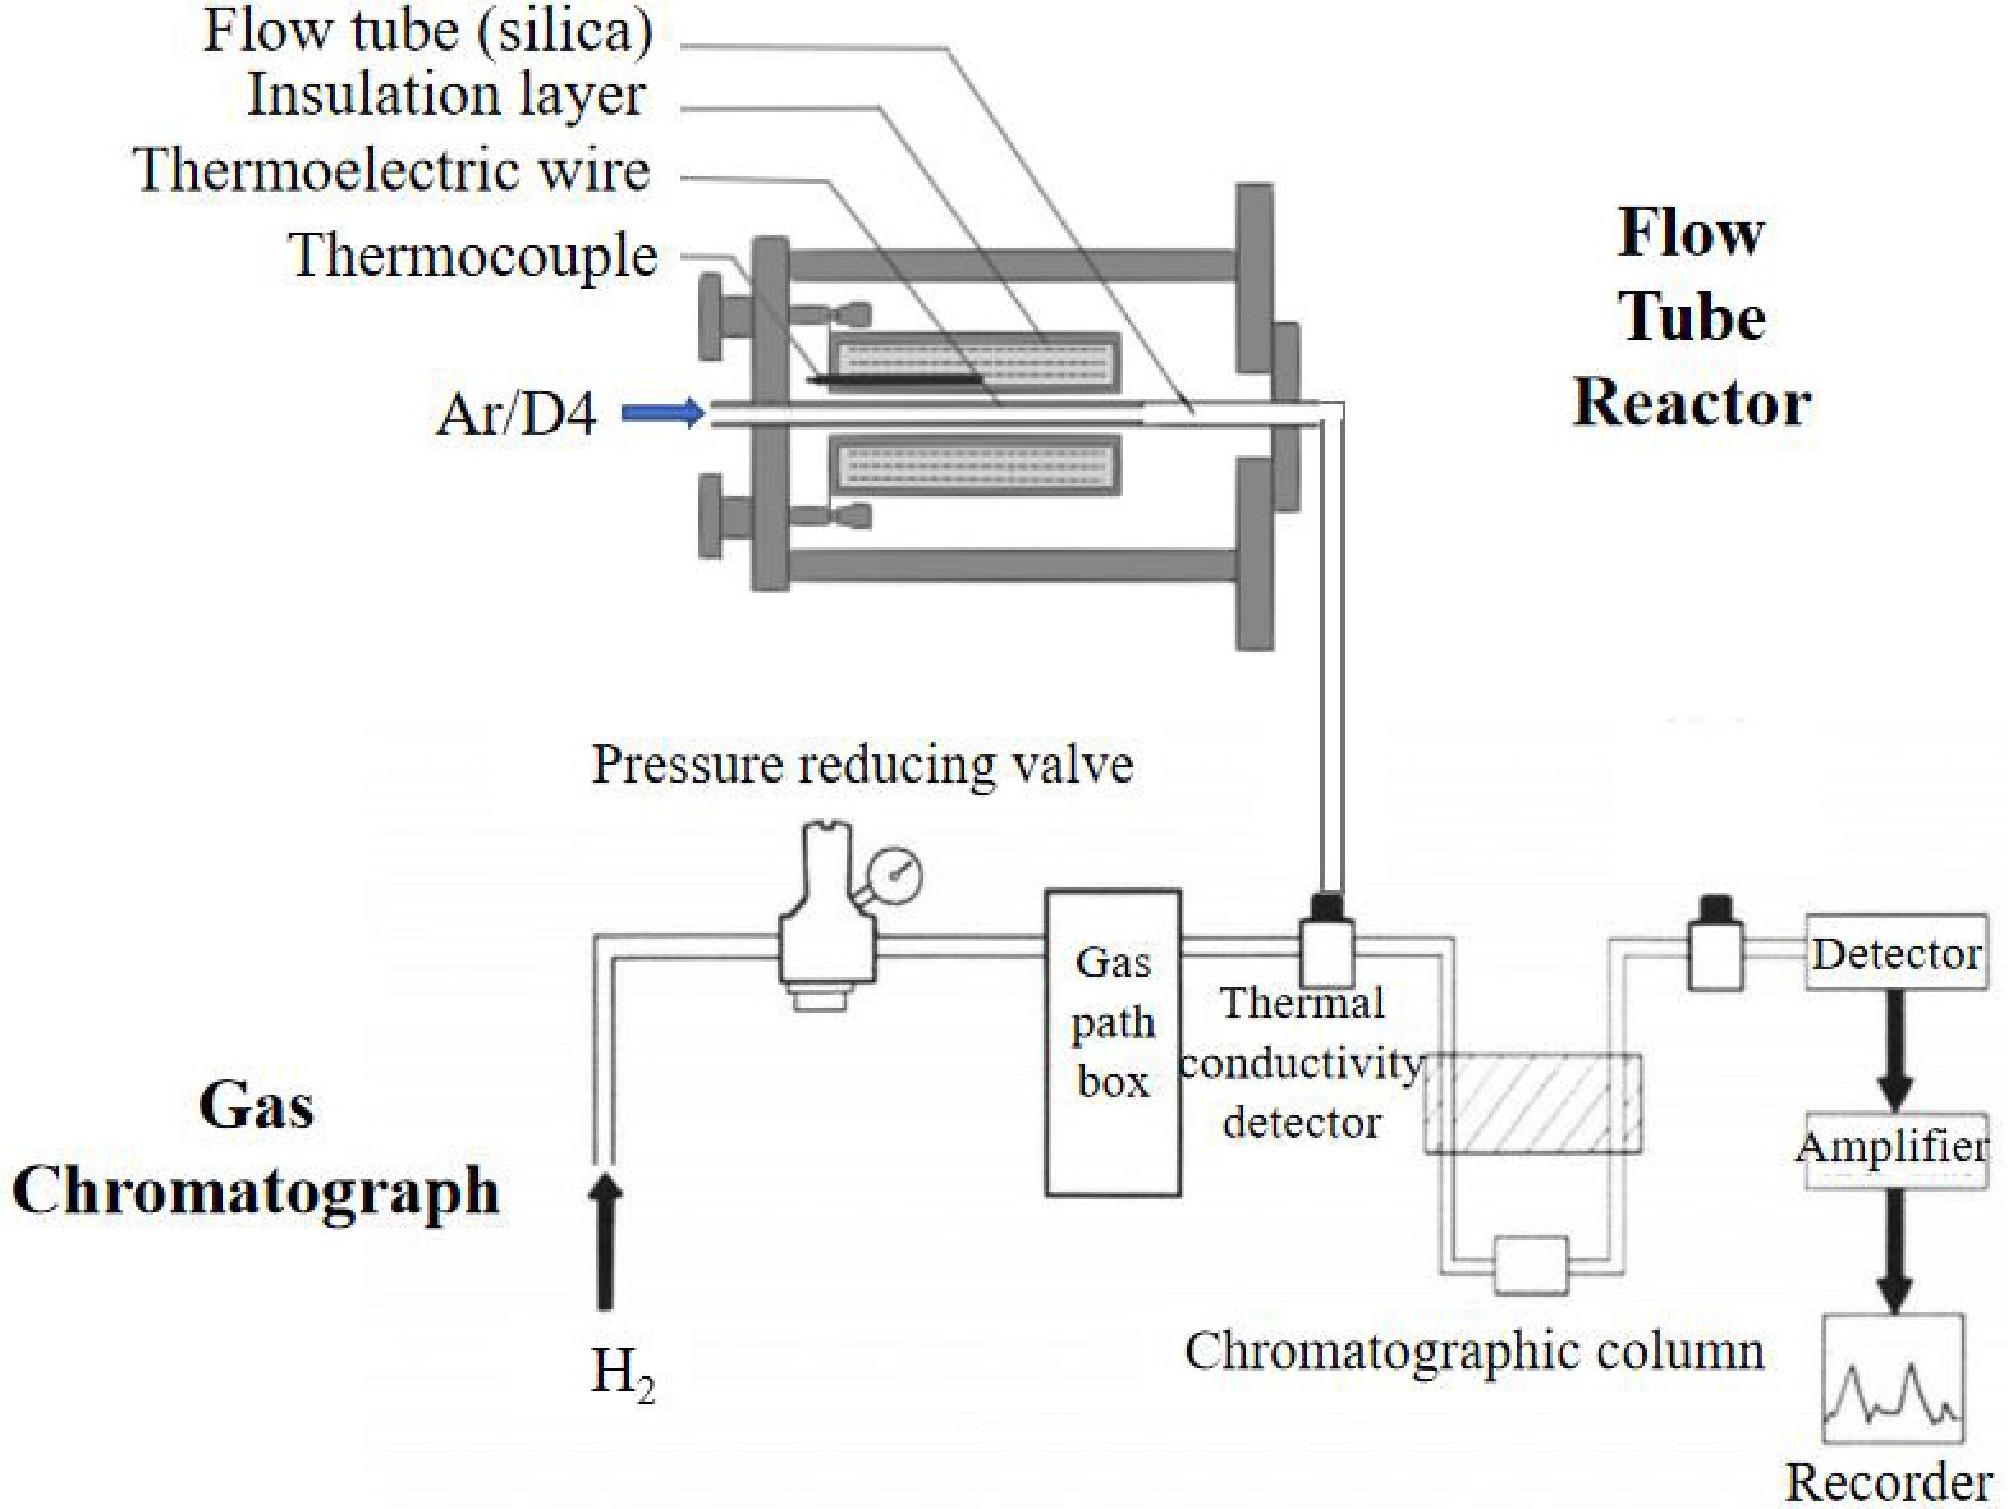
Figure 1.
Experimental setup and product detection of D4 pyrolysis.
-
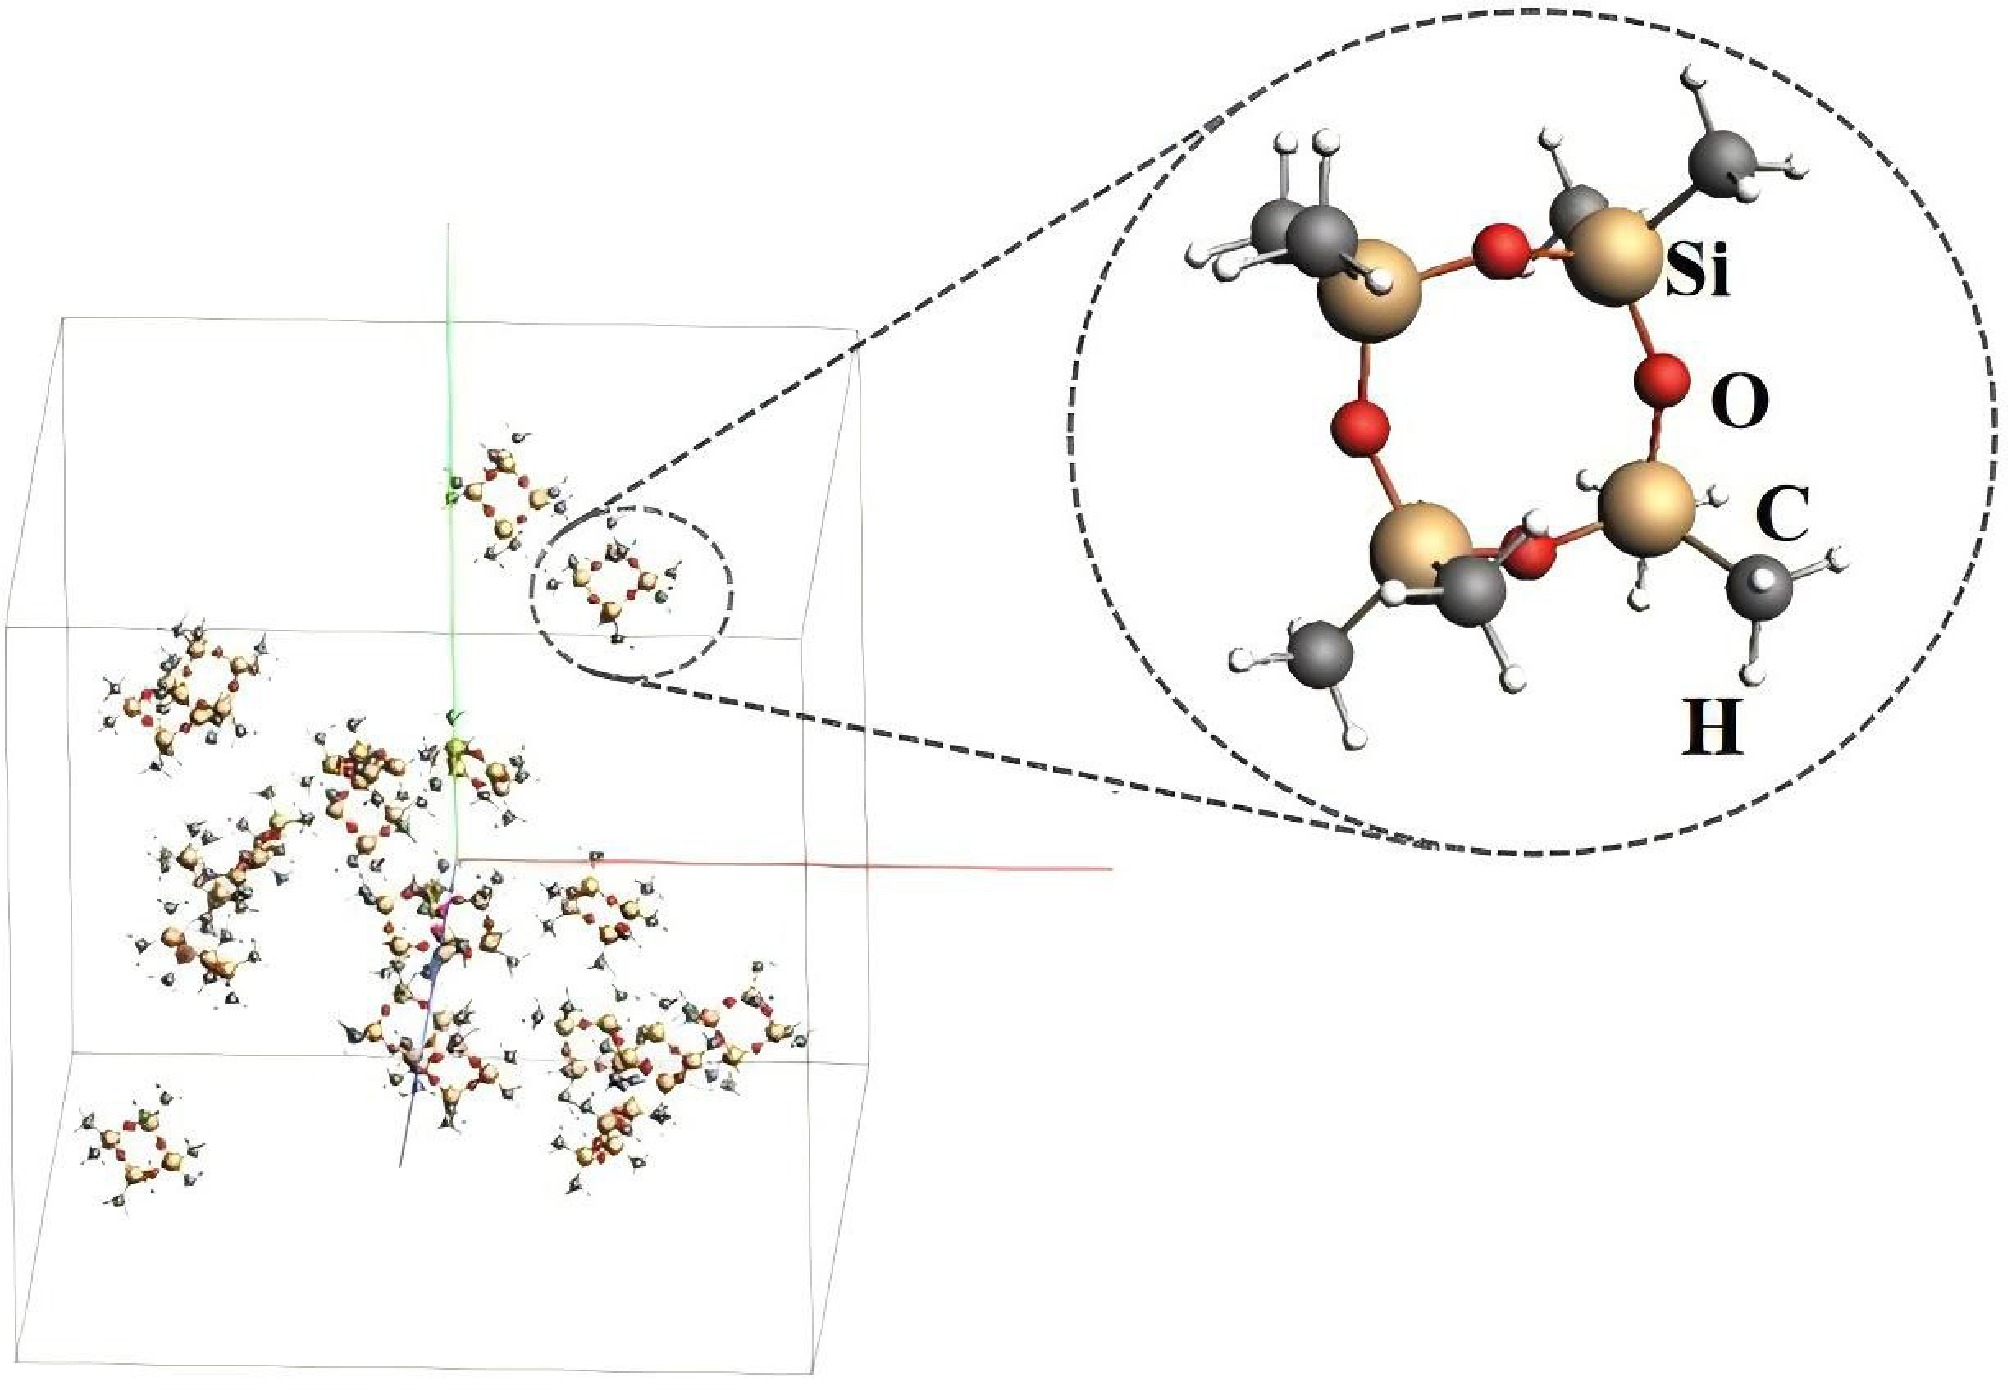
Figure 2.
The initial geometric configuration of D4 pyrolysis for ReaxFF MD simulations.
-
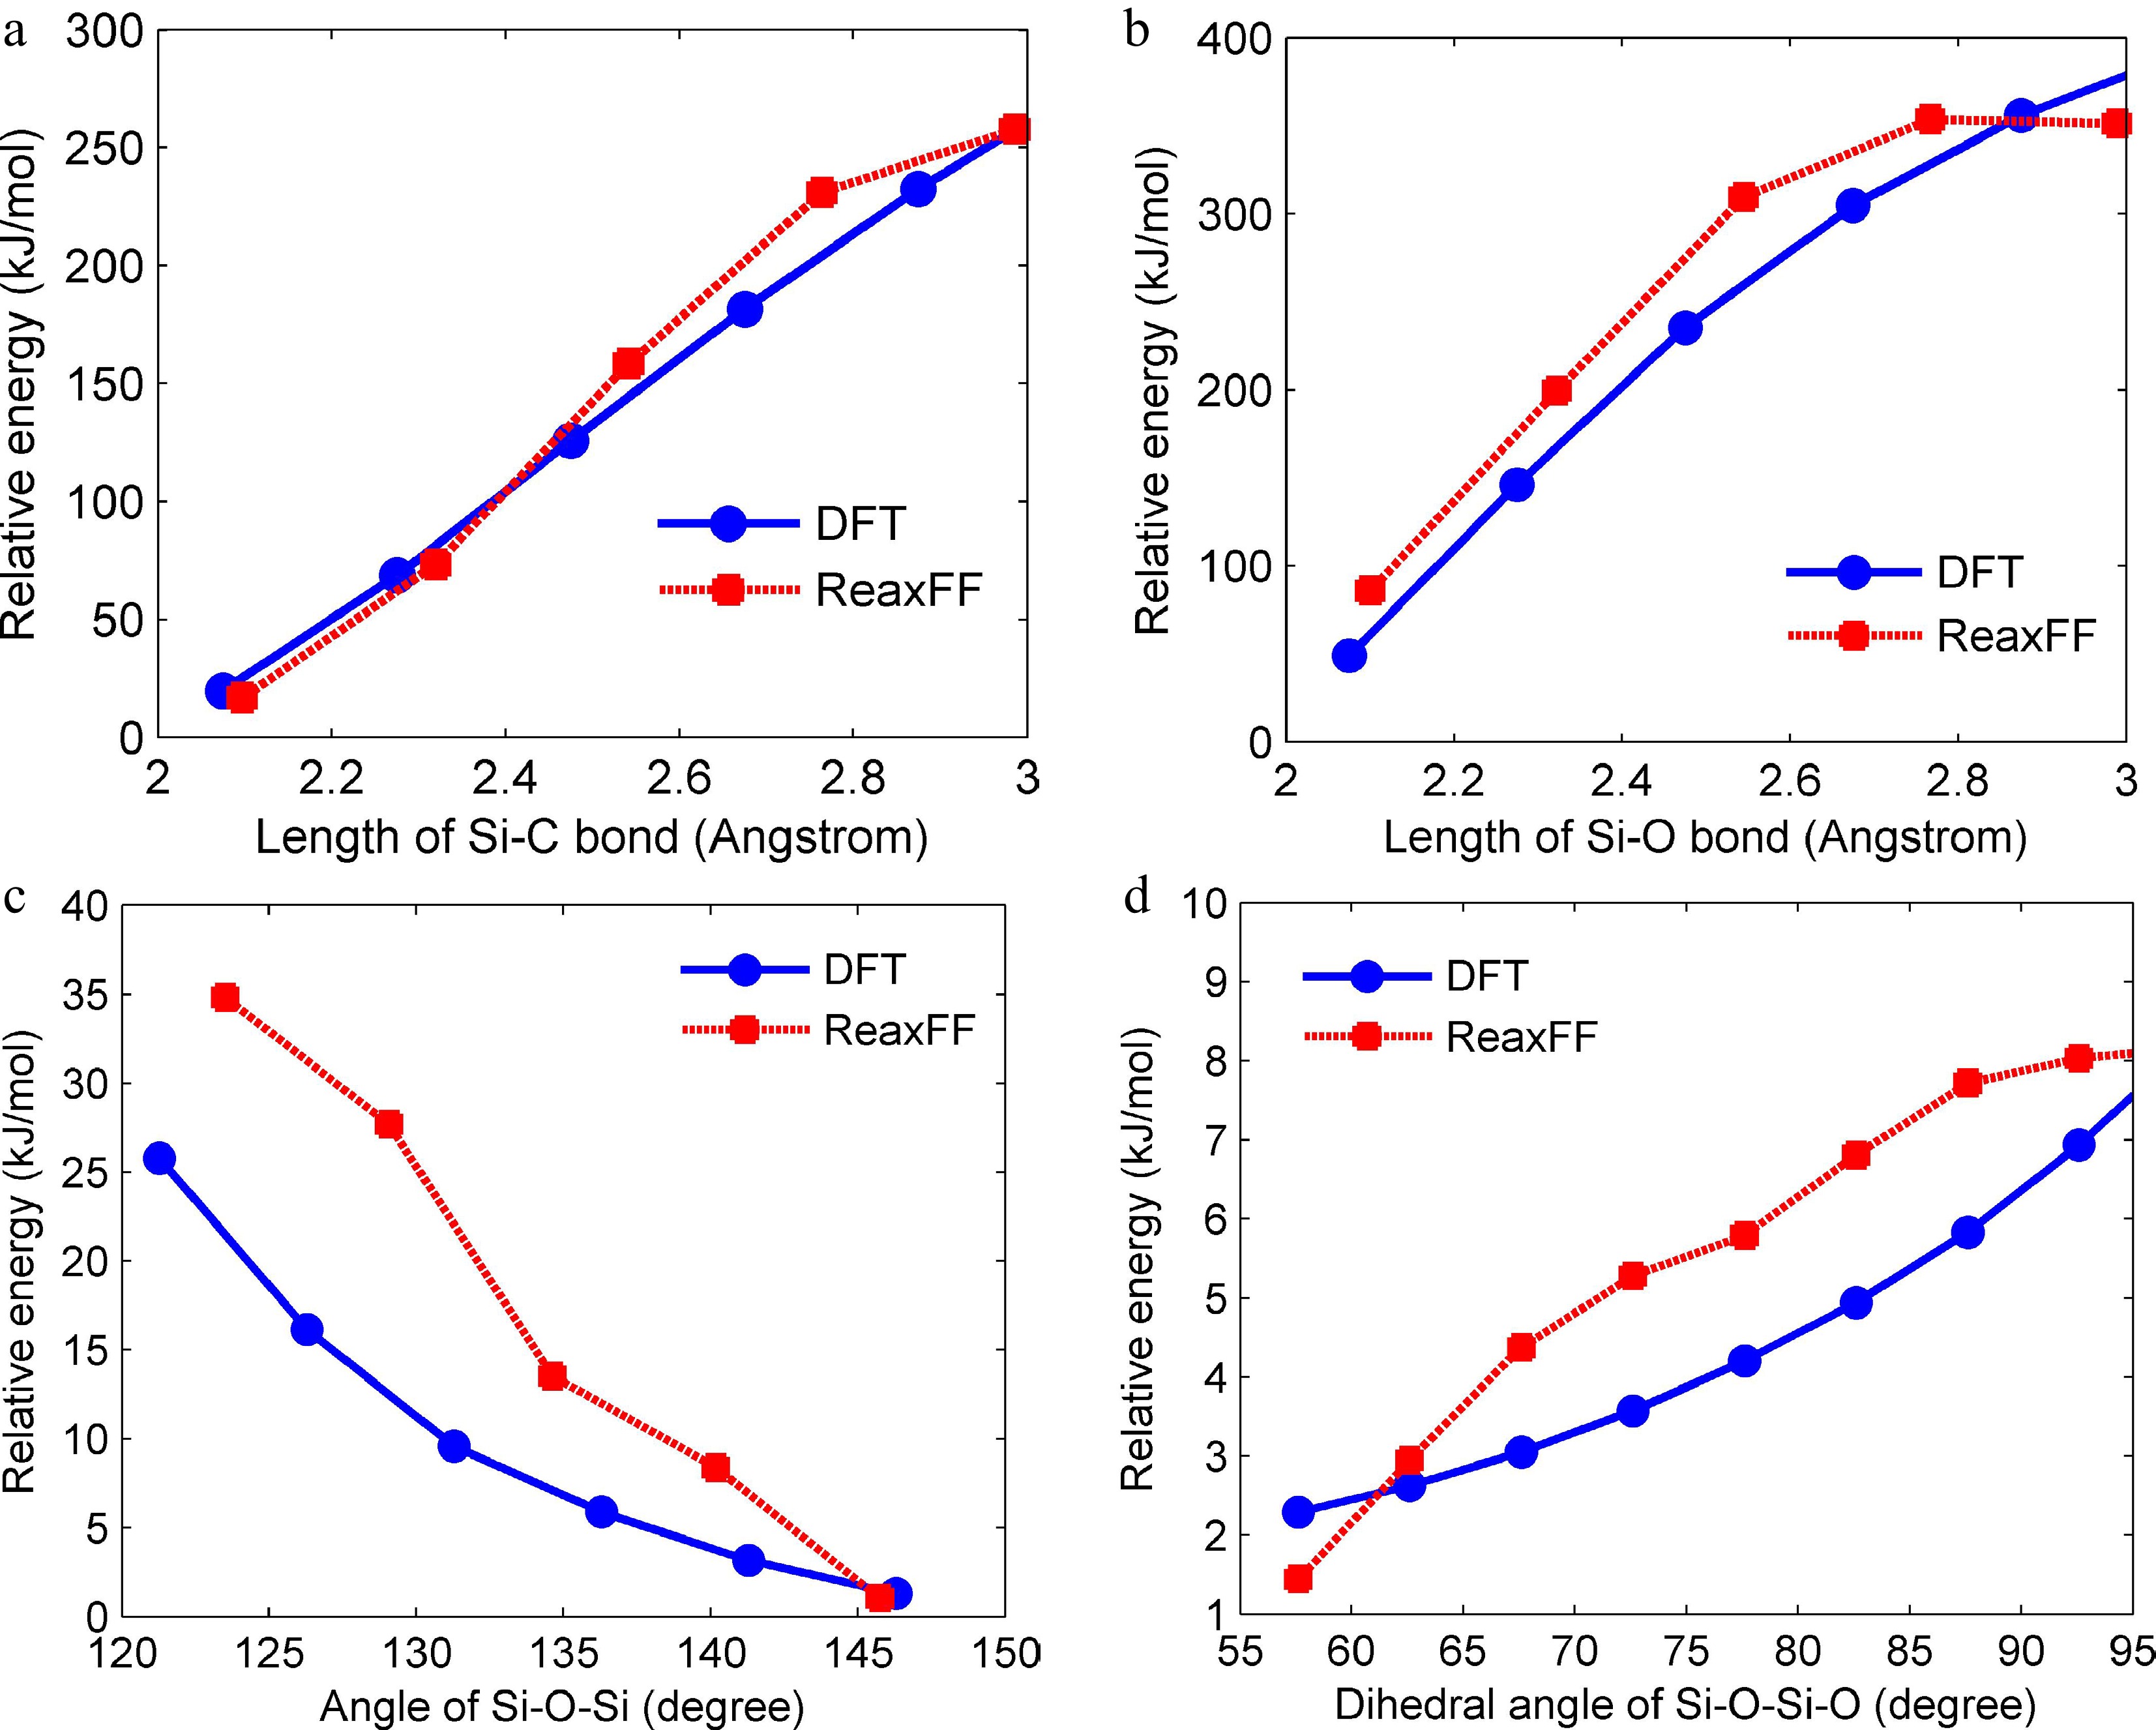
Figure 3.
Potential energy surface scans by ReaxFF simulations and DFT calculations with different bond lengths of (a) Si-C bonds, (b) Si-O bonds, and angles of (c) Si-O-Si bonds, and (d) Si-O-Si-O bonds. The relative energy is obtained by subtracting the initial molecular structure energy.
-
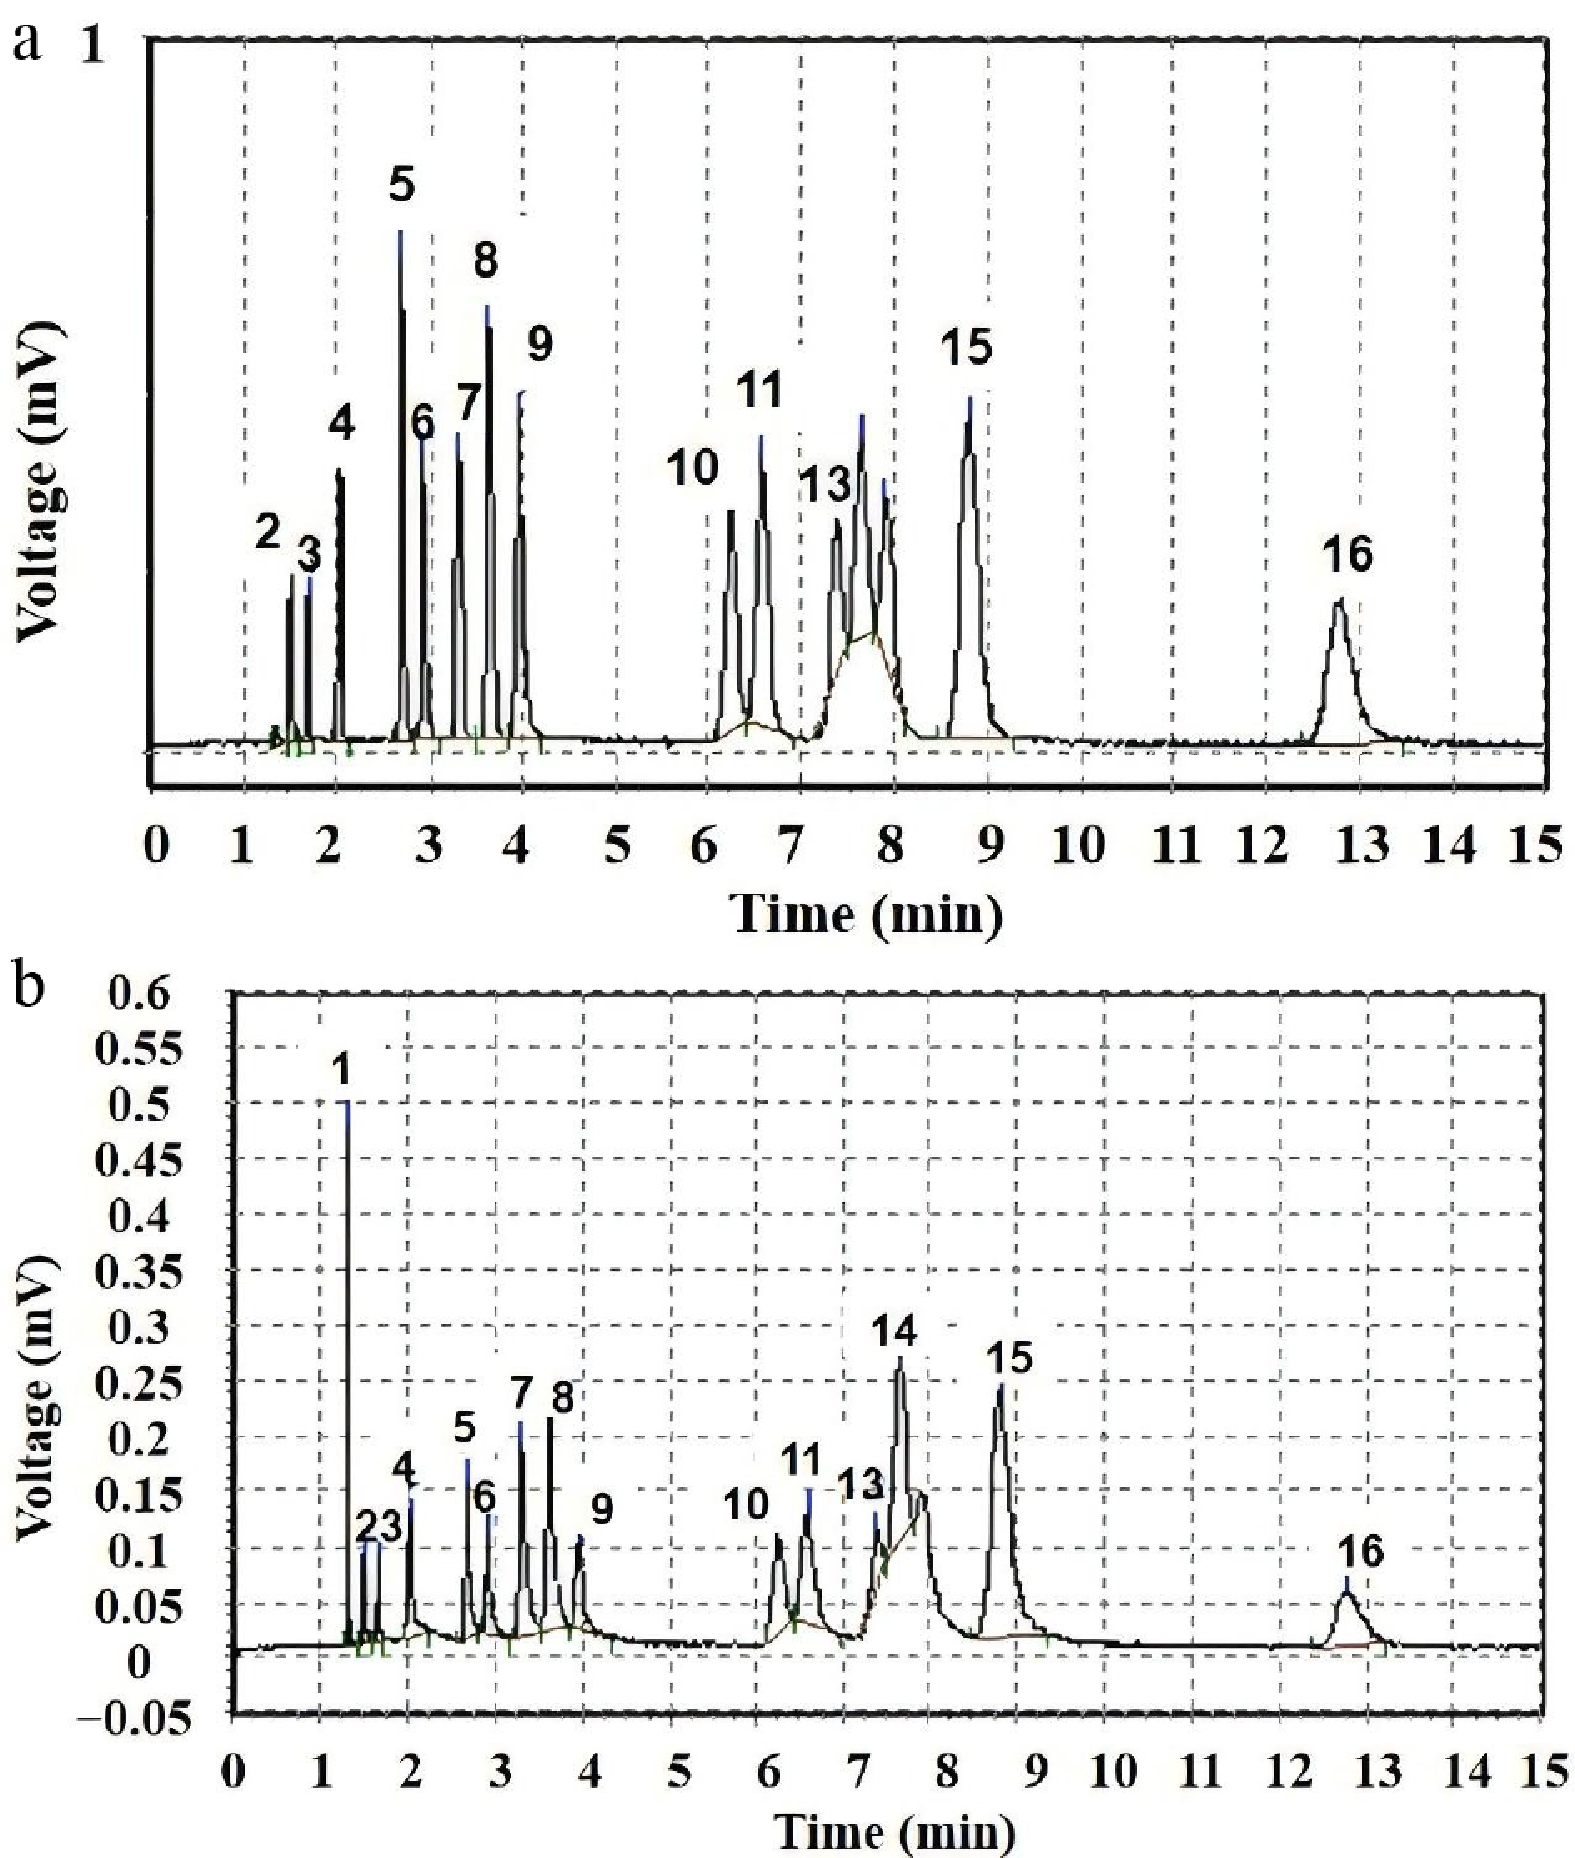
Figure 4.
The detected results of hydrocarbons from D4 pyrolysis by gas chromatography, where (a) and (b) correspond to the temperatures of 803, and 843 K, respectively.
-
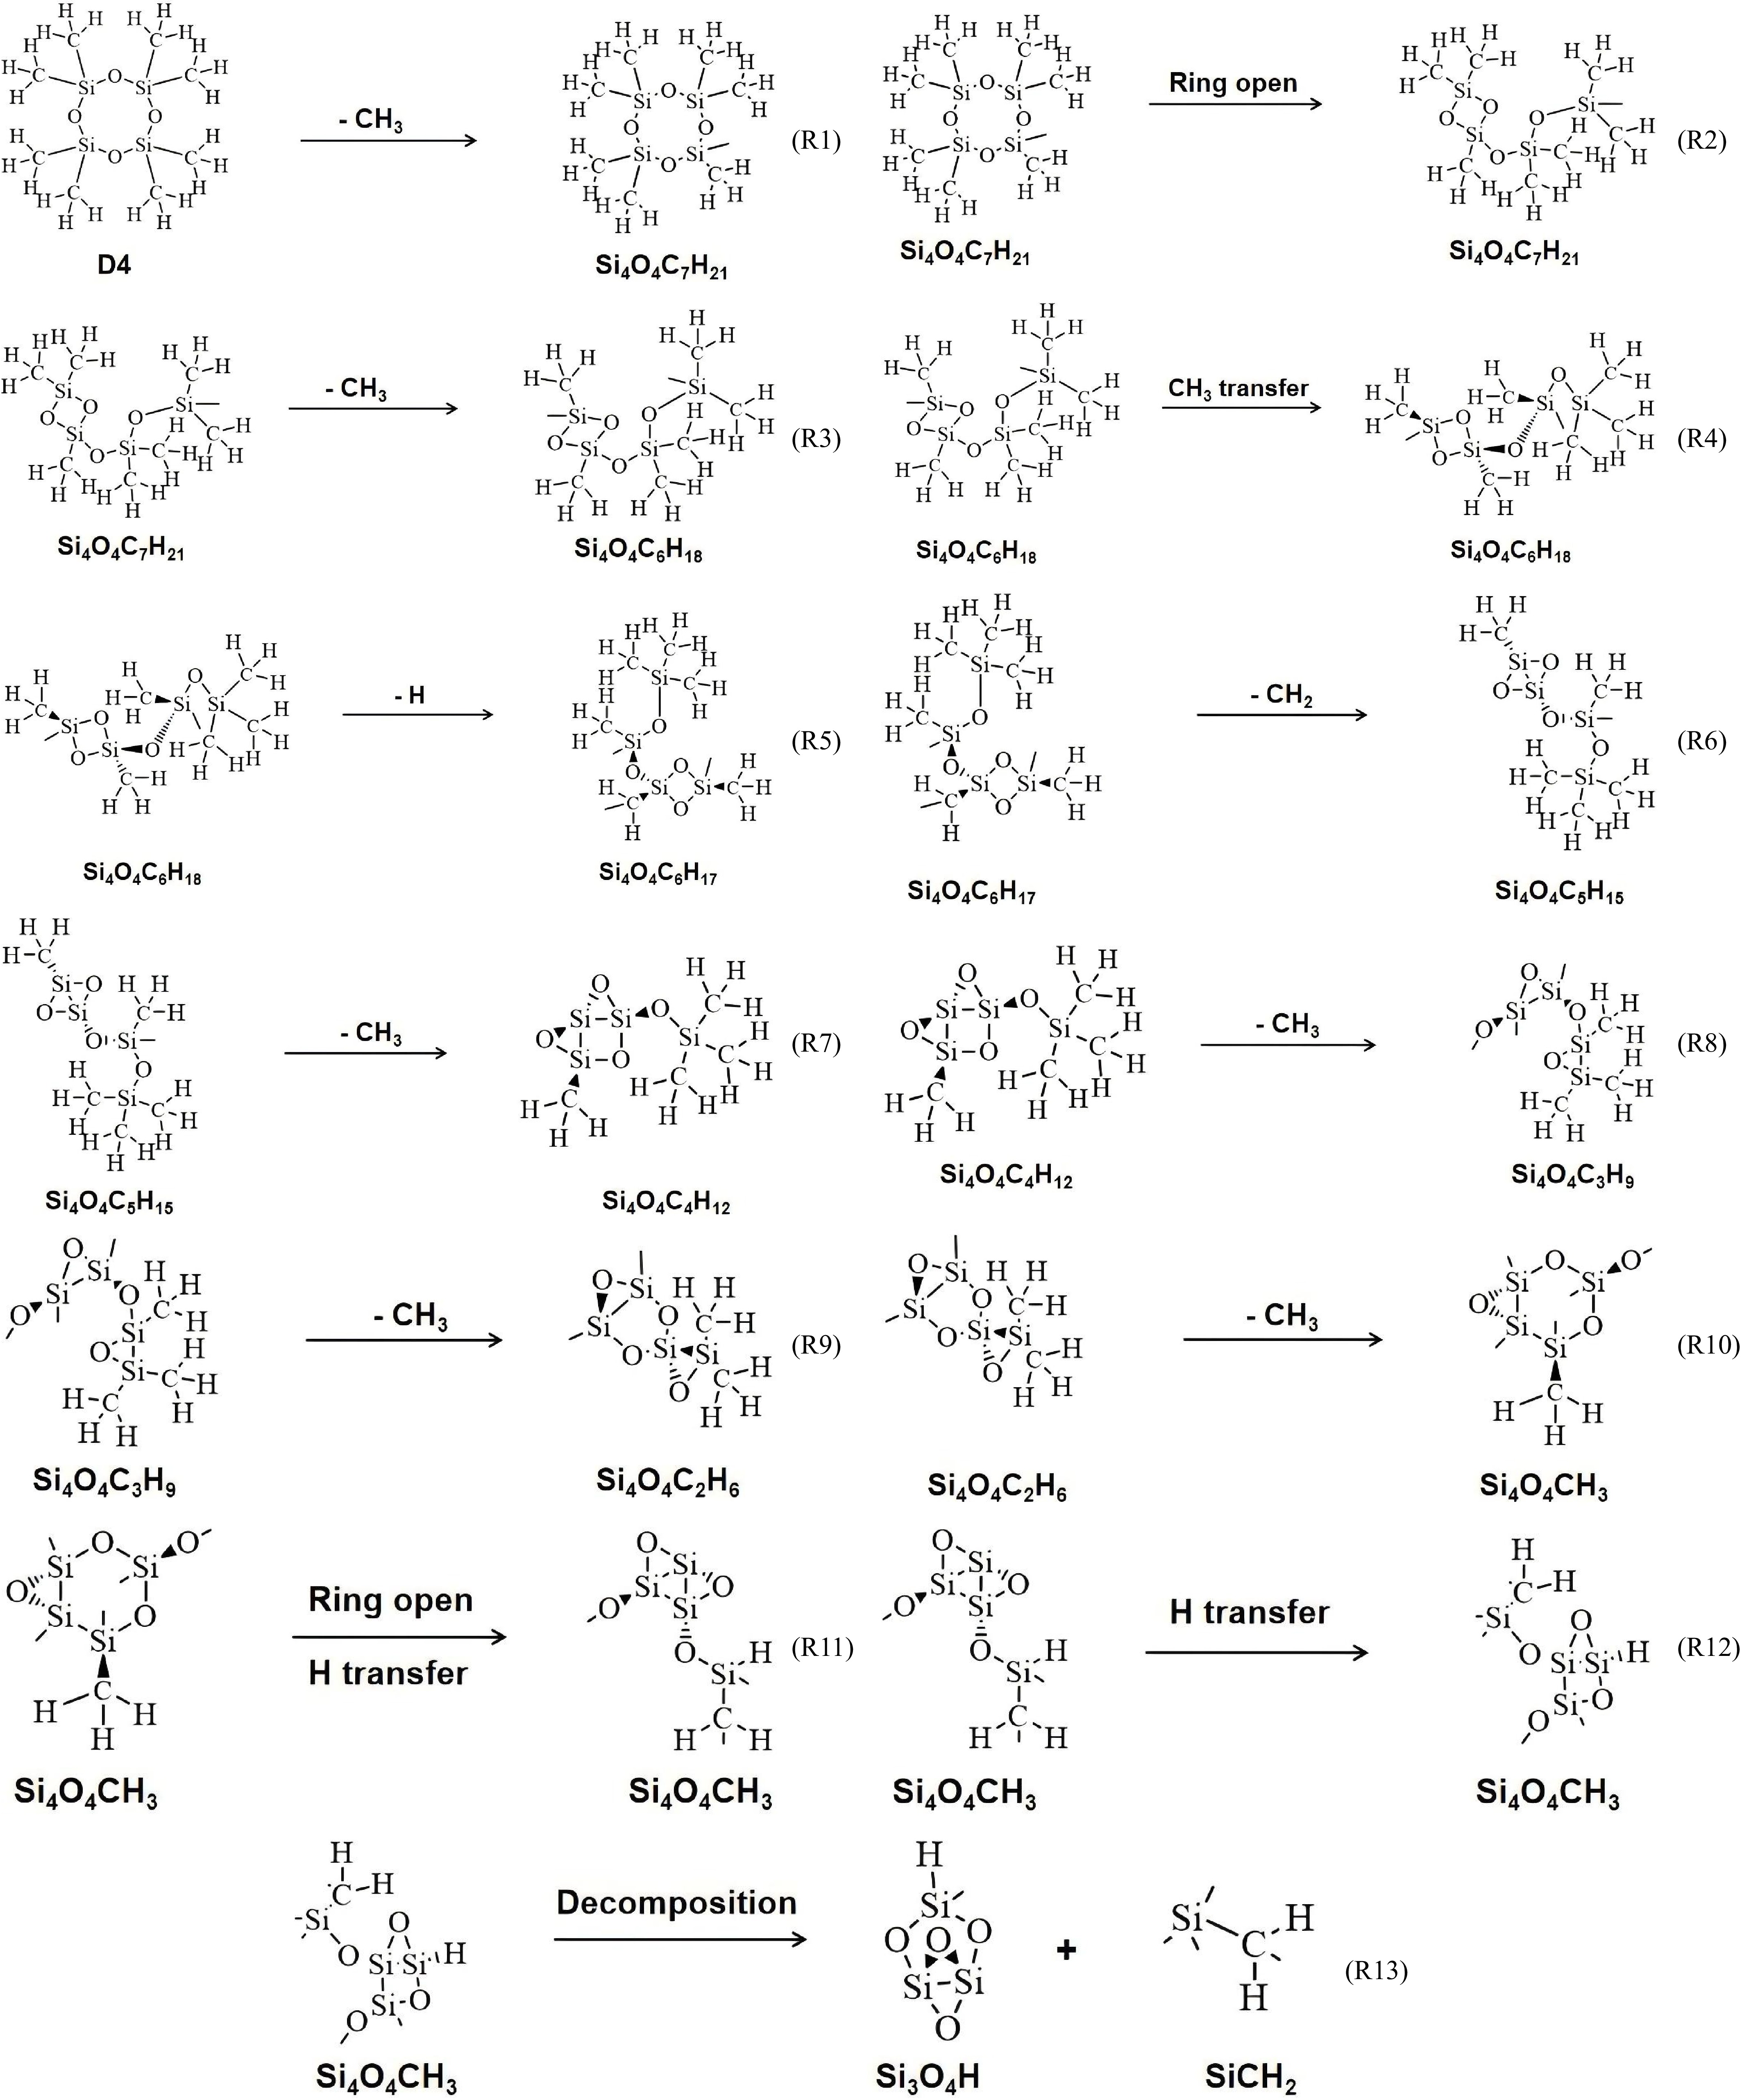
Figure 5.
Pyrolysis pathways of a single D4 molecule at 2,000 K.
-
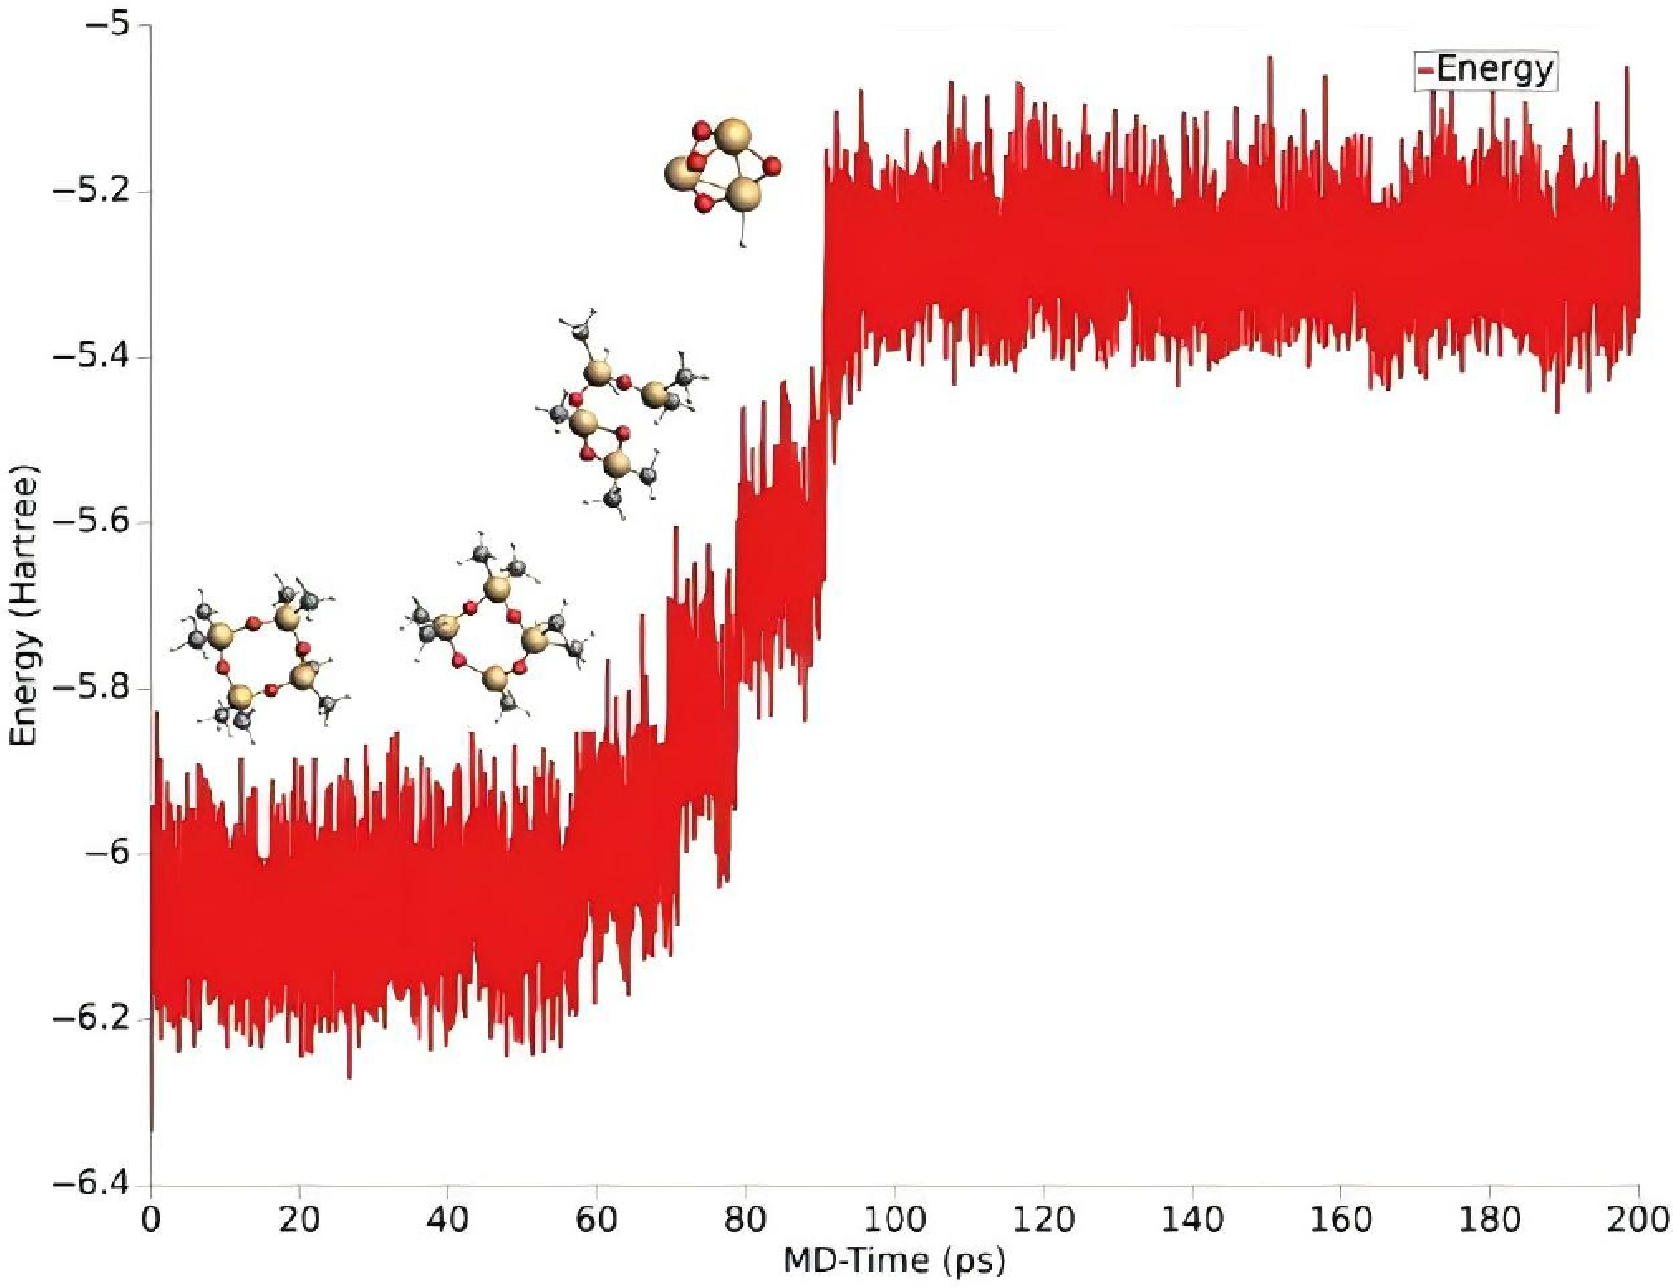
Figure 6.
Energy evolution during a single D4 molecule pyrolysis at 2,000 K.
-
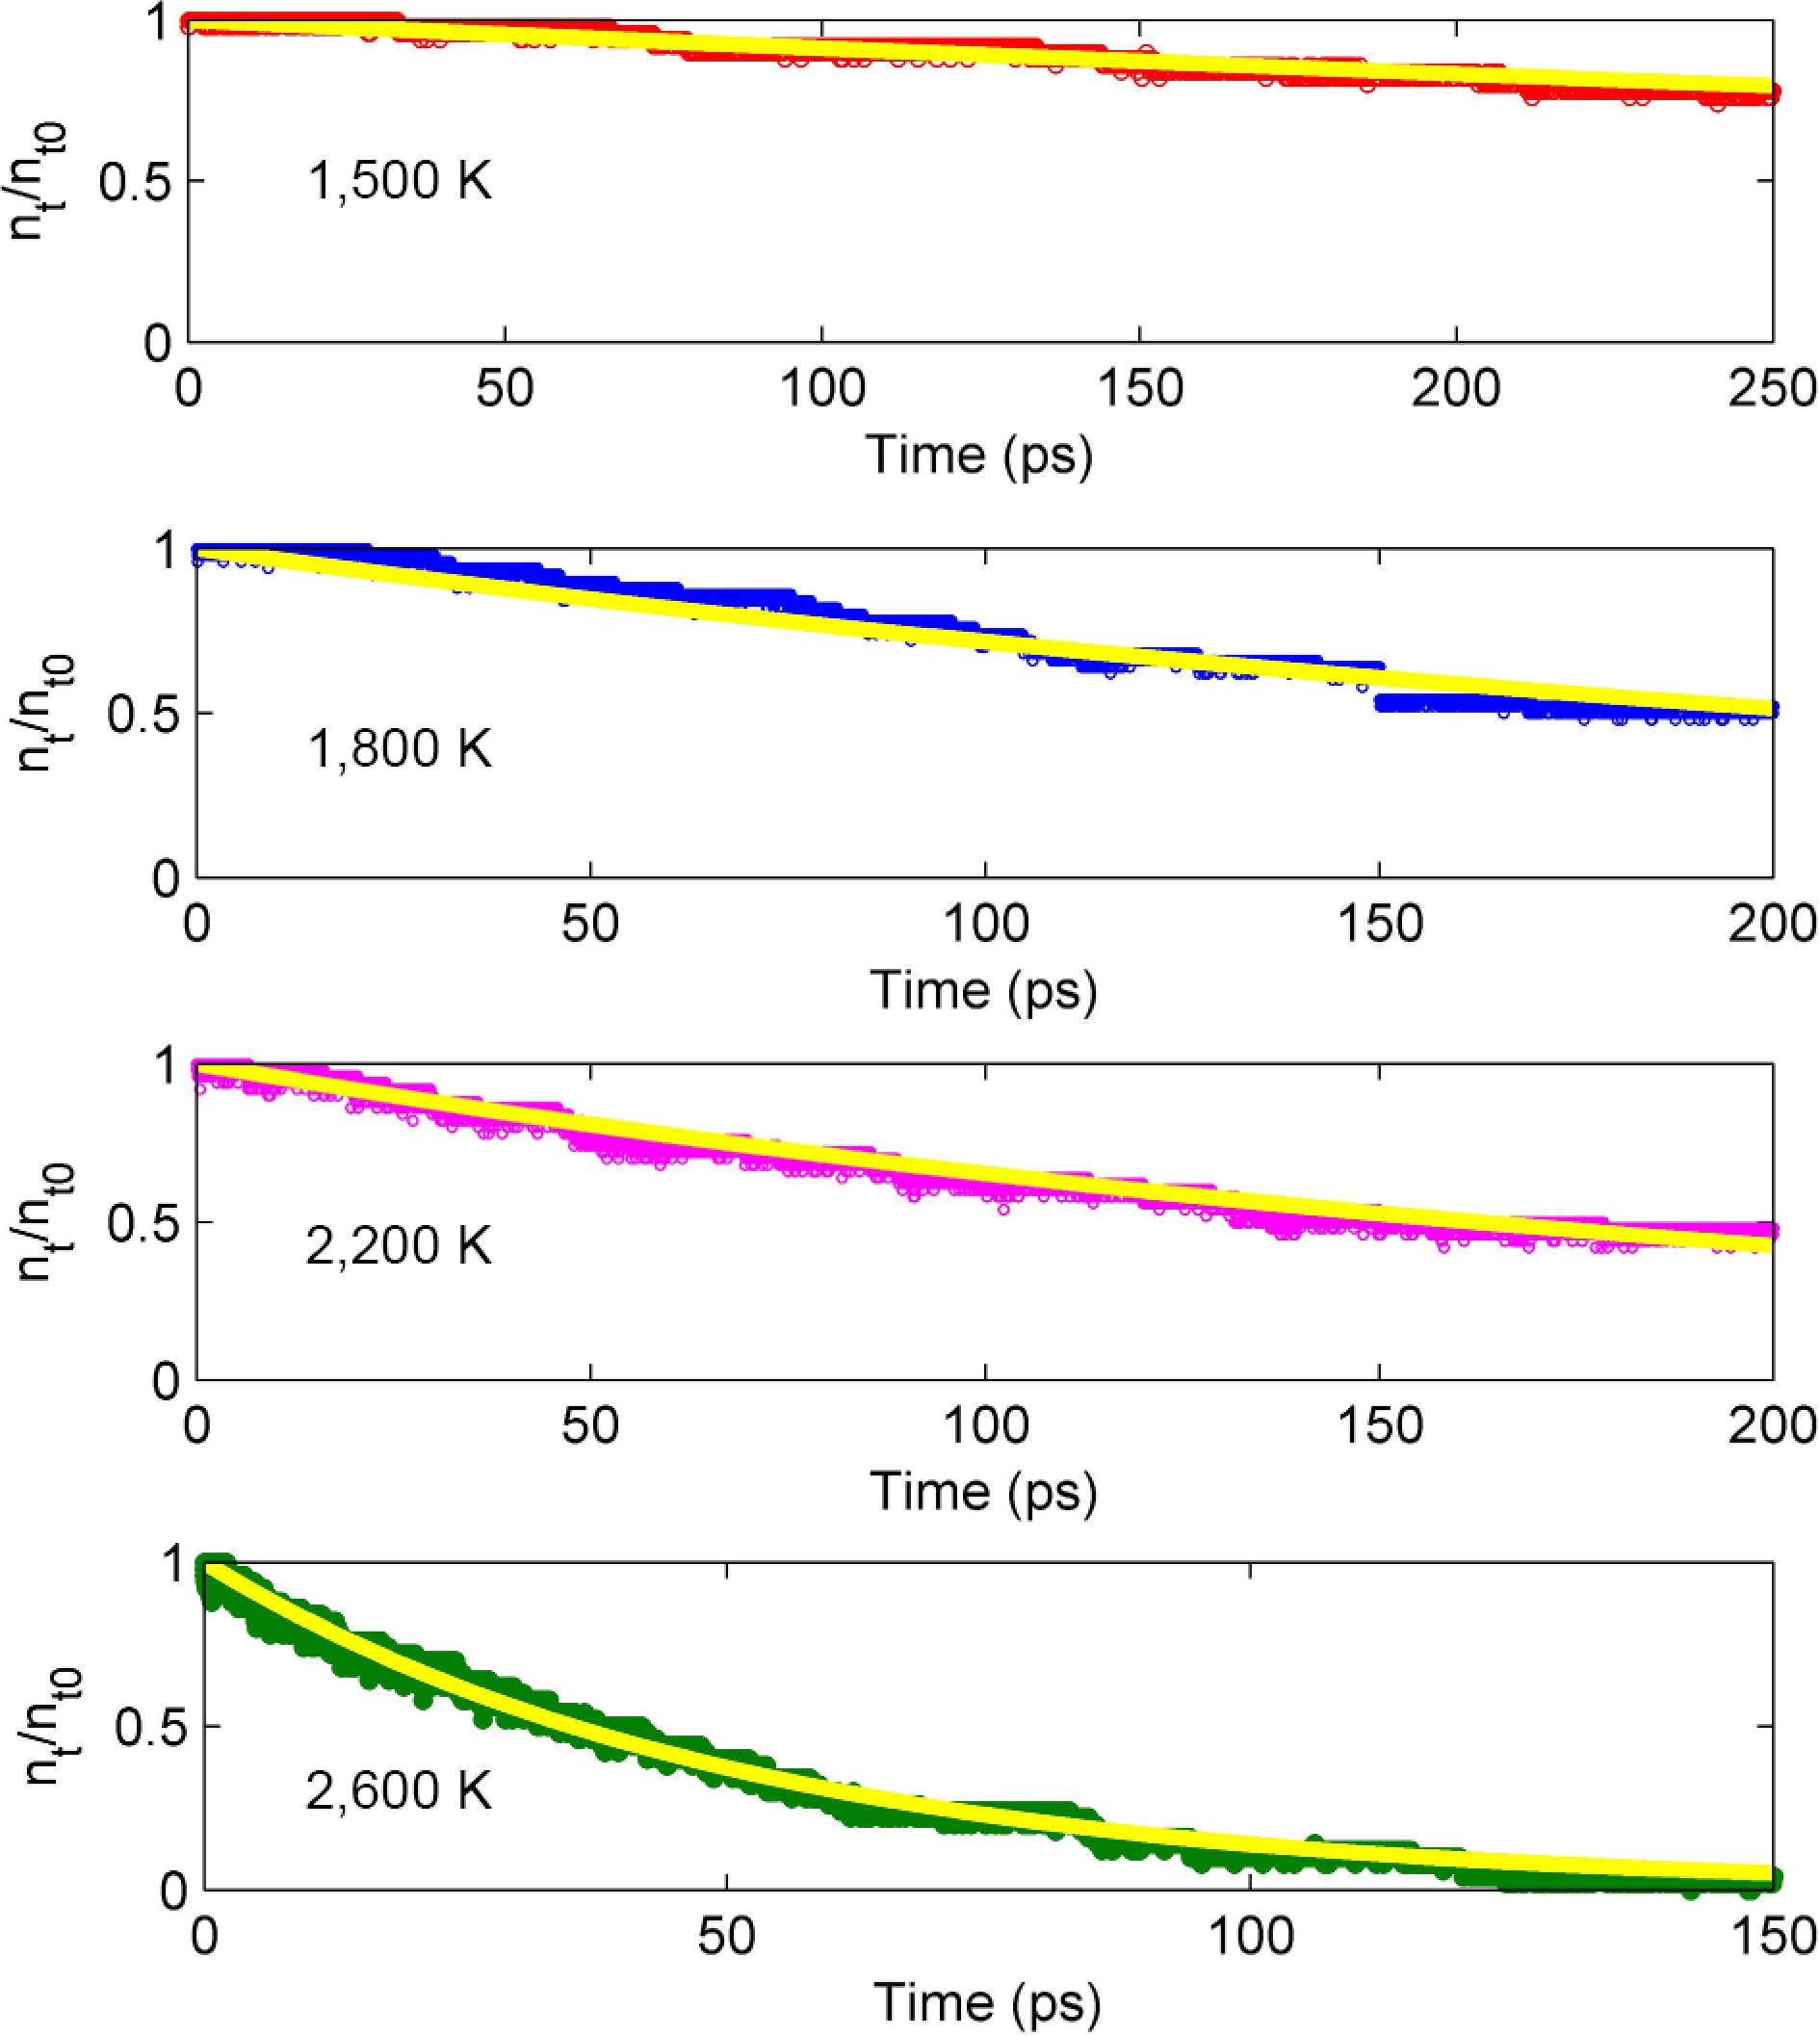
Figure 7.
Evolution of D4 molecular number at the temperature of 1,500−2,600 K. The solid line represents data fitting.
-
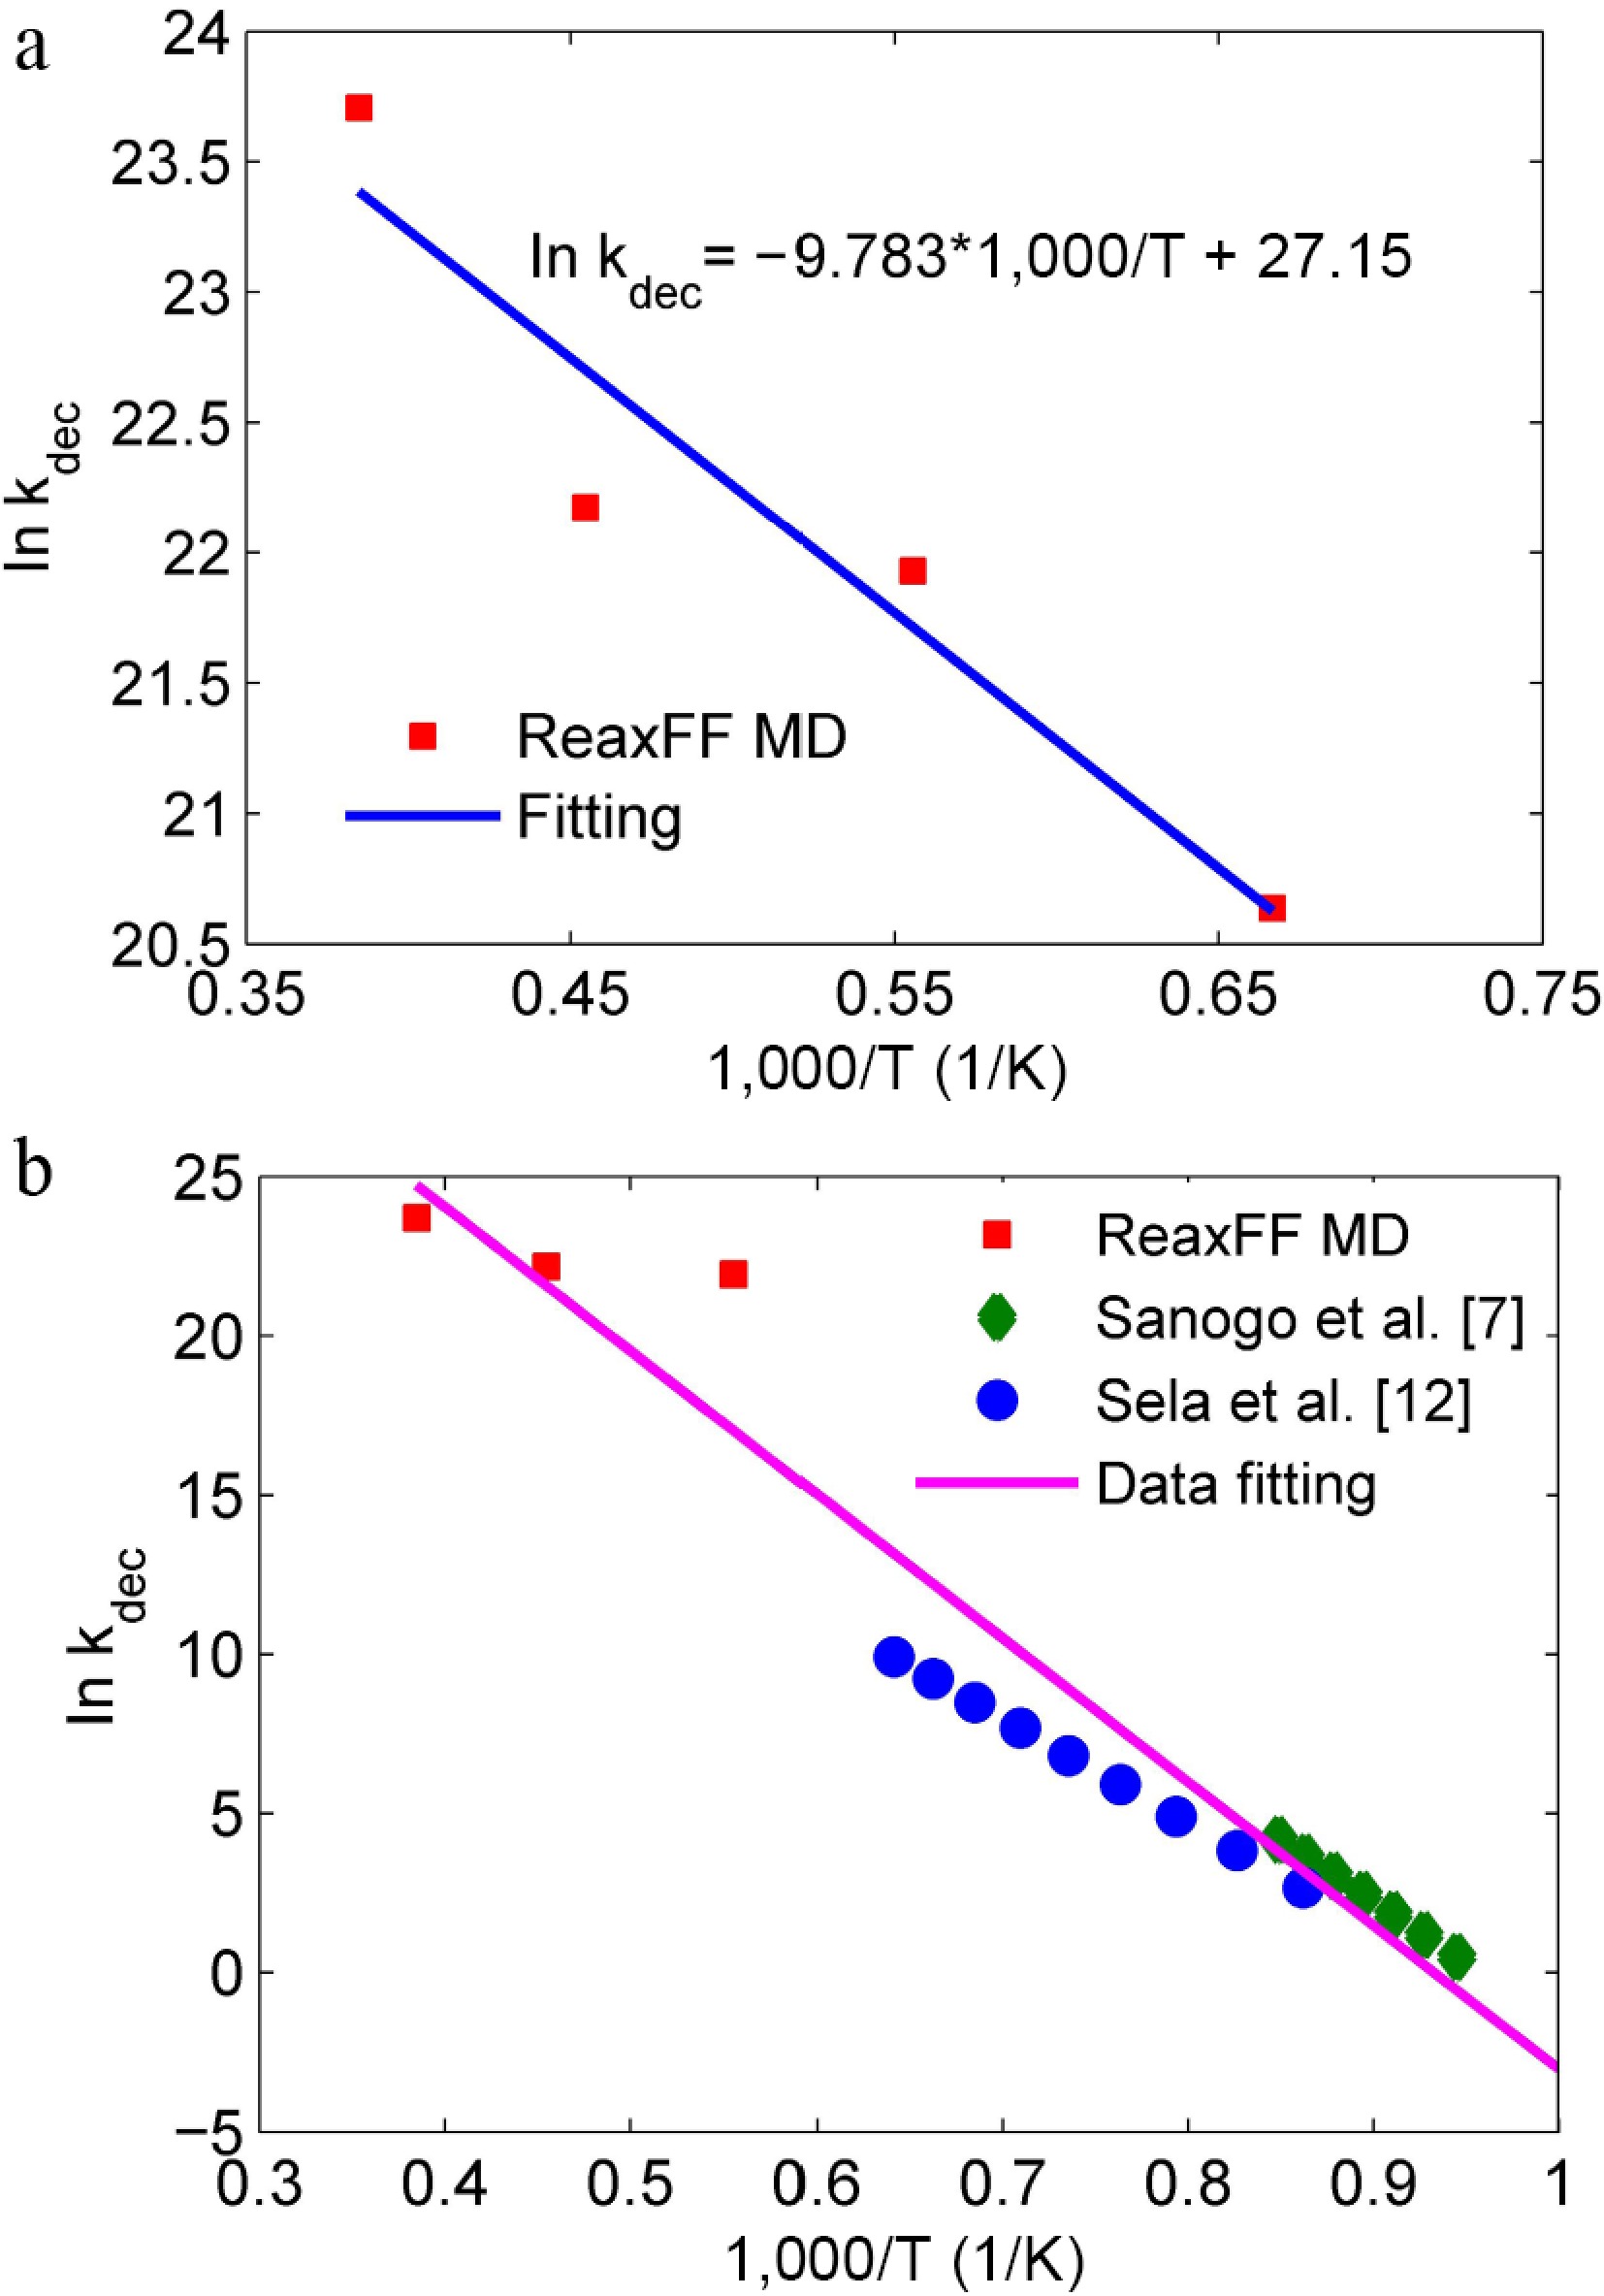
Figure 8.
Reaction rate constants of D4 pyrolysis at the temperatures of (a) 1,500−2,600 K by ReaxFF MD simulations, and (b) 1,058−2,600 K from the references.
-
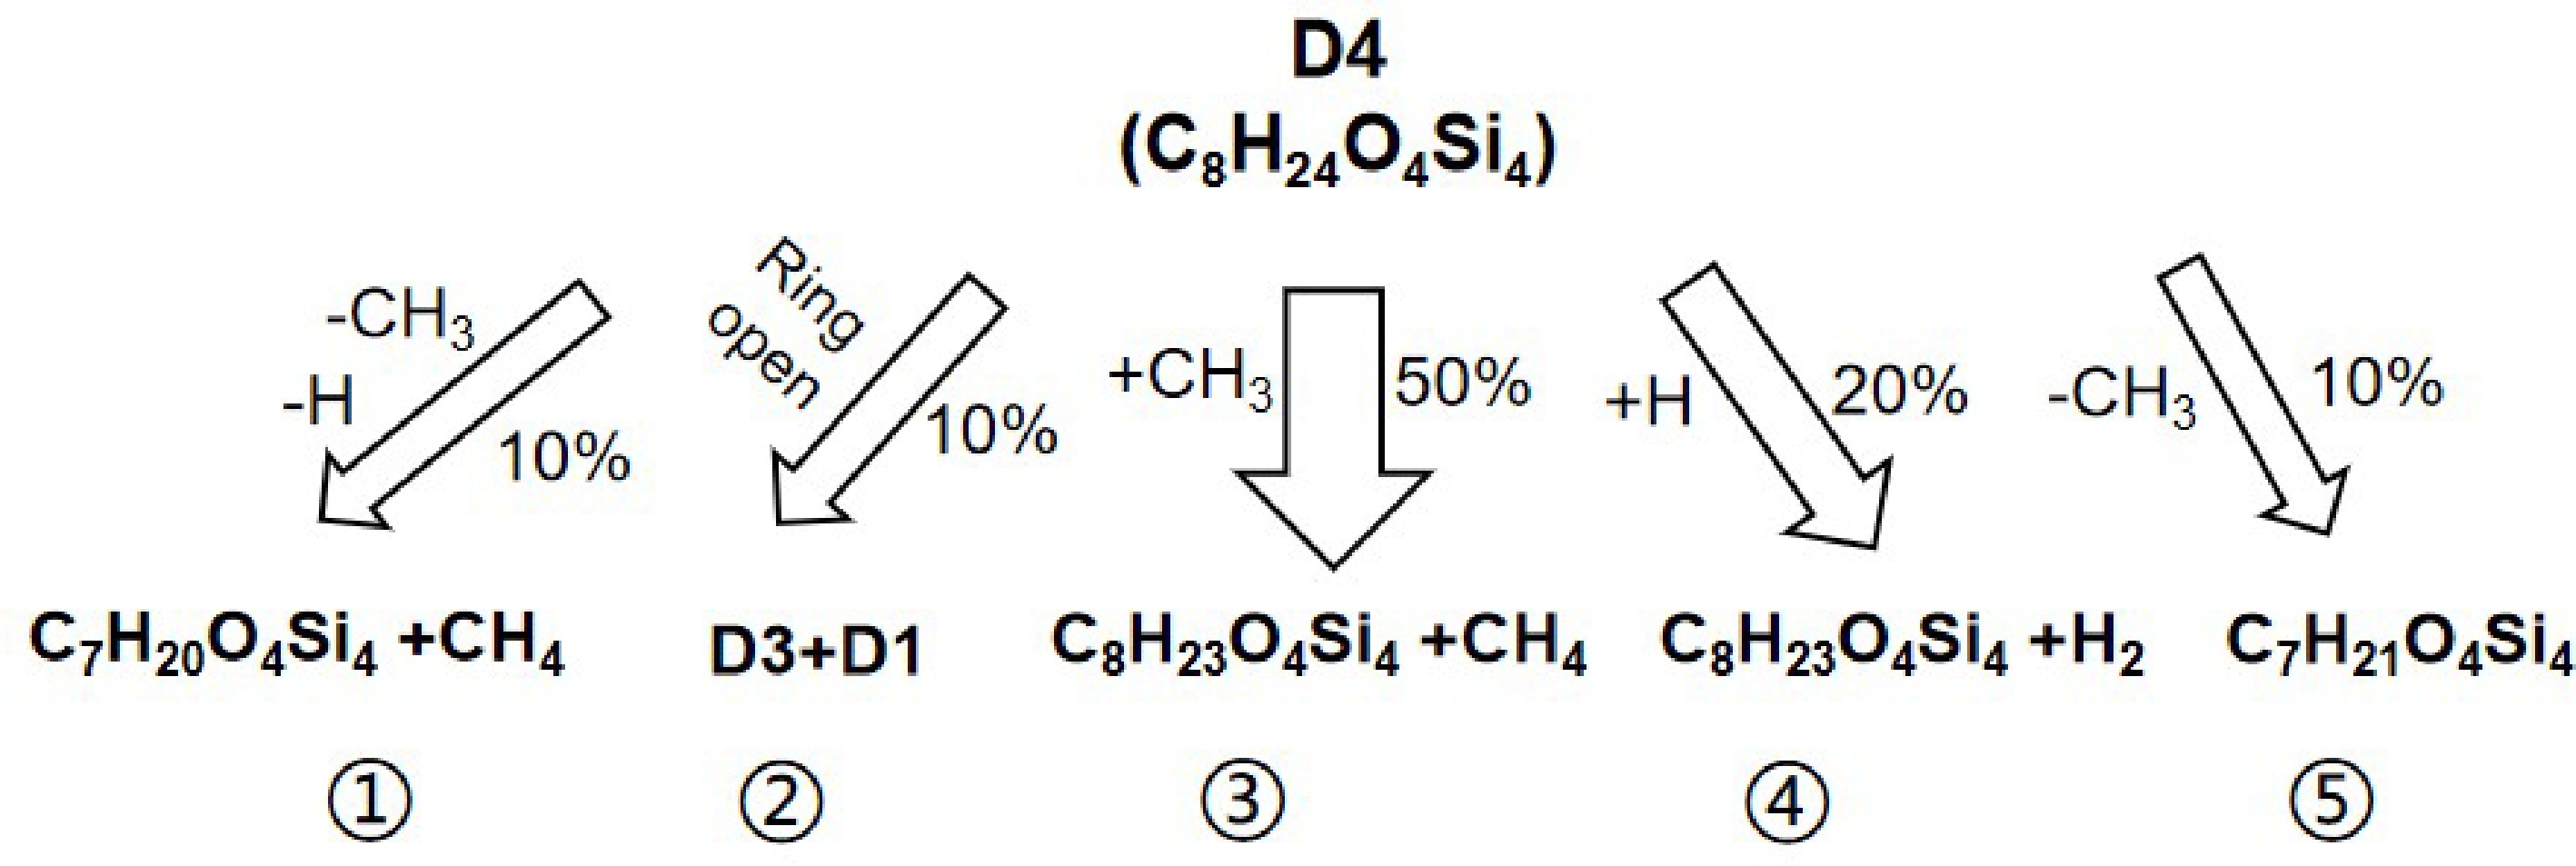
Figure 9.
Initial thermal decomposition paths of D4.
-
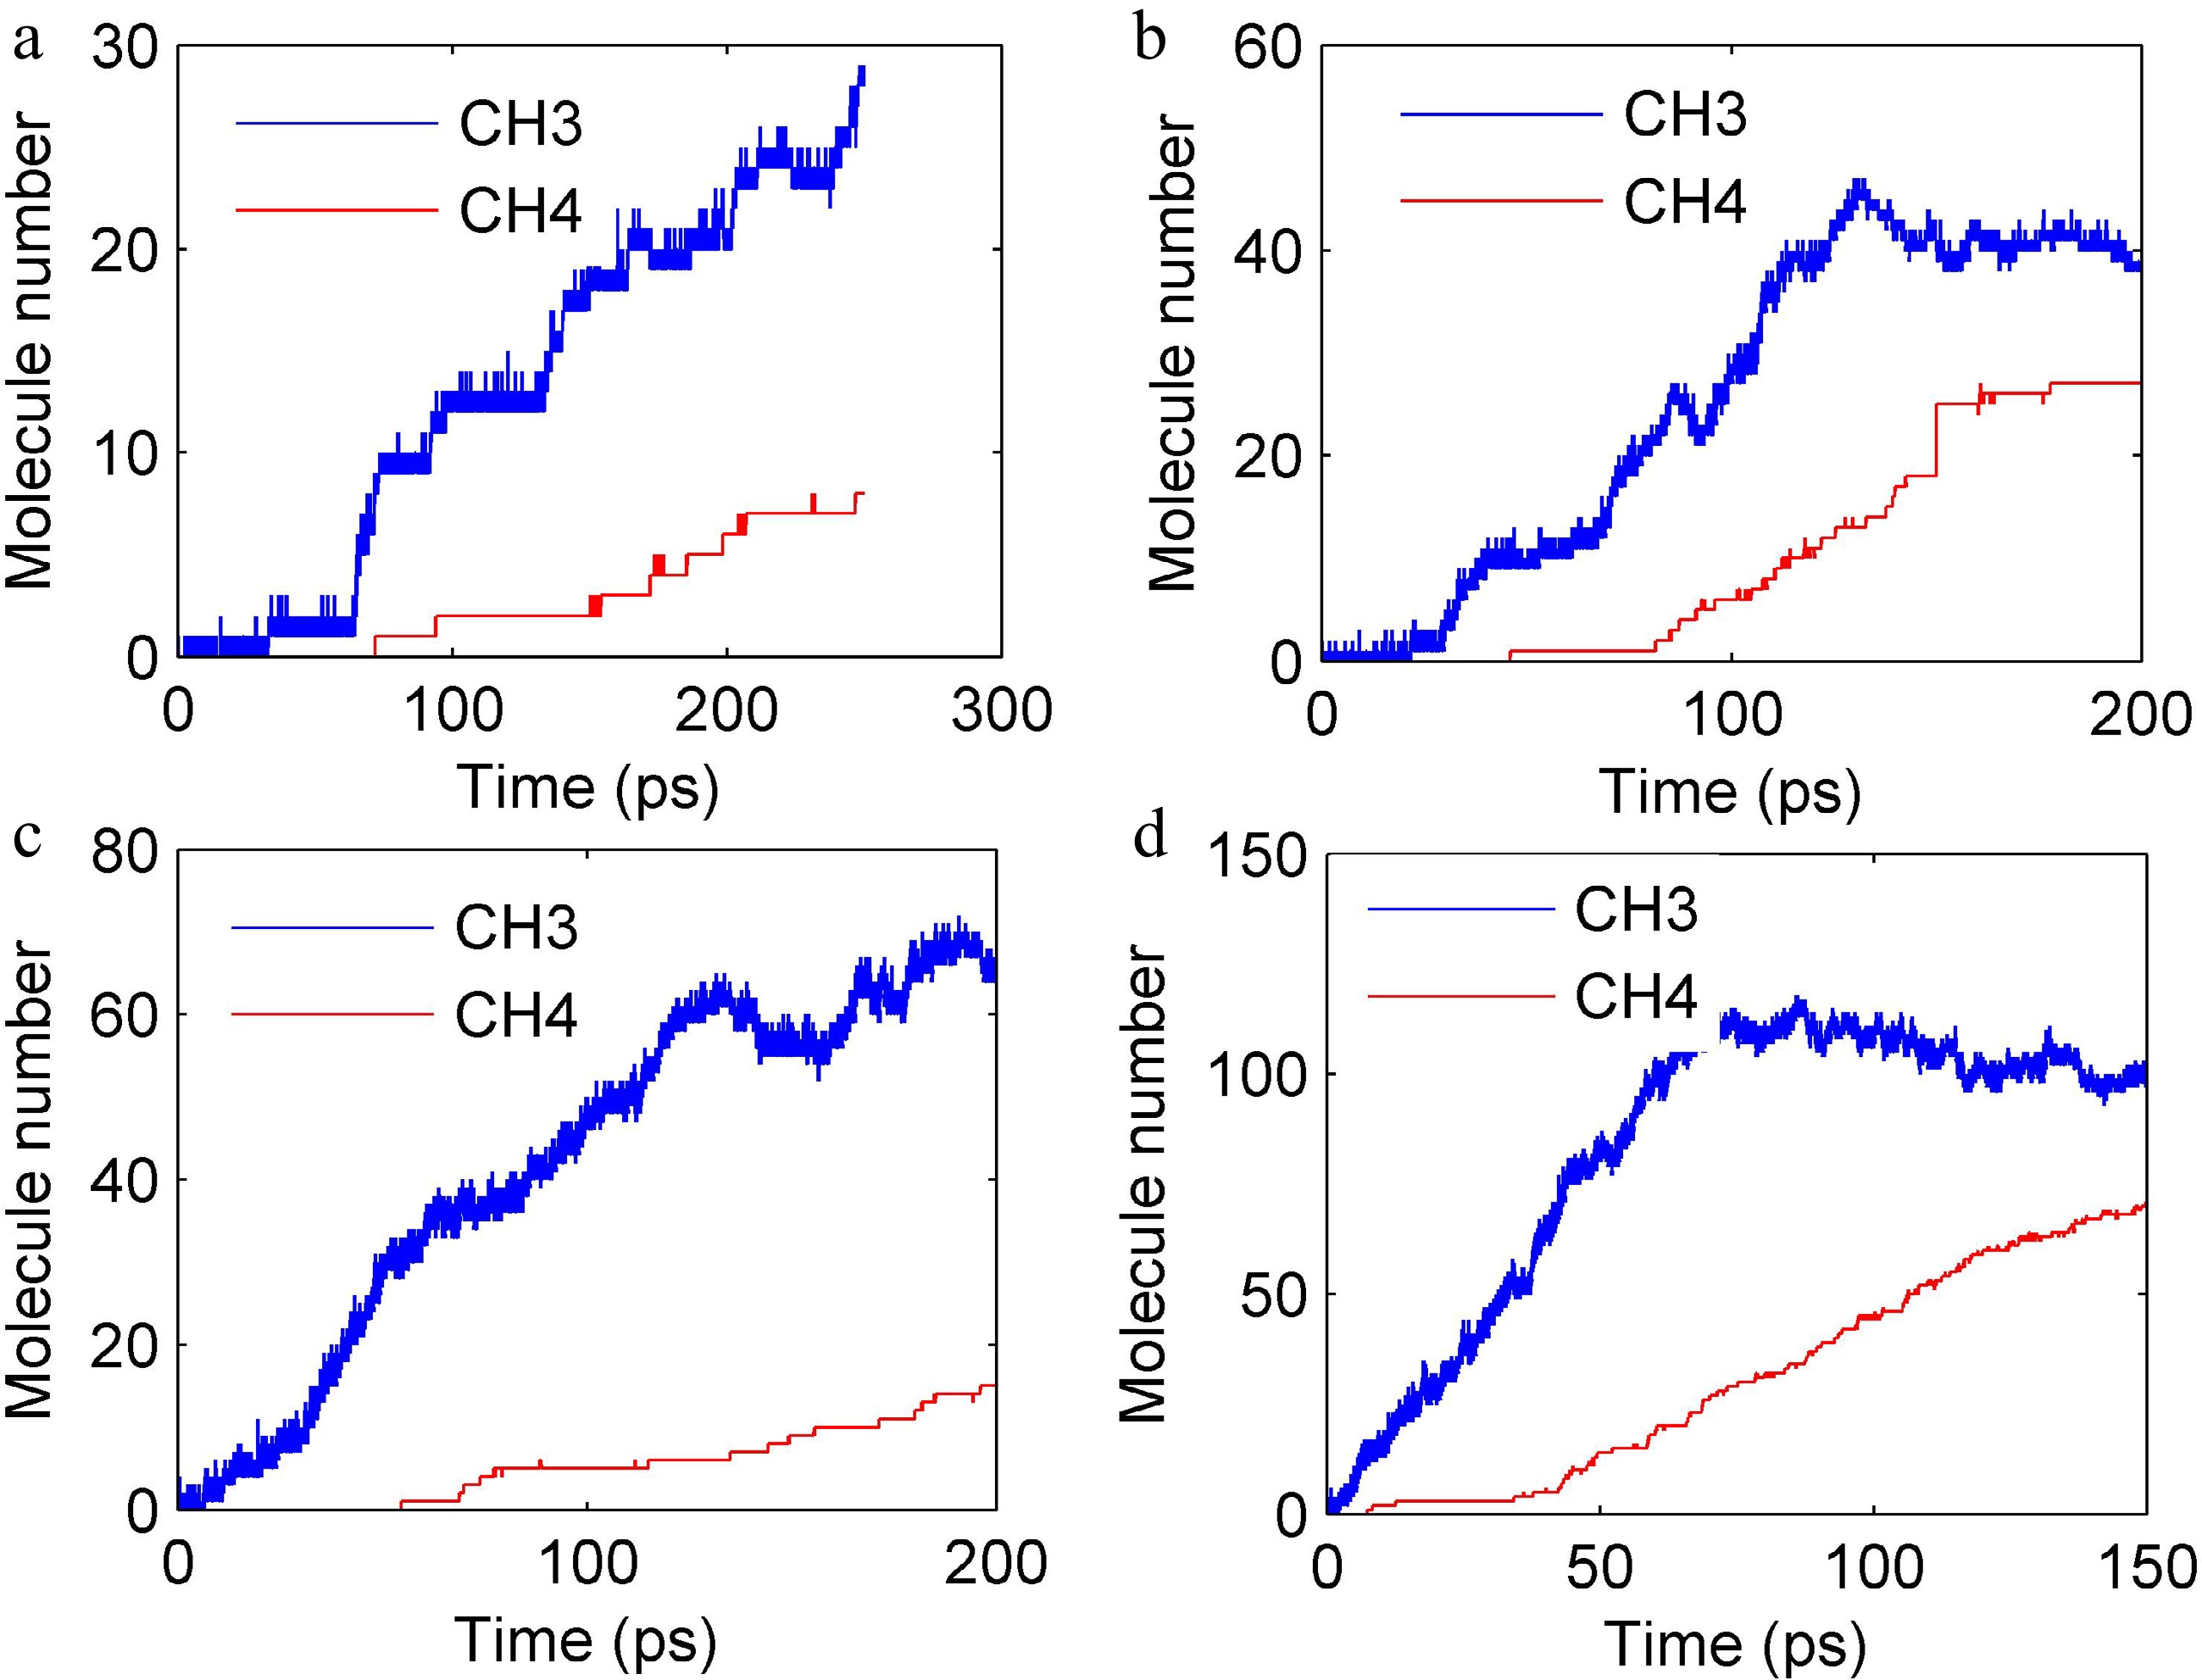
Figure 10.
Evolution of CH4 and CH3 molecules number at different temperatures. (a) 1,500 K, (b) 1,800 K, (c) 2,200 K, and (d) 2,600 K.
-
Peak No. Component name Peak No. Component name 1 Methane 9 Propadiene 2 Ethane 10 1-Butene 3 Ethylene 11 trans-2-Butene 4 Propane 12 Isobutylene 5 Cyclopropane 13 iso-Pentane 6 Propylene 14 cis-2-Butene 7 Isobutane 15 n-Pentane 8 n-Butane 16 1,3-Butadiene Table 1.
Component names represented by peak number in gas chromatograms.
-
Peak
no.Retention time
(min)Peak height
(μV)Peak area
(μV·s)Mole fraction
(%)1 / / / / 2 1.515 237.000 414.300 0.0131 3 1.682 195.500 380.200 0.0134 4 2.032 398.458 922.800 0.0215 5 2.698 703.759 2,155.450 0.0434 6 2.932 408.000 1,415.500 0.0337 7 3.315 400.000 1,644.500 0.0369 8 3.640 579.756 2,698.850 0.0447 9 3.965 450.385 2,339.200 0.0531 10 6.240 308.933 2,575.000 0.0497 11 6.582 373.814 3,285.500 0.0599 12 7.382 213.667 1,584.700 0.0395 13 7.640 278.303 2,327.700 0.0449 14 7.907 227.150 2,038.000 0.0393 15 8.807 450.358 6,256.600 0.0678 16 12.798 193.846 3,925.900 0.0646 Note: Argon is the primary species in the gas mixture. Table 2.
Chromatographic data of pyrolysis products at 803 K.
-
Peak
no.Retention time
(min)Peak height
(μV)Peak area
(μV·s)Mole fraction
(%)1 1.323 453.000 738.900 0.0763 2 1.507 78.167 170.900 0.0054 3 1.673 77.600 167.750 0.0059 4 2.023 111.909 388.800 0.0090 5 2.690 144.276 532.450 0.0107 6 2.923 90.135 389.500 0.0093 7 3.315 177.308 980.700 0.0161 8 3.640 200.472 1,165.600 0.0193 9 3.965 75.037 467.900 0.0106 10 6.257 85.795 780.750 0.0151 11 6.598 100.742 1,009.600 0.0184 13 7.390 50.371 365.200 0.0091 14 7.657 157.459 1,475.000 0.0502 15 8.798 220.842 3,427.950 0.0372 16 12.790 48.941 978.600 0.0161 Table 3.
Chromatographic data of pyrolysis products at 843 K.
Figures
(10)
Tables
(3)