-
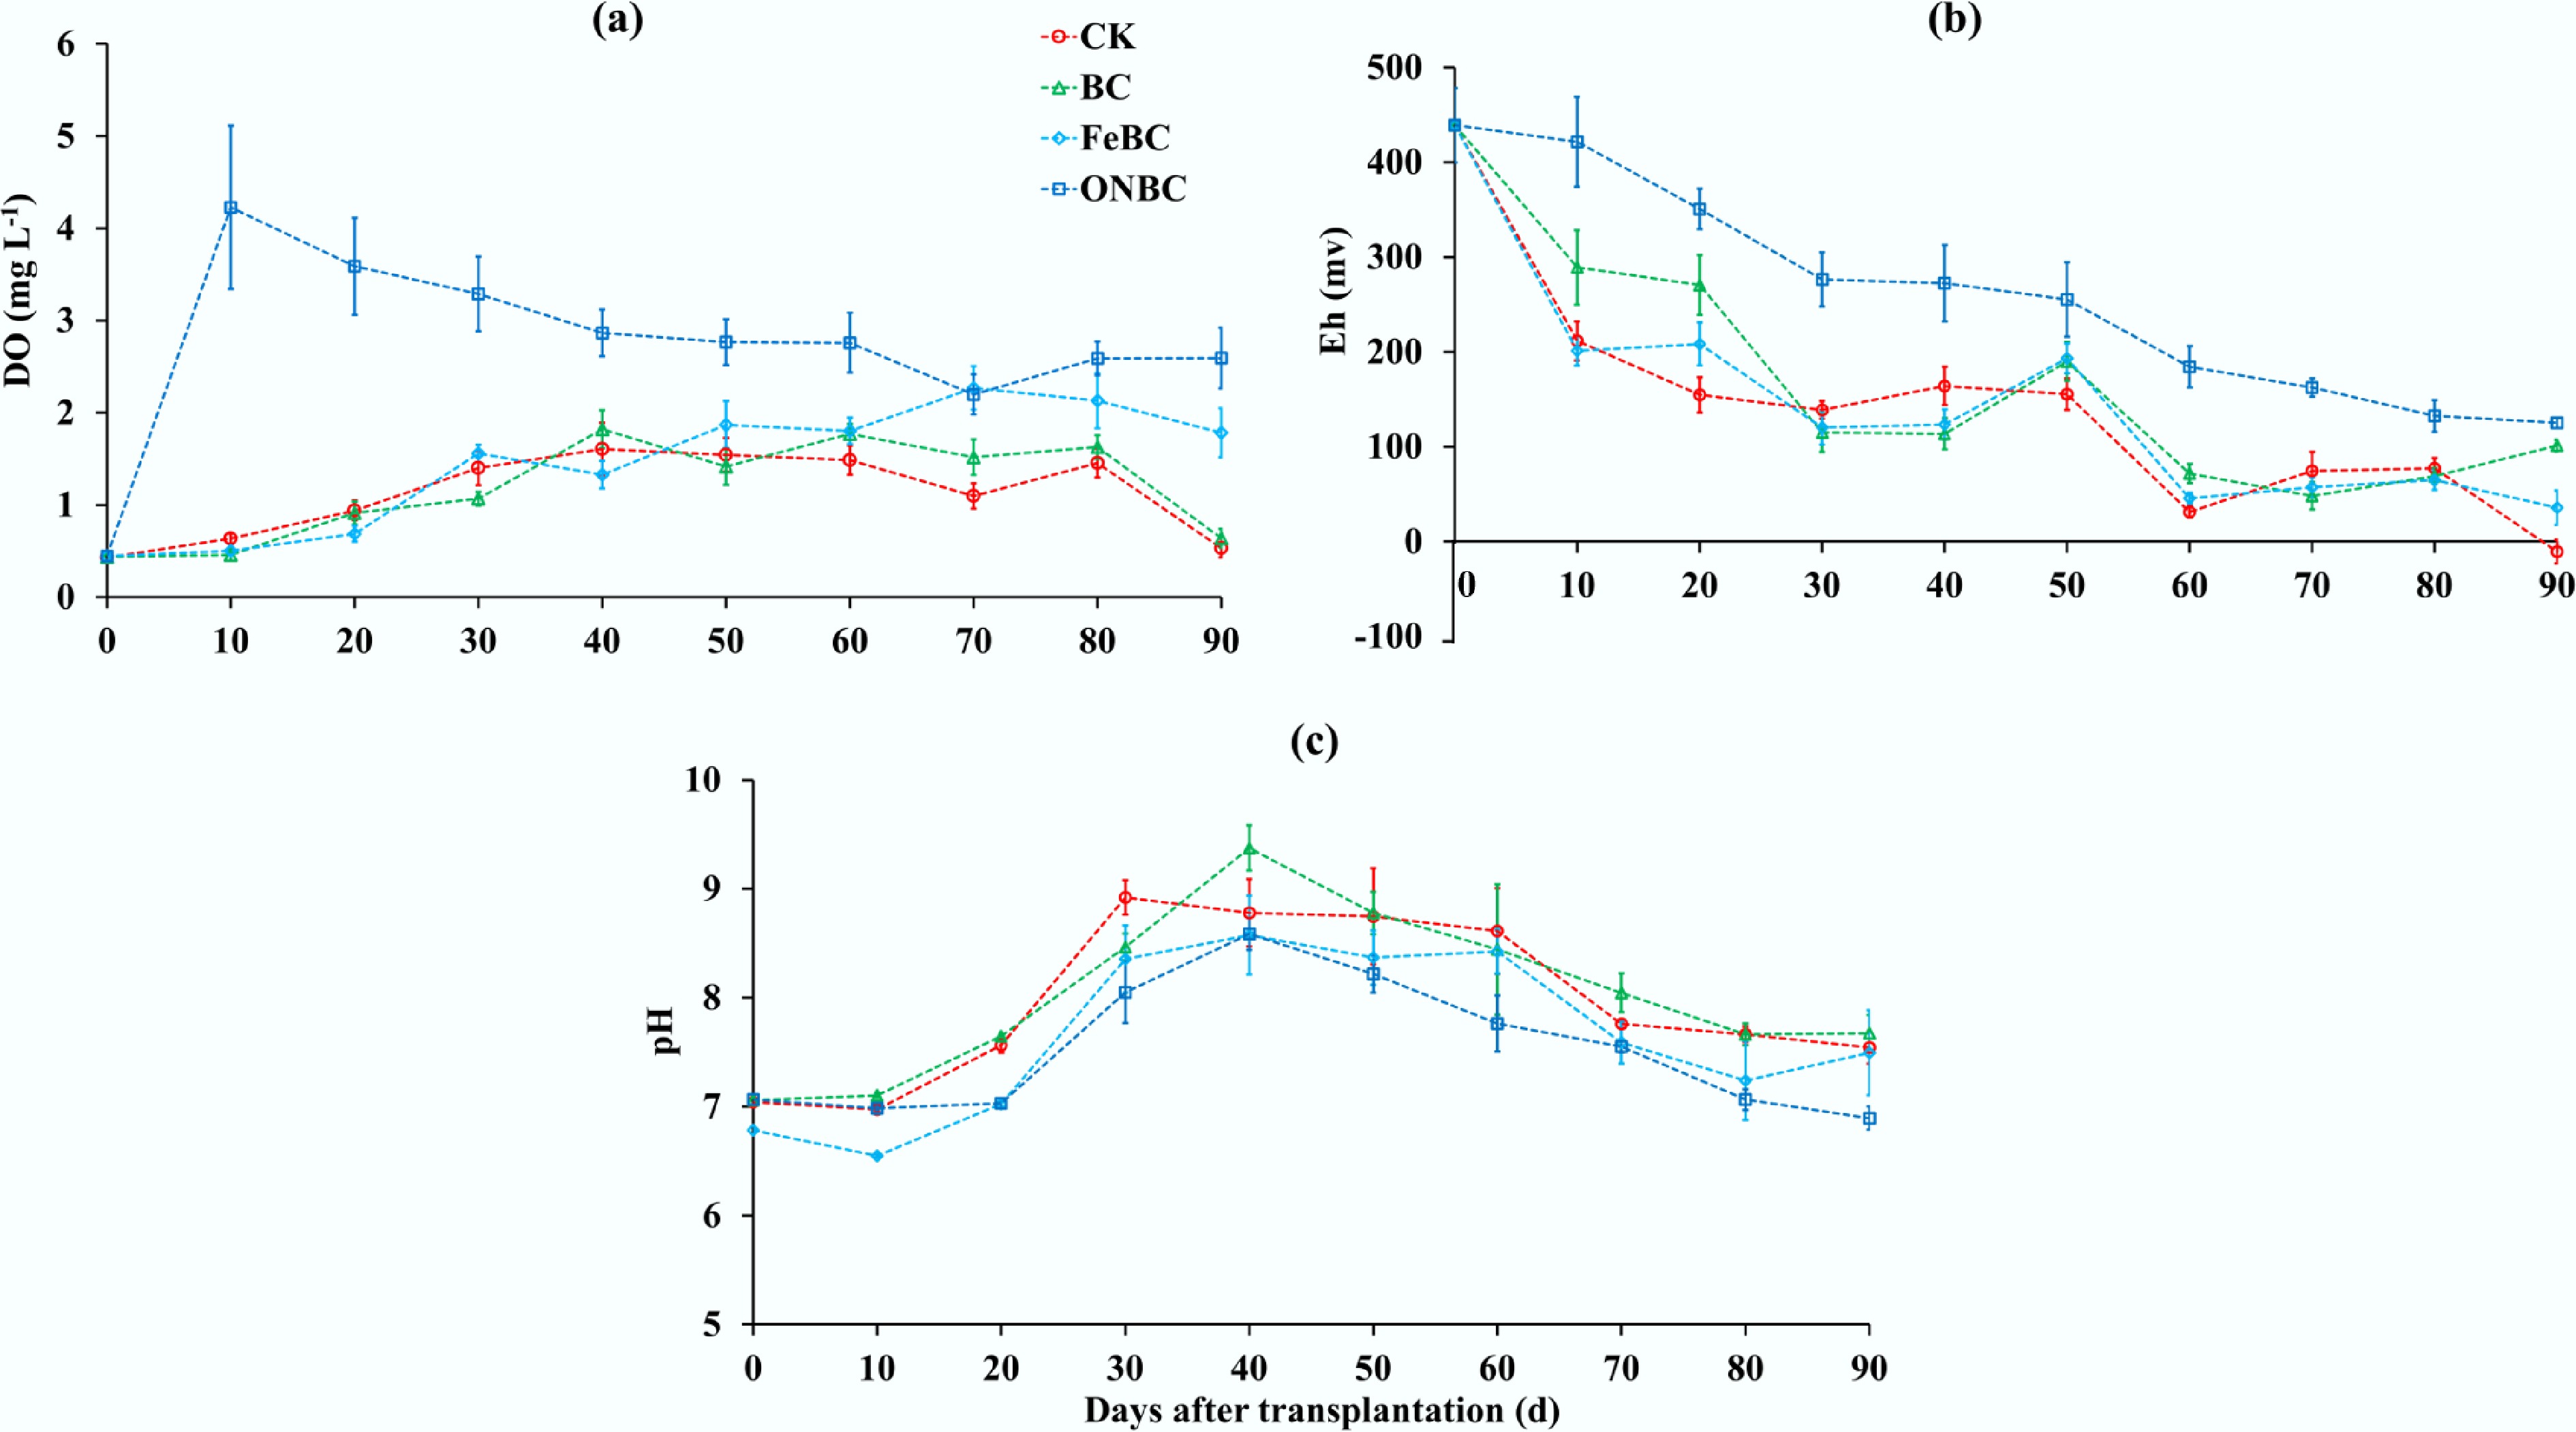
Figure 1.
Effects of different biochar amendments on the flooded rhizosphere environment during rice cultivation. (a) Dissolved oxygen (DO) concentration in overlying water; (b) rhizosphere redox potential (Eh); and (c) soil pH. Data are shown as mean ± standard error (n = 4). CK: control without amendment; BC: pristine biochar at 1% (w/w); FeBC: iron-loaded biochar at 1% (w/w); ONBC: oxygen-nanobubble-loaded biochar at 1% (w/w).
-
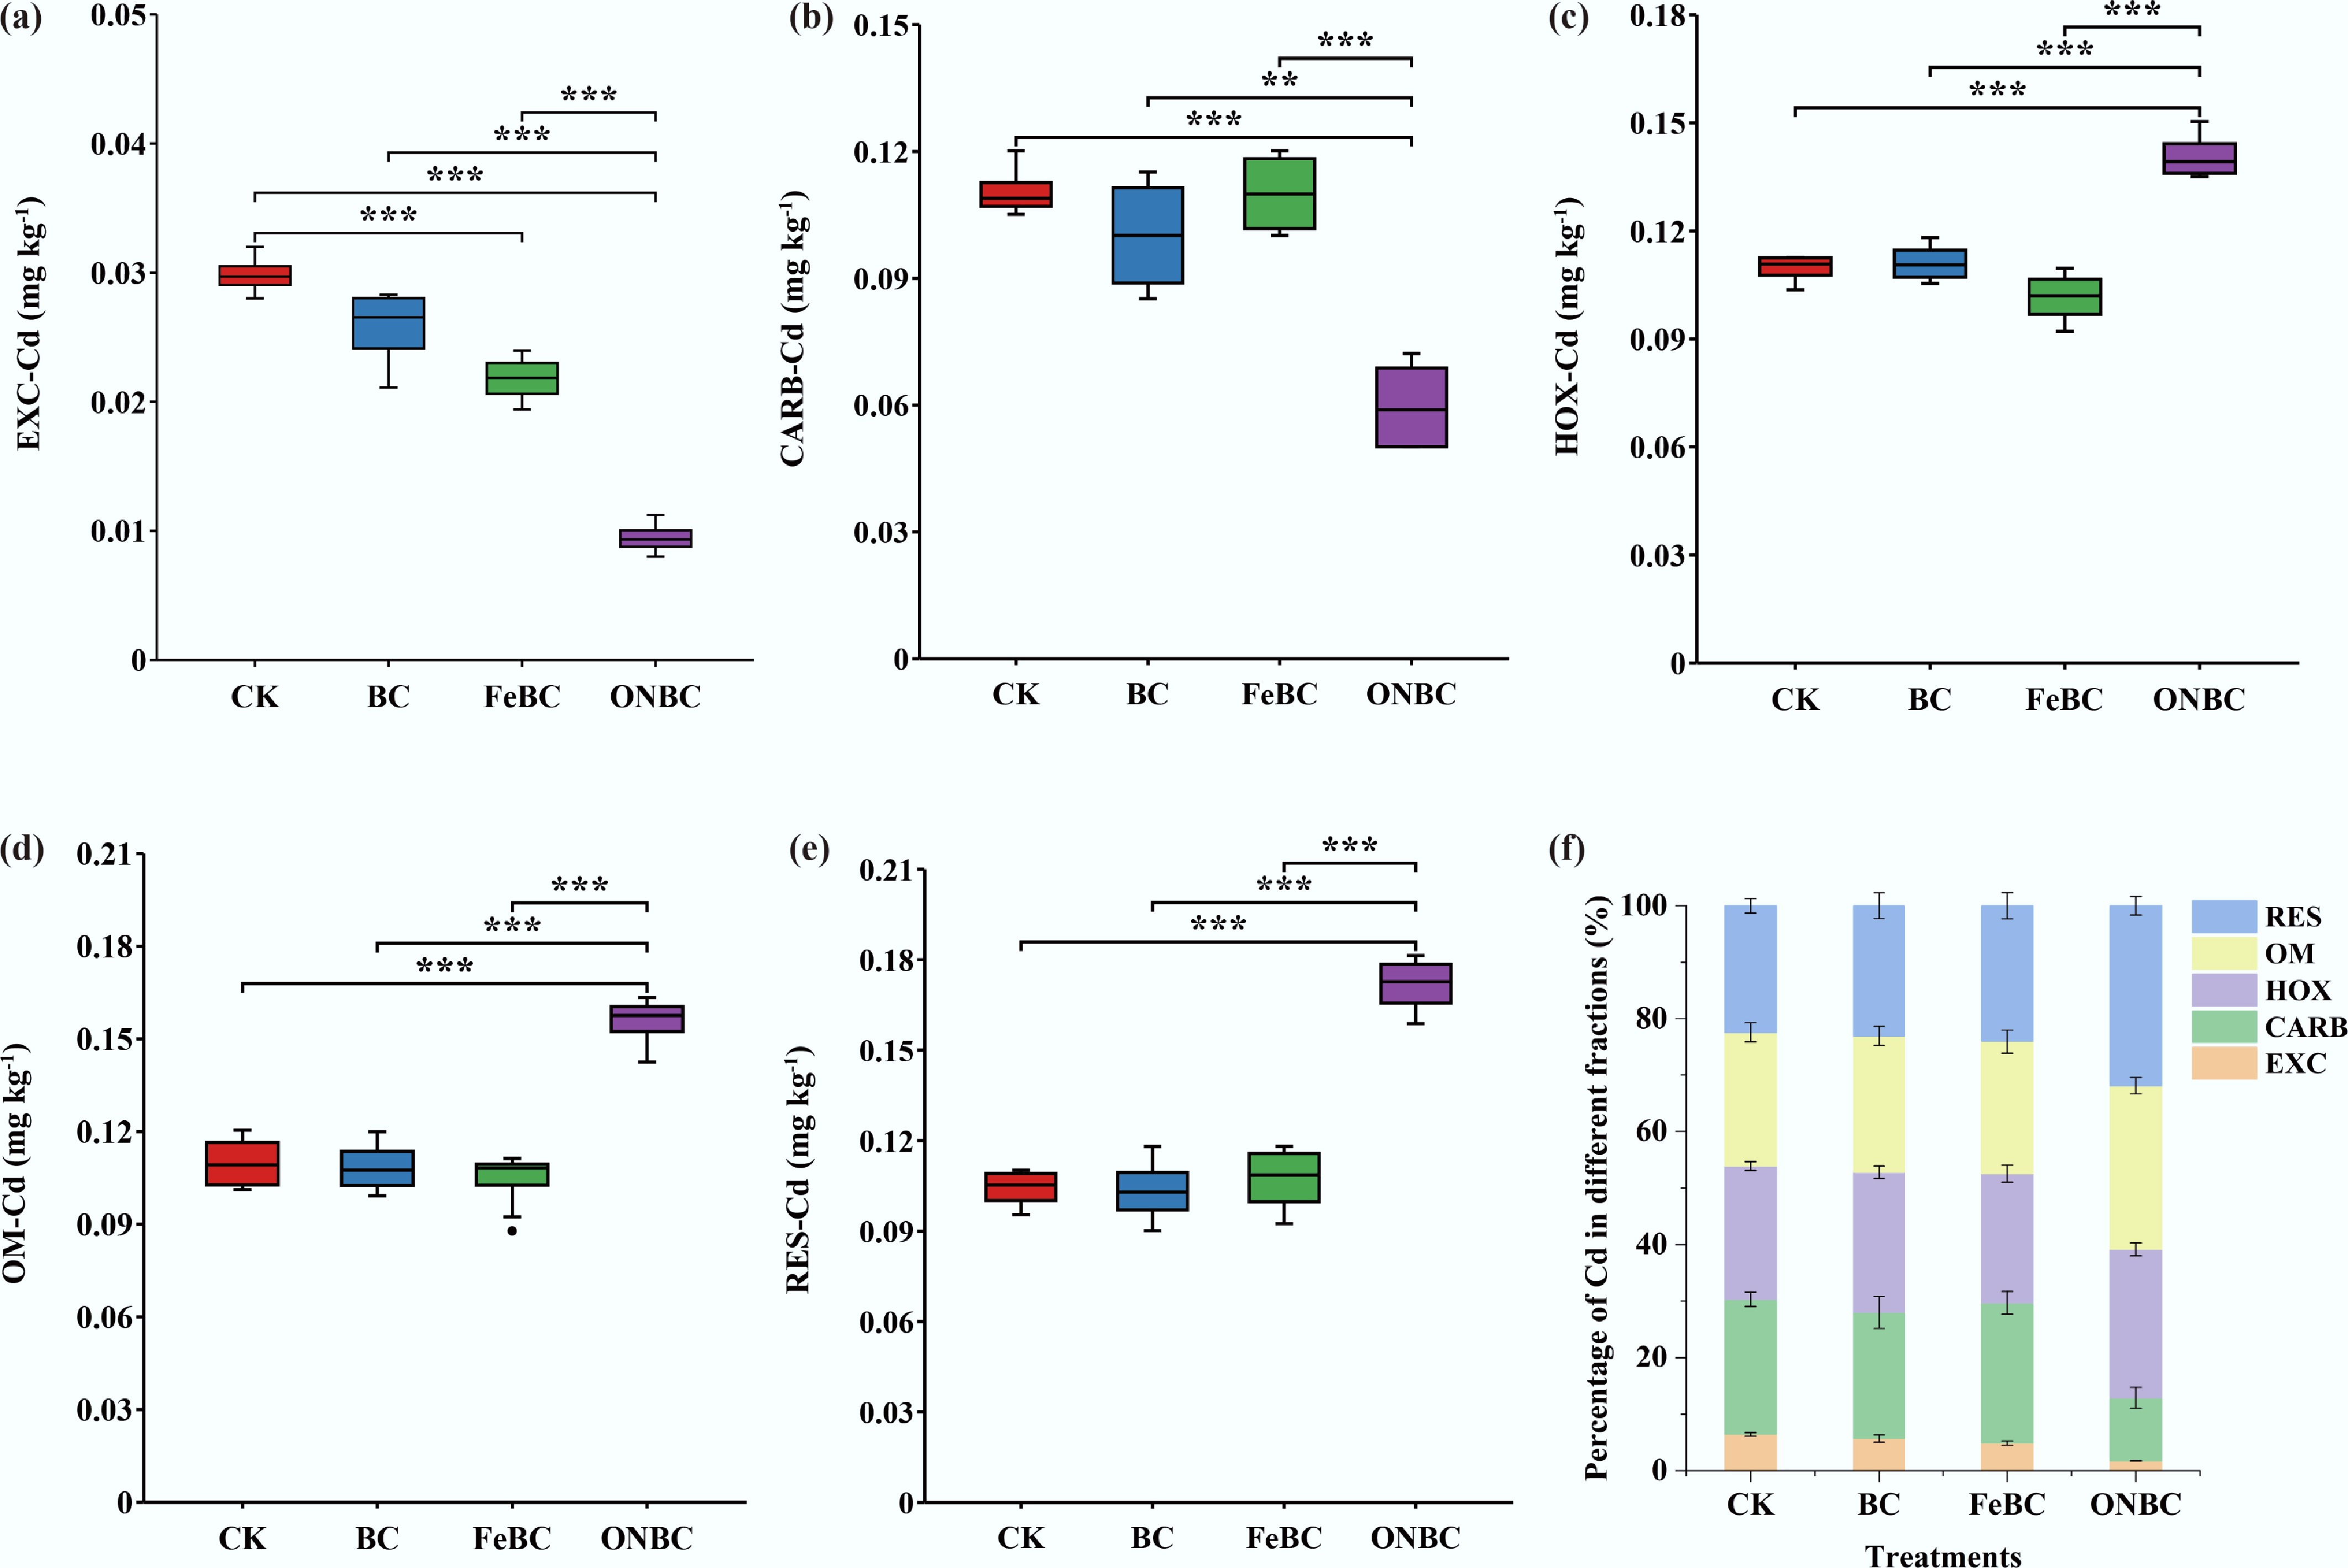
Figure 2.
Effects of ONBC and FeBC amendment on soil Cd speciation: (a) exchangeable Cd (EXC); (b) carbonate-bound Cd (CARB); (c) Fe/Mn (hydr)oxides-bound Cd (HOX); (d) organic matter-bound Cd (OM); (e) residual Cd (RES); and (f) proportion of different Cd fractions in soil. Data are means ± SE (n = 4). Asterisks indicate significant differences (*** p < 0.001, ** p < 0.01, * p < 0.05). CK: control; BC: biochar; FeBC: iron-loaded biochar; ONBC: oxygen-nanobubble-loaded biochar.
-
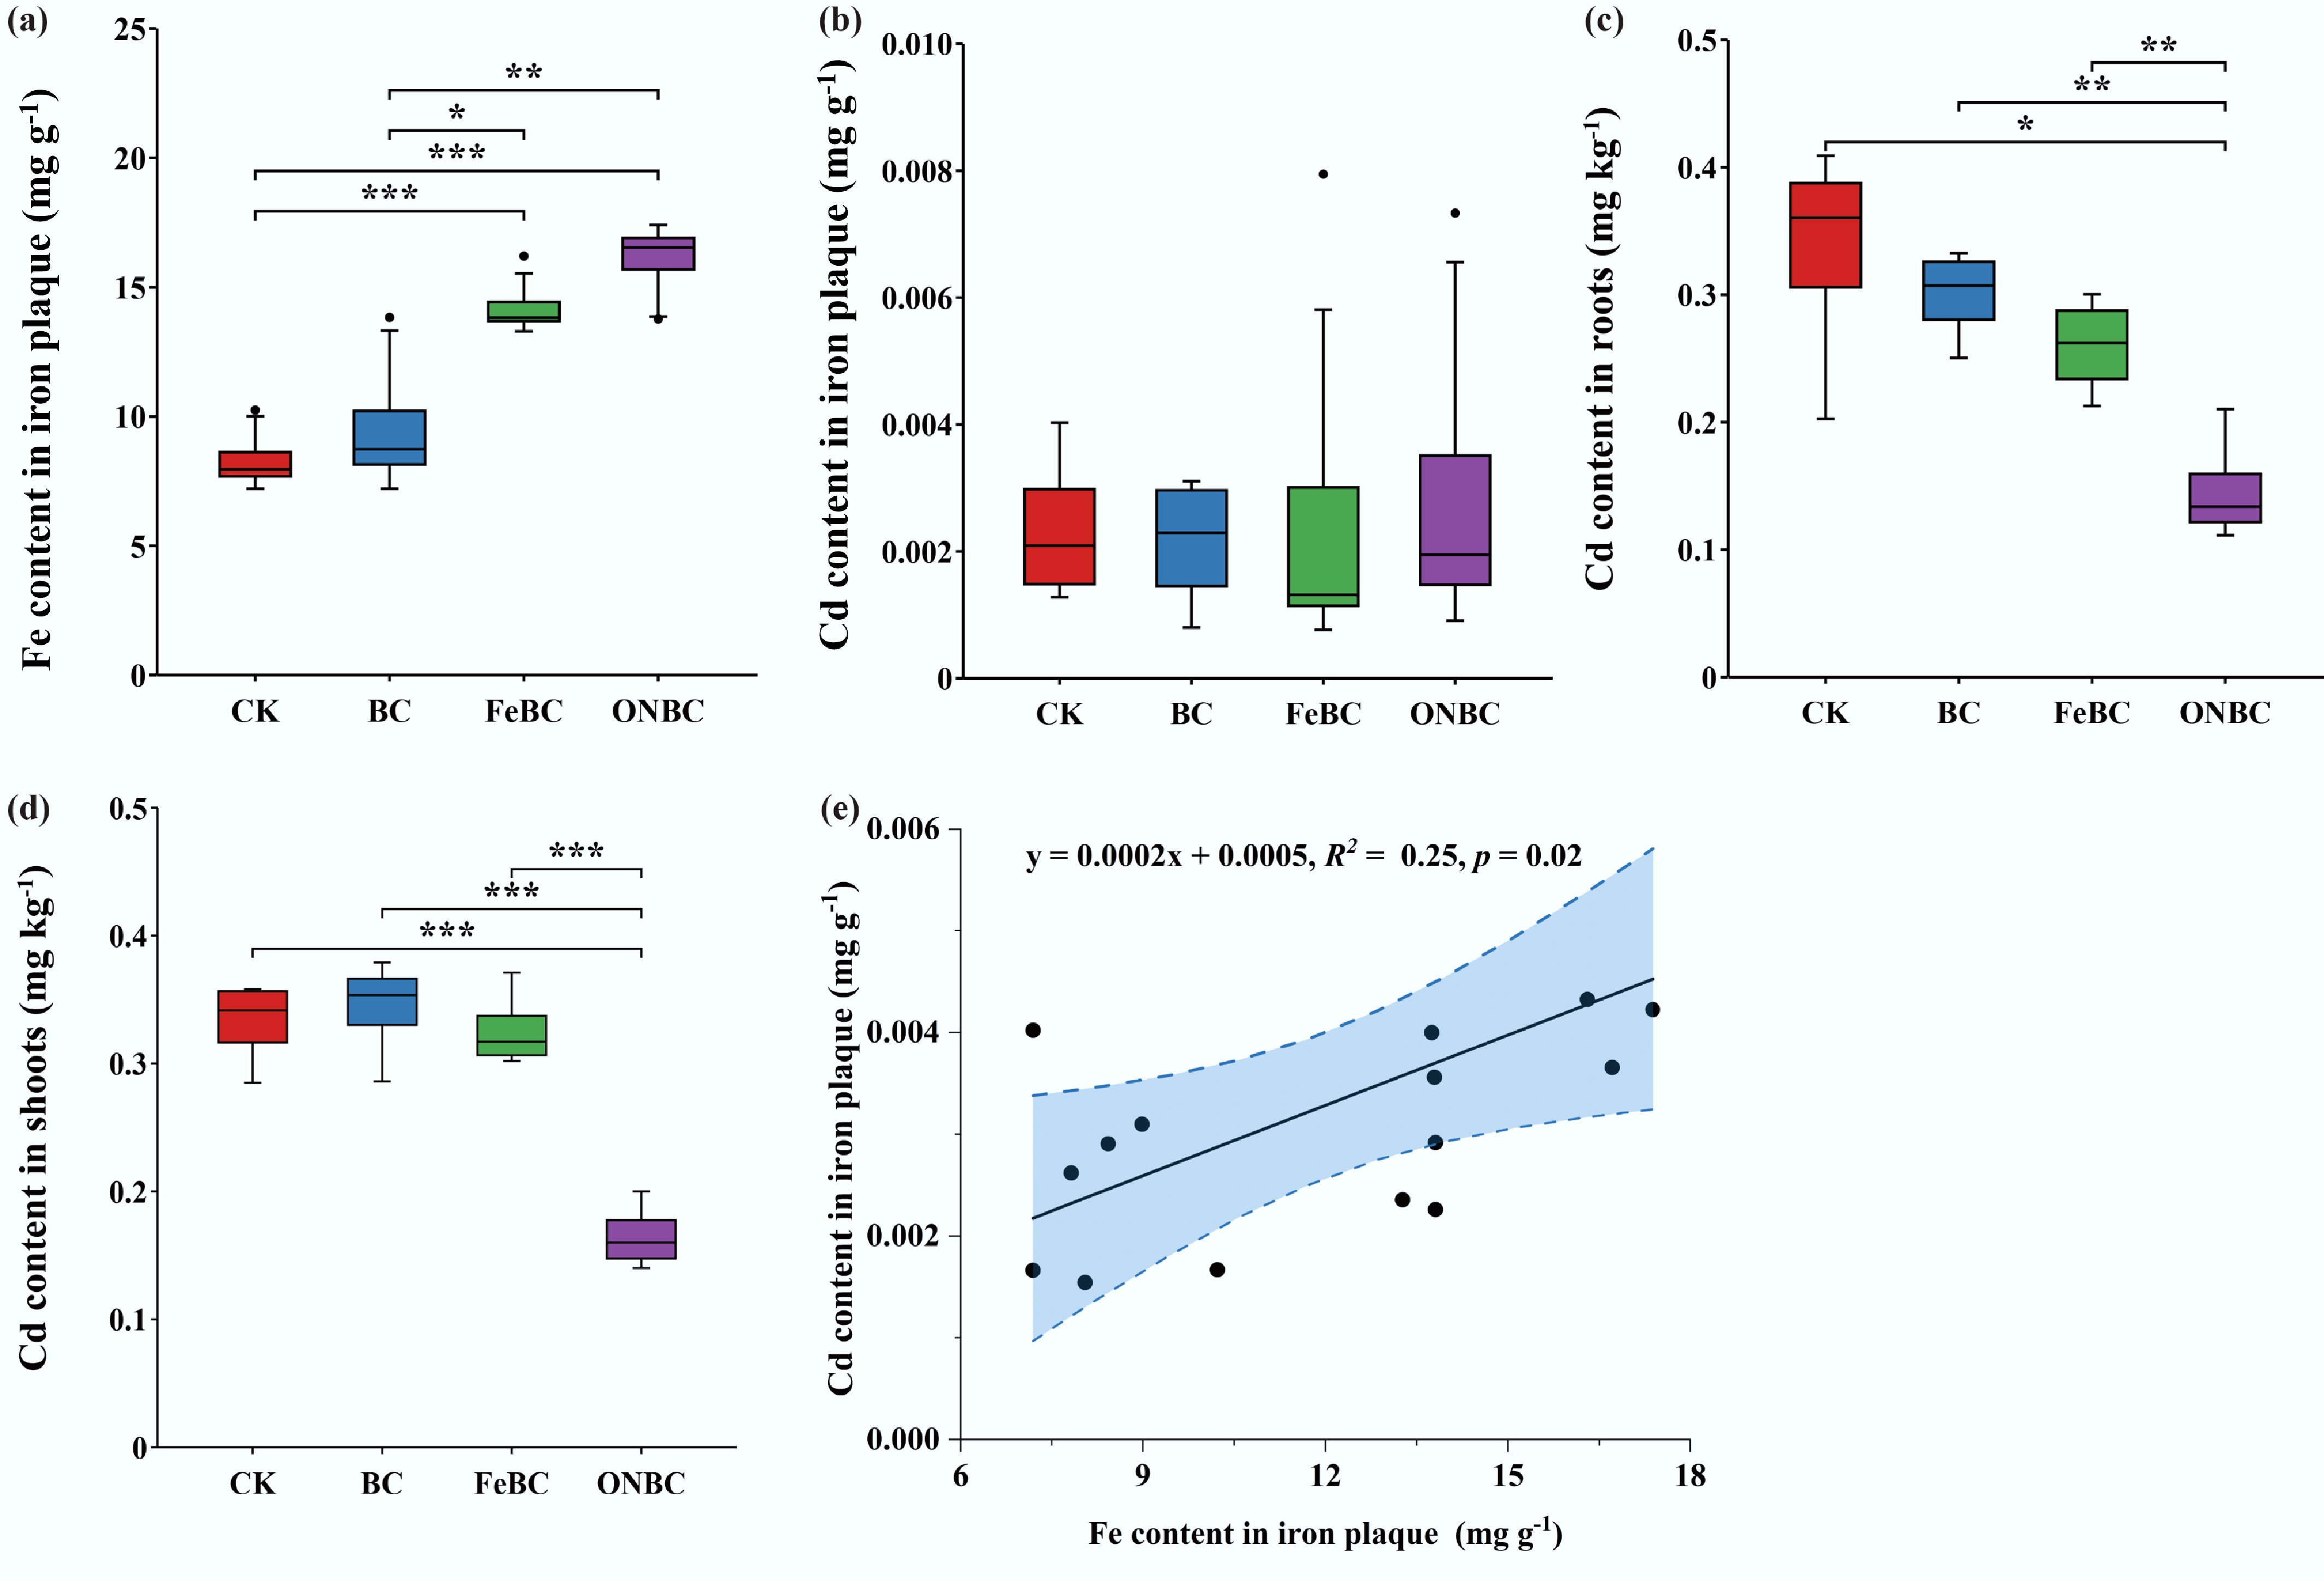
Figure 3.
Effects of the ONBC and FeBC amendment on iron plaque formation and Cd accumulation in rice plants: (a) Fe concentration in root iron plaque (extracted by dithionite−citrate−bicarbonate); (b) Cd content in root iron plaque; (c) Cd concentration in roots; (d) Cd concentration in shoots; (e) linear regression between Fe and Cd concentrations in root iron plaque. Data are presented as mean ± SE (n = 4). Asterisks indicate significant differences (*** p < 0.001, ** p < 0.01, * p < 0.05). CK: control; BC: biochar; FeBC: iron-loaded biochar; ONBC: oxygen-nanobubble-loaded biochar.
-
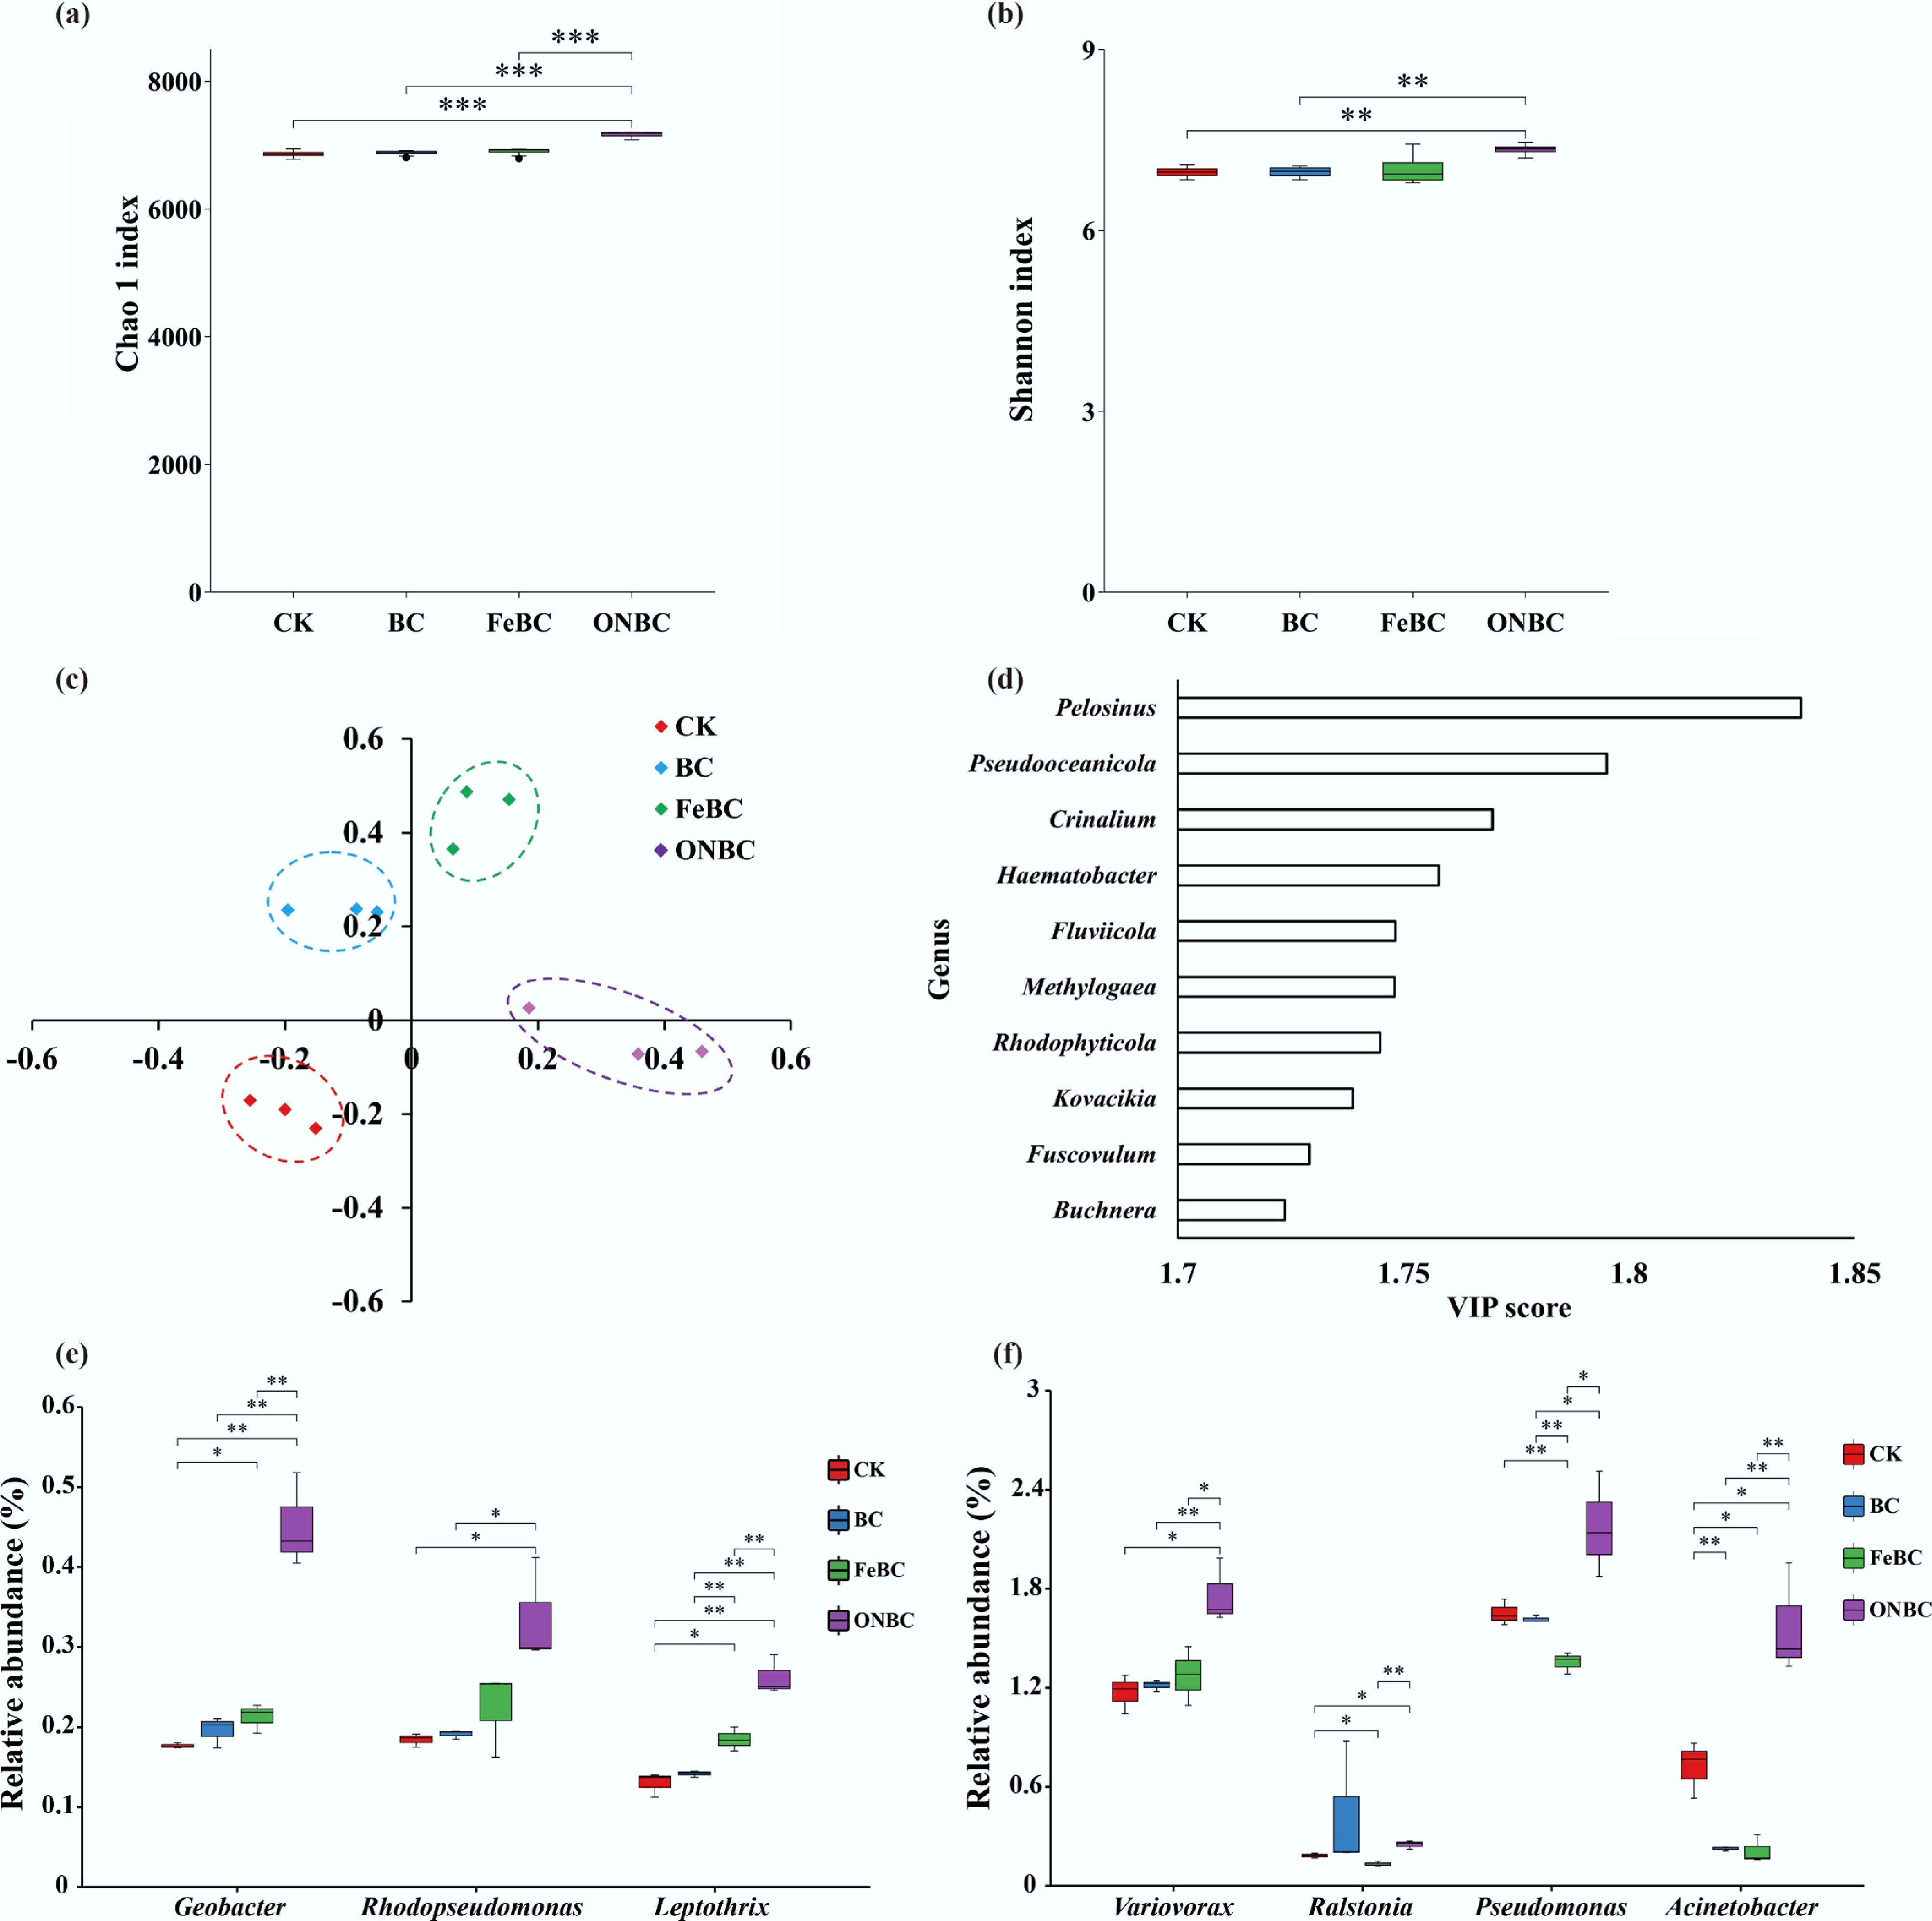
Figure 4.
Effects of the ONBC and FeBC amendments on soil bacterial community diversity and structure: (a) Chao1 index; (b) Shannon index; (c) OPLS-DA loading plot; (d) variable importance in projection (VIP) scores for the top 10 genera; (e) relative abundance of Fe -oxidizing genera; and (f) relative abundance of Mn-oxidizing genera. Data are mean ± SE (n = 4). Asterisks indicate significant differences (*** p < 0.001, ** p < 0.01, * p < 0.05). CK: control; BC: biochar; FeBC: iron-loaded biochar; ONBC: oxygen-nanobubble-loaded biochar.
-
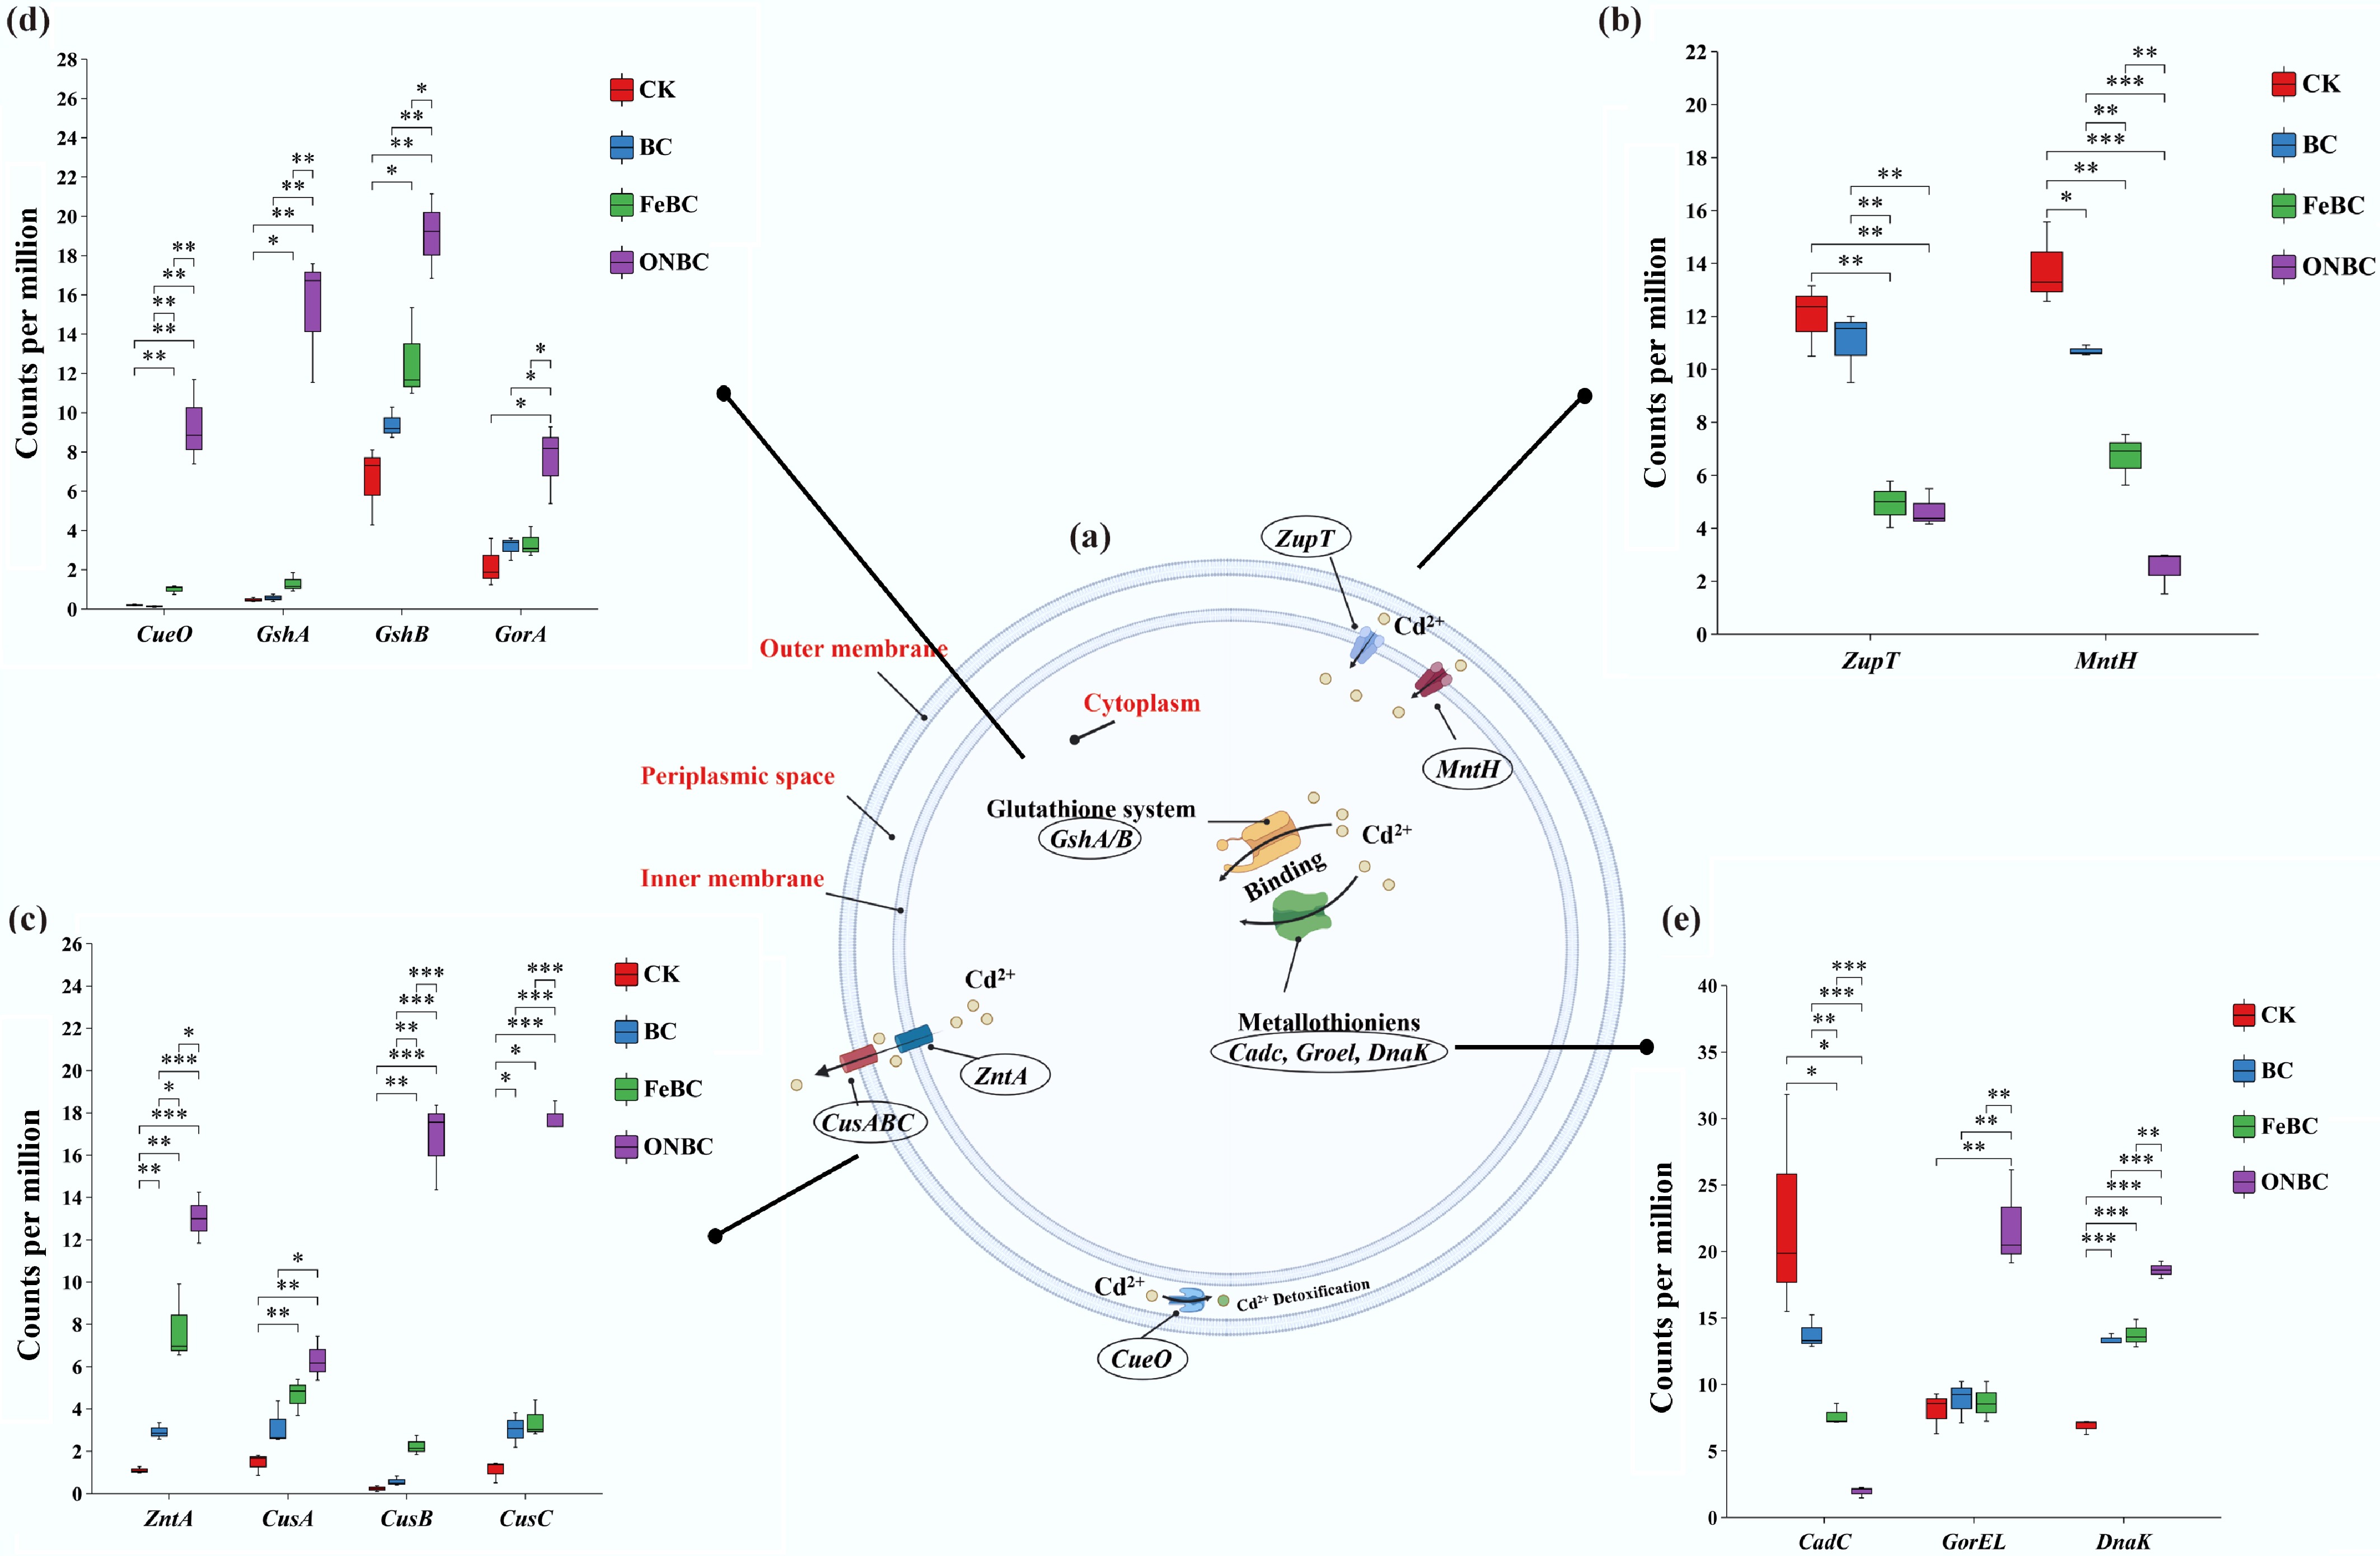
Figure 5.
Effects of different biochar amendments on bacterial genes involved in Cd2+ stabilization and detoxification pathways. (a) Schematic overview of bacterial Cd2+ stabilization pathways. The panels are organized from the overall pathway to membrane transport processes and then intracellular detoxification/stress-response processes. (b) Cd2+ influx transporter genes, including ZupT and MntH. (c) Cd2+ efflux transporter genes, including ZntA, CusA, CusB, and CusC. (d) Cytoplasmic Cd2+ detoxification genes, including CueO, GshA, GshB, and GorA. (e) Cd2+ sensing and binding genes, including CadC, CusA, CusB, GroEL, and DnaK. Data are shown as mean ± standard error. Asterisks indicate significant differences among treatments (* p < 0.05, ** p < 0.01, *** p < 0.001). CK: control without amendment; BC: pristine biochar; FeBC: iron-loaded biochar; ONBC: oxygen-nanobubble-loaded biochar.
-
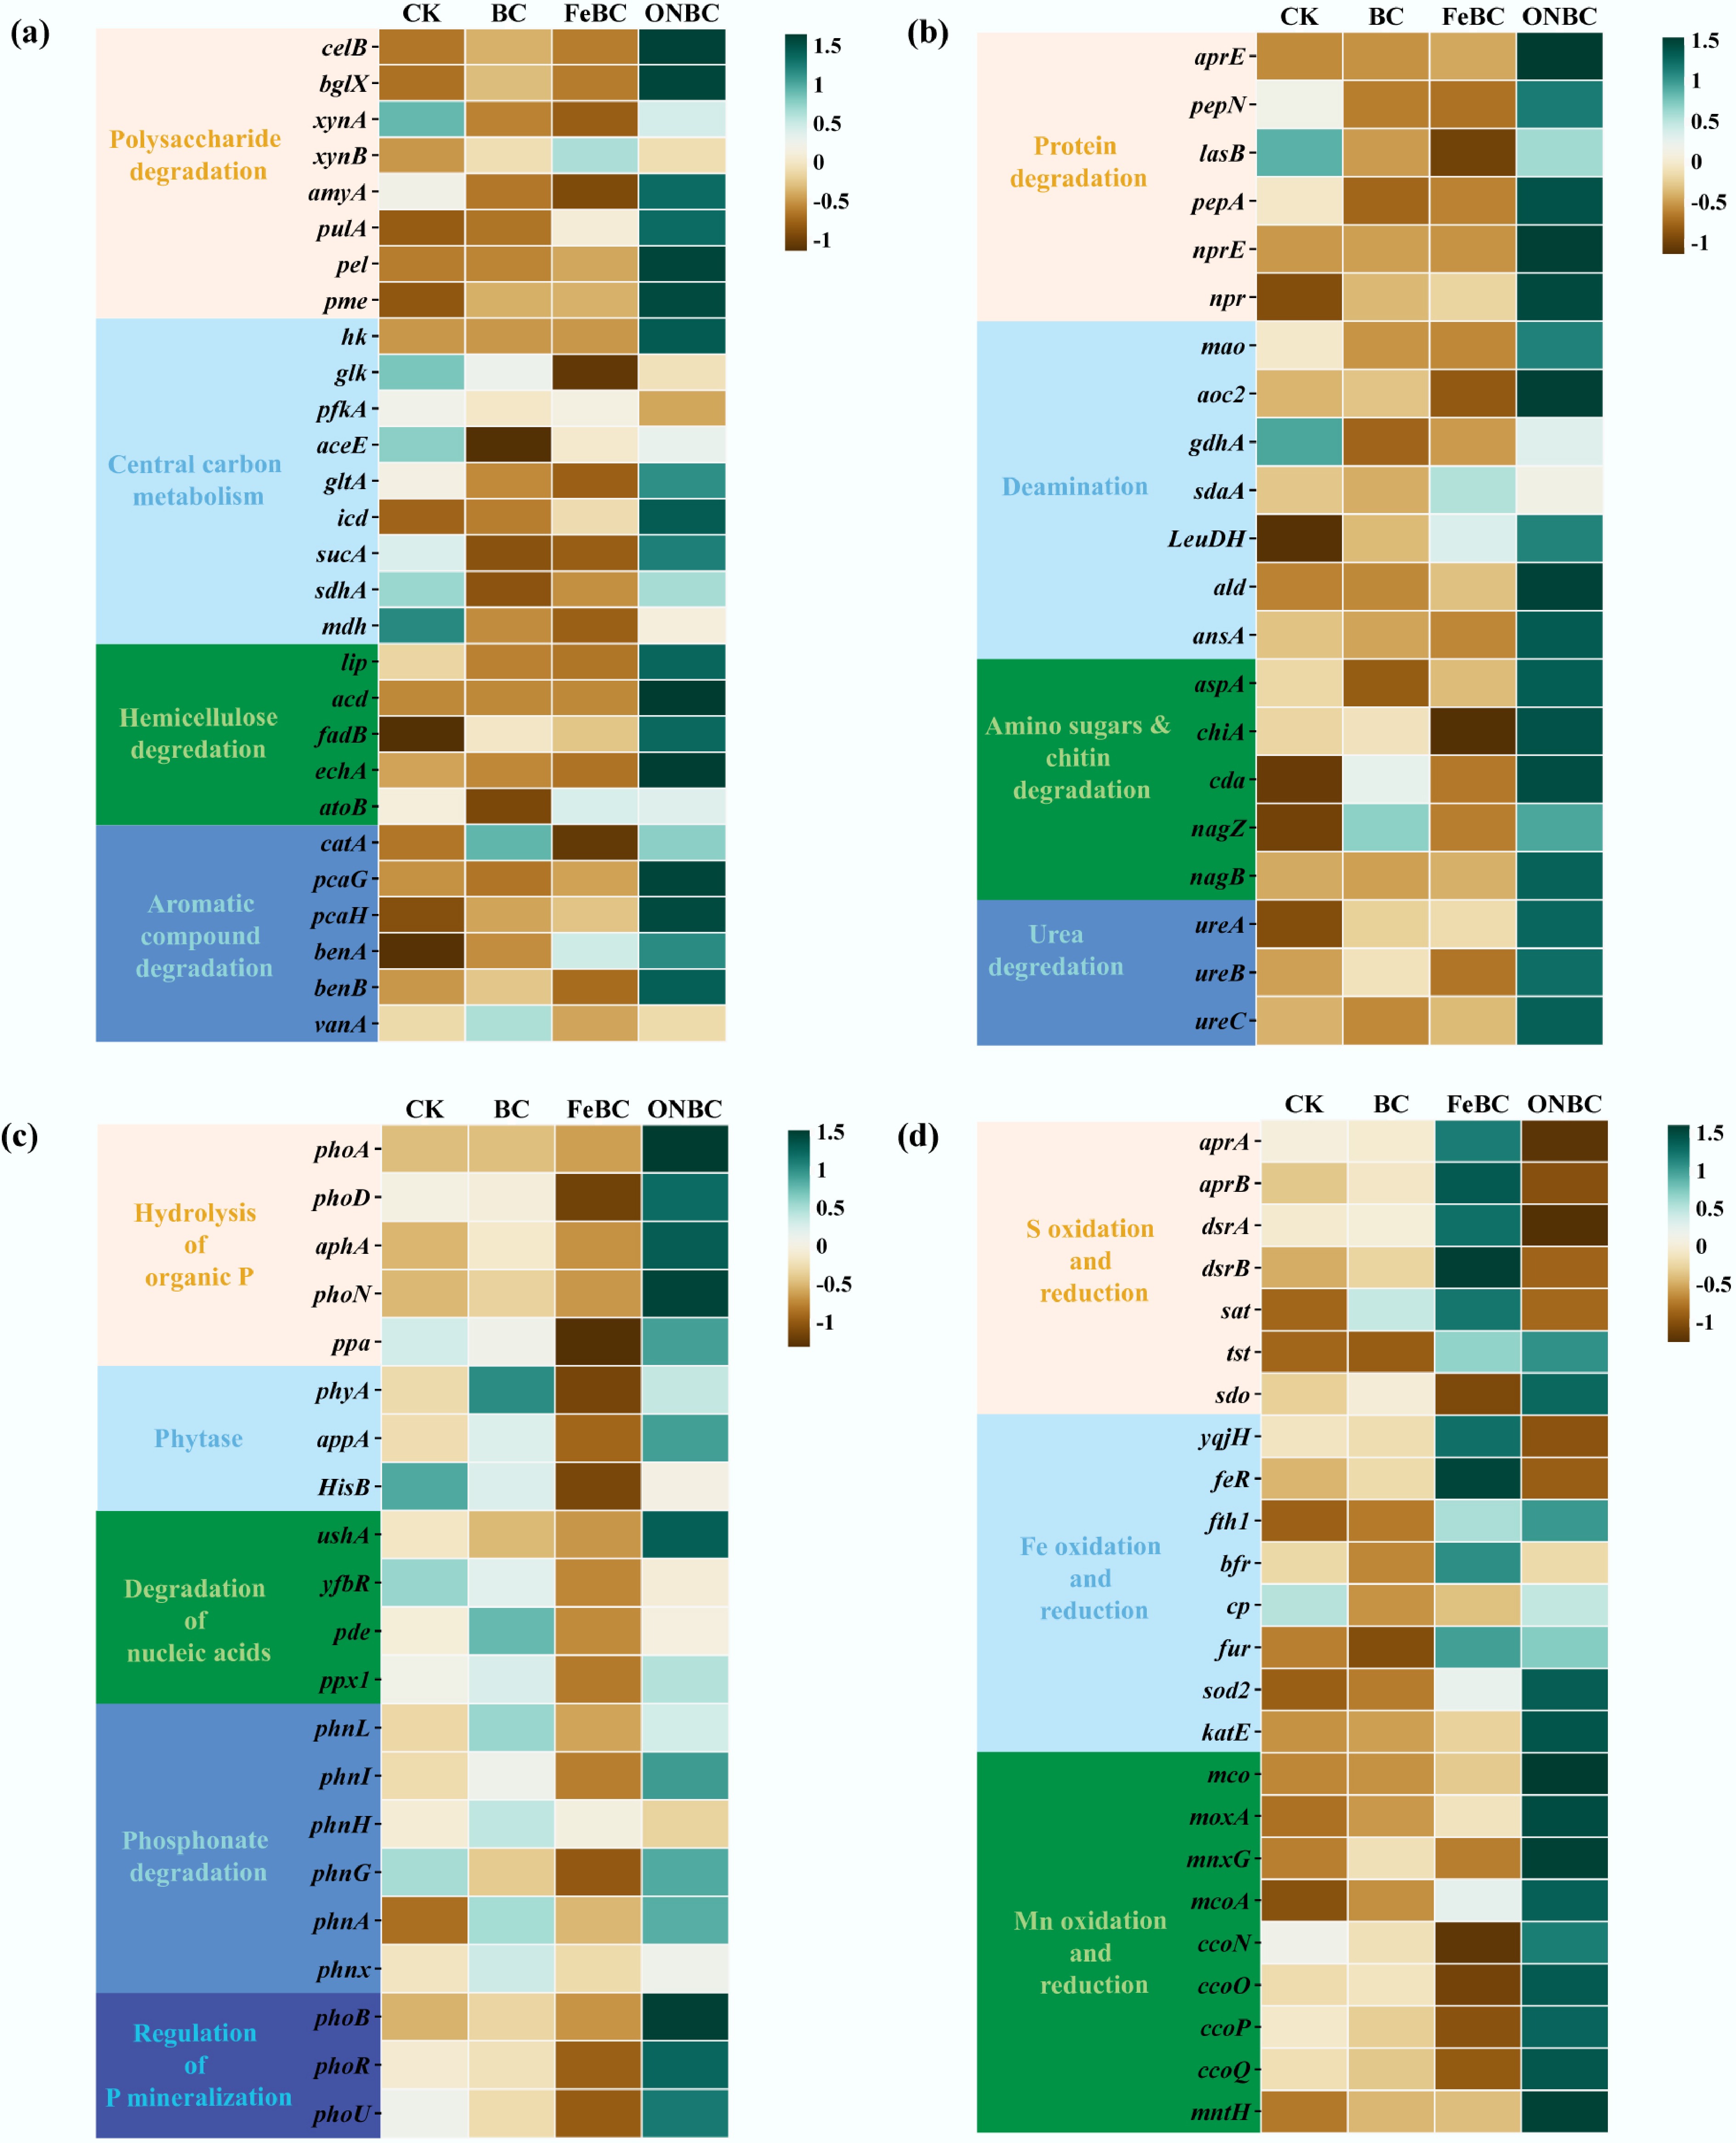
Figure 6.
Heatmap of differentially abundant microbial functional genes in paddy soils in response to FeBC and ONBC amendments. Functional genes are grouped into four categories: (a) C mineralization; (b) N mineralization; (c) P mineralization; and (d) Fe–S–Mn redox cycling. Relative abundances are shown as z-score-normalized counts per million (CPM) from metagenomic analysis. Gene abbreviations correspond to full names and EC numbers listed in Supplementary Tables S3–S7. CK: control; BC: biochar; FeBC: iron-loaded biochar; ONBC: oxygen-nanobubble-loaded biochar.
-

Figure 7.
Effects of the ONBC and FeBC on rice plant growth performance: (a) photographs at harvest; (b) plant height; (c) fresh weight of whole plant; (d) root diameter, and (e) root volume. Data are mean ± SE (n = 4). Asterisks denote significance (*** p < 0.001, ** p < 0.01, * p < 0.05). CK: control; BC: biochar; FeBC: iron-loaded biochar; ONBC: oxygen-nanobubble-loaded biochar.
-
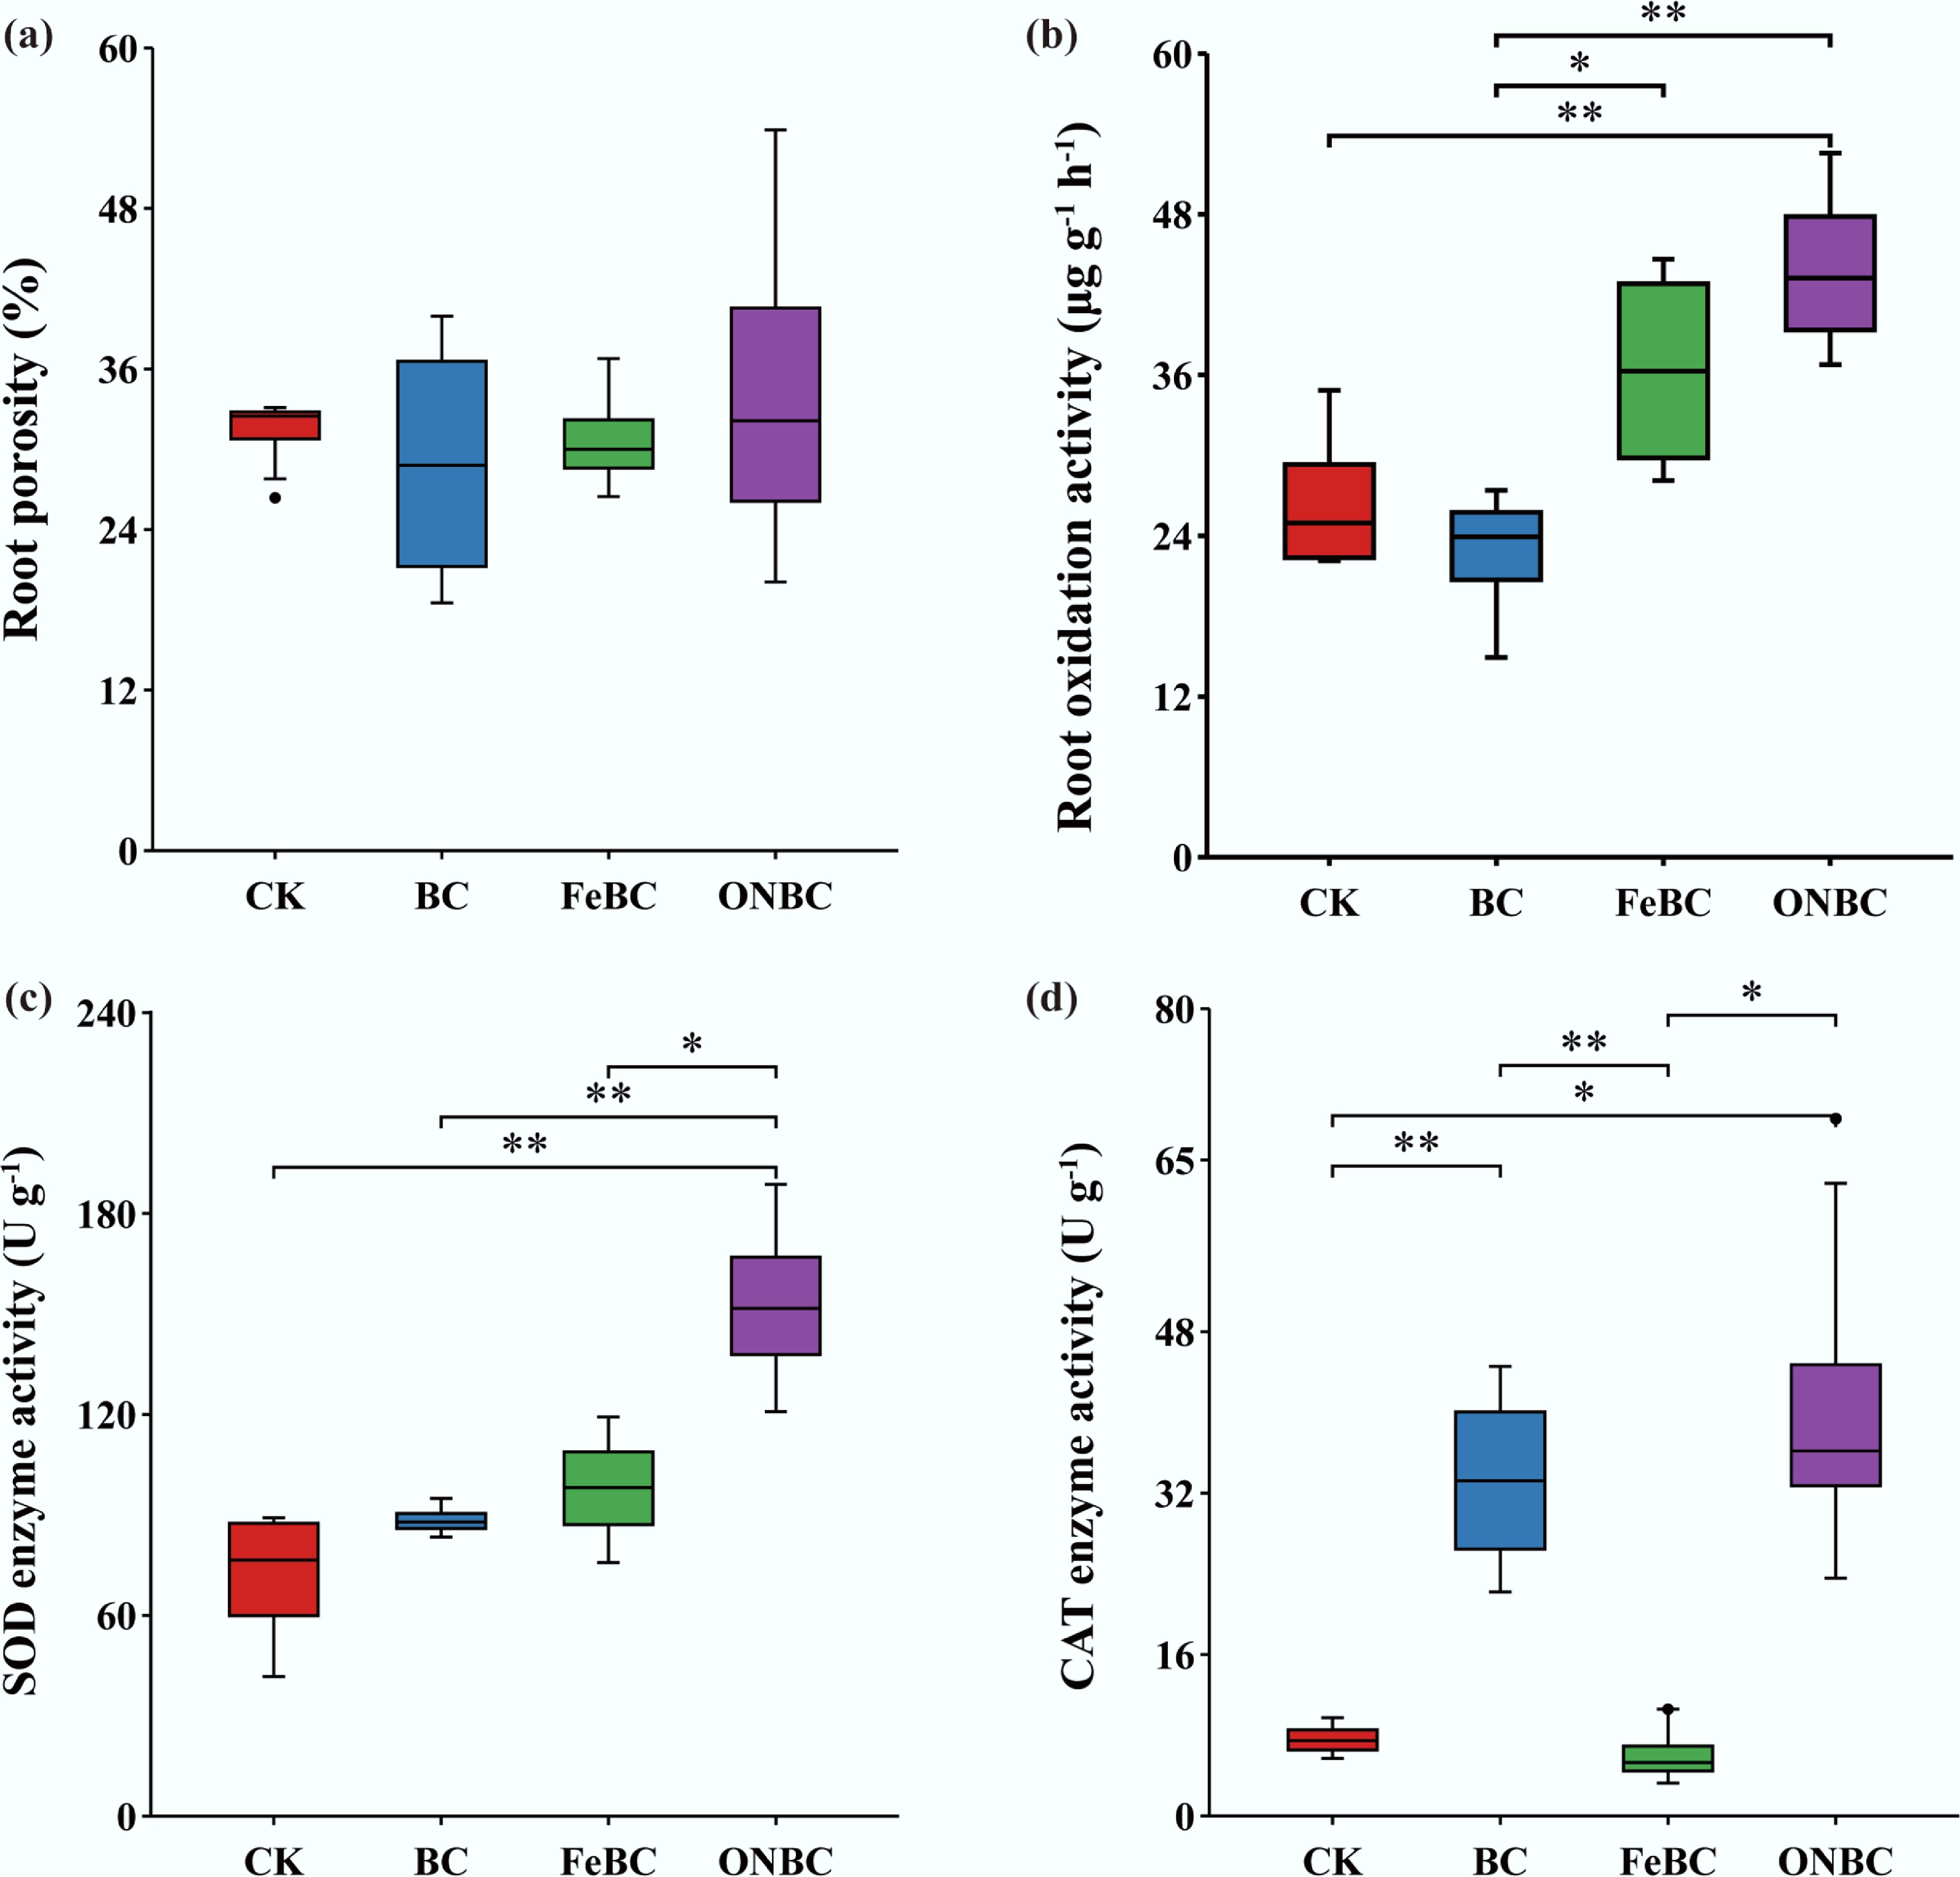
Figure 8.
Root physiological and biochemical responses of rice to ONBC and FeBC amendments: (a) root porosity; (b) root oxidative activity; (c) superoxide dismutase (SOD) activity; and (d) catalase (CAT) activity. Data are presented as mean ± SE (n = 4). Asterisks indicate significant differences (*** p < 0.001, ** p < 0.01, * p < 0.05). CK: control; BC: biochar; FeBC: iron-loaded biochar; ONBC: oxygen-nanobubble-loaded biochar.
-
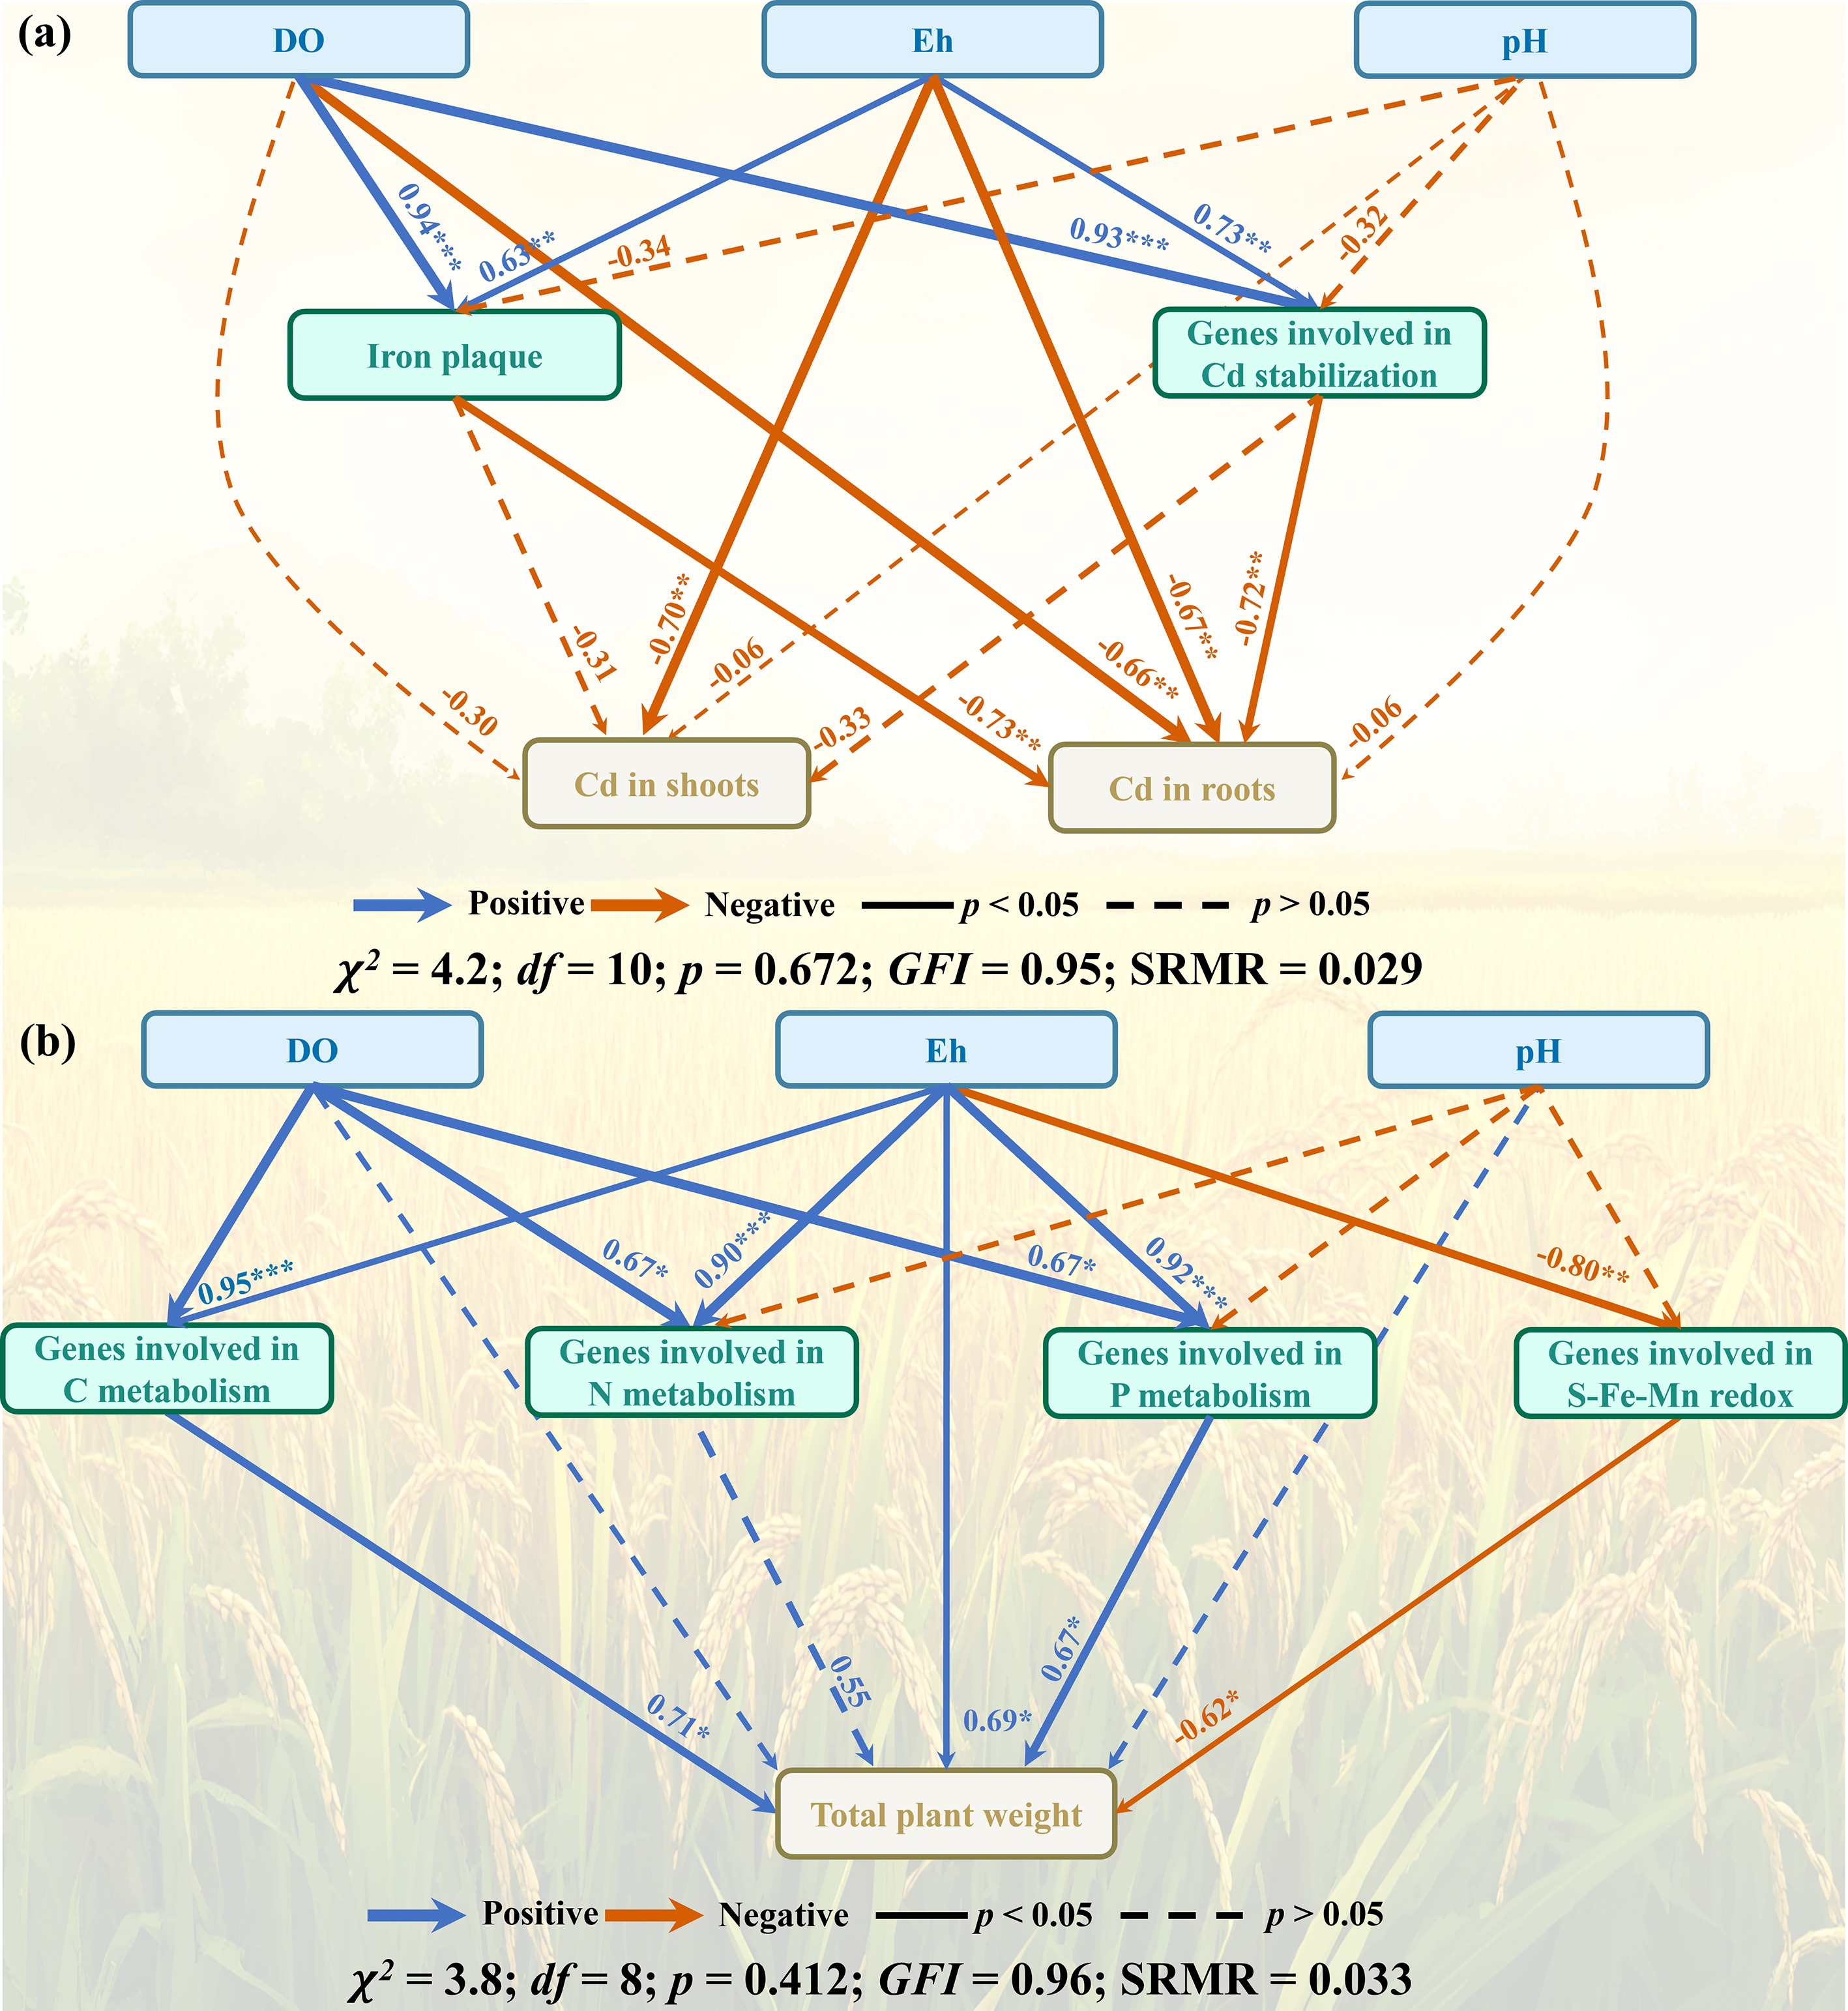
Figure 9.
SEM analysis illustrating the pathways by which ONBC influenced (a) Cd accumulation in rice plants, and (b) plant growth. Solid and dashed arrows indicate significant and nonsignificant relationships, respectively. Blue arrows indicate positive relationships and orange arrows indicate negative relationships. Numbers adjacent to arrows are path coefficients. Significance levels are * p < 0.05, ** p < 0.01, and *** p < 0.001. GFI: goodness-of-fit index; SRMR: standardized root mean squared residual.
Figures
(9)
Tables
(0)