-
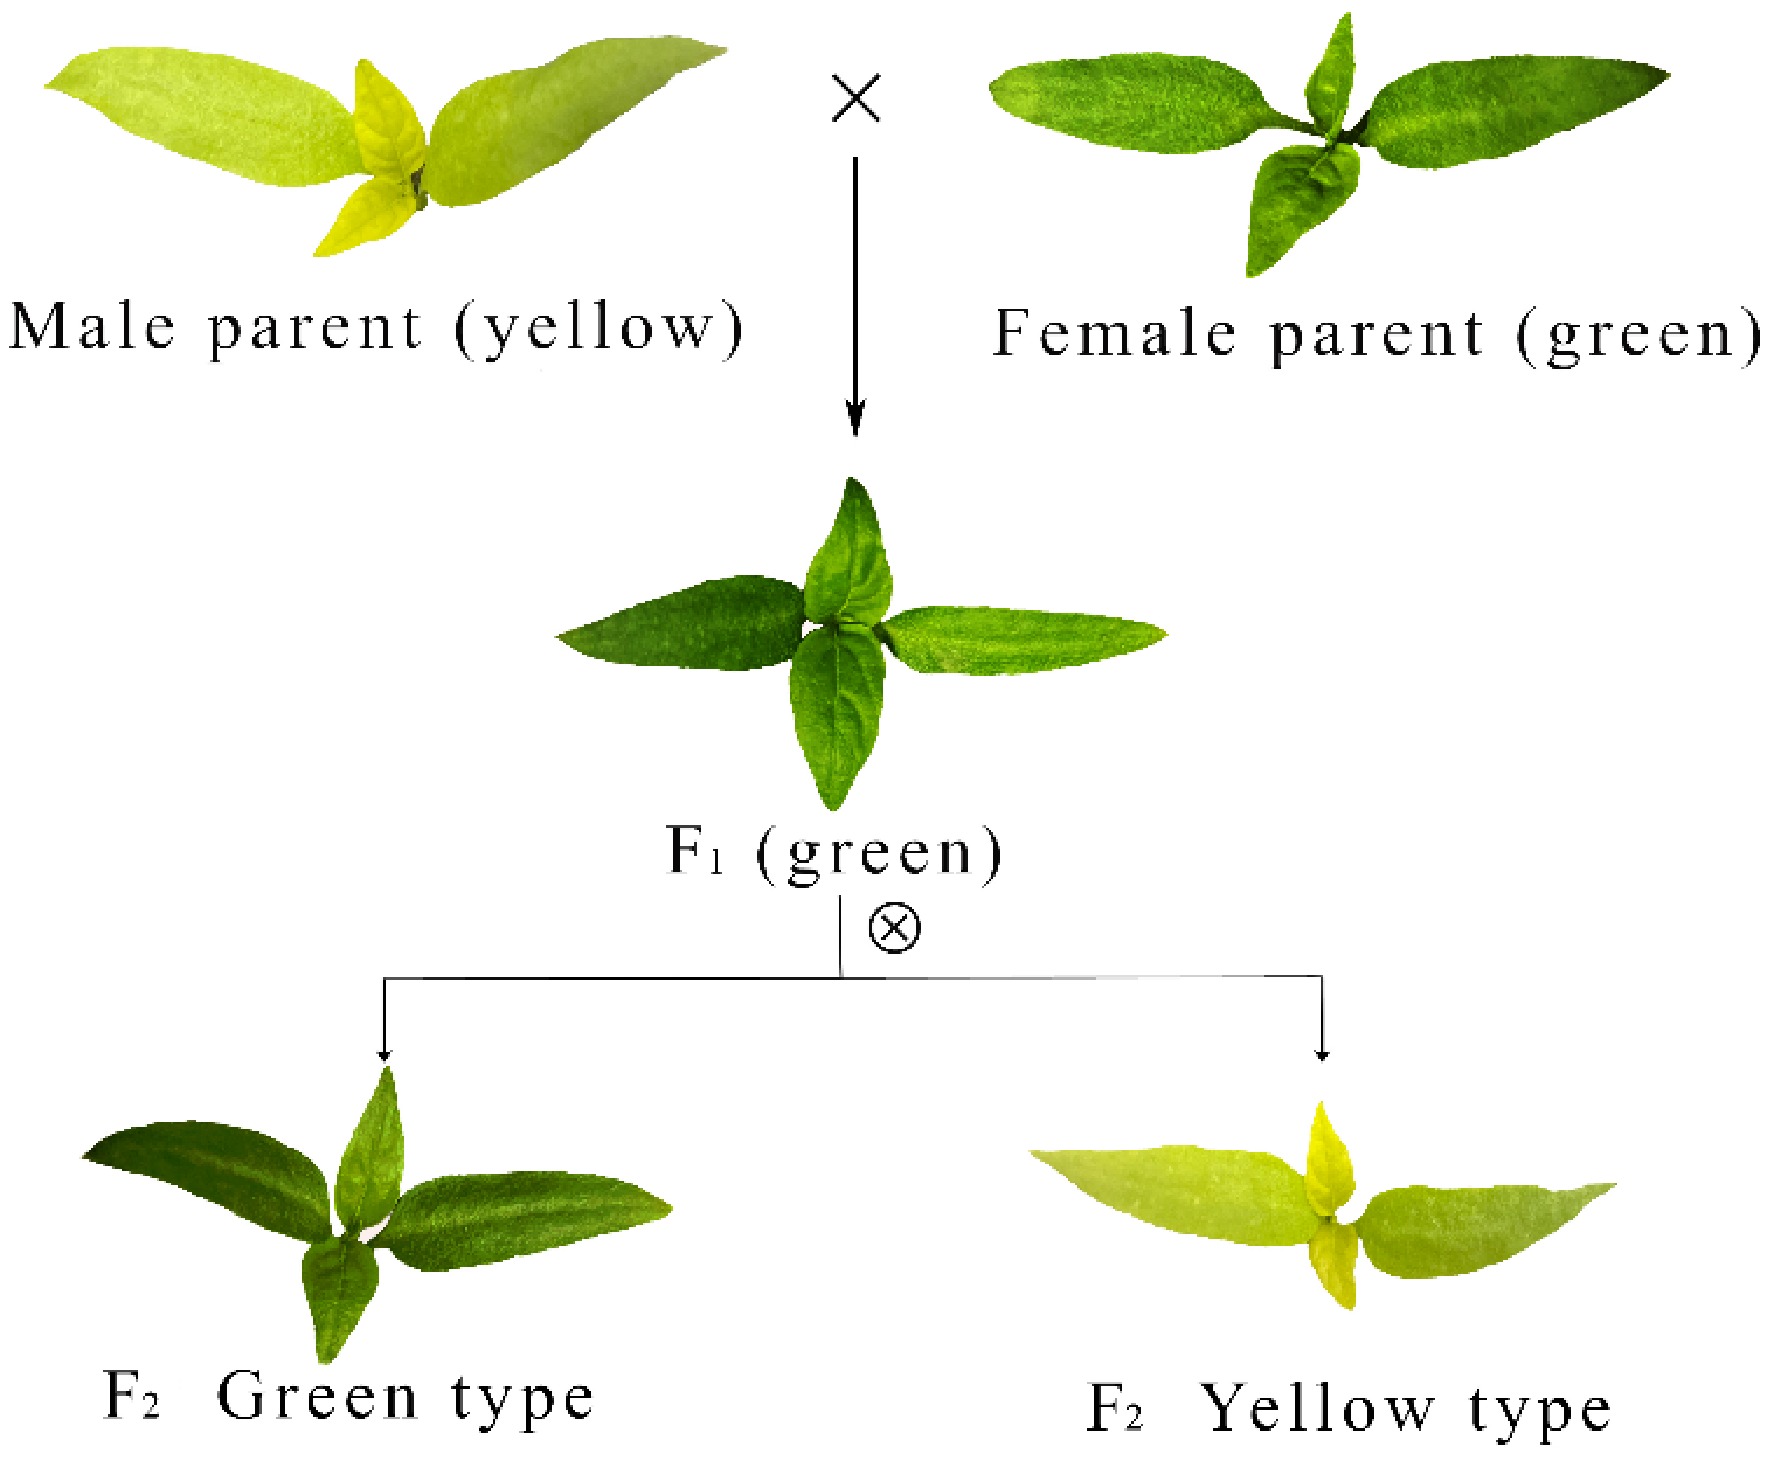
Figure 1.
Construction of the F2 segregating population and phenotype of pepper
-
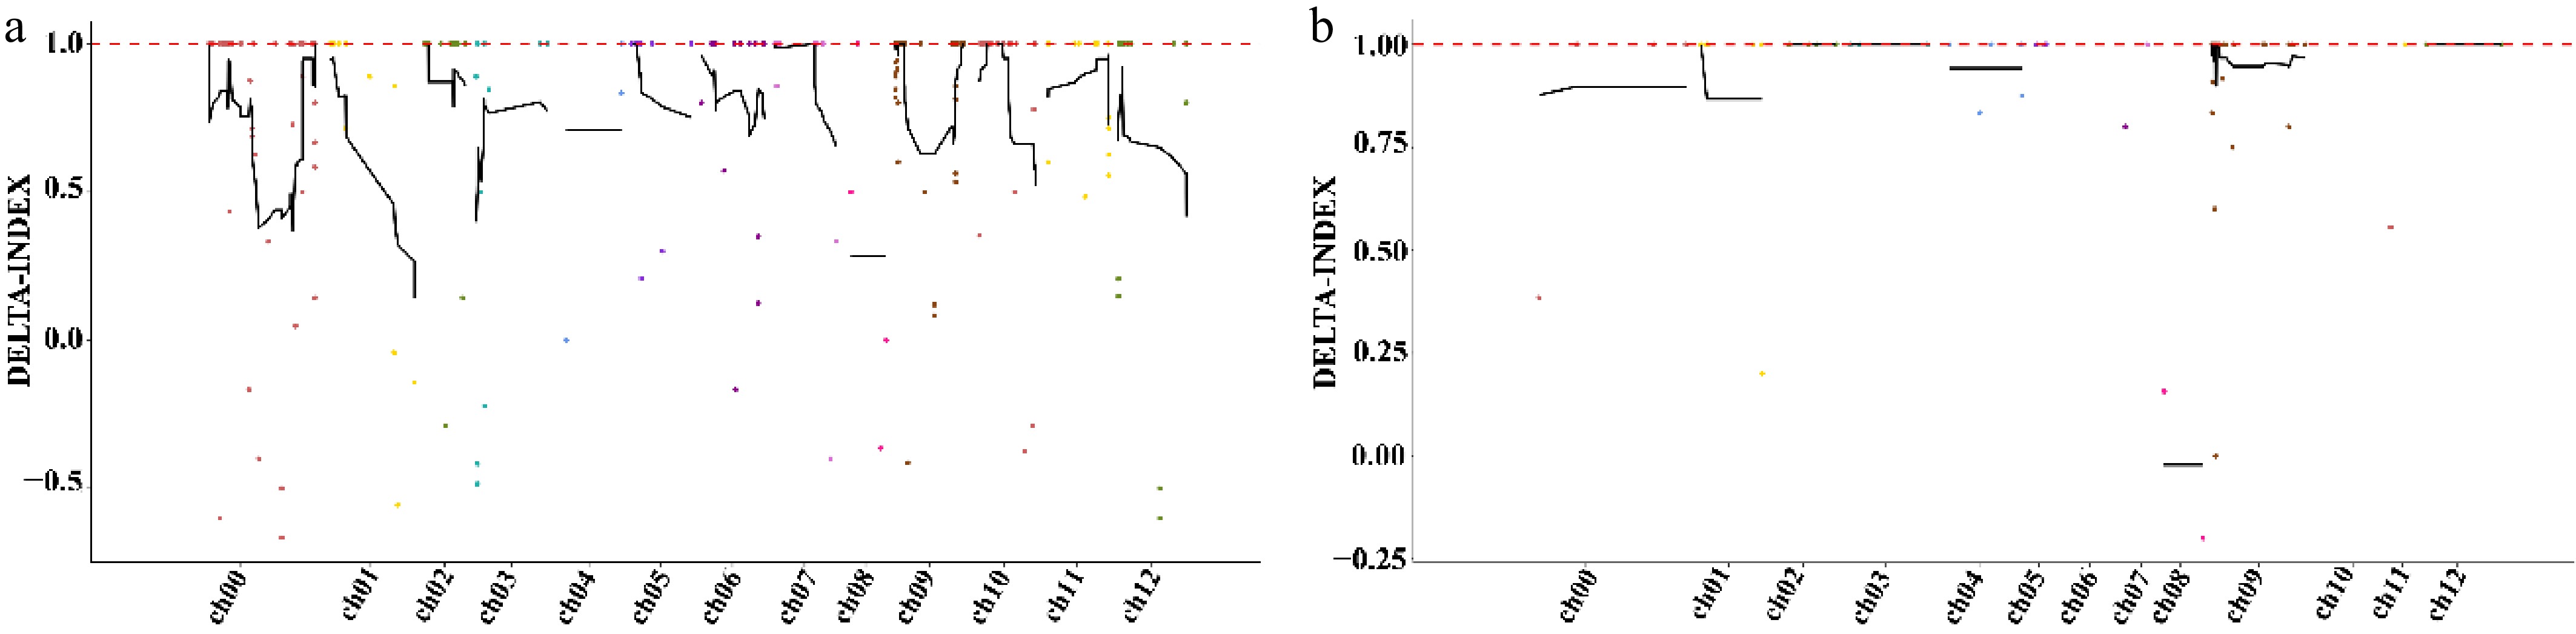
Figure 2.
Chromosomal localization of the candidate regions by BSA-seq (Δ[SNP index]). (a) Candidate regions identified through SNP association analysis via BSA-seq. (b) Candidate regions identified through small indel association analysis via BSA-seq.
-
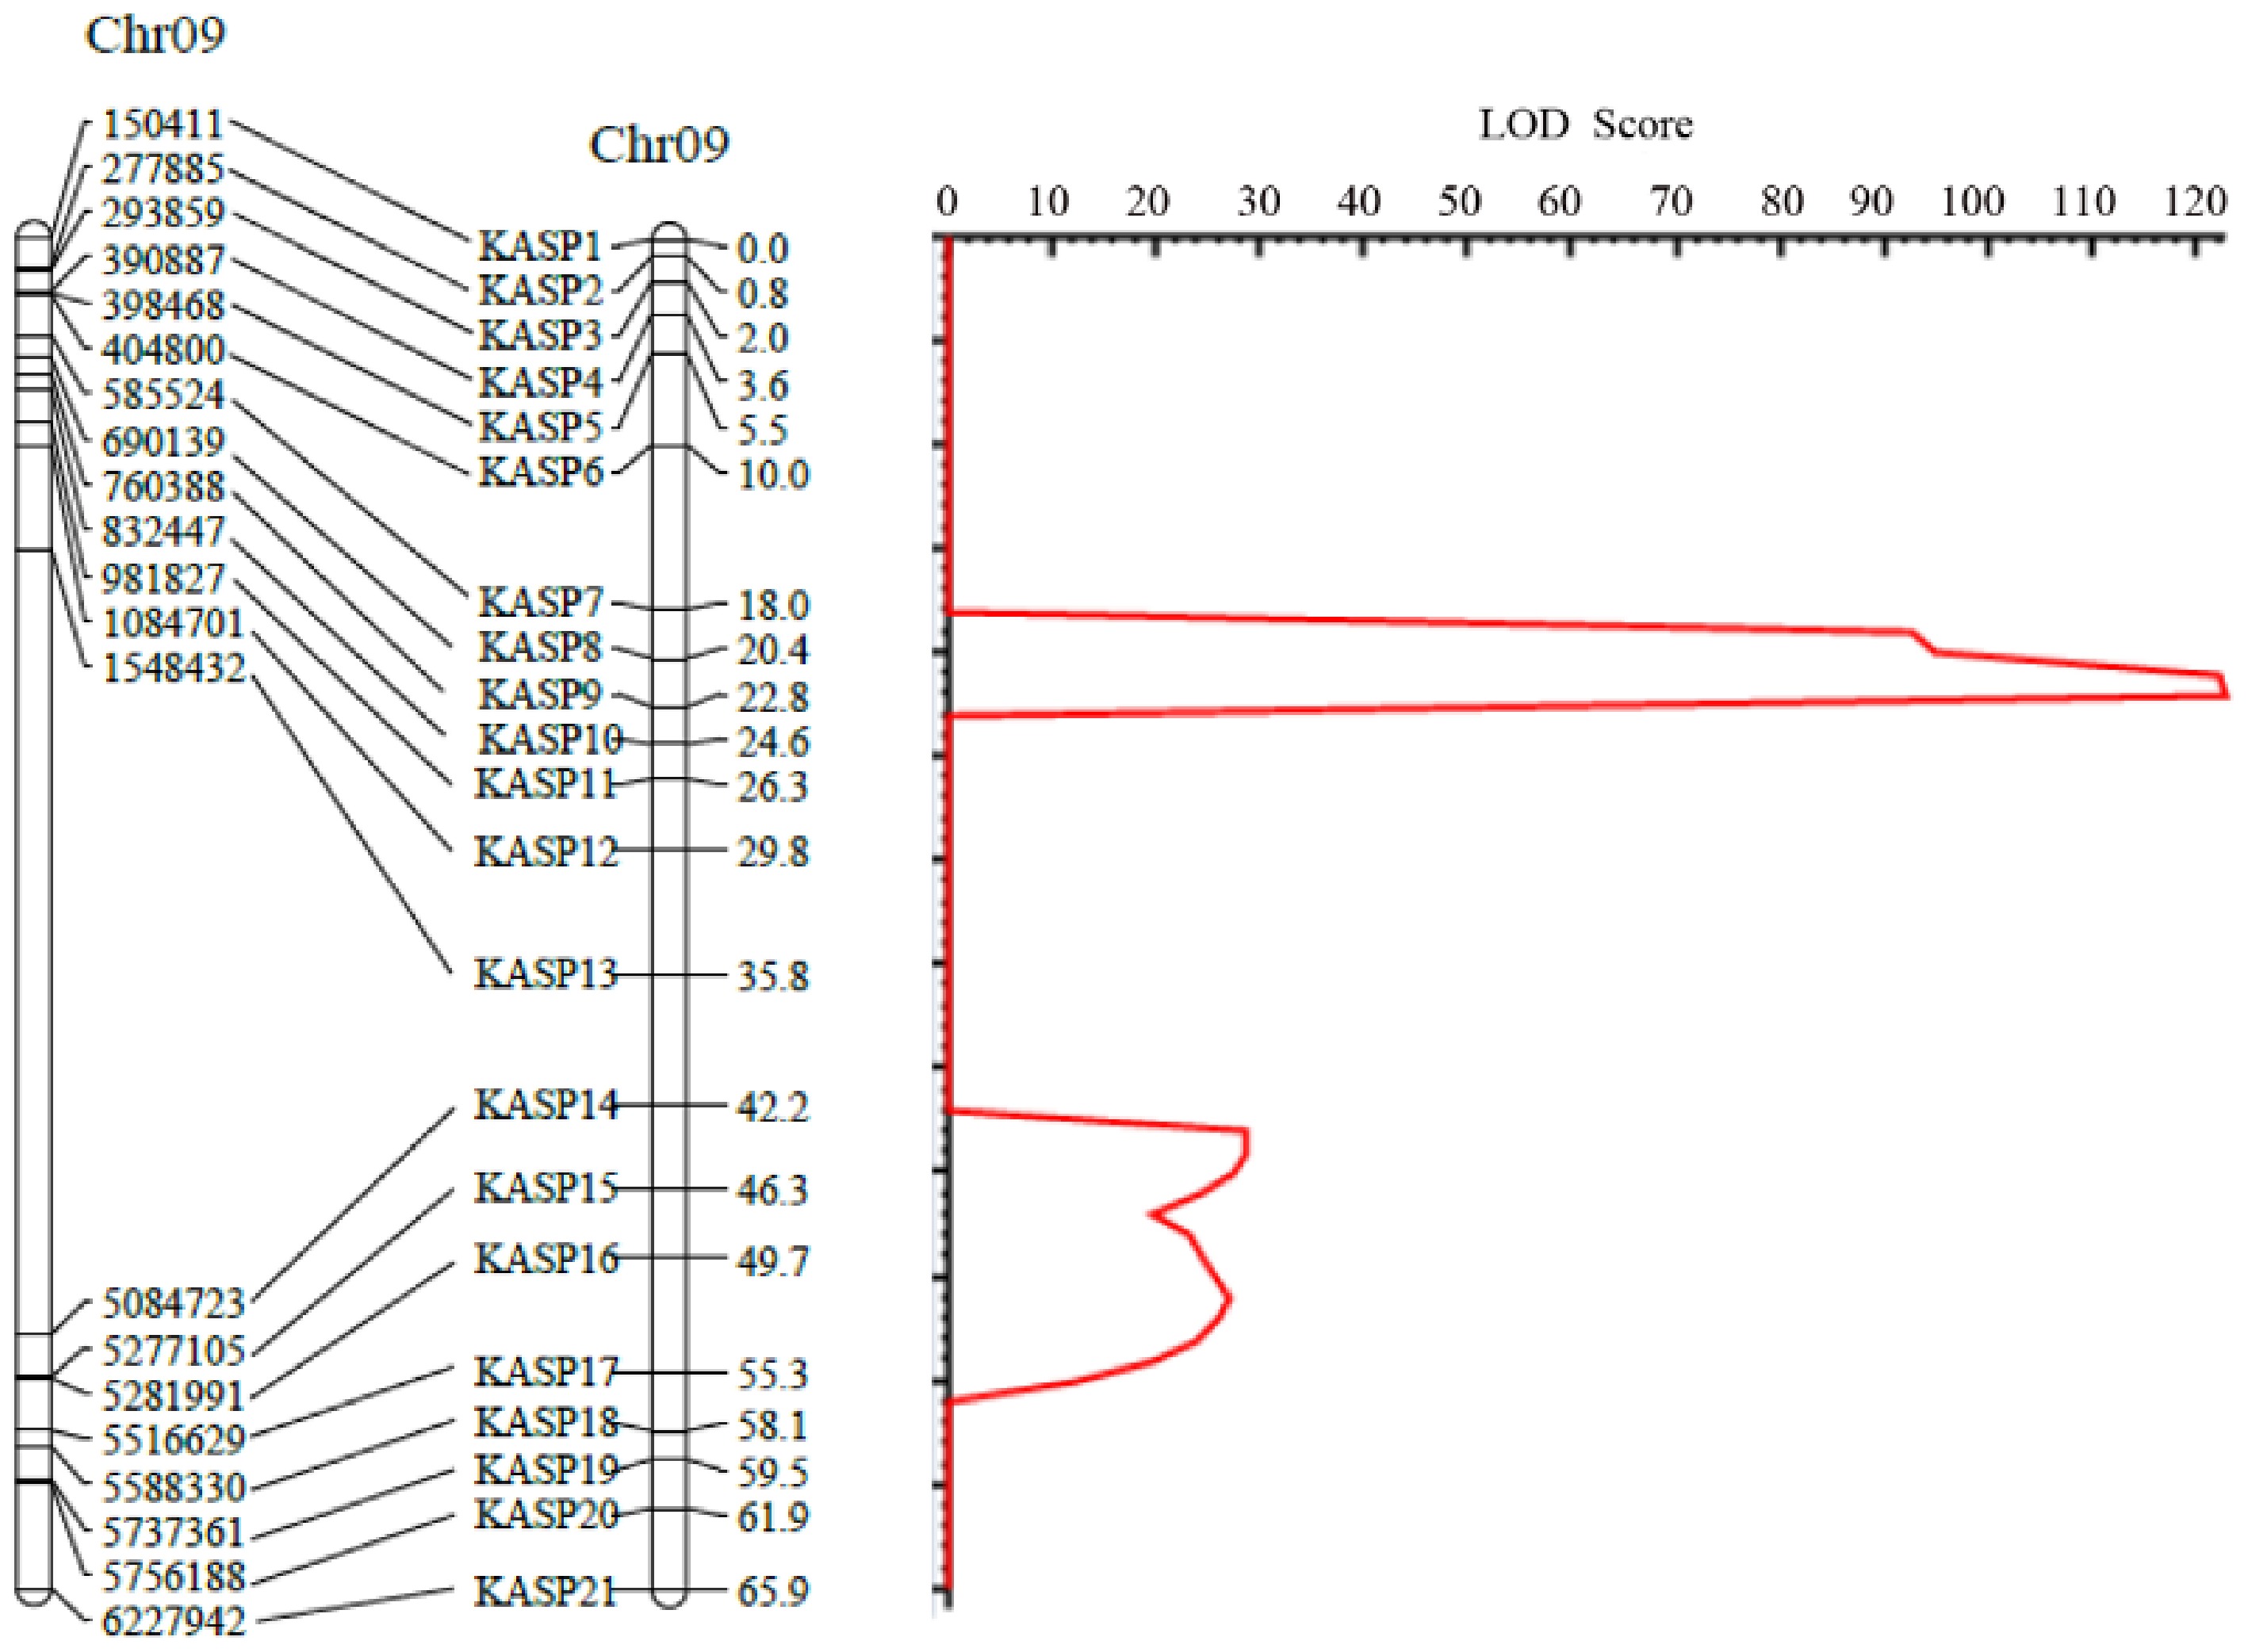
Figure 3.
Linkage genetic map and LOD score peak map of leaf color mutation in pepper.
-
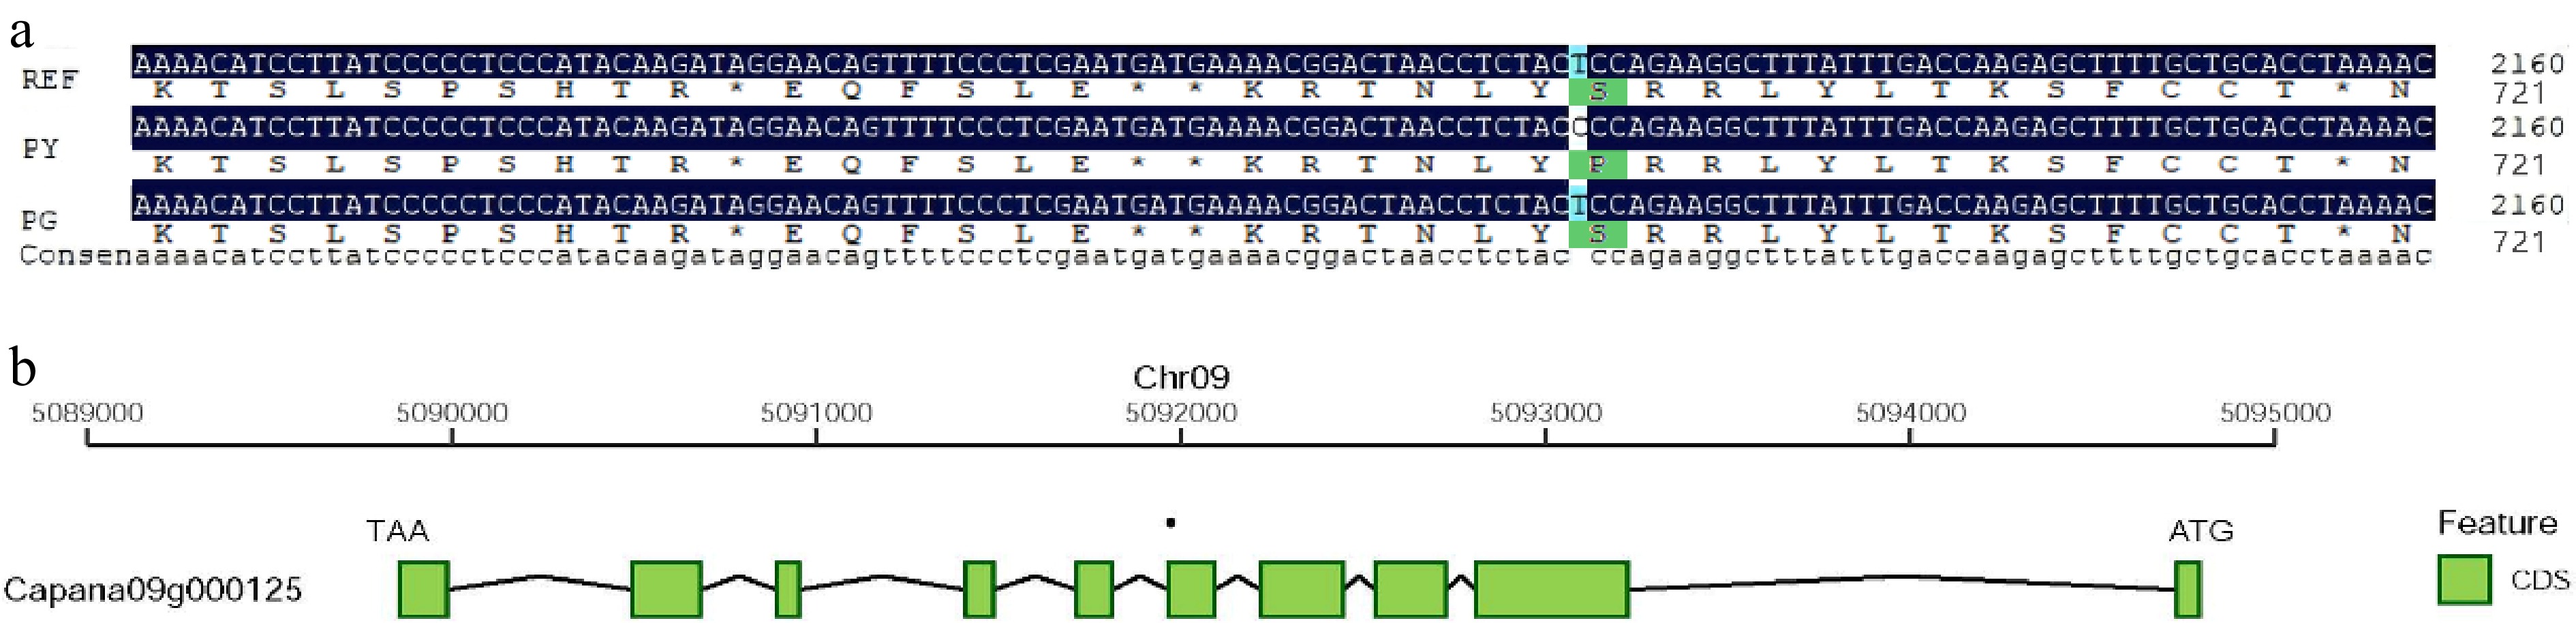
Figure 4.
Variant sites and structural diagram of the candidate gene CaLAP2. (a) Multiple sequence alignment of the CaLAP2 gene region among RY, FY, and FG. (b) Schematic diagram of the CaLAP2 gene structure on Chr09 of pepper.
-
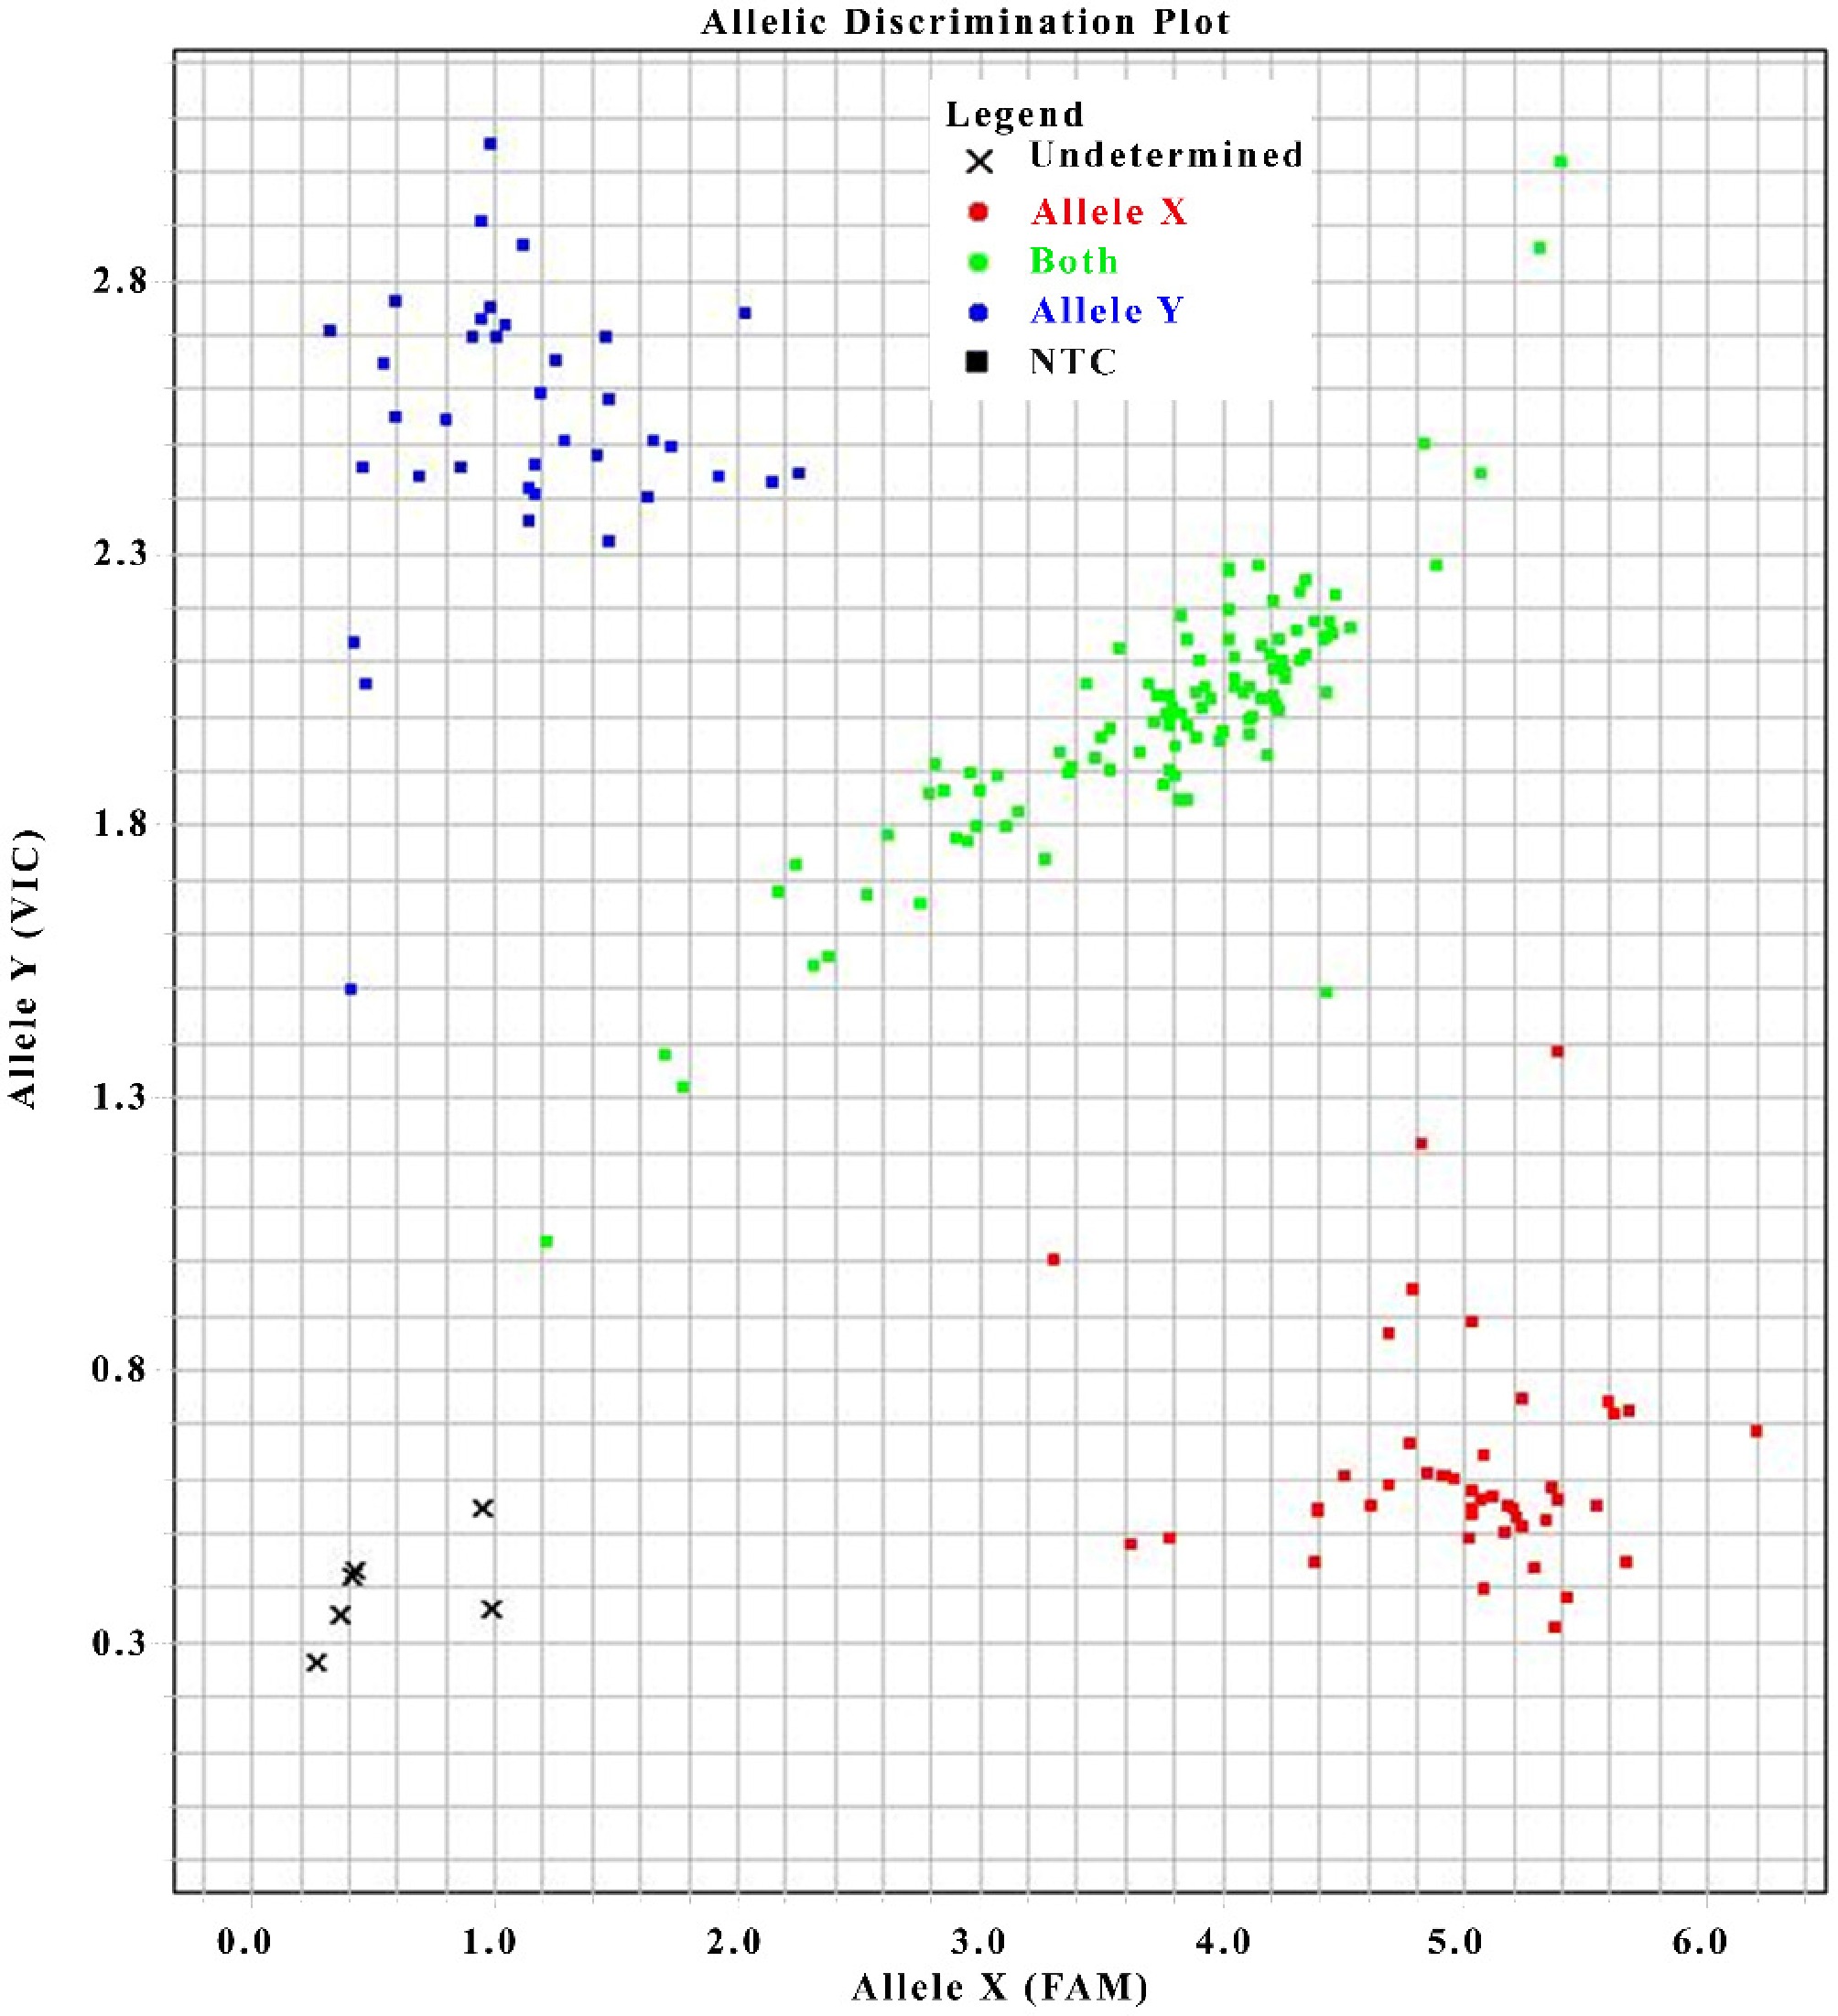
Figure 5.
KASP genotyping plot of the CaLAP2 variant's SNPs
-
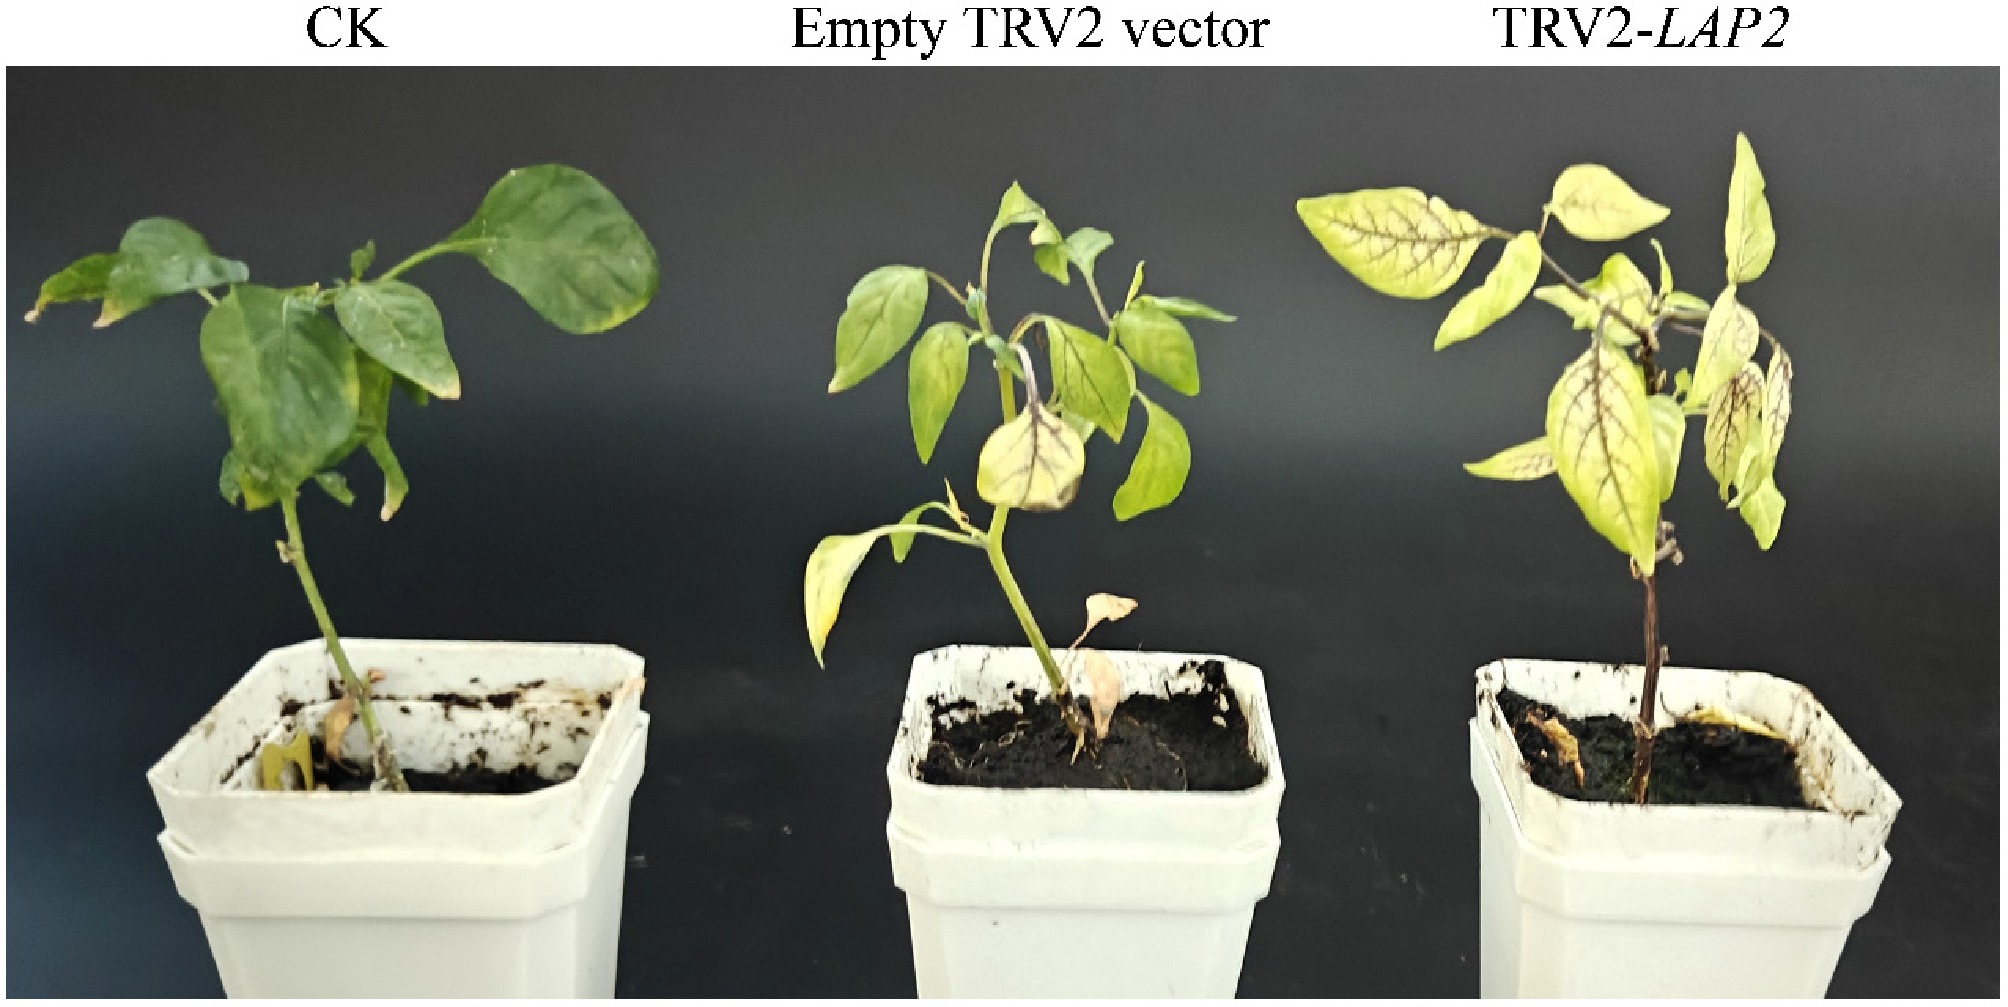
Figure 6.
Phenotype of virus-induced gene silencing
-
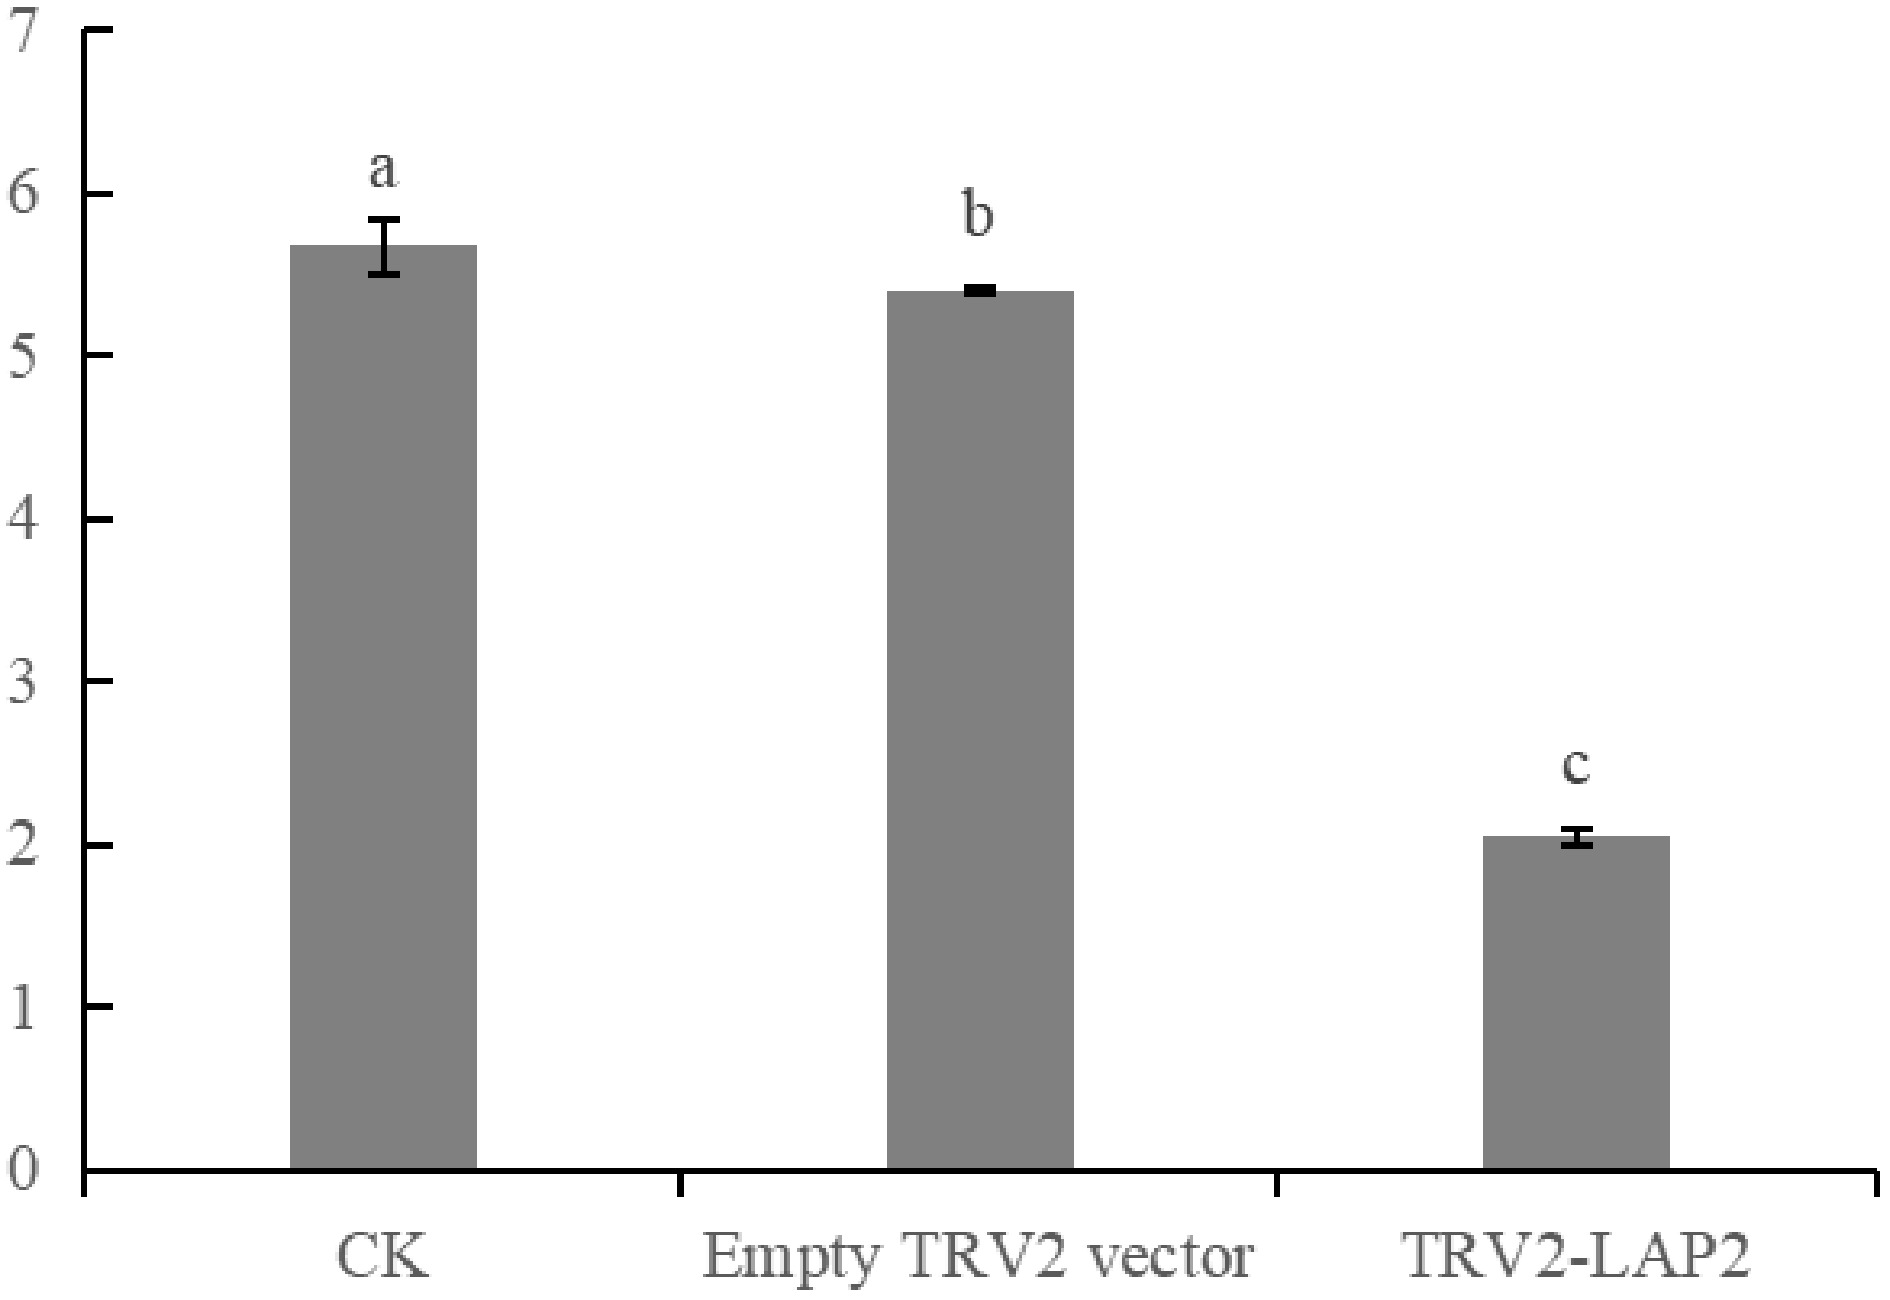
Figure 7.
Detection of the silencing efficiency of LAP2, with significance at p < 0.05.
-
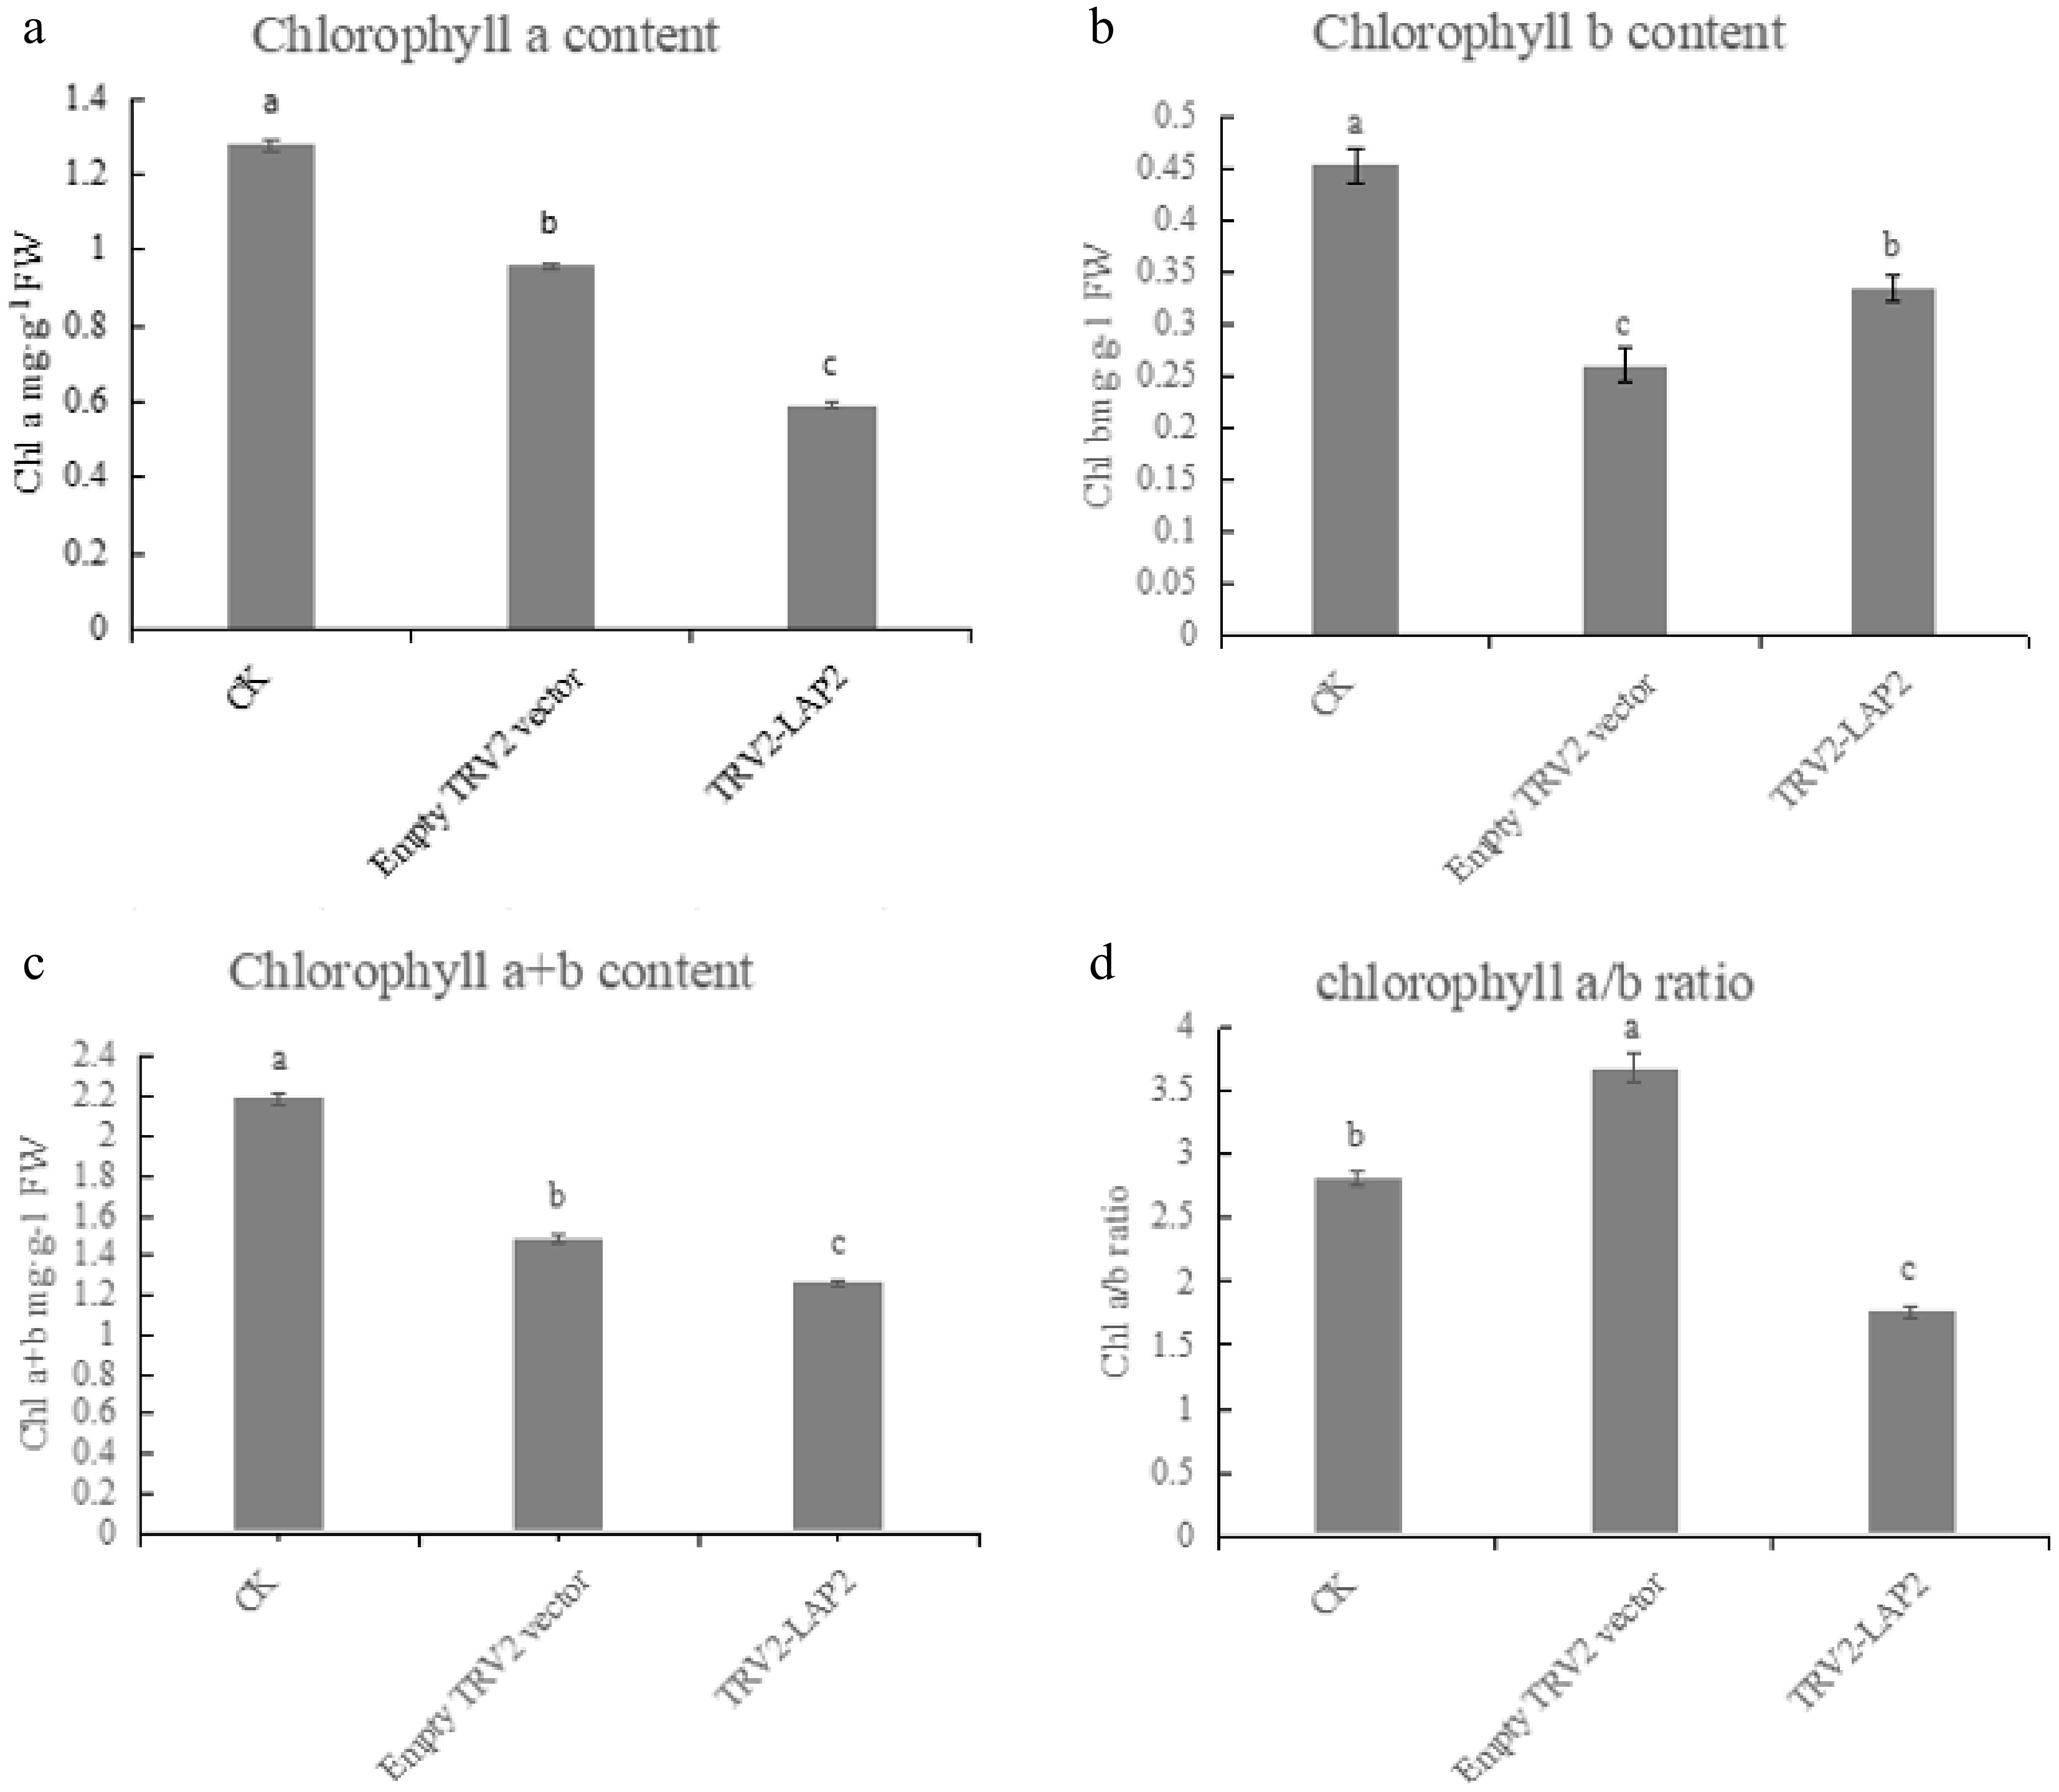
Figure 8.
Detection of chlorophyll content after silencing of CaLAP2. (a) Comparison of chlorophyll a content. (b) Comparison of chlorophyll b content. (c) Comparison of chlorophyll a + b content. (d) Comparison of the chlorophyll a/b ratio. Comparisons are significant at p < 0.05.
-
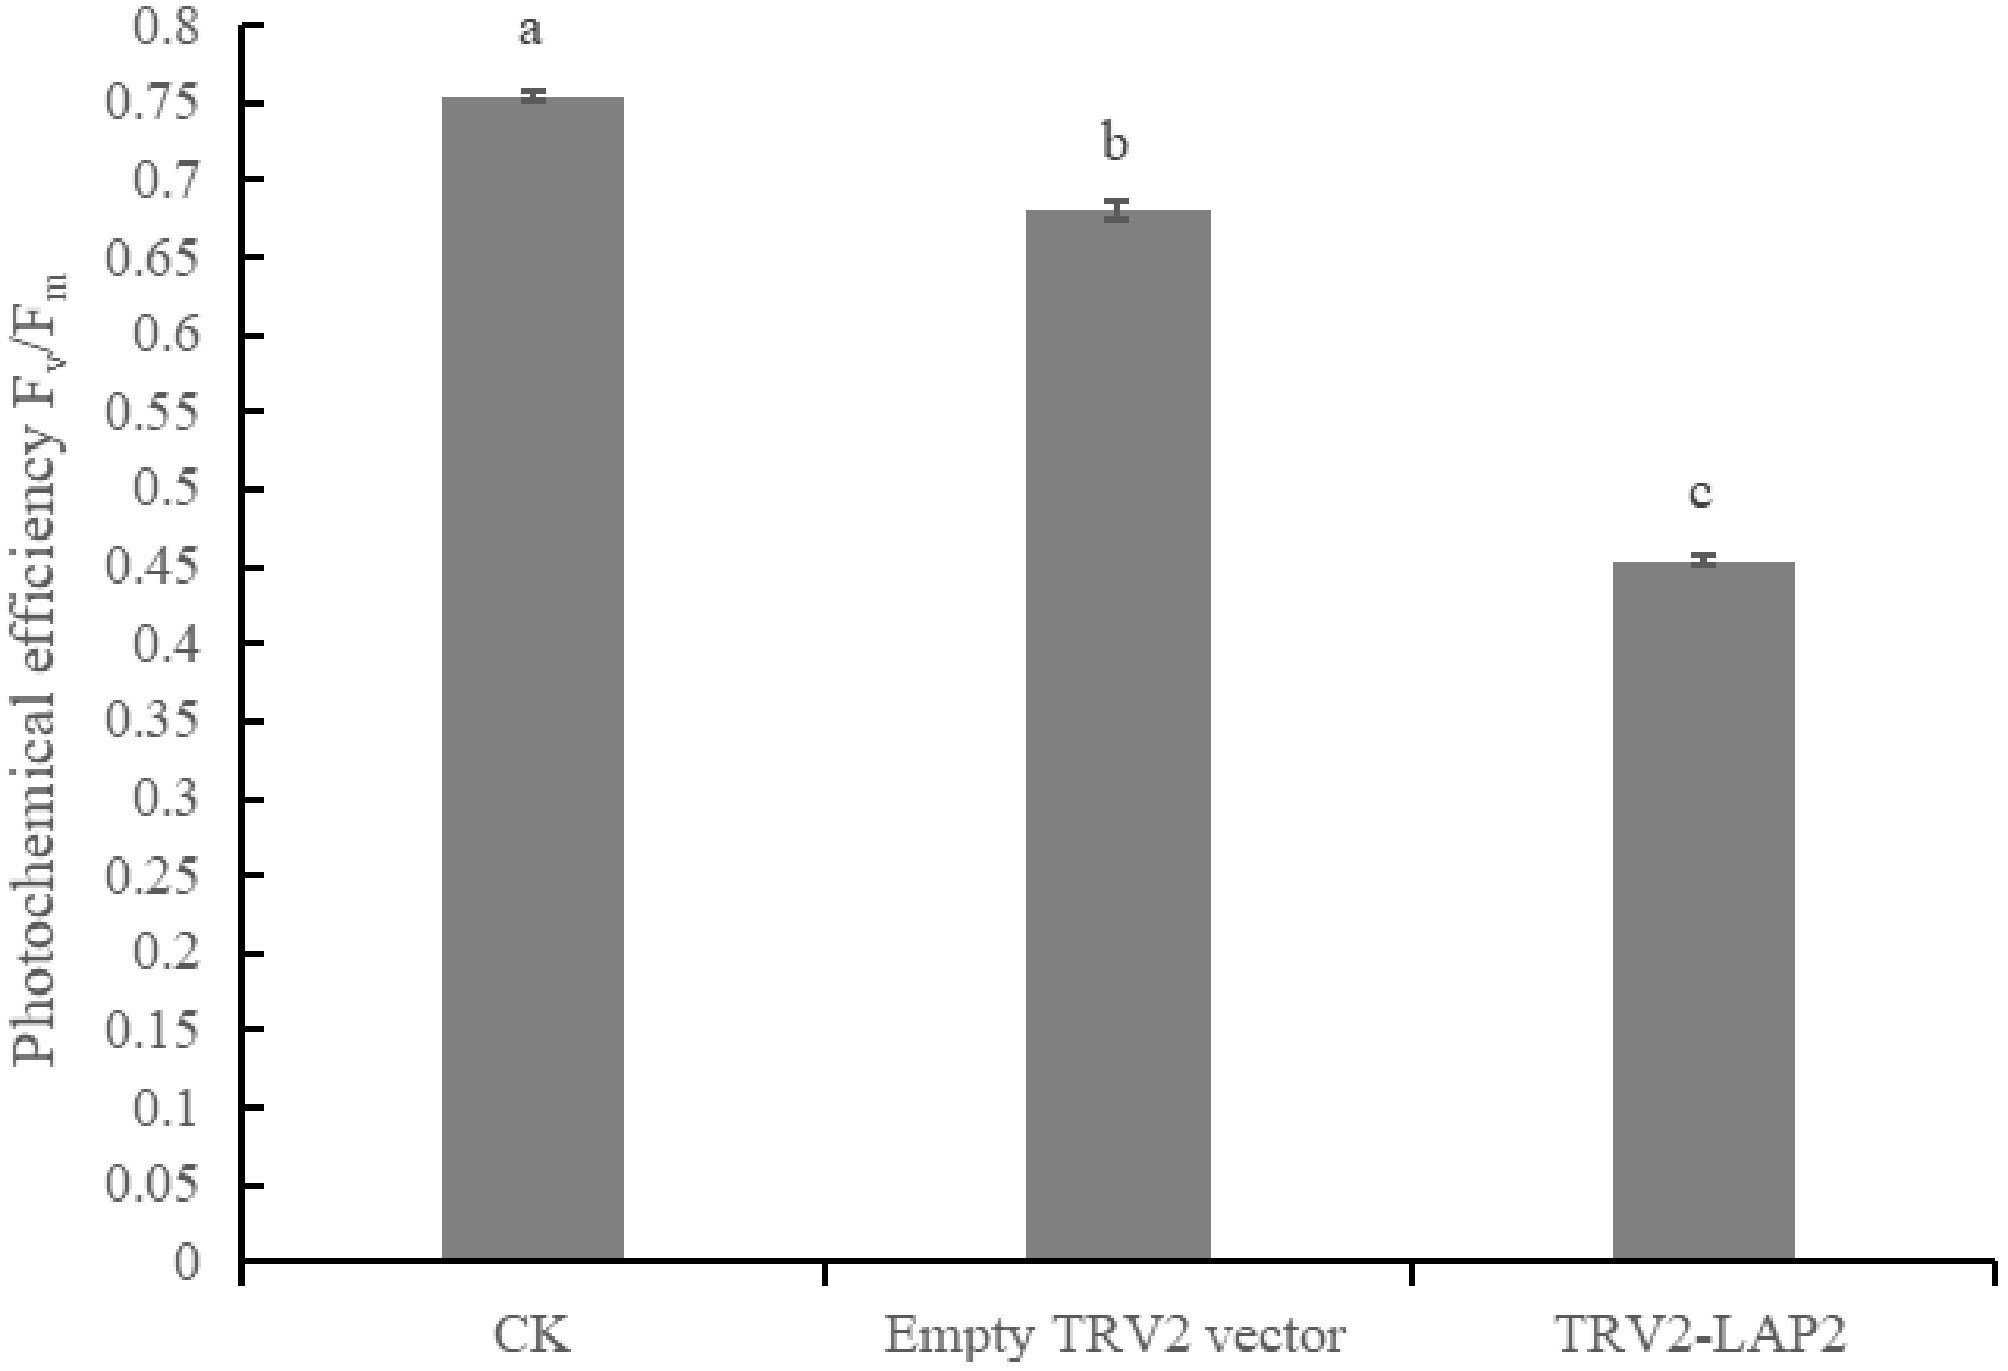
Figure 9.
Detection of photochemical efficiency (Fv/Fm) after silencing CaLAP2
-
ID Position Allele Missing (%) χ2 Pr > χ2 KASP1 C09-150411 TC 0.50 1.7739 0.411917 KASP2 C09-277885 AT 0.50 1.6633 0.435327 KASP3 C09-293859 CT 0.00 2.43 0.296711 KASP4 C09-390887 AG 5.00 3.2947 0.192556 KASP5 C09-398468 GT 2.00 0.2755 0.871312 KASP6 C09-404800 GC 0.50 1.2211 0.543051 KASP7 C09-585524 GA 4.50 1.6806 0.431575 KASP8 C09-690139 TC 1.50 2.6041 0.271979 KASP9 C09-760388 TG 1.00 3.7273 0.155108 KASP10 C09-832447 CT 1.00 5.1818 0.074953 KASP11 C09-981827 CA 1.00 3.1616 0.20581 KASP12 C09-1084701 TC 3.00 5.2887 0.071054 KASP13 C09-1548432 AT 11.50 1.2712 0.529622 KASP14 C09-5084723 GA 1.00 5.5556 0.062177 KASP15 C09-5277105 TA 5.00 0.5684 0.752608 KASP16 C09-5281991 CA 1.00 2.2828 0.319367 KASP17 C09-5516629 AG 1.50 1.3959 0.497595 KASP18 C09-5588330 GA 2.00 4.8469 0.088614 KASP19 C09-5737361 TC 6.50 3.8984 0.142389 KASP20 C09-5756188 GC 2.00 1.6735 0.433123 KASP21 C09-6227942 AG 1.00 3.899 0.142347 Table 1.
Information of 21 SNP markers.
-
Trait name Chromosome Left marker Right marker LOD PVE (%) color Chr09 690,139 760,388 122.5747 68.1596 color Chr09 5,084,723 5,277,105 28.7305 9.0028 color Chr09 5,281,991 5,516,629 27.1862 7.8642 Table 2.
Fine mapping results of QTLs for leaf color mutation in pepper.
-
Gene ID Start position End position Annotation Capana09g000022 711,077 714,954 SPX domain-containing protein 2-like Capana09g000023 732,458 735,299 Ethylene-responsive transcription factor WIN1-like isoform X1 Capana09g000024 746,469 752,891 Elongator complex protein 6 Capana09g000025 756,104 758,530 Receptor-like protein 12-like Capana09g000124 5,083,147 5,088,934 Probable cyclic nucleotide-gated ion channel 5-like isoform X1 Capana09g000125 5,089,856 5,094,793 Leucine aminopeptidase 2, chloroplastic-like Capana09g000126 5,102,001 5,102,363 Uncharacterized protein LOC101267869 isoform X2 Capana09g000127 5,102,882 5,105,381 Uncharacterized protein LOC102595001 isoform X1 Capana09g000128 5,109,856 5,112,450 Mary's story protein Capana09g000129 5,116,611 5,117,939 BTB/POZ domain-containing protein At4g30940-like Capana09g000130 5,210,976 5,212,166 BTB/POZ domain-containing protein At4g30940-like Capana09g000131 5,214,327 5,222,692 Elongation factor Ts, mitochondrial-like Capana09g000132 5,233,225 5,238,373 Reticulon-like protein B21 Capana09g000133 5,251,929 5,252,757 CBL-interacting serine/
threonine-protein kinase 6-likeCapana09g000134 5,317,930 5,318,742 Zeatin O-glucosyltransferase-like Capana09g000135 5,321,977 5,322,318 Zeatin O-glucosyltransferase-like Capana09g000136 5,322,794 5,323,186 Zeatin O-glucosyltransferase-like Capana09g000137 5,400,159 5,402,583 Serine/threonine-protein kinase At5g01020-like Capana09g000138 5,413,772 5,417,555 Sucrose synthase Capana09g000139 5,431,595 5,431,927 Cytochrome b6 (chloroplast) Capana09g000140 5,455,635 5,459,999 Predicted: 3-oxoacyl-[acyl-carrier-protein] synthase II, chloroplastic-like Capana09g000141 5,505,303 5,508,628 20-kDa chaperonin, chloroplastic-like Table 3.
Information on genes in the mapped interval.
-
ID Primer information KASP-LAP2 F1: GAAGGTGACCAAGTTCATGCTgaaaacggactaacctctactC F2: GAAGGTCGGAGTCAACGGATTgaaaacggactaacctctactT R: catgttcccagtggtggctac Table 4.
Information of KASP primers developed from the CaLAP2 variants' SNPs.
-
Genotype–phenotype matching Genotype–phenotype mismatch TT (yellow) CC (green) TG (green) TT (green) GG (green) TG (yellow) Undetermined (yellow) Undetermined (green) F2 45 38 111 0 0 0 1 6 Maternal parent 1 0 0 0 0 0 0 0 Paternal parent 0 1 0 0 0 0 0 0 Table 5.
Phenotypic identification of leaf color in parents and the F2 population.
Figures
(9)
Tables
(5)