-
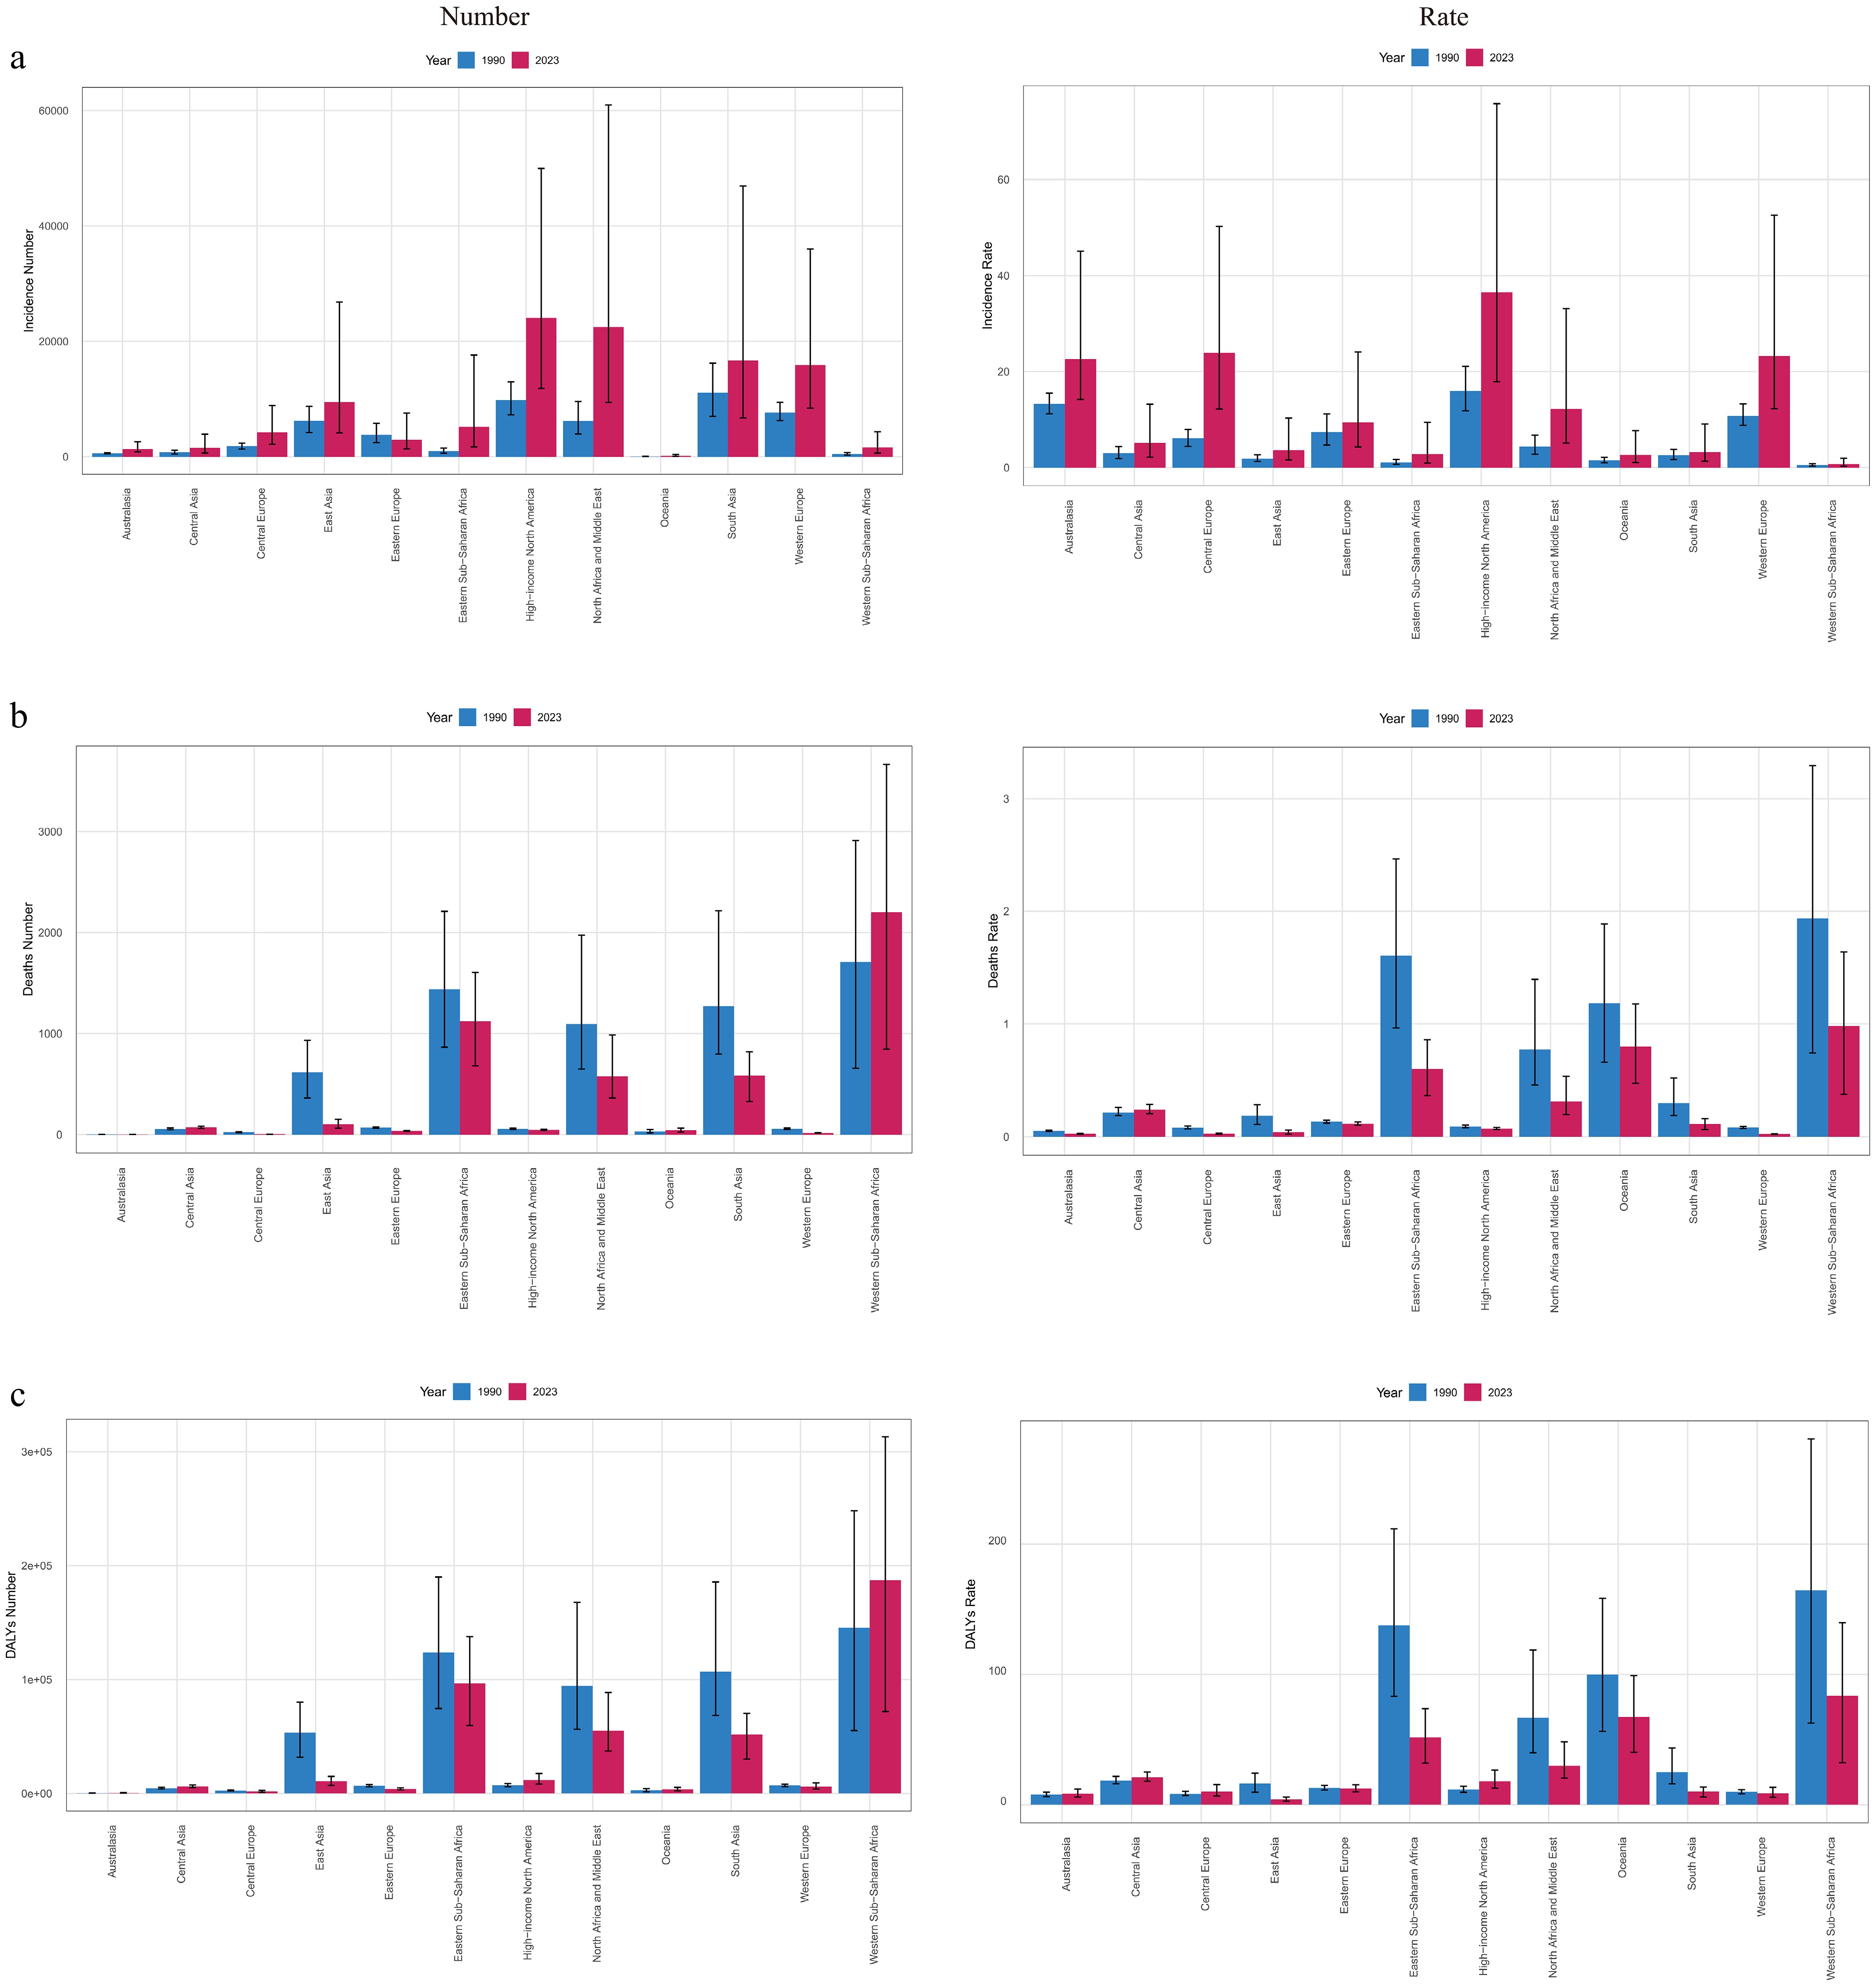
Figure 1.
Regional burden of childhood diabetes (ages 0–14 years) in 1990 and 2023. (a) Number of incident cases and incidence rate (per 100,000 population); (b) Number of deaths and mortality rate; (c) Number of disability-adjusted life years (DALYs) and DALY rate (per 100,000 population).
-
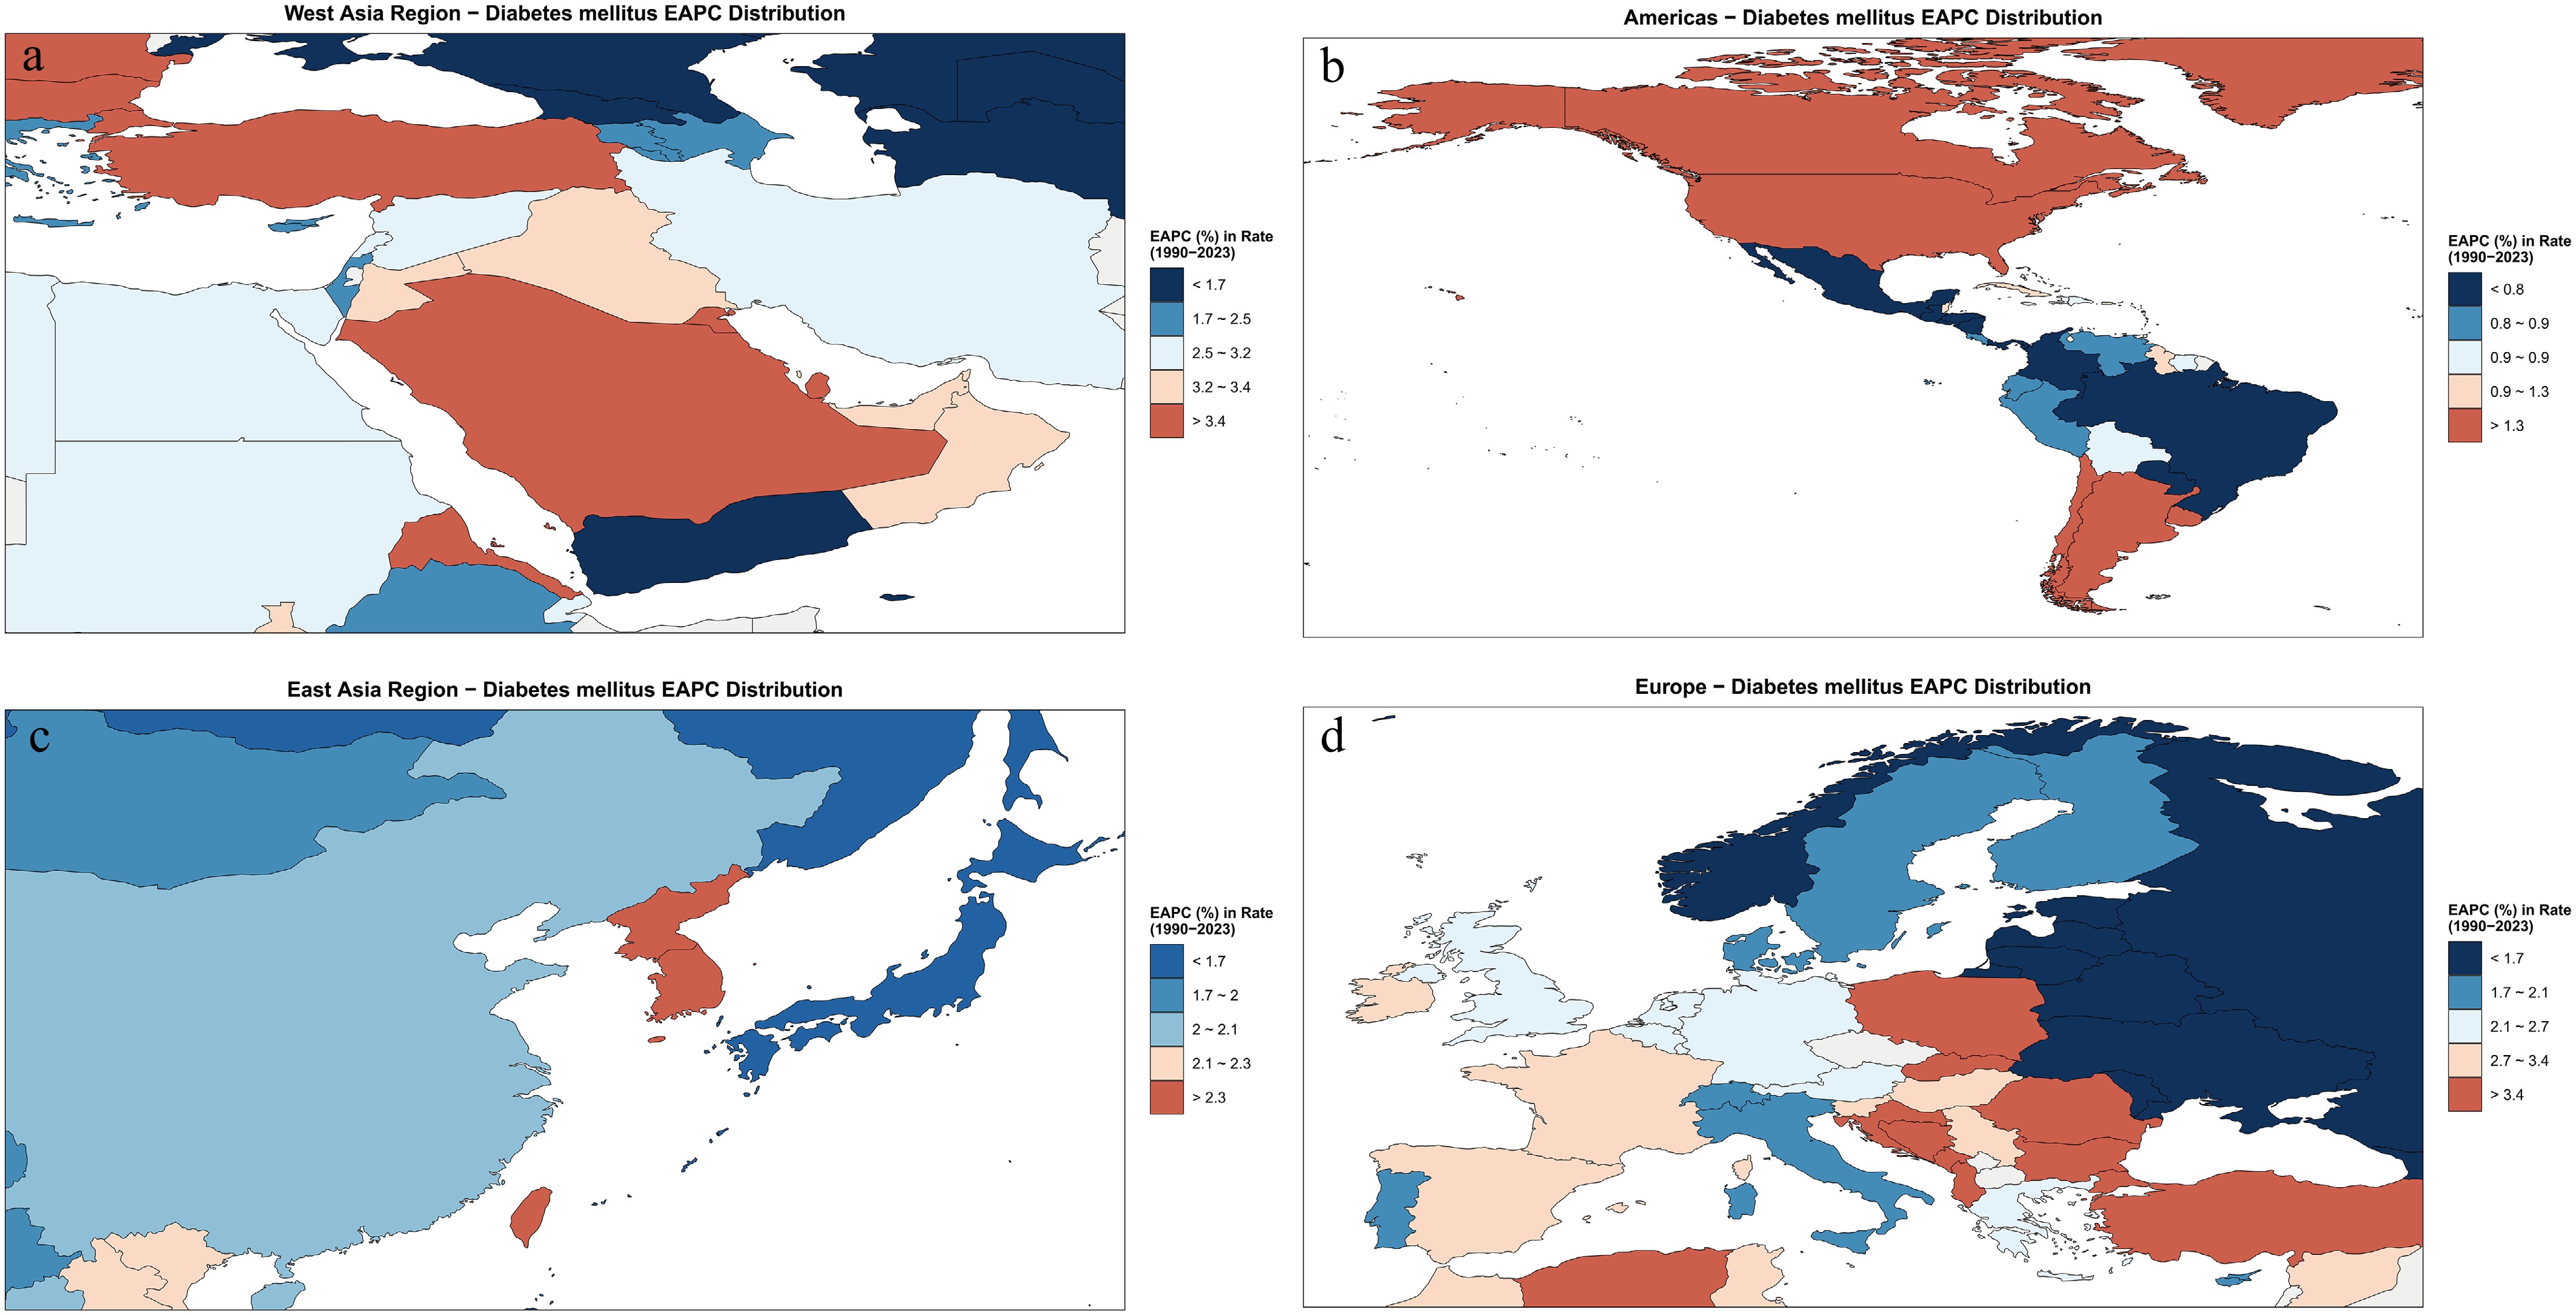
Figure 2.
National distribution of the estimated annual percentage change (EAPC) in the incidence rate of childhood diabetes from 1990 to 2023. Map created using a base map from the Resource and Environment Science and Data Center (RESDC,
www.resdc.cn ) and data from the GBD Study 2023. (a) West Asia; (b) the Americas; (c) East Asia; (d) Europe. EAPC reflects the average annual change in incidence rate over time, with red indicating an increasing trend and blue indicating a declining trend. -
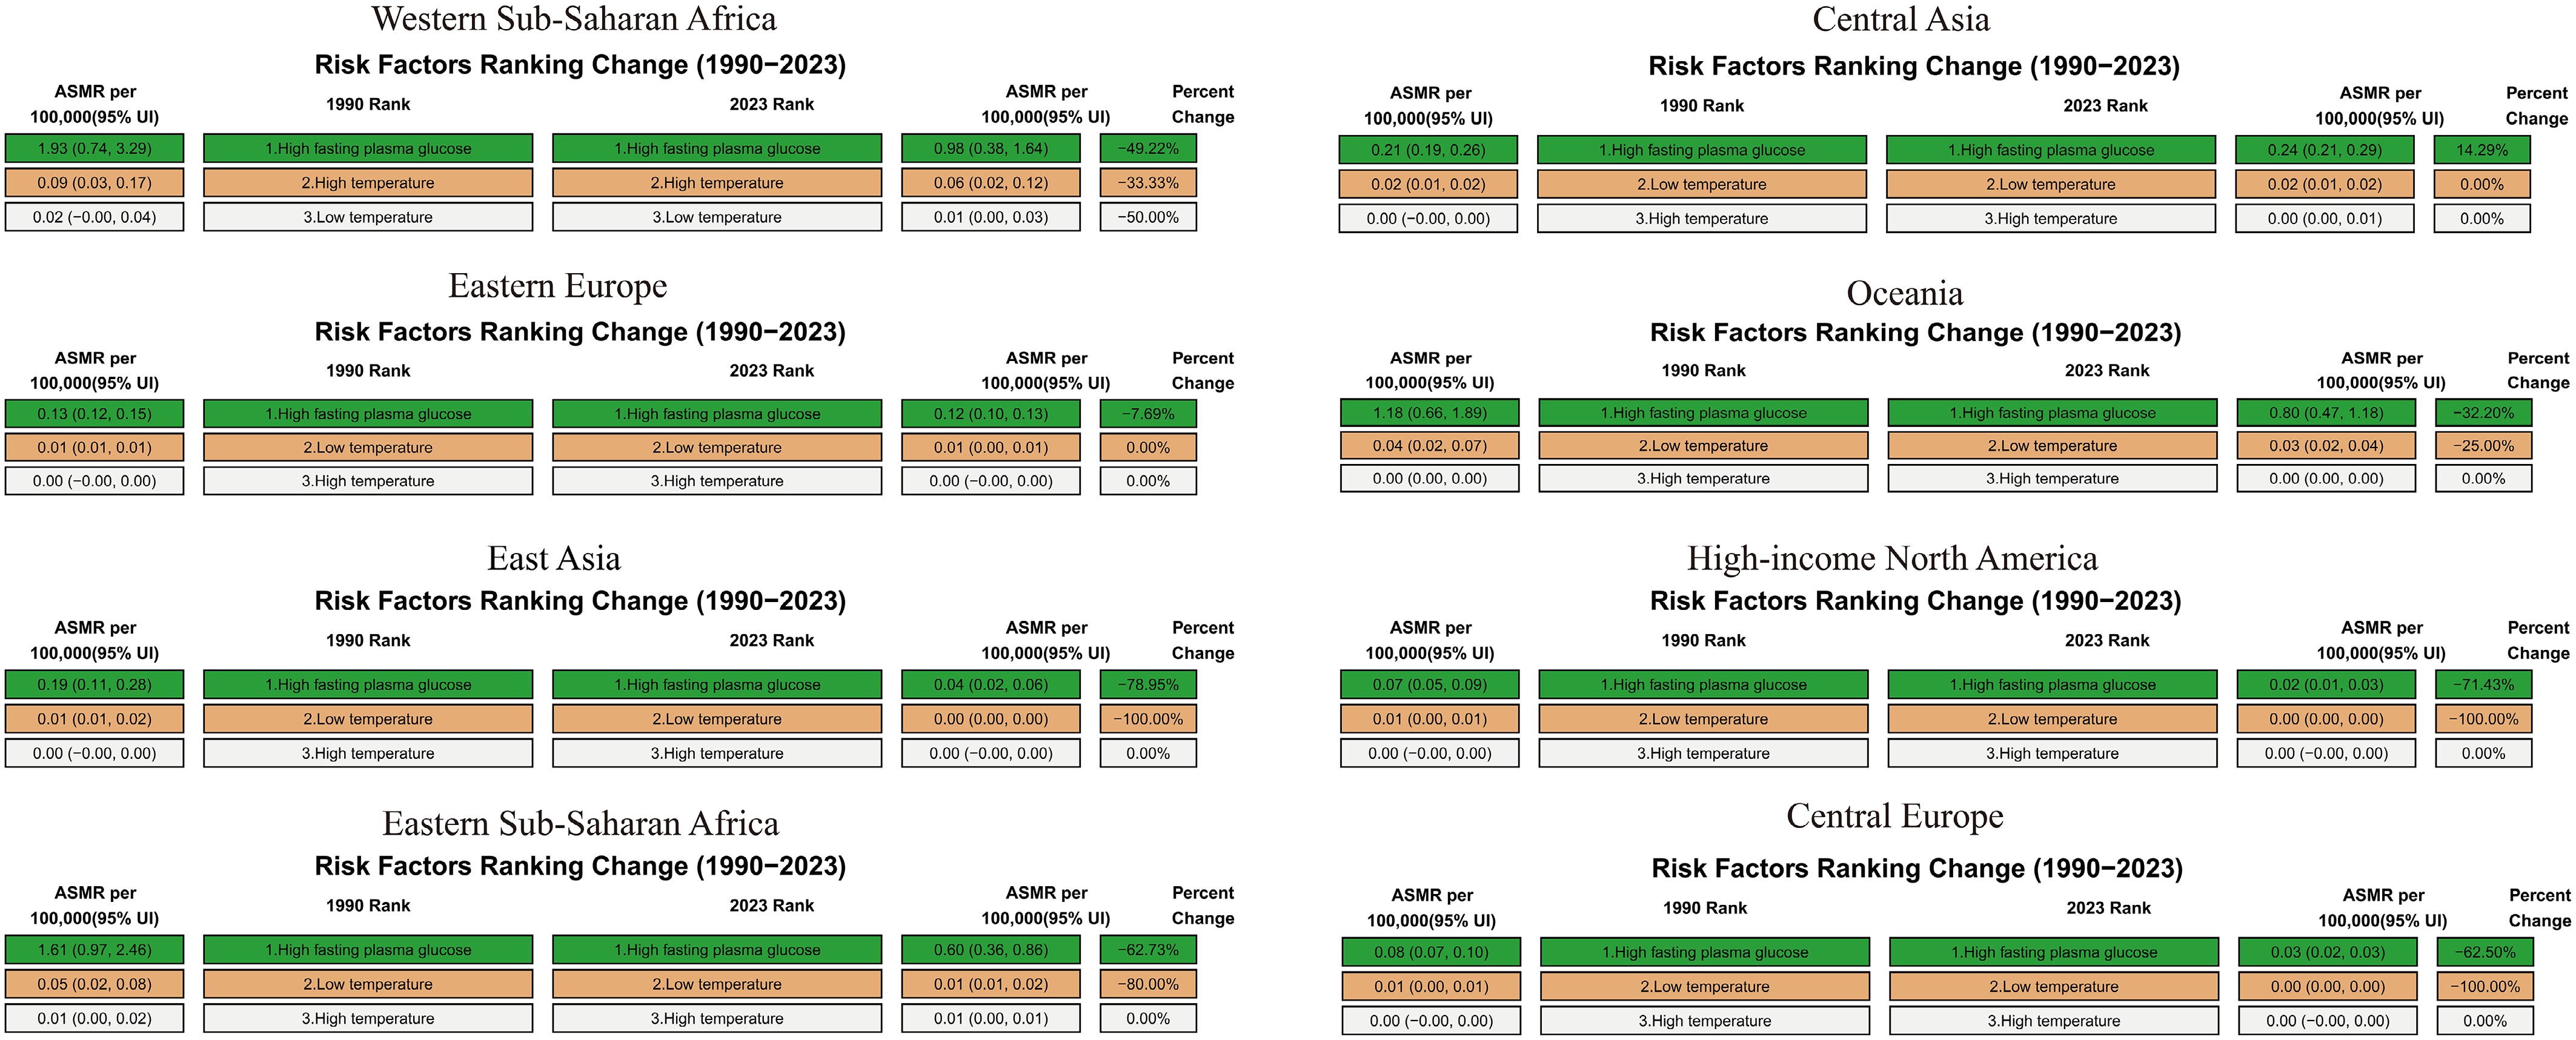
Figure 3.
Changes in risk factor–attributable burden of childhood diabetes deaths across selected regions from 1990 to 2023.
-
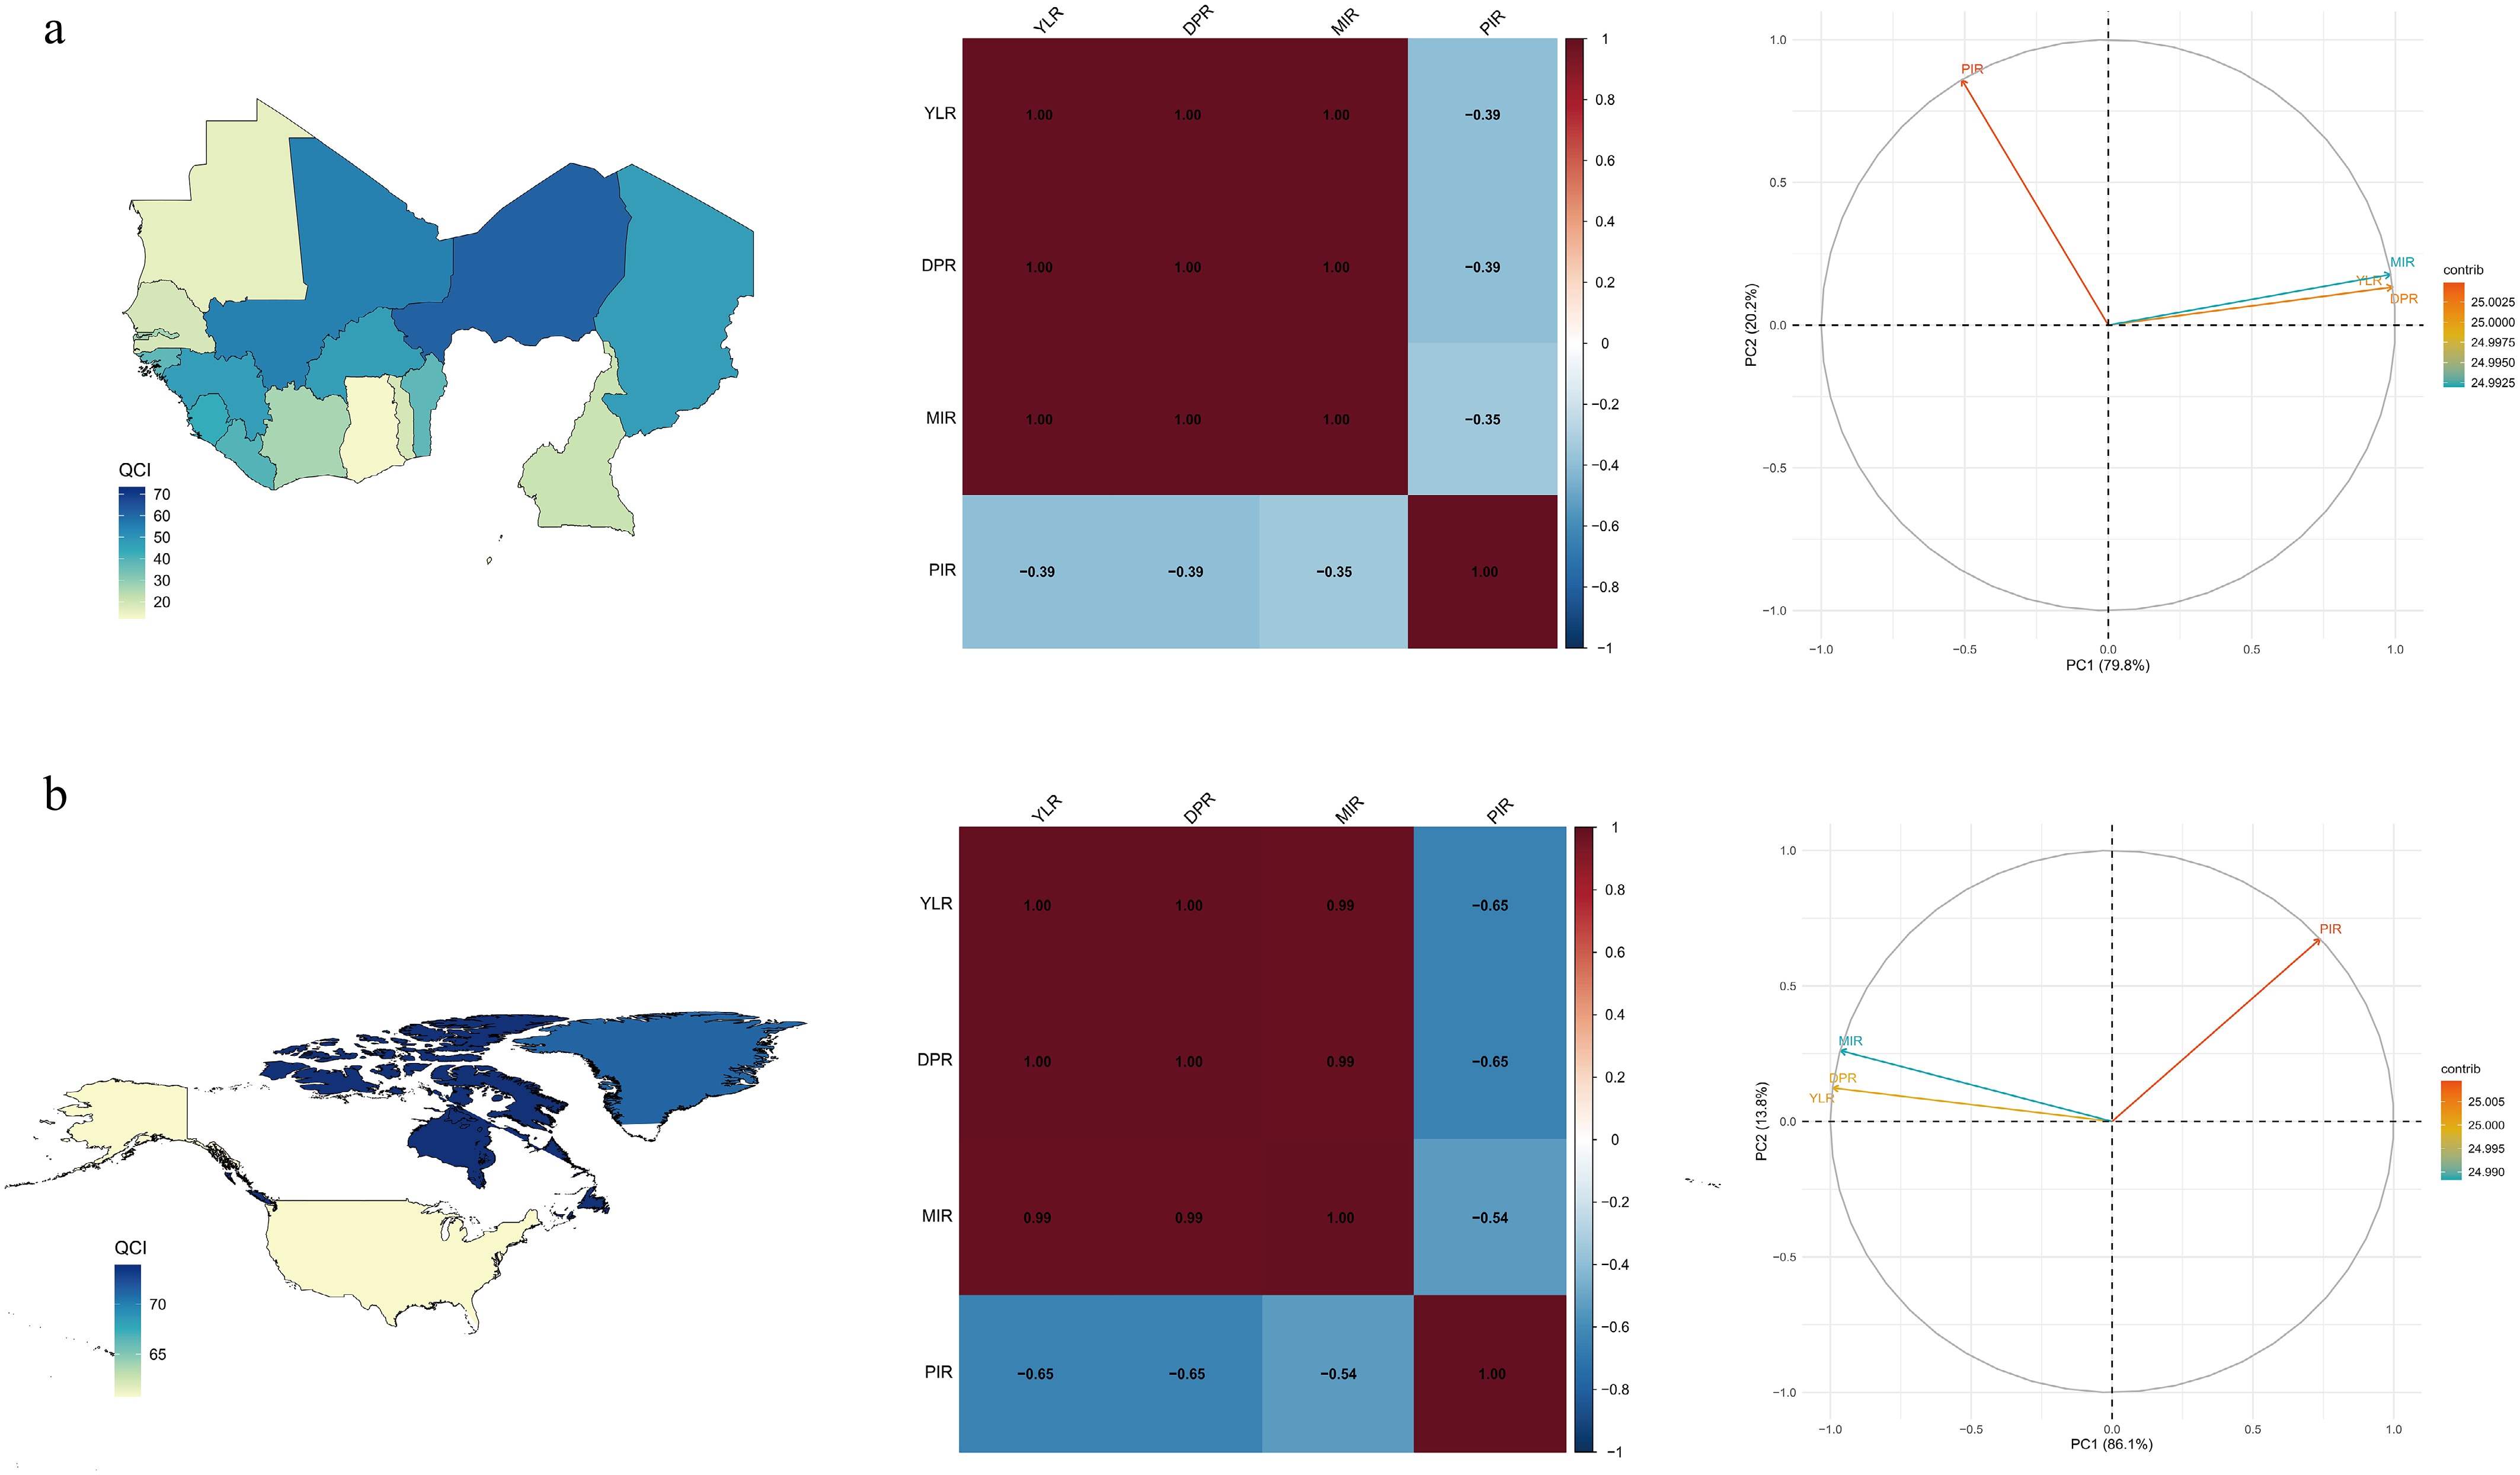
Figure 4.
Regional quality of childhood diabetes care based on the Quality of Care Index (QCI) in Western Sub-Saharan Africa (a) and High-Income North America (b). Distribution of QCI; correlation matrix illustrating the relationships among YLR, DPR, MIR, and PIR; and principal component analysis identifying two major components representing disease burden (PC1) and management quality (PC2).
-
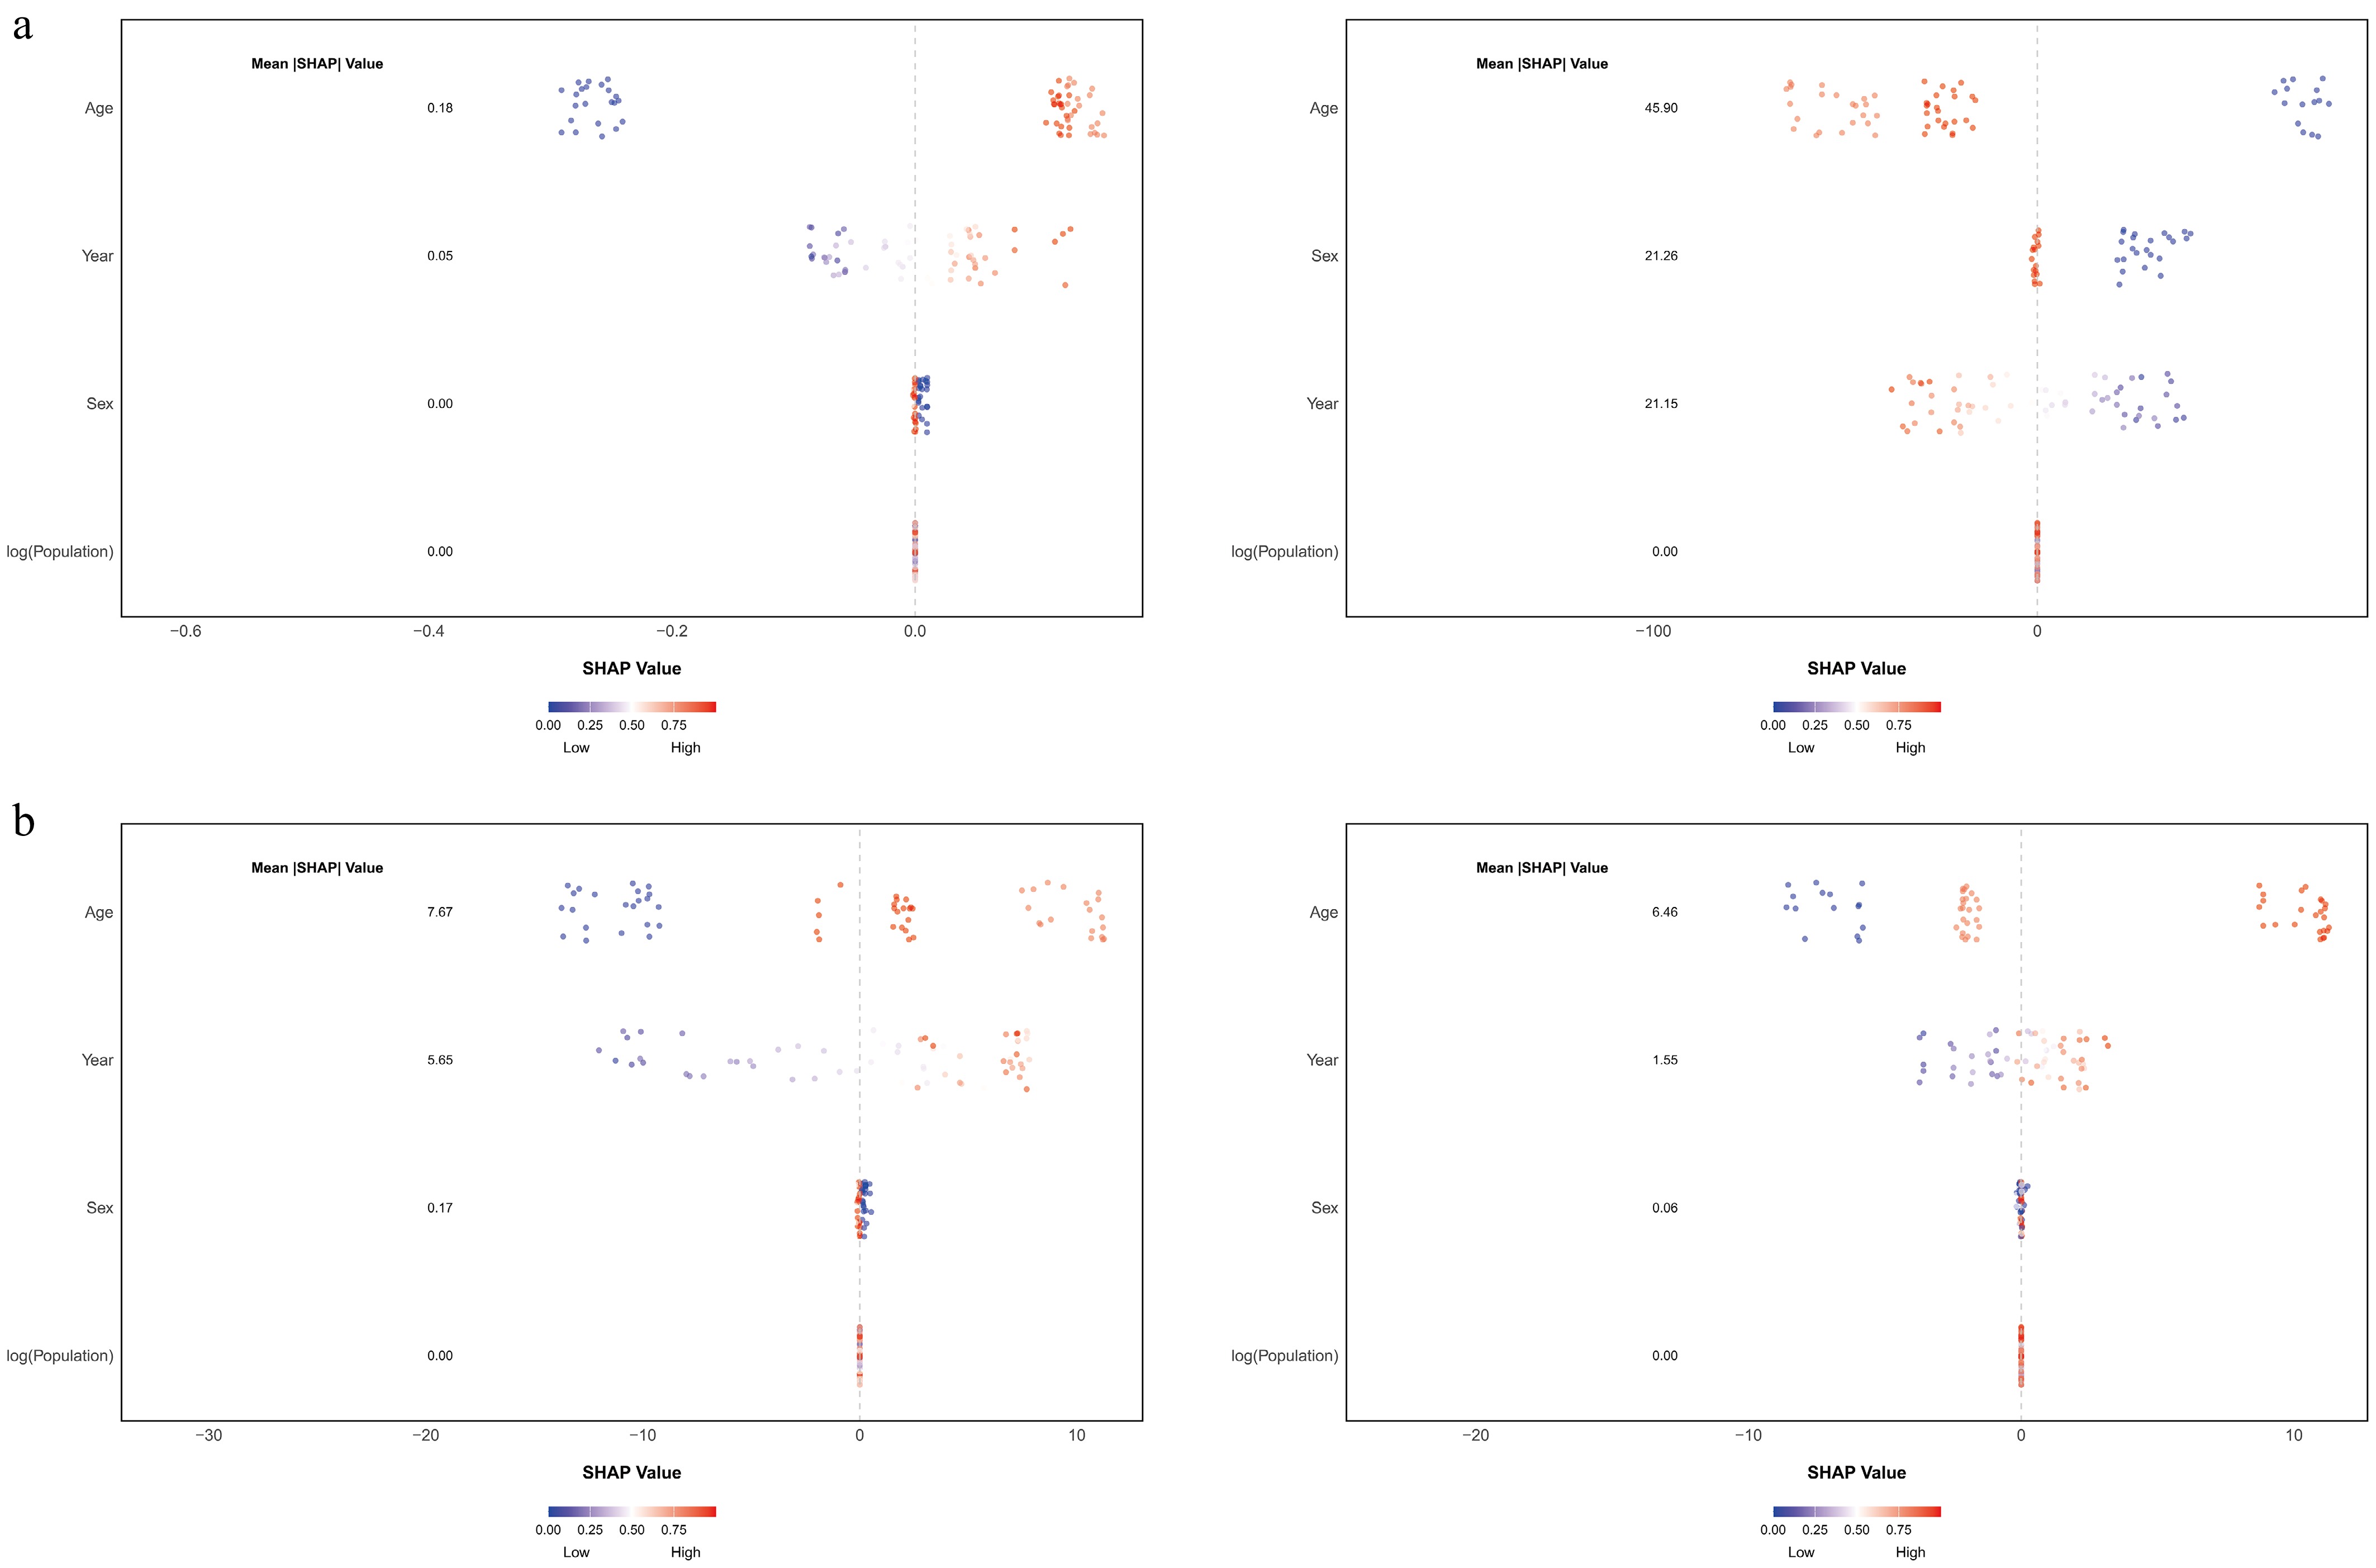
Figure 5.
SHAP-based interpretation of childhood diabetes incidence and DALY Rates in Western Sub-Saharan Africa and High-Income North America. (a) Western Sub-Saharan Africa. (b) High-income North America.
Figures
(5)
Tables
(0)