-
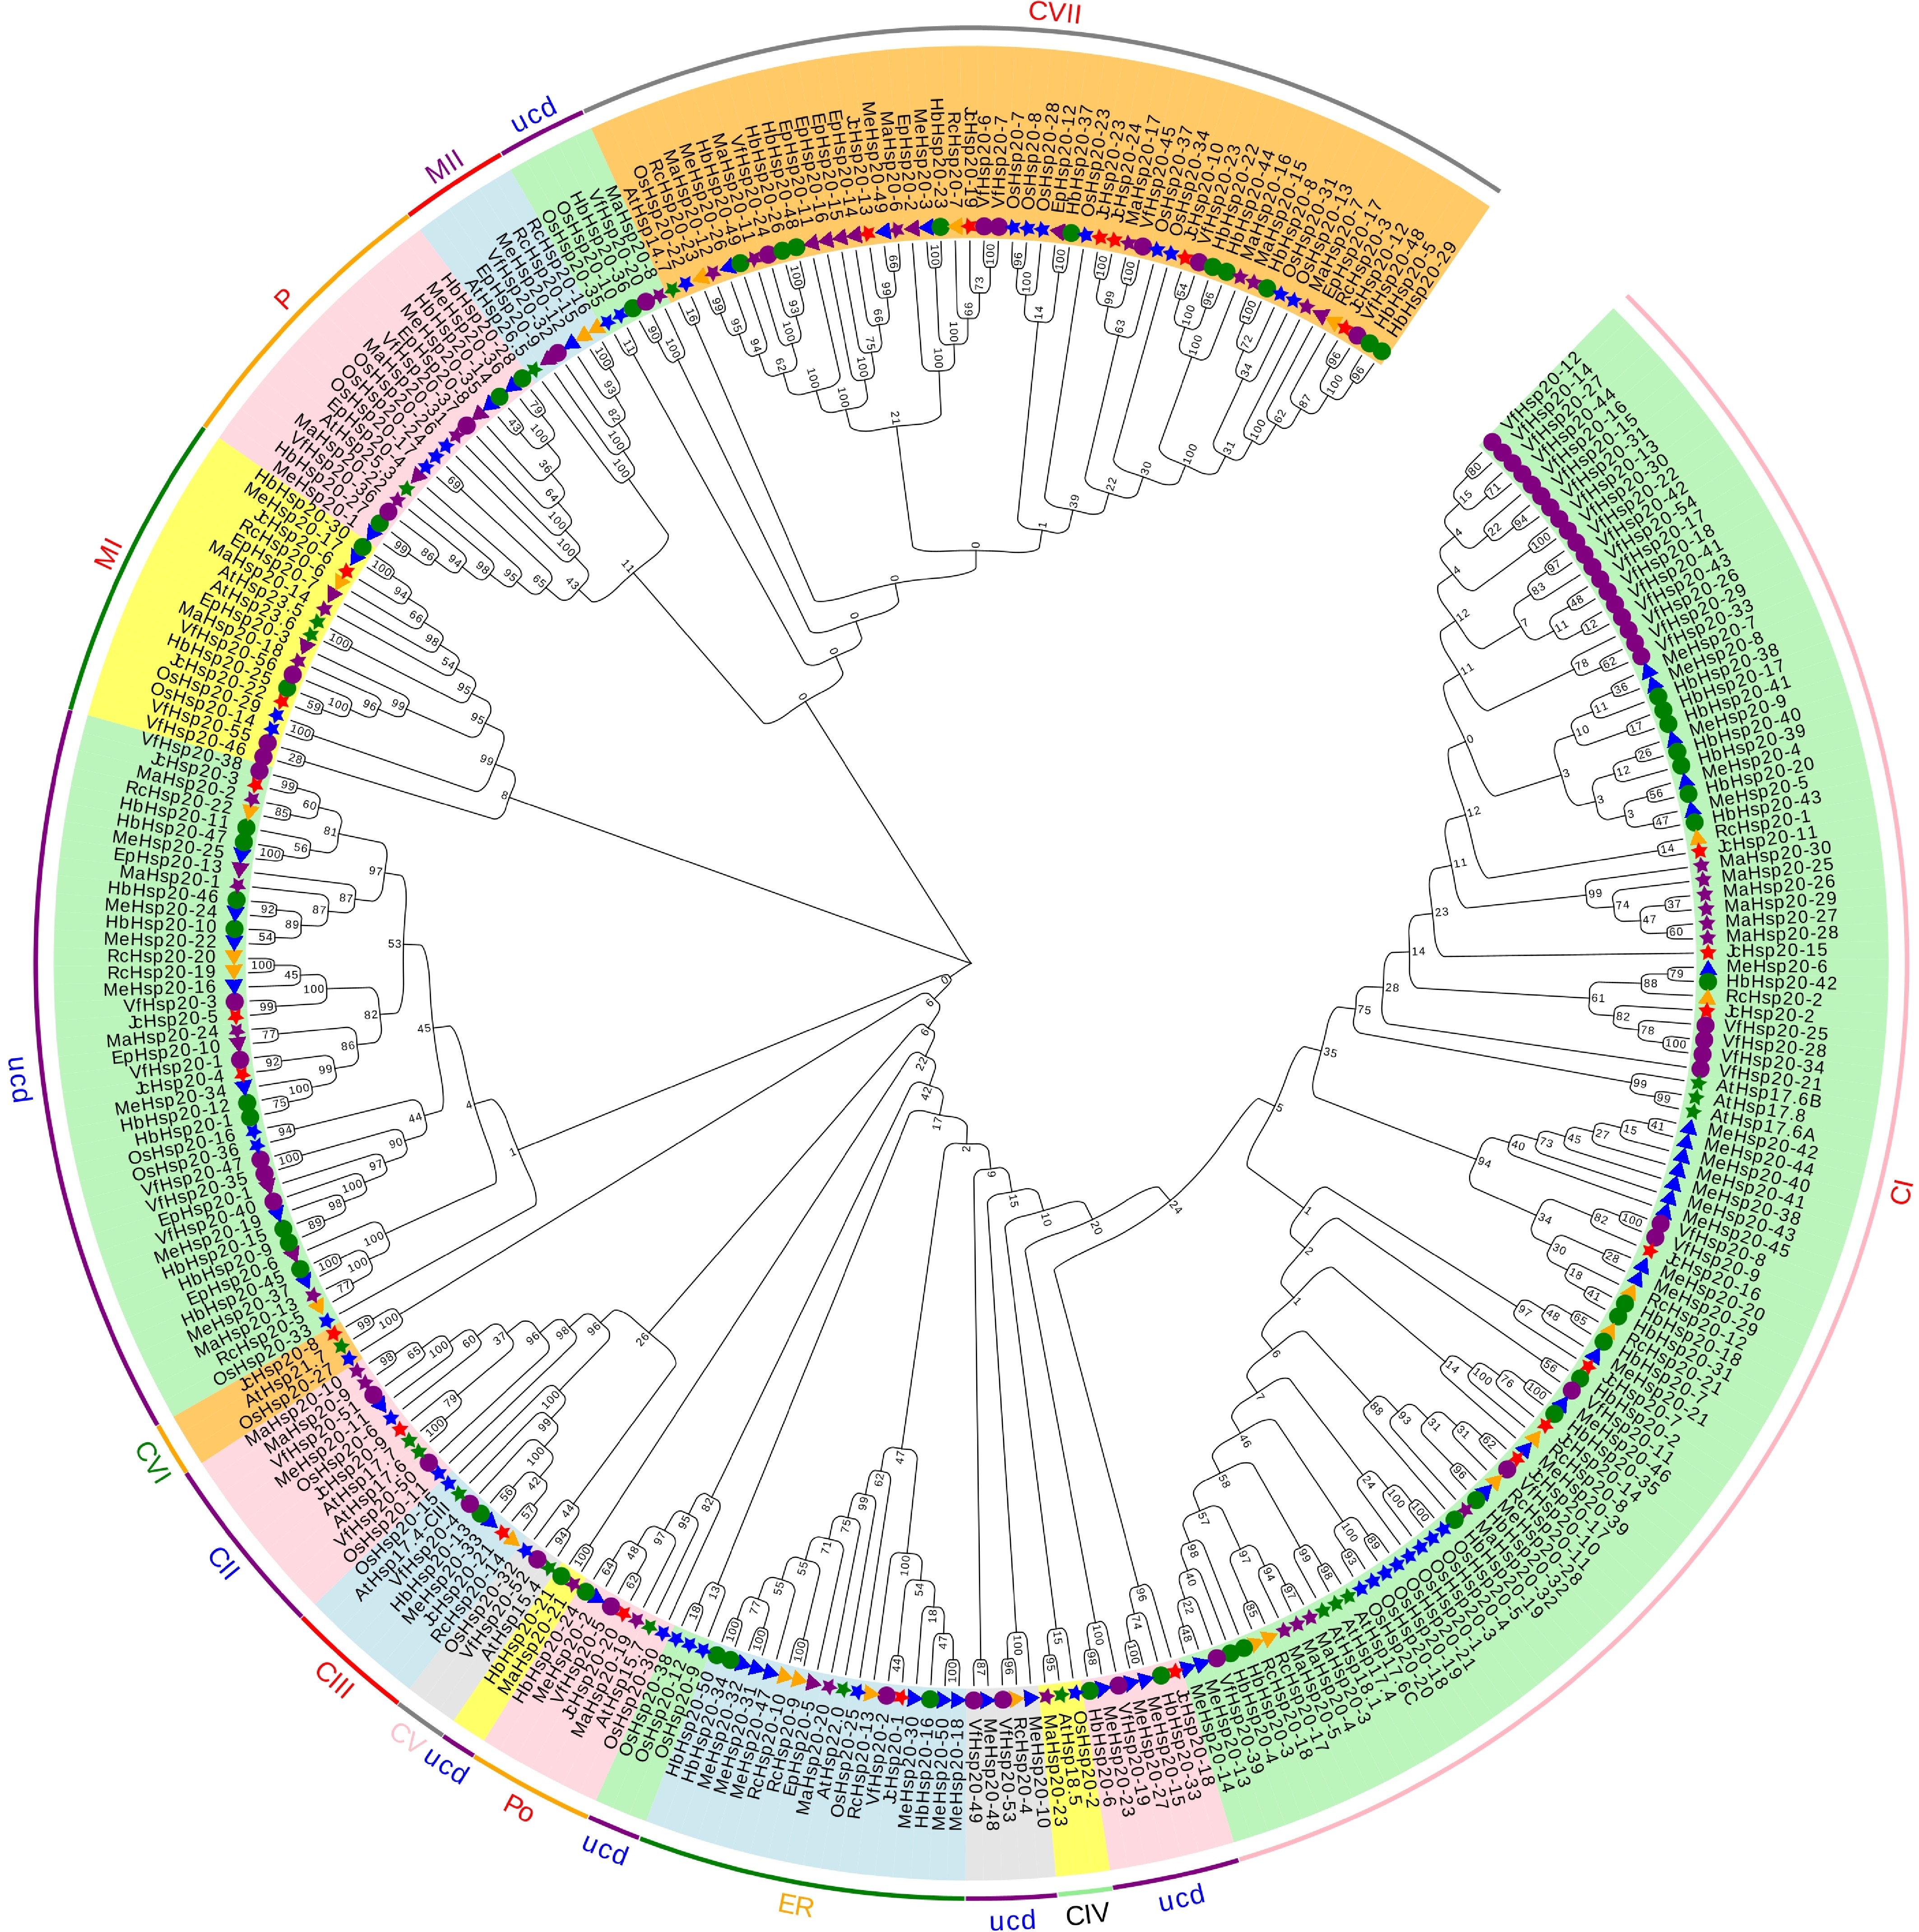
Figure 1.
Unrooted phylogenetic tree of the Hsp20s in seven Euphorbiaceae, rice, and A. thaliana. The Neighbor-joining (NJ) phylogenetic tree was inferred using MEGA 7.1. Different colors represent different clades. Me, M. esculenta; At, A. thaliana; Rc, R. communis; Jc, J. curcas; Hb, H. brasiliensis; Ep, E. peplus; Ma, M. annua; Vf, V. fordii; Os, O. sativa. Green star, blue star, blue triangle, yellow triangle, red star, green circle, purple triangle, purple star, and purple circle indicate A. thaliana, O. sativa, M. esculenta, R. communis, J. curcas, H. brasiliensis, E. peplus; M. annua; and V. fordii, respectively. CI-CIV: cytoplasm or nucleus; ER: endoplasmic reticulum; Po and P: peroxisomal; MI-MII: mitochondria; ucd: unclassified.
-
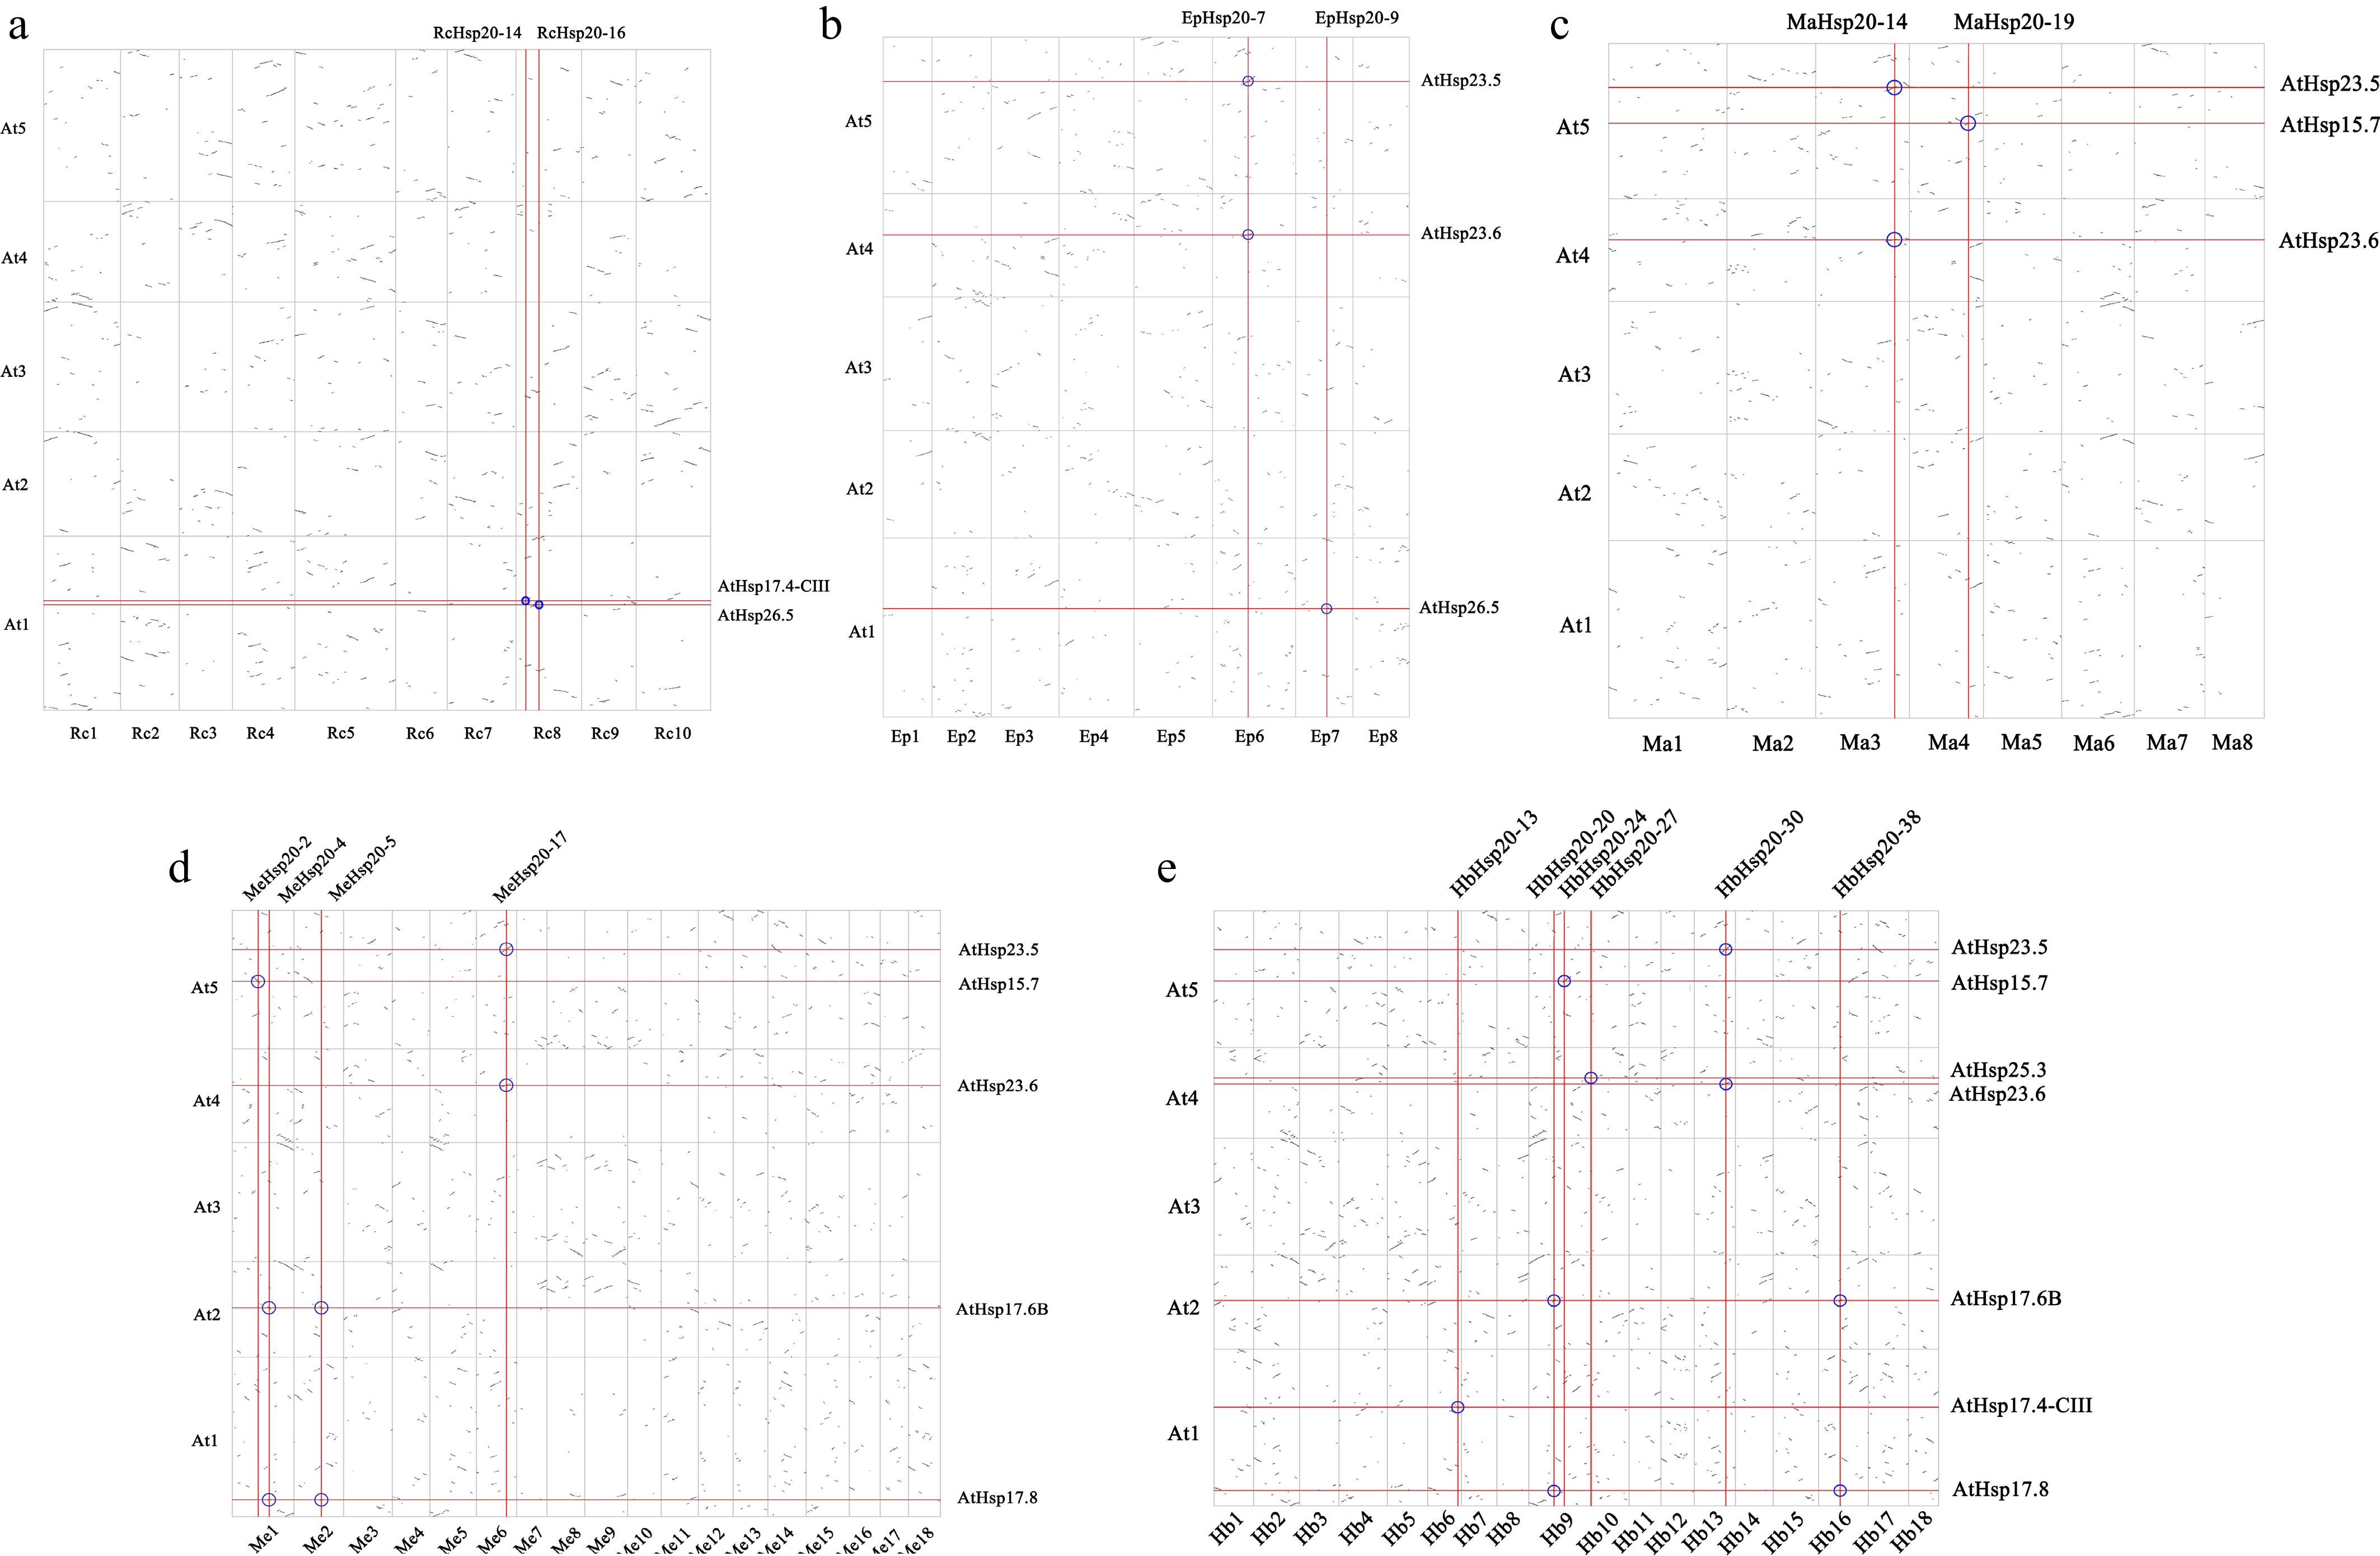
Figure 2.
Genome-wide duplication events between Arabidopsis and Euphorbiaceae. Gene dot plot between At and (a) Rc, (b) Ep, (c) Ma, (d) Me, and (e) Hb. At, A. thaliana; Me, M. esculanta; Rc, R. communis; Hb, H. brasiliensis; Ep, E. peplus; Ma, M. annua.
-
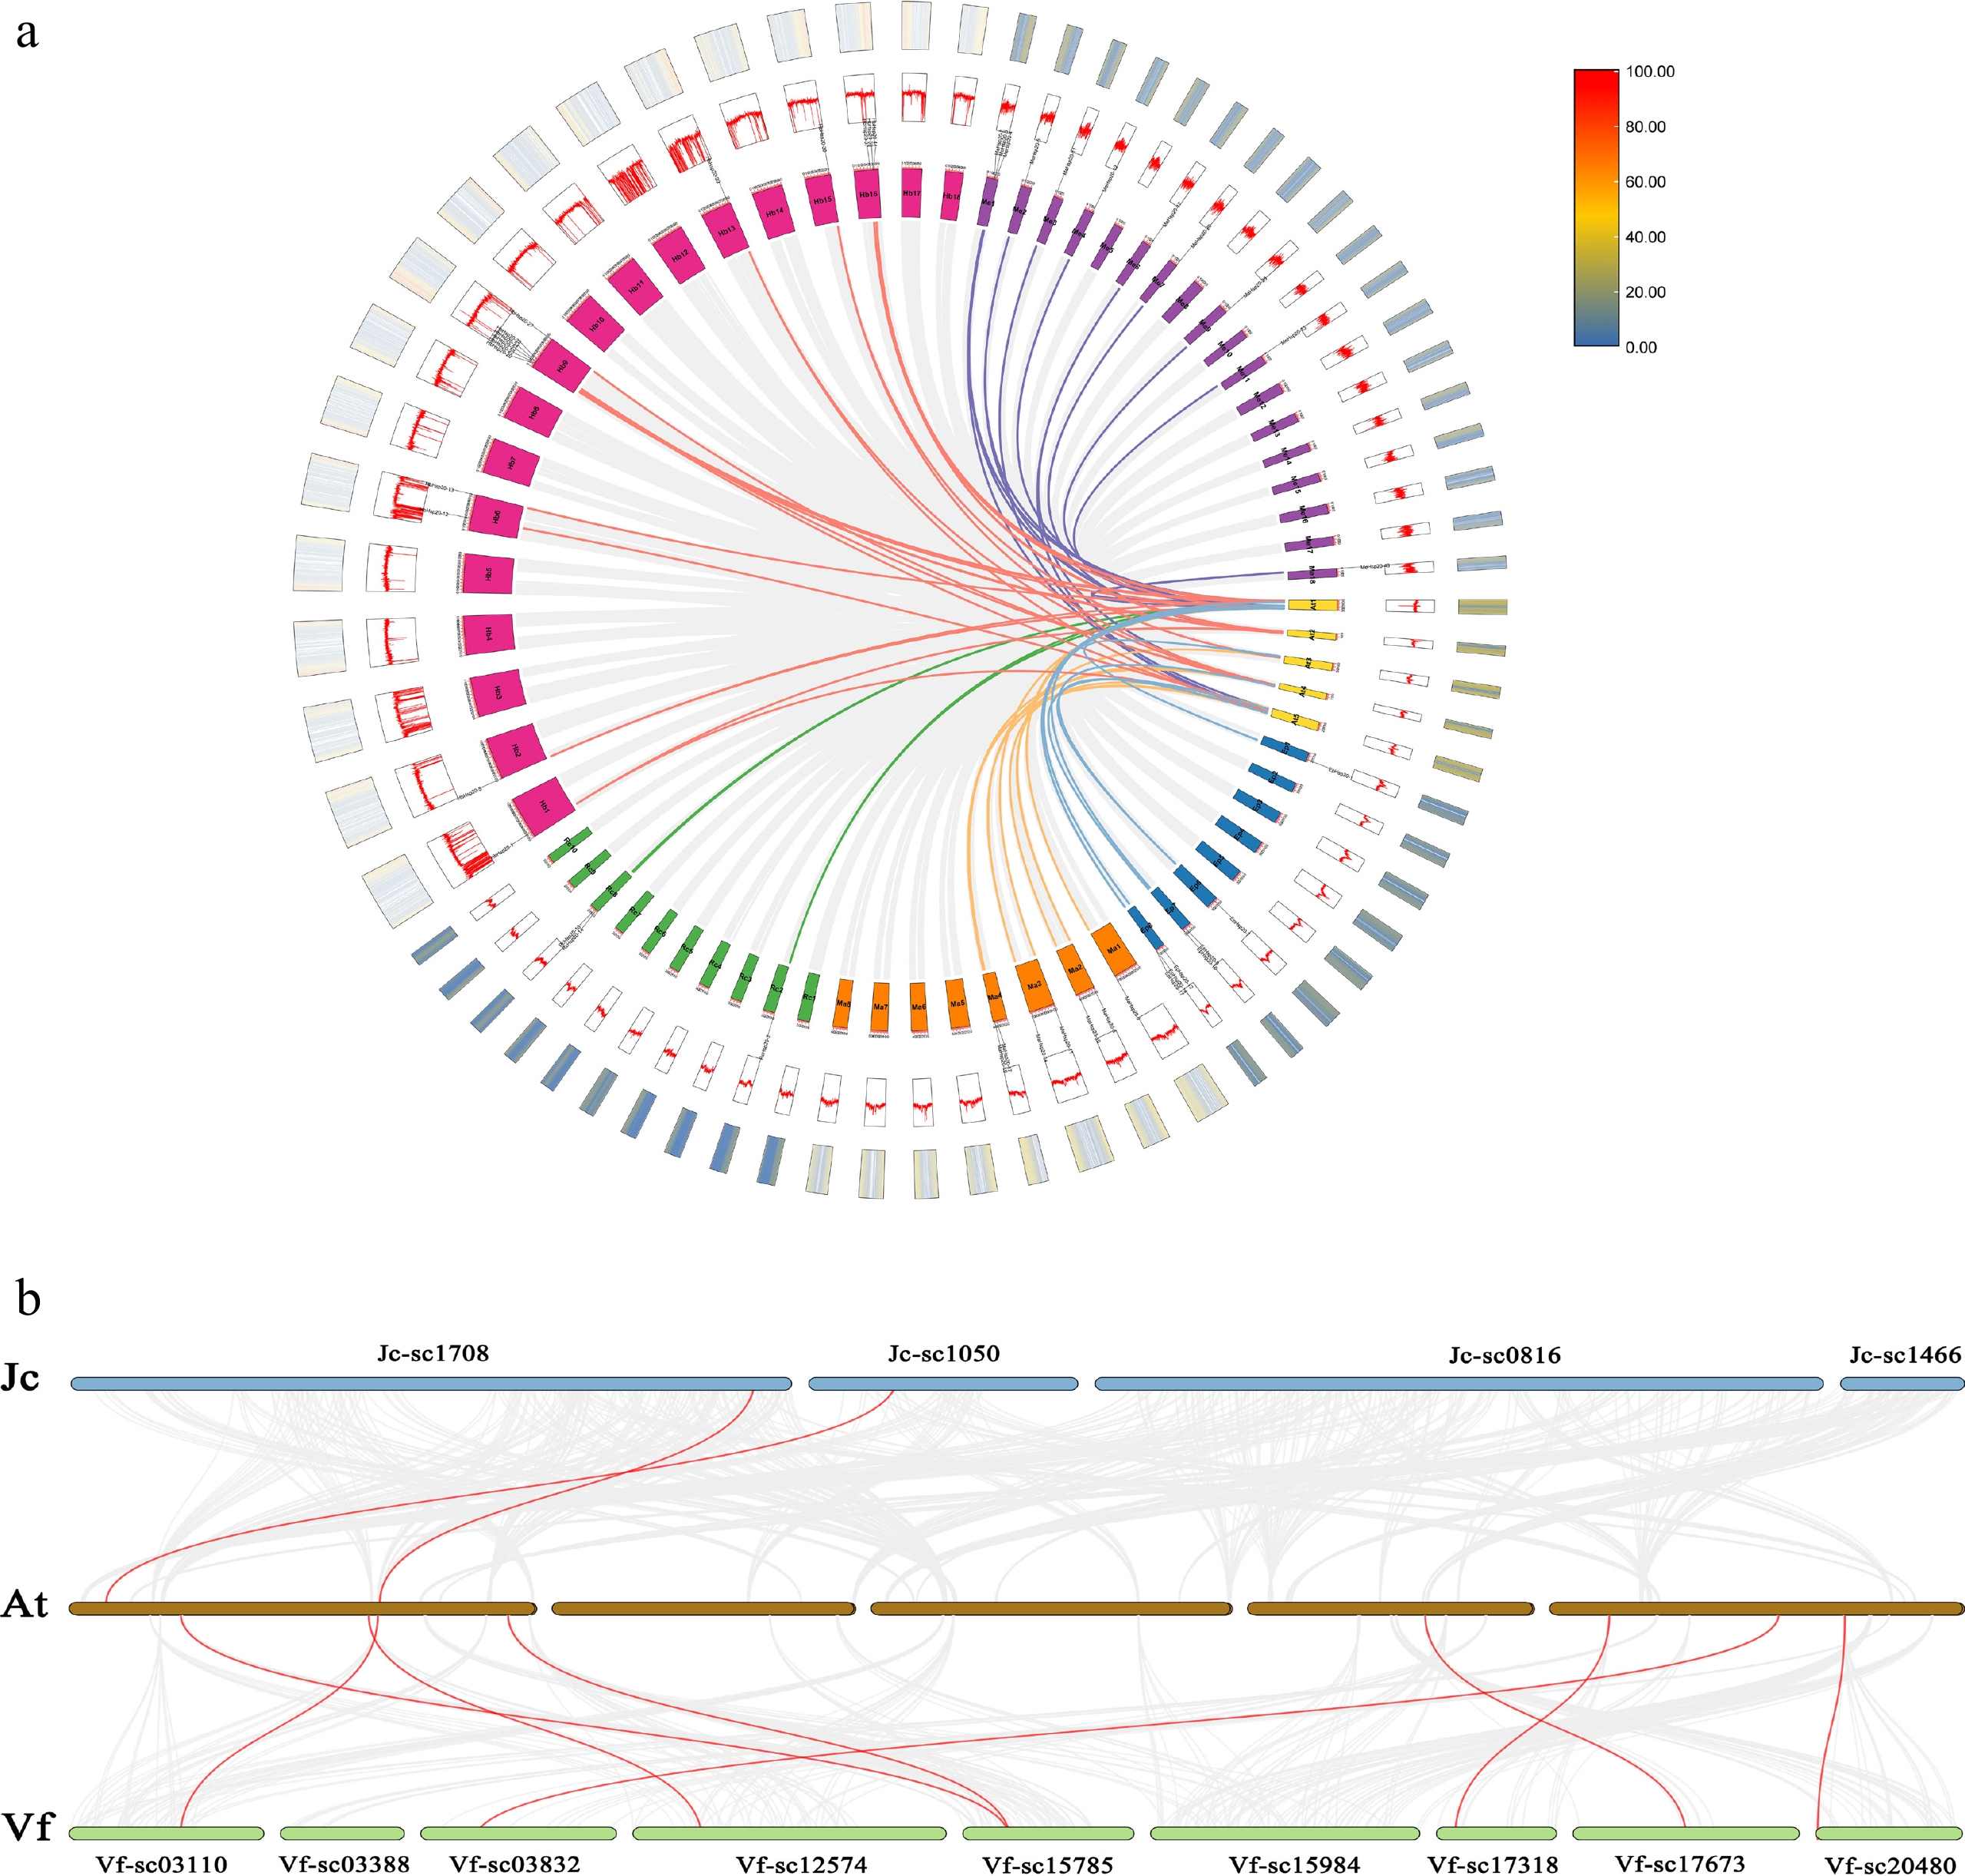
Figure 3.
Synteny relationships of Hsp20 genes between A. thaliana and Euphorbiaceae. (a) Synteny analysis of Hsp20 genes between Rc, Hb, Me, Ep, Ma, and A. thaliana. (b) Synteny analysis of Hsp20 genes between A. thaliana and physic nut, tung tree. Species chromosomal-level genome assemblies were co-mapped. Jc and Vf, with genome assembly at the scaffold level, were analyzed and drawn using scaffolds containing the Hsp20s. The A. thaliana, castor bean, rubber tree, cassava, E. peplus, and M. annua are labeled At, Rc, Hb, Me, Ep, and Ma in a circle diagram. At, Rc, Hb, Me, Ep, and Ma are shown in yellow, green, pink, purple, blue, and orange. The blue, green, and brown scaffolds and chromosomes represent physic nut, tung tree, and A. thaliana.
-
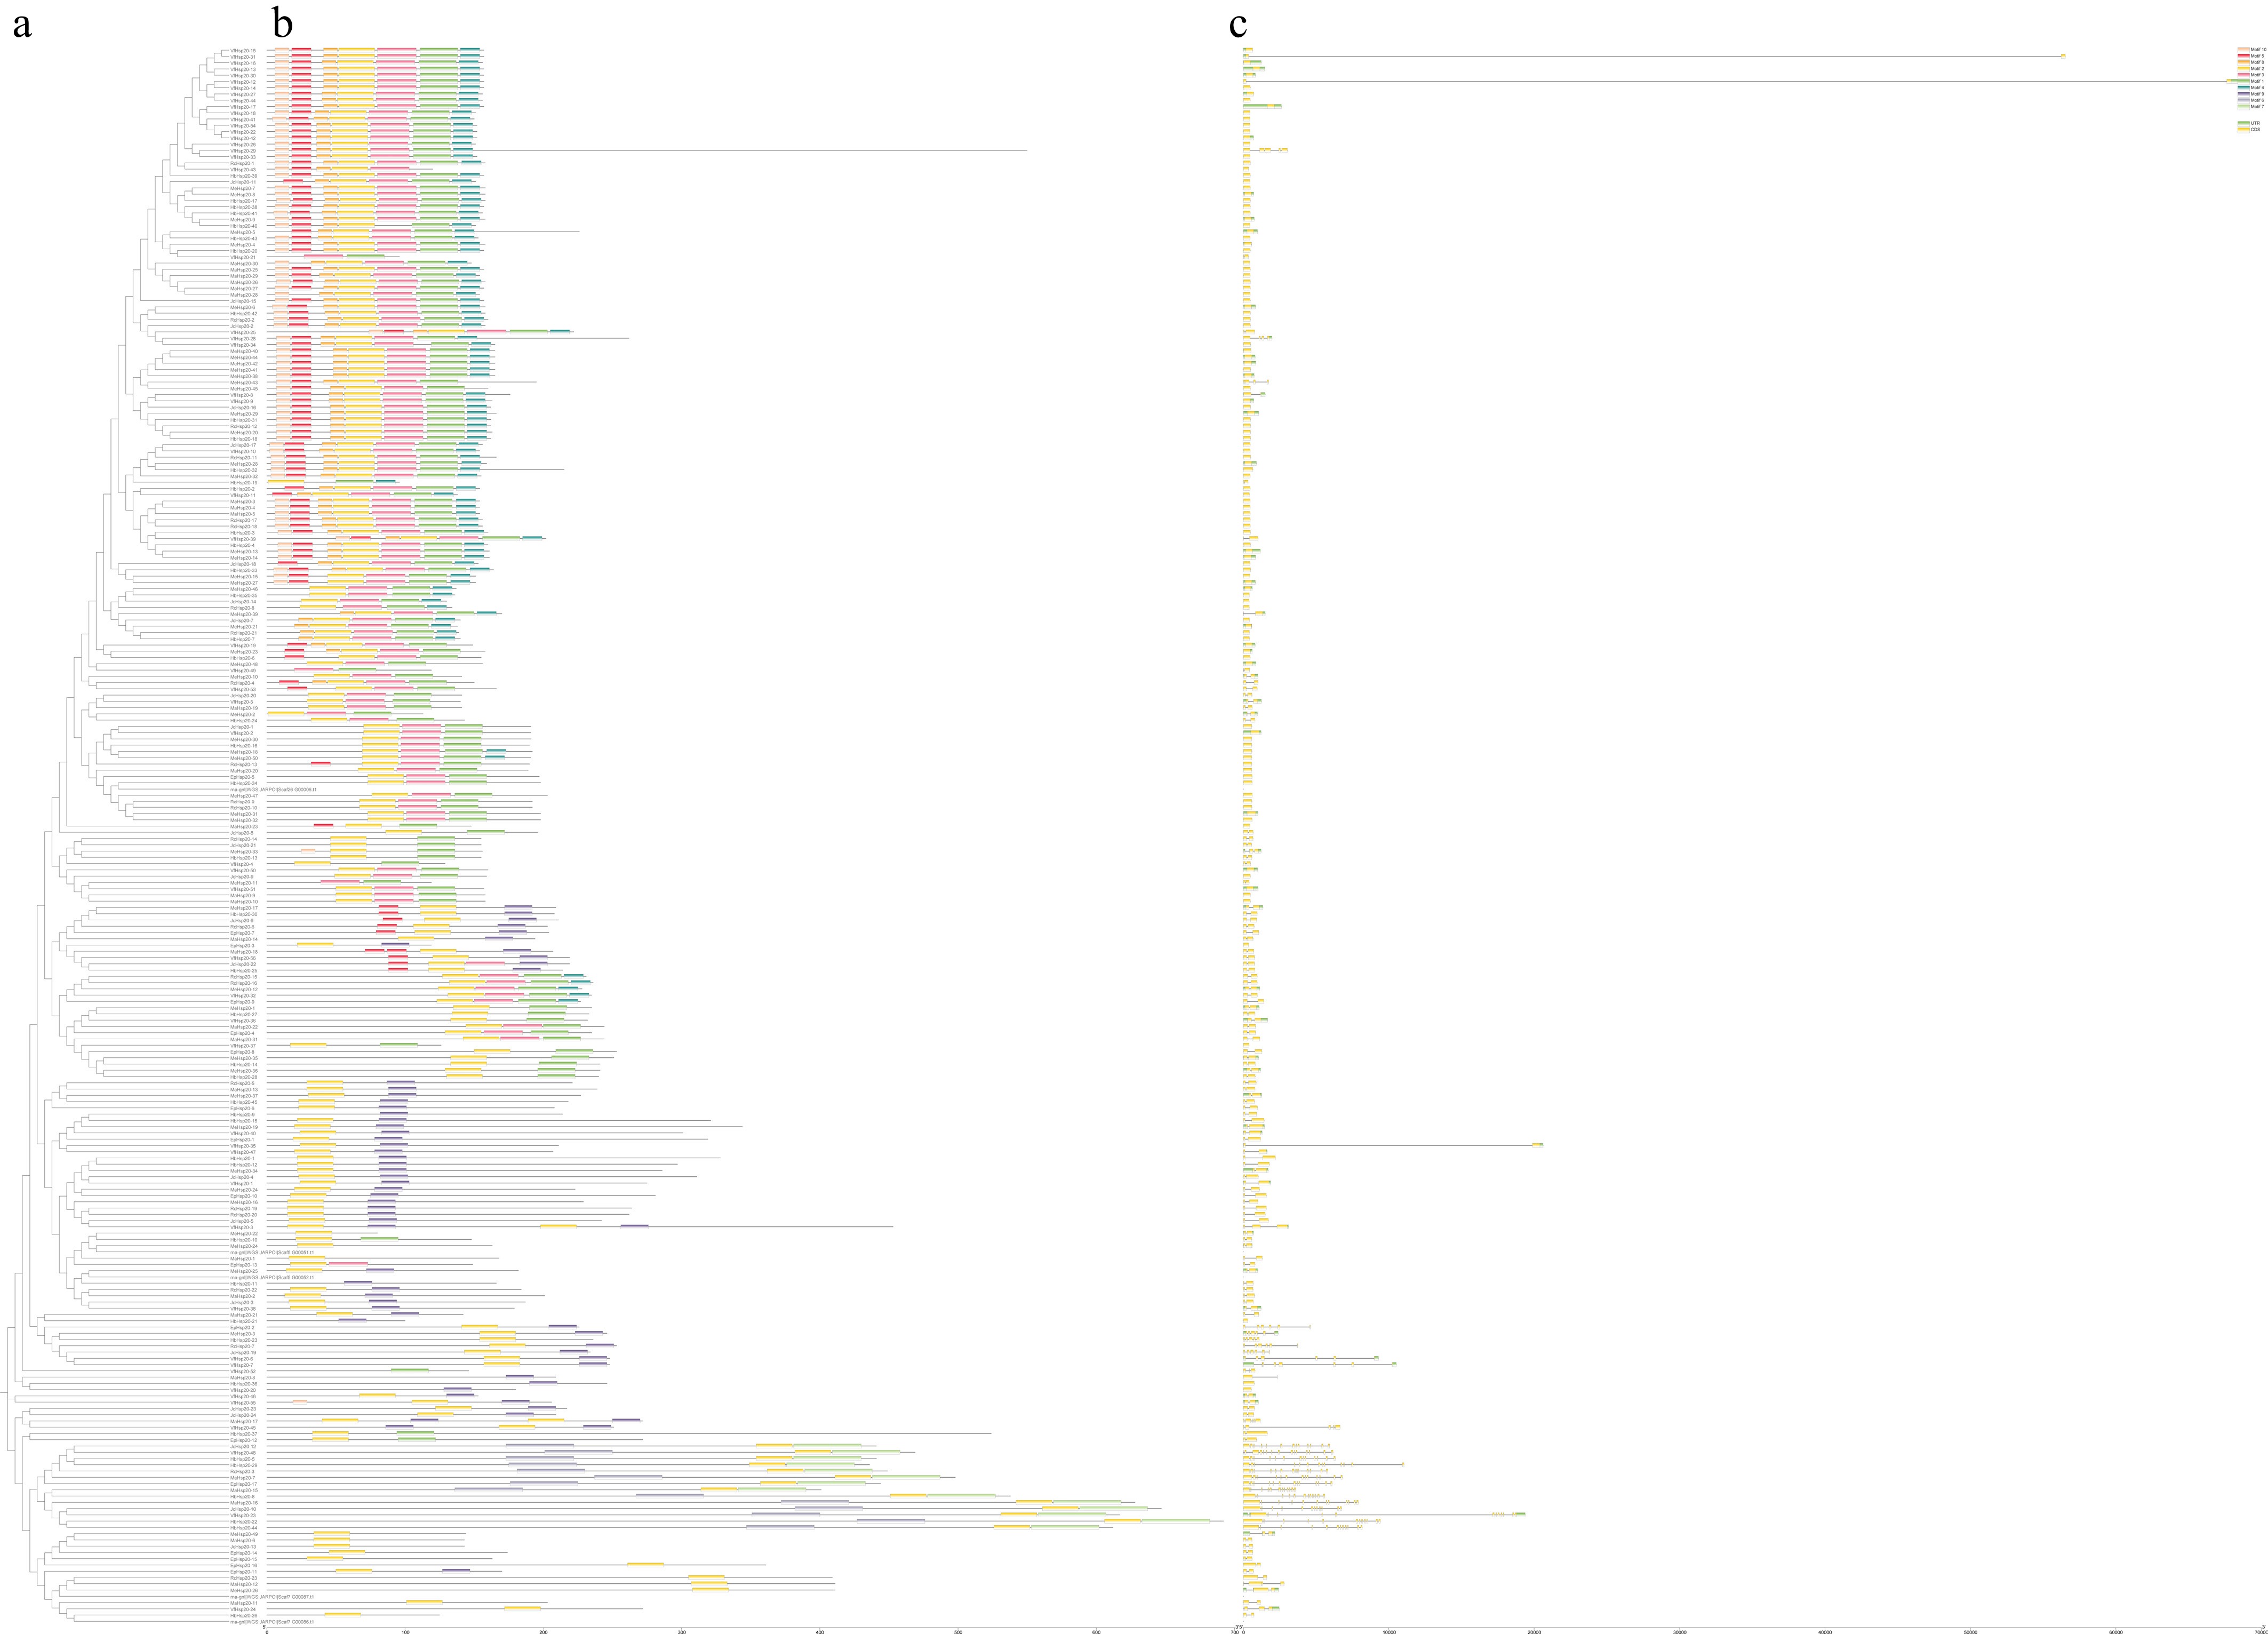
Figure 4.
Phylogenetic tree and conserved motifs of Hsp20 genes of Euphorbiaceae. (a) The phylogenetic tree of Hsp20 genes of seven Euphorbiaceae species; (b) the motif compositions of Hsp20s; (c) the conserved motif contained an ACD domain. Numbers on the X-axis represent the position of the amino acids. The relative frequency of amino acids in the motif is expressed in font size. The Motif logos are Motif 2, 3, 4, and 9 from top to bottom. The color boxes in Motif 2 represent the β2, β3, and β4; Motif 3 represents the β5, β6, and β7; Motif 4 represents the β5; and Motif 9 represent the β9 of the ACD structure.
-
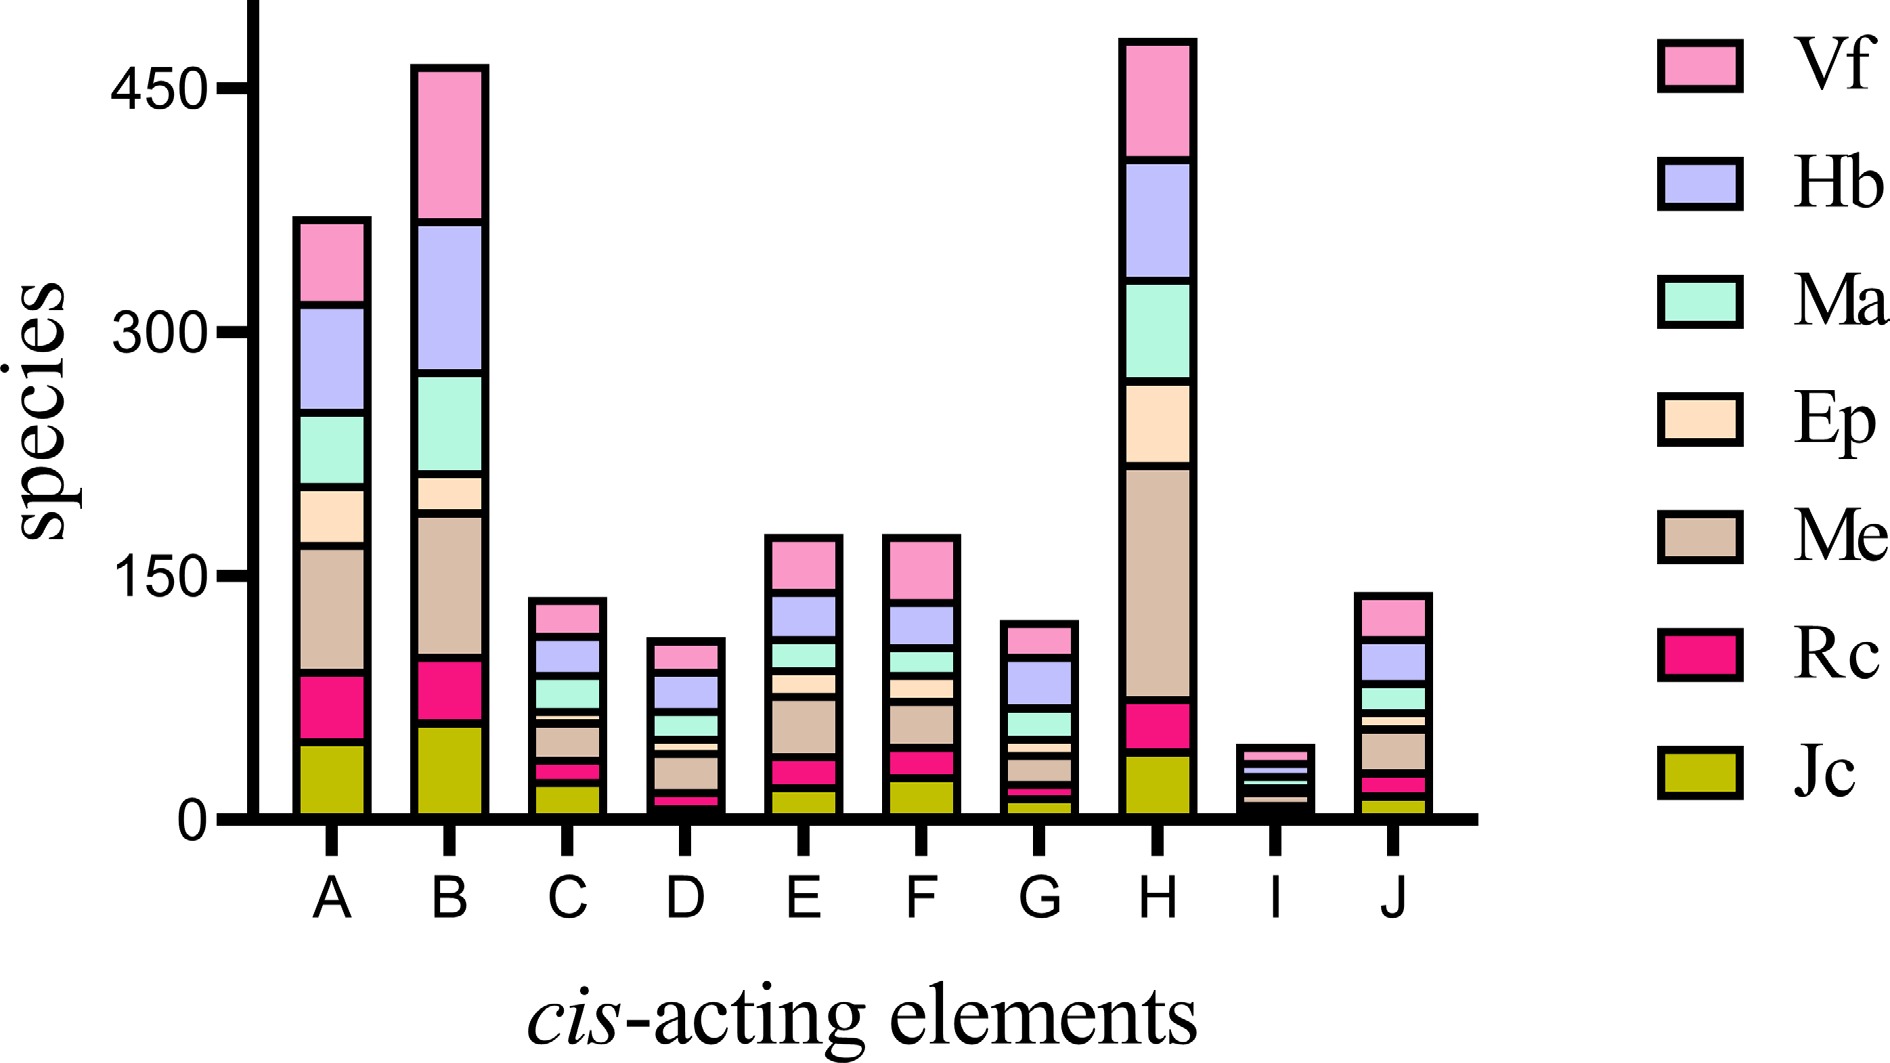
Figure 5.
Cis-acting element distribution in the promoter of Hsp20s. The number of cis-acting elements in different species is shown in different colors. A–J represent different cis-acting elements. A: abscisic acid responsiveness; B: anaerobic induction; C: auxin responsiveness; D: defense and stress responsiveness; E: drought inducibility; F: gibberellin responsiveness; G: low-temperature responsiveness; H: MeJA-responsiveness; I: MYB binding site; J: salicylic acid responsiveness.
-
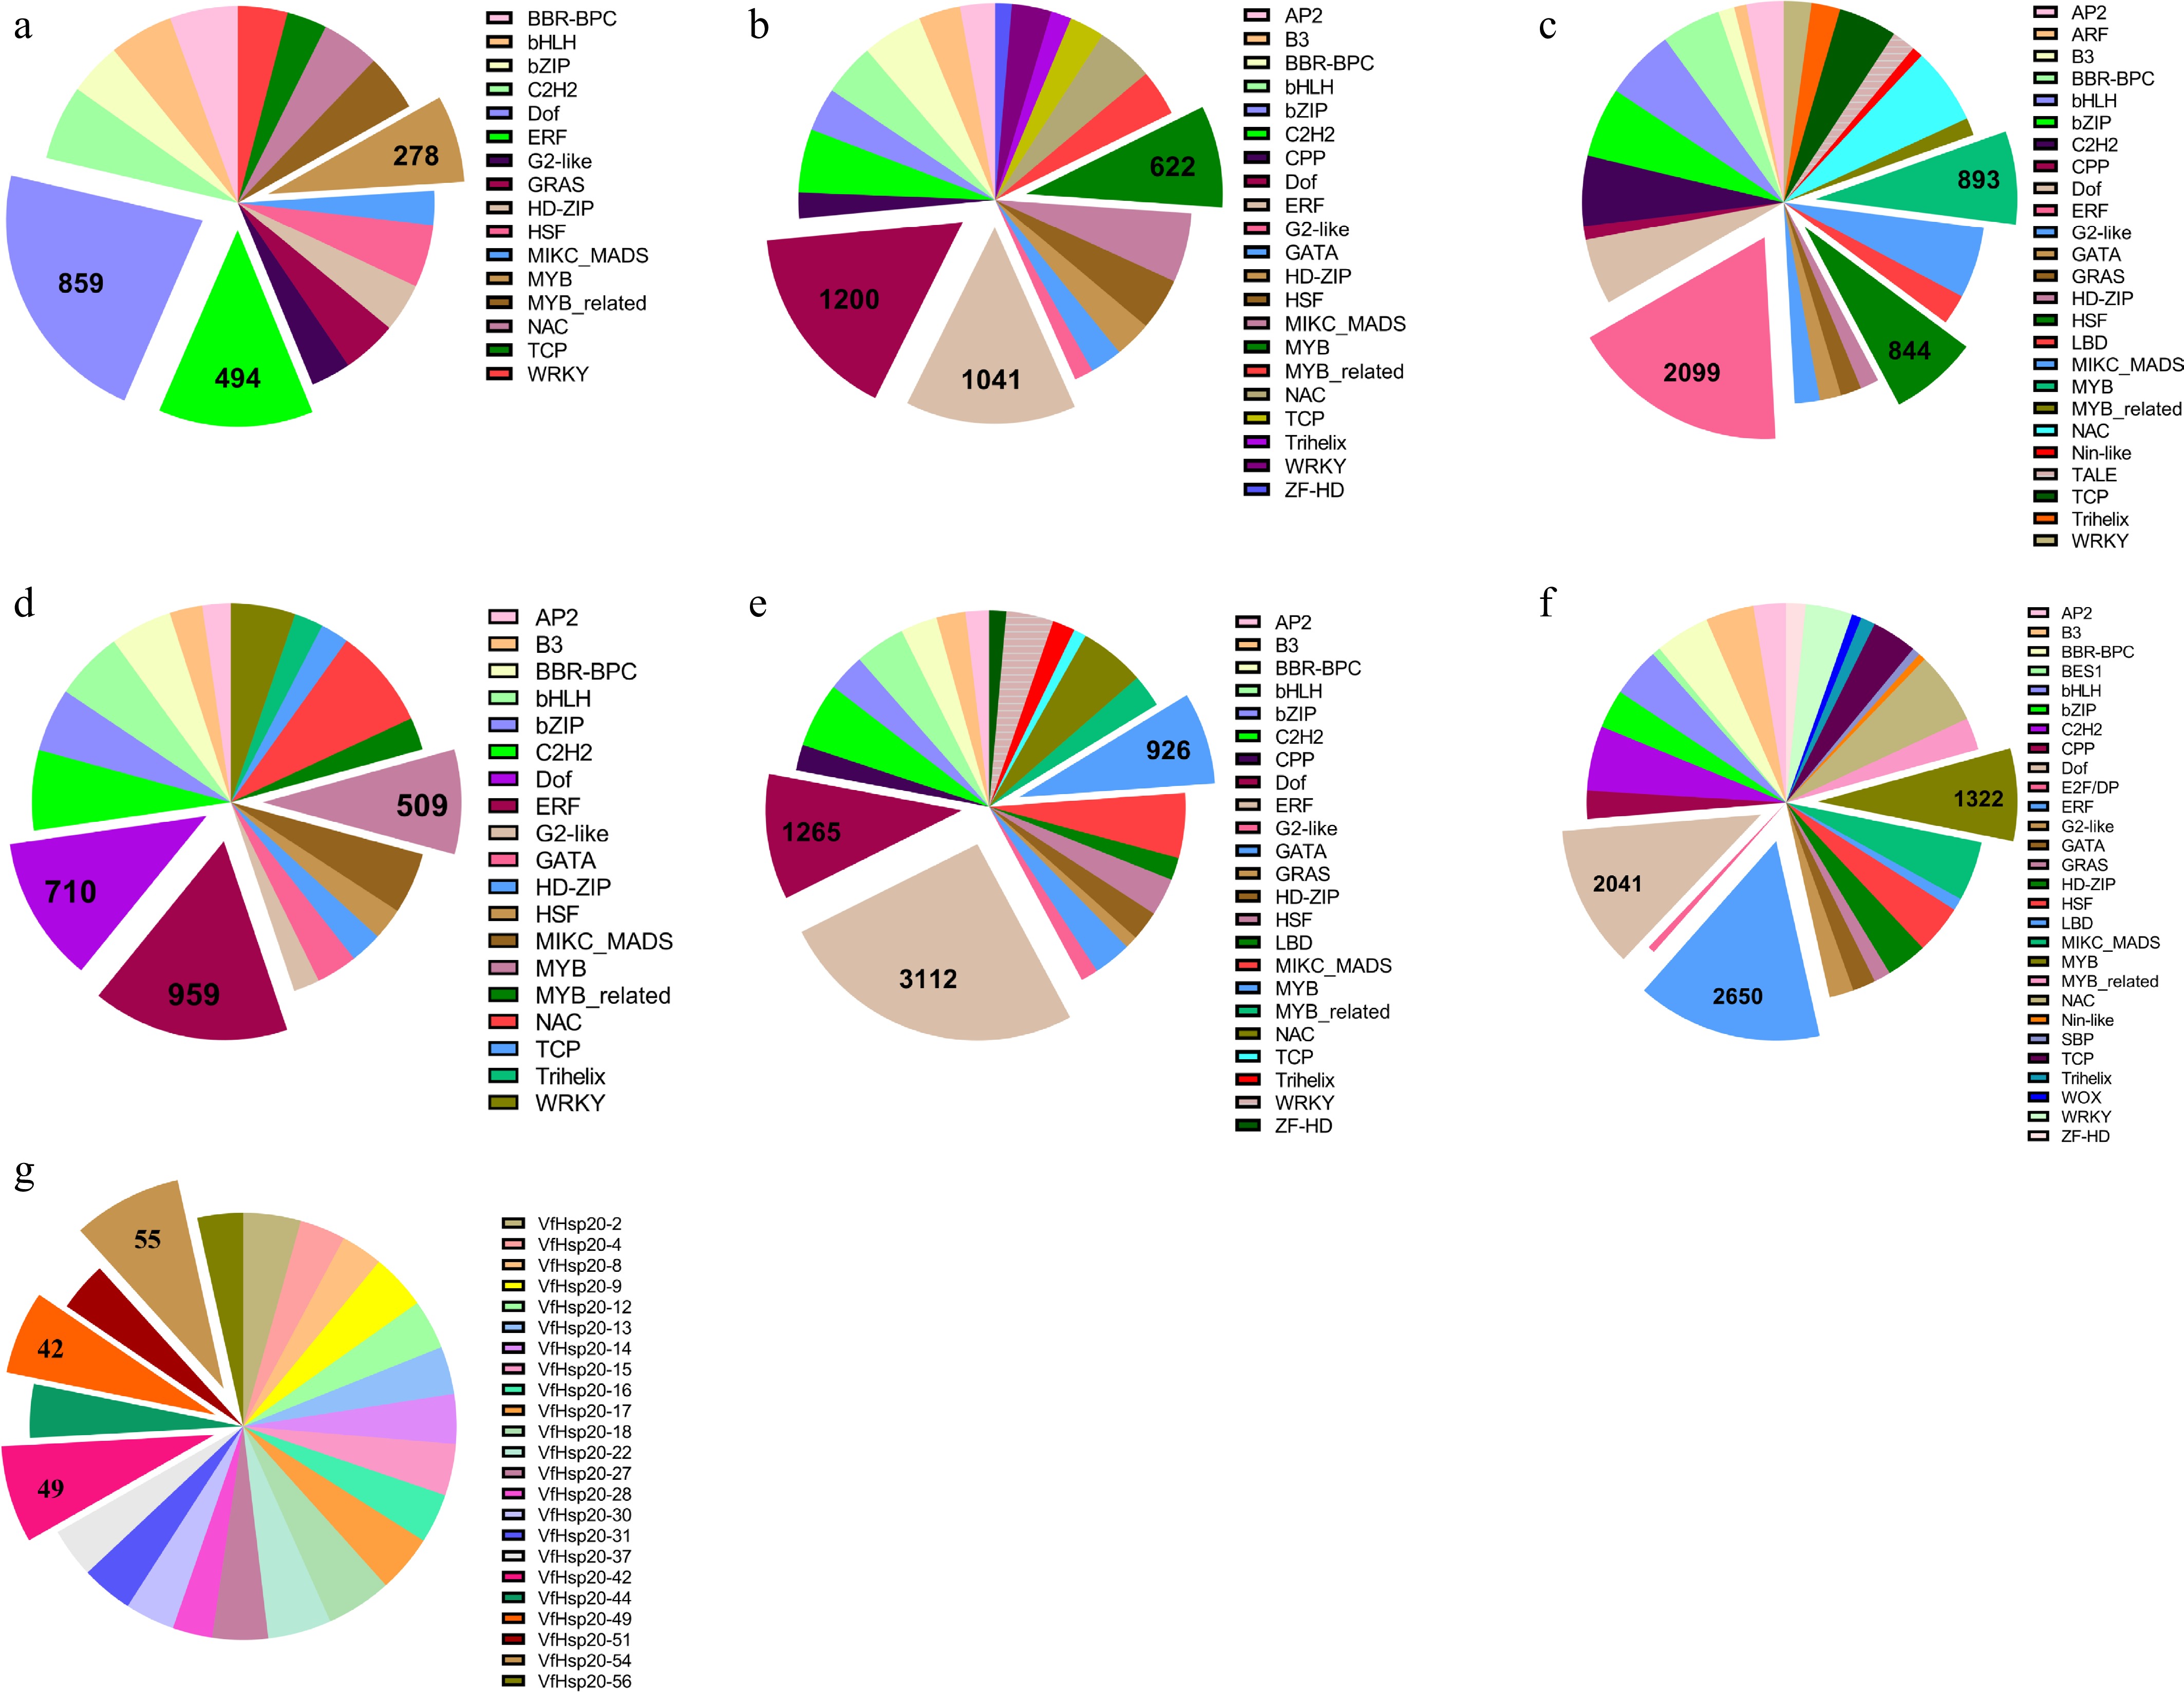
Figure 6.
Composition of predicted transcription factor binding sites in Hsp20s. The abundance of different transcription factors is displayed on the pie chart. (a) J. curcas; (b) R. communis; (c) M. esculenta; (d) E. peplus; (e) M. annua; (f) H. brasiliensis; and (g) V. fordii.
-
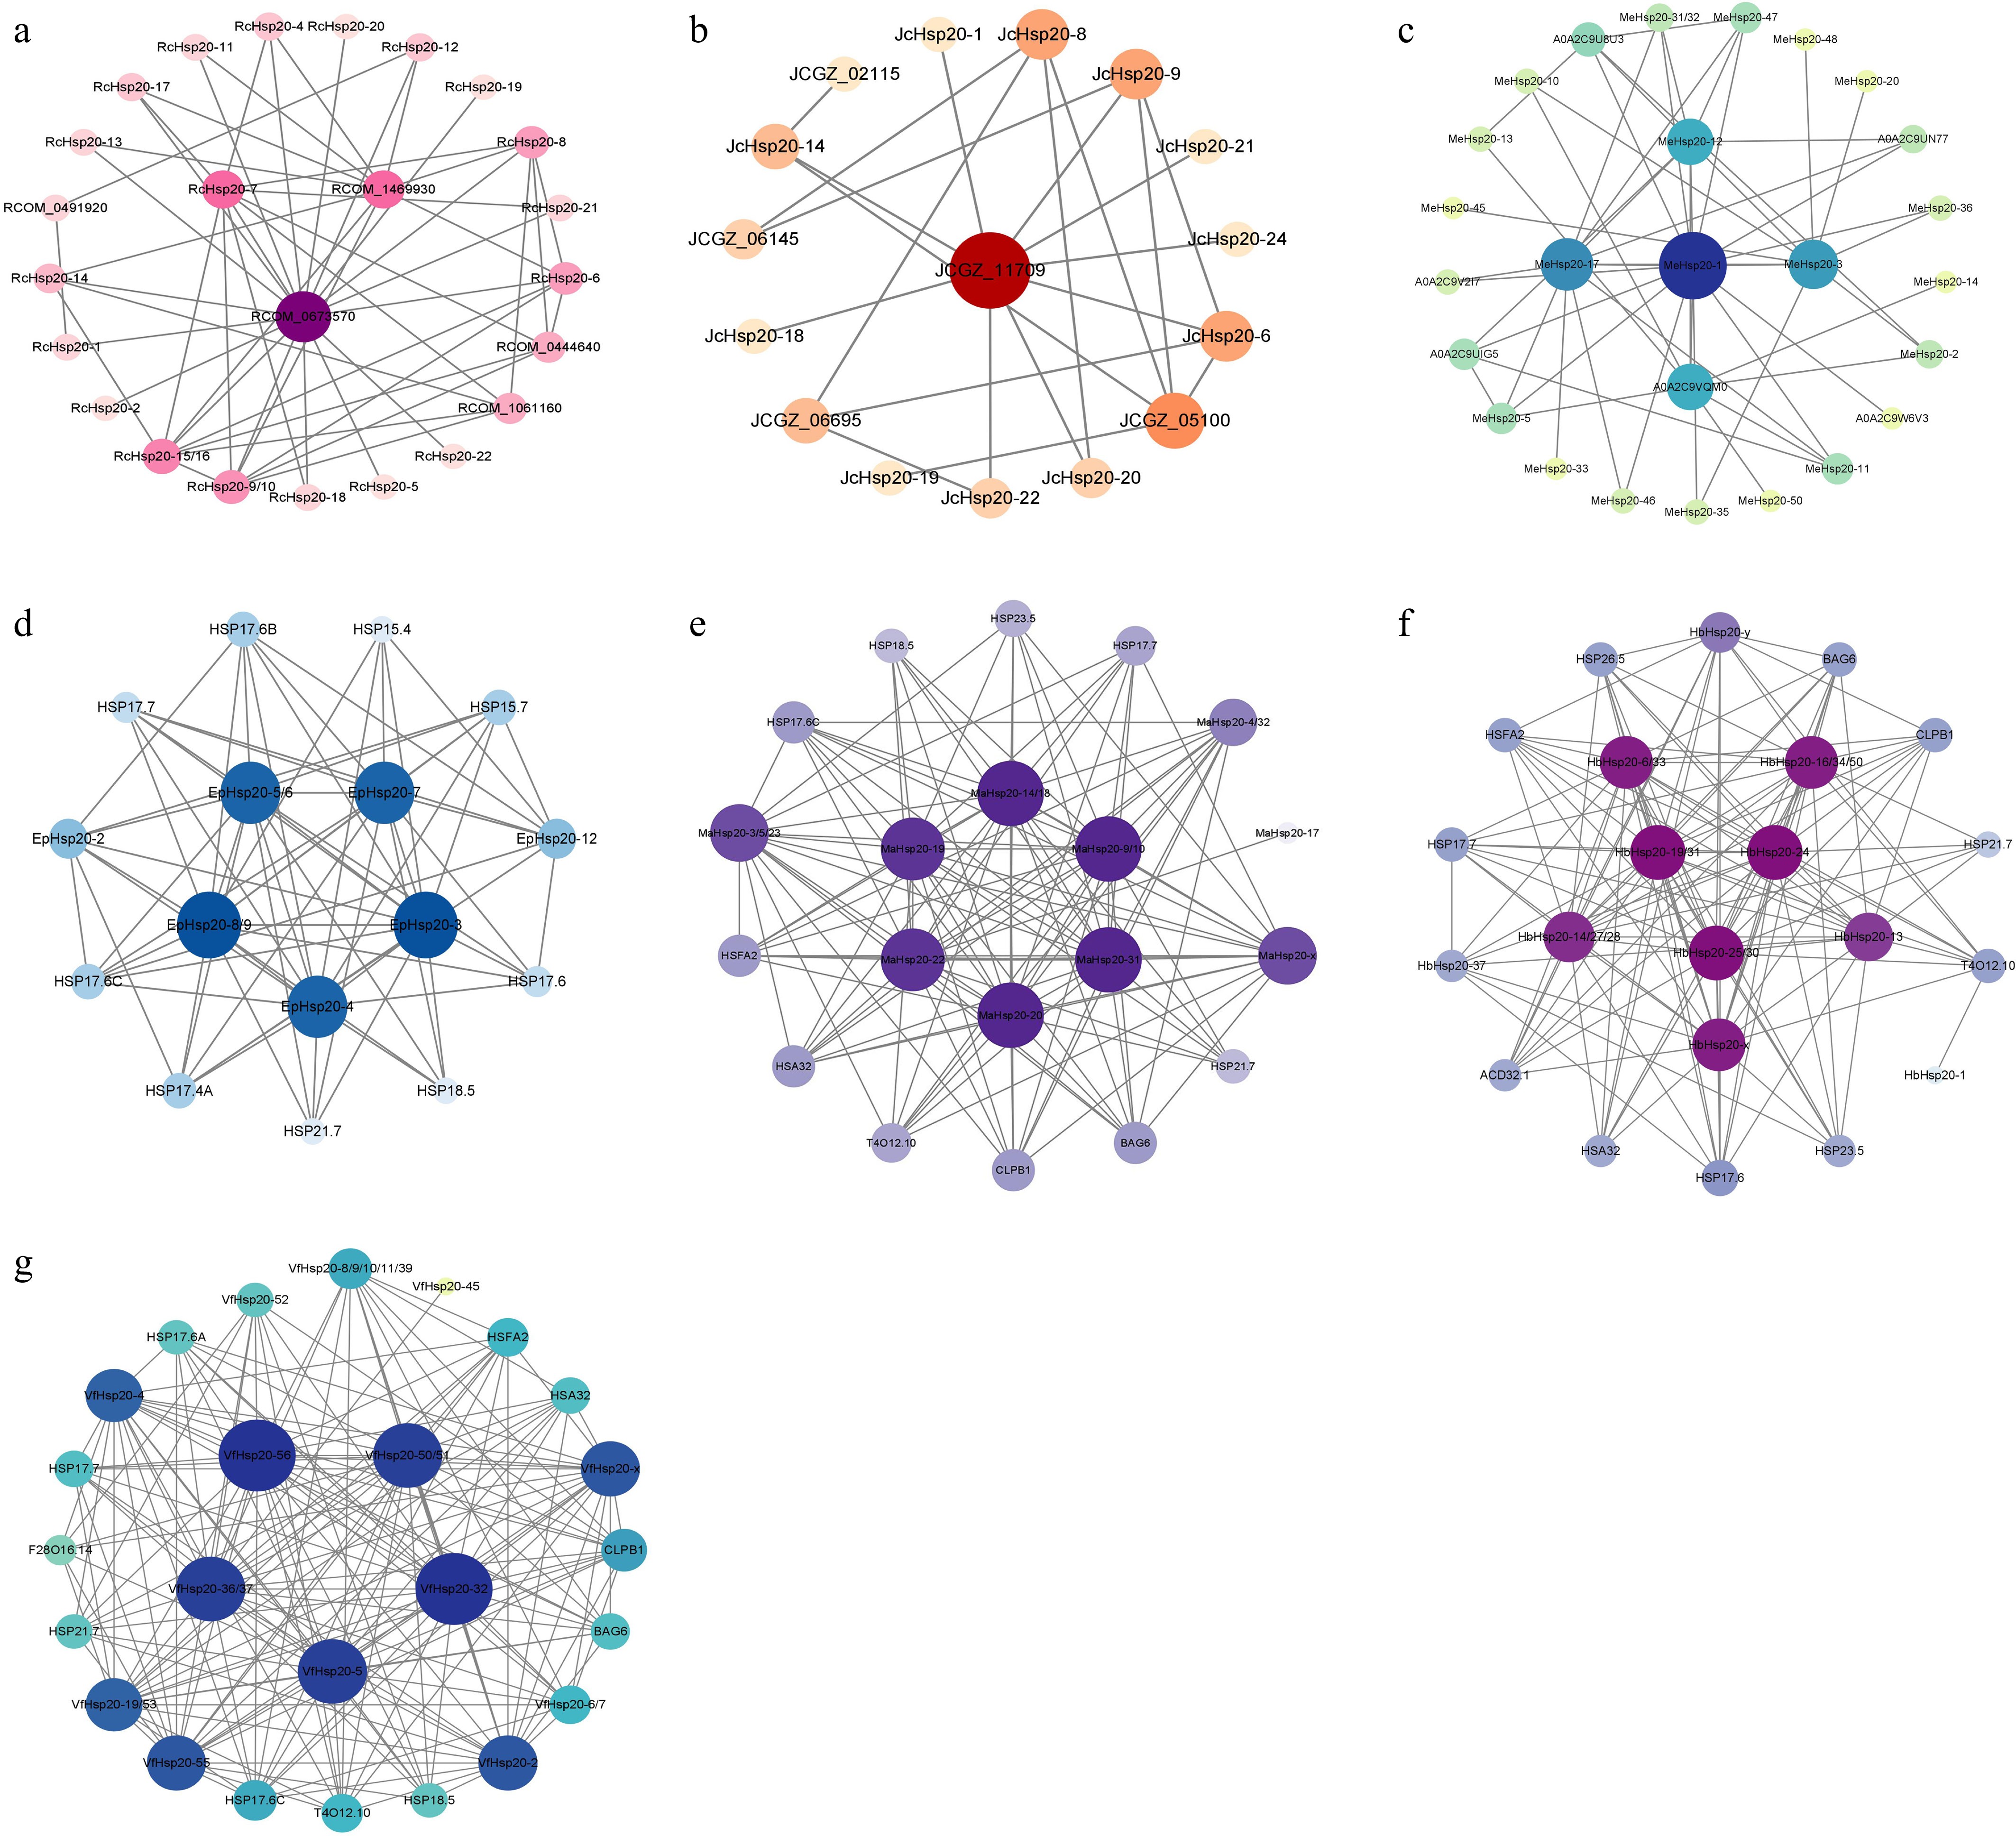
Figure 7.
PPI network of Hsp20 proteins. Circle size and color depth correspond to the number of interacting proteins. (a) R. communis; (b) J. curcas; (c) M. esculenta; (d) E. peplus; (e) M. annua; (f) H. brasiliensis; and (g) V. fordii.
-
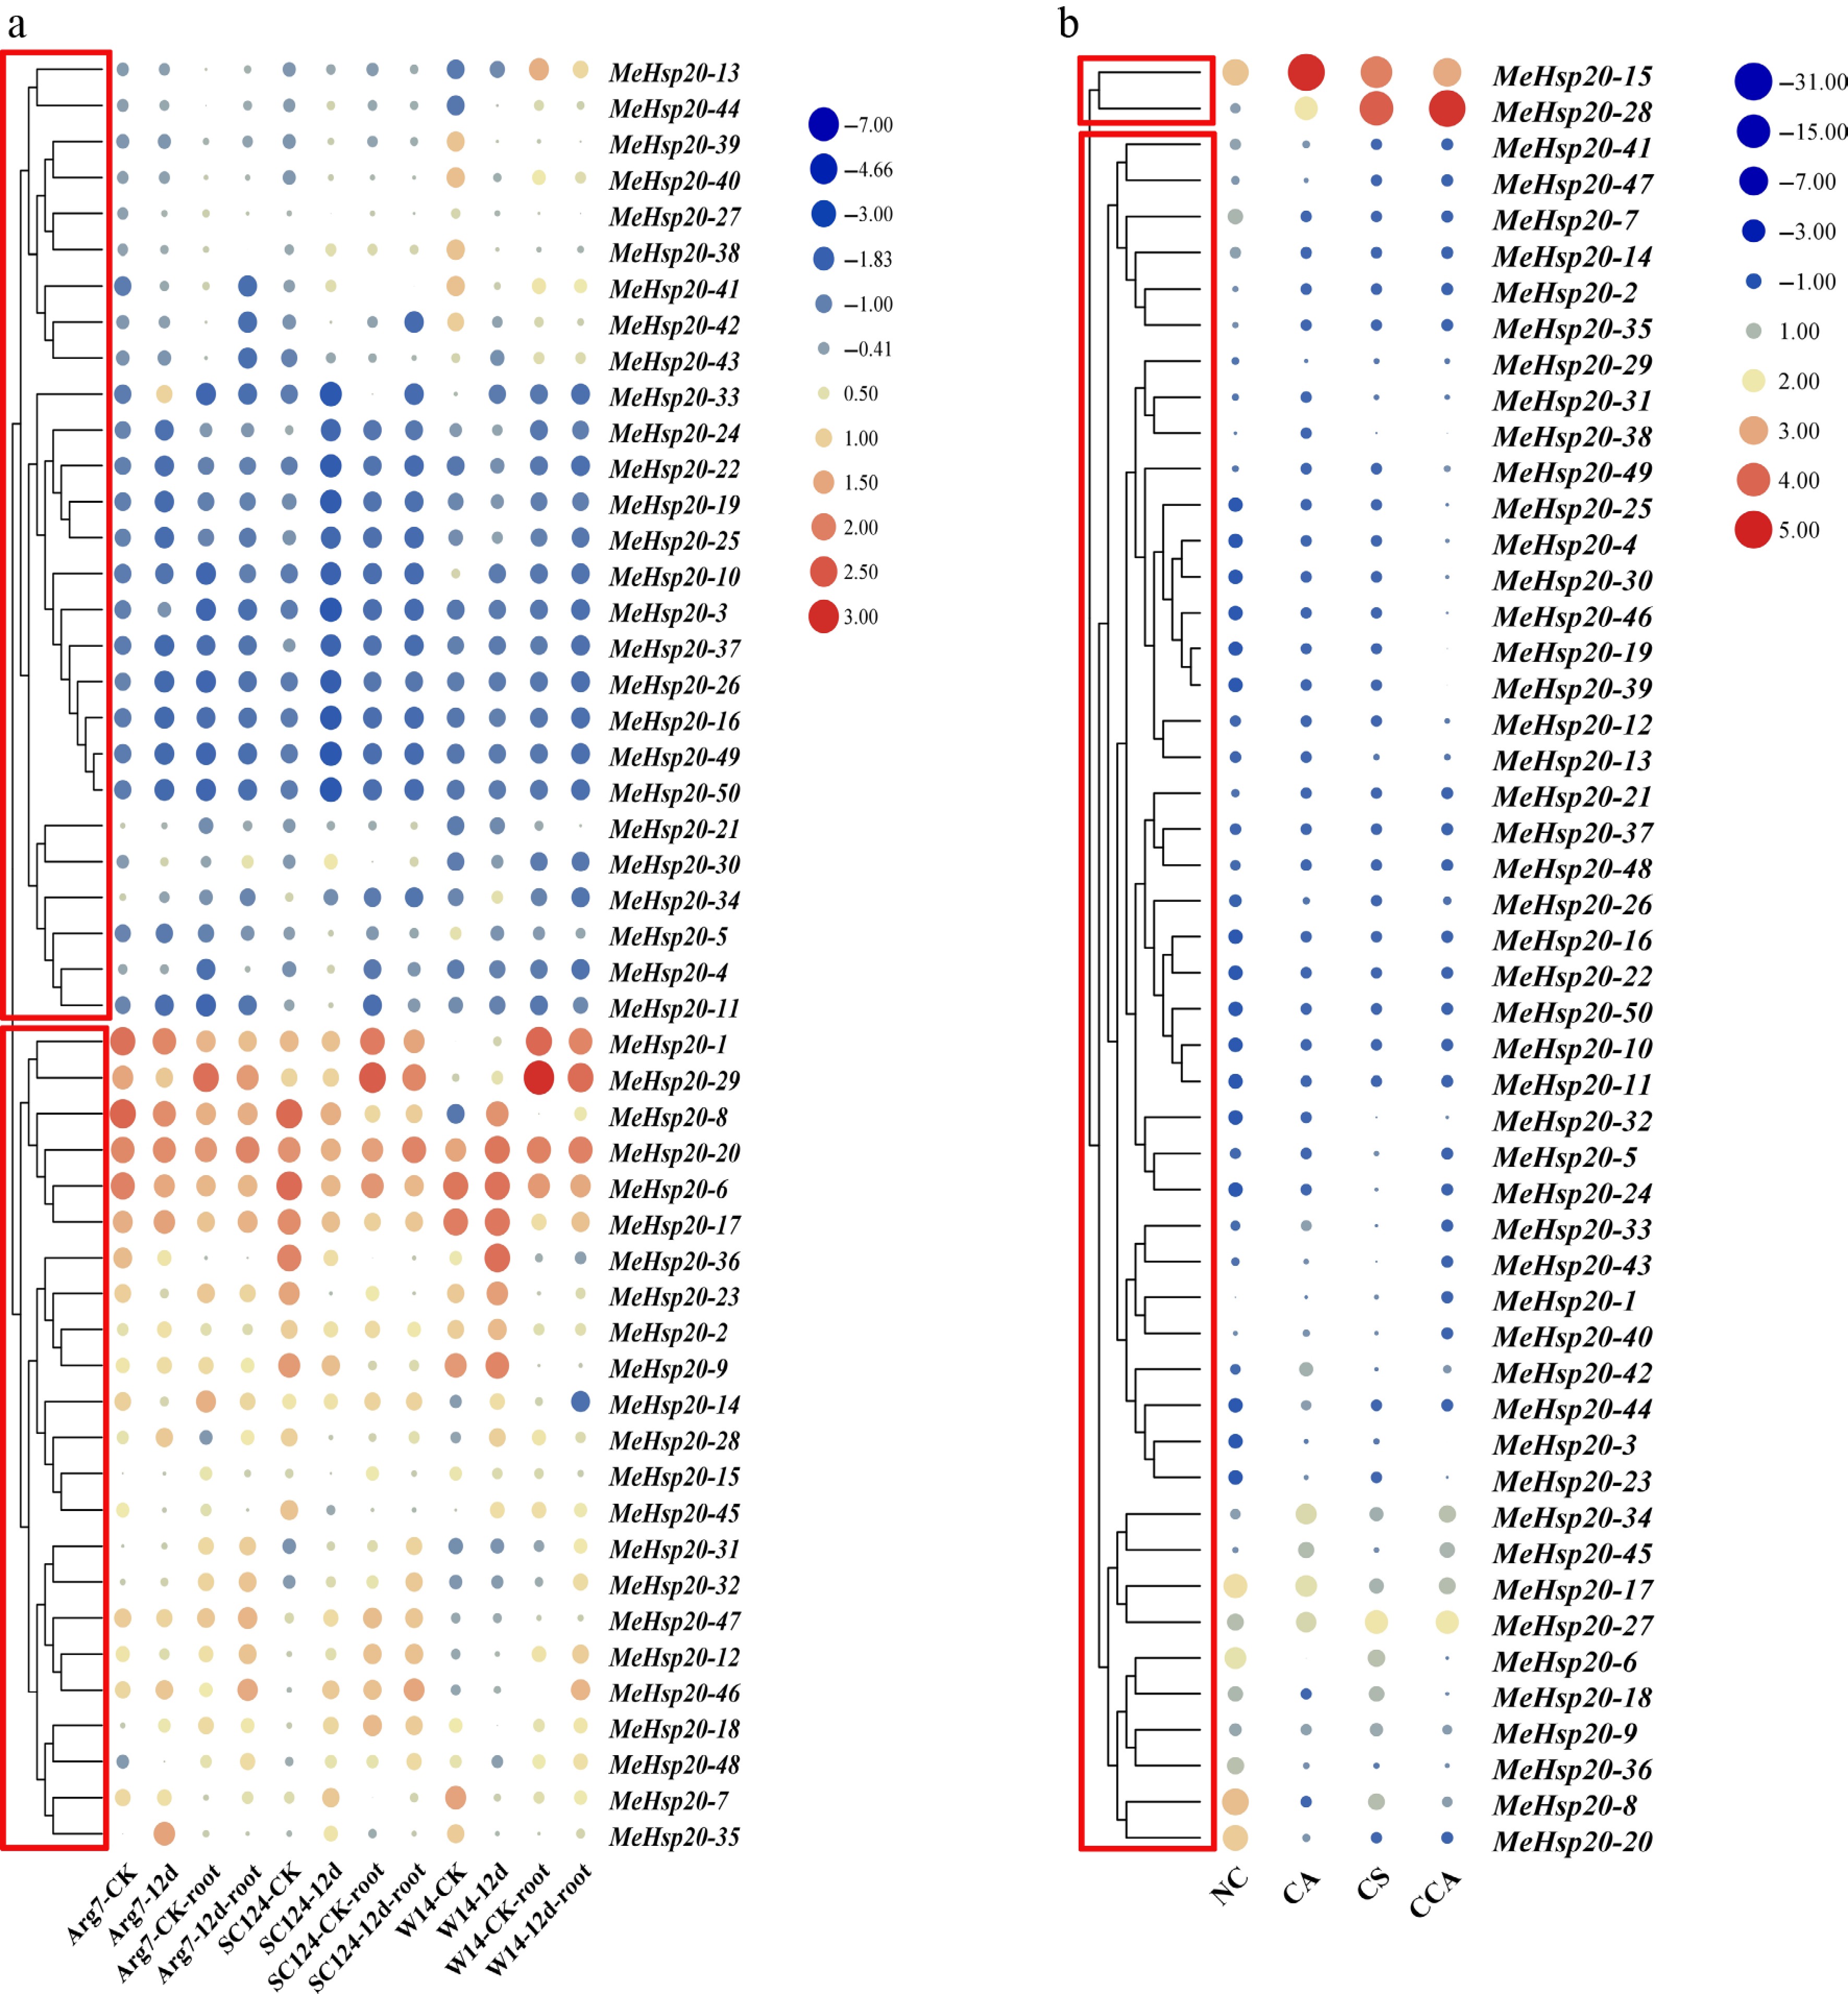
Figure 8.
The expression profile of MeHsp20 genes under (a) drought, and (b) cold stress. NC: control group; CA: gradual chilling acclimation; CS: chilling shock; CCA: chilling stress after chilling acclimation. Control group; color scale denotes relative expression values: blue (values < 0) for downregulated genes; red (values > 0) for upregulated genes.
-
Family Subfamily Genus Species Gene number Genome size Euphorbiaceae Crotonaceae Jatropha Jatropha curcas 24 266.8 Mb Hevea Hevea brasiliensis 50 1.9 Gb Manihot Manihot esculenta 50 582.28 Mb Vernicia Vernicia fordii 56 1.12 Gb Acalyphoideae Ricinus Ricinus communis 23 315.6 Mb Mercurialis Mercurialis annua 32 453.2 Mb Euphorbioideae Euphorbia Euphorbia peplus 17 267.2 Mb Table 1.
The Hsp20 gene family in Euphorbiaceae.
Figures
(8)
Tables
(1)