-
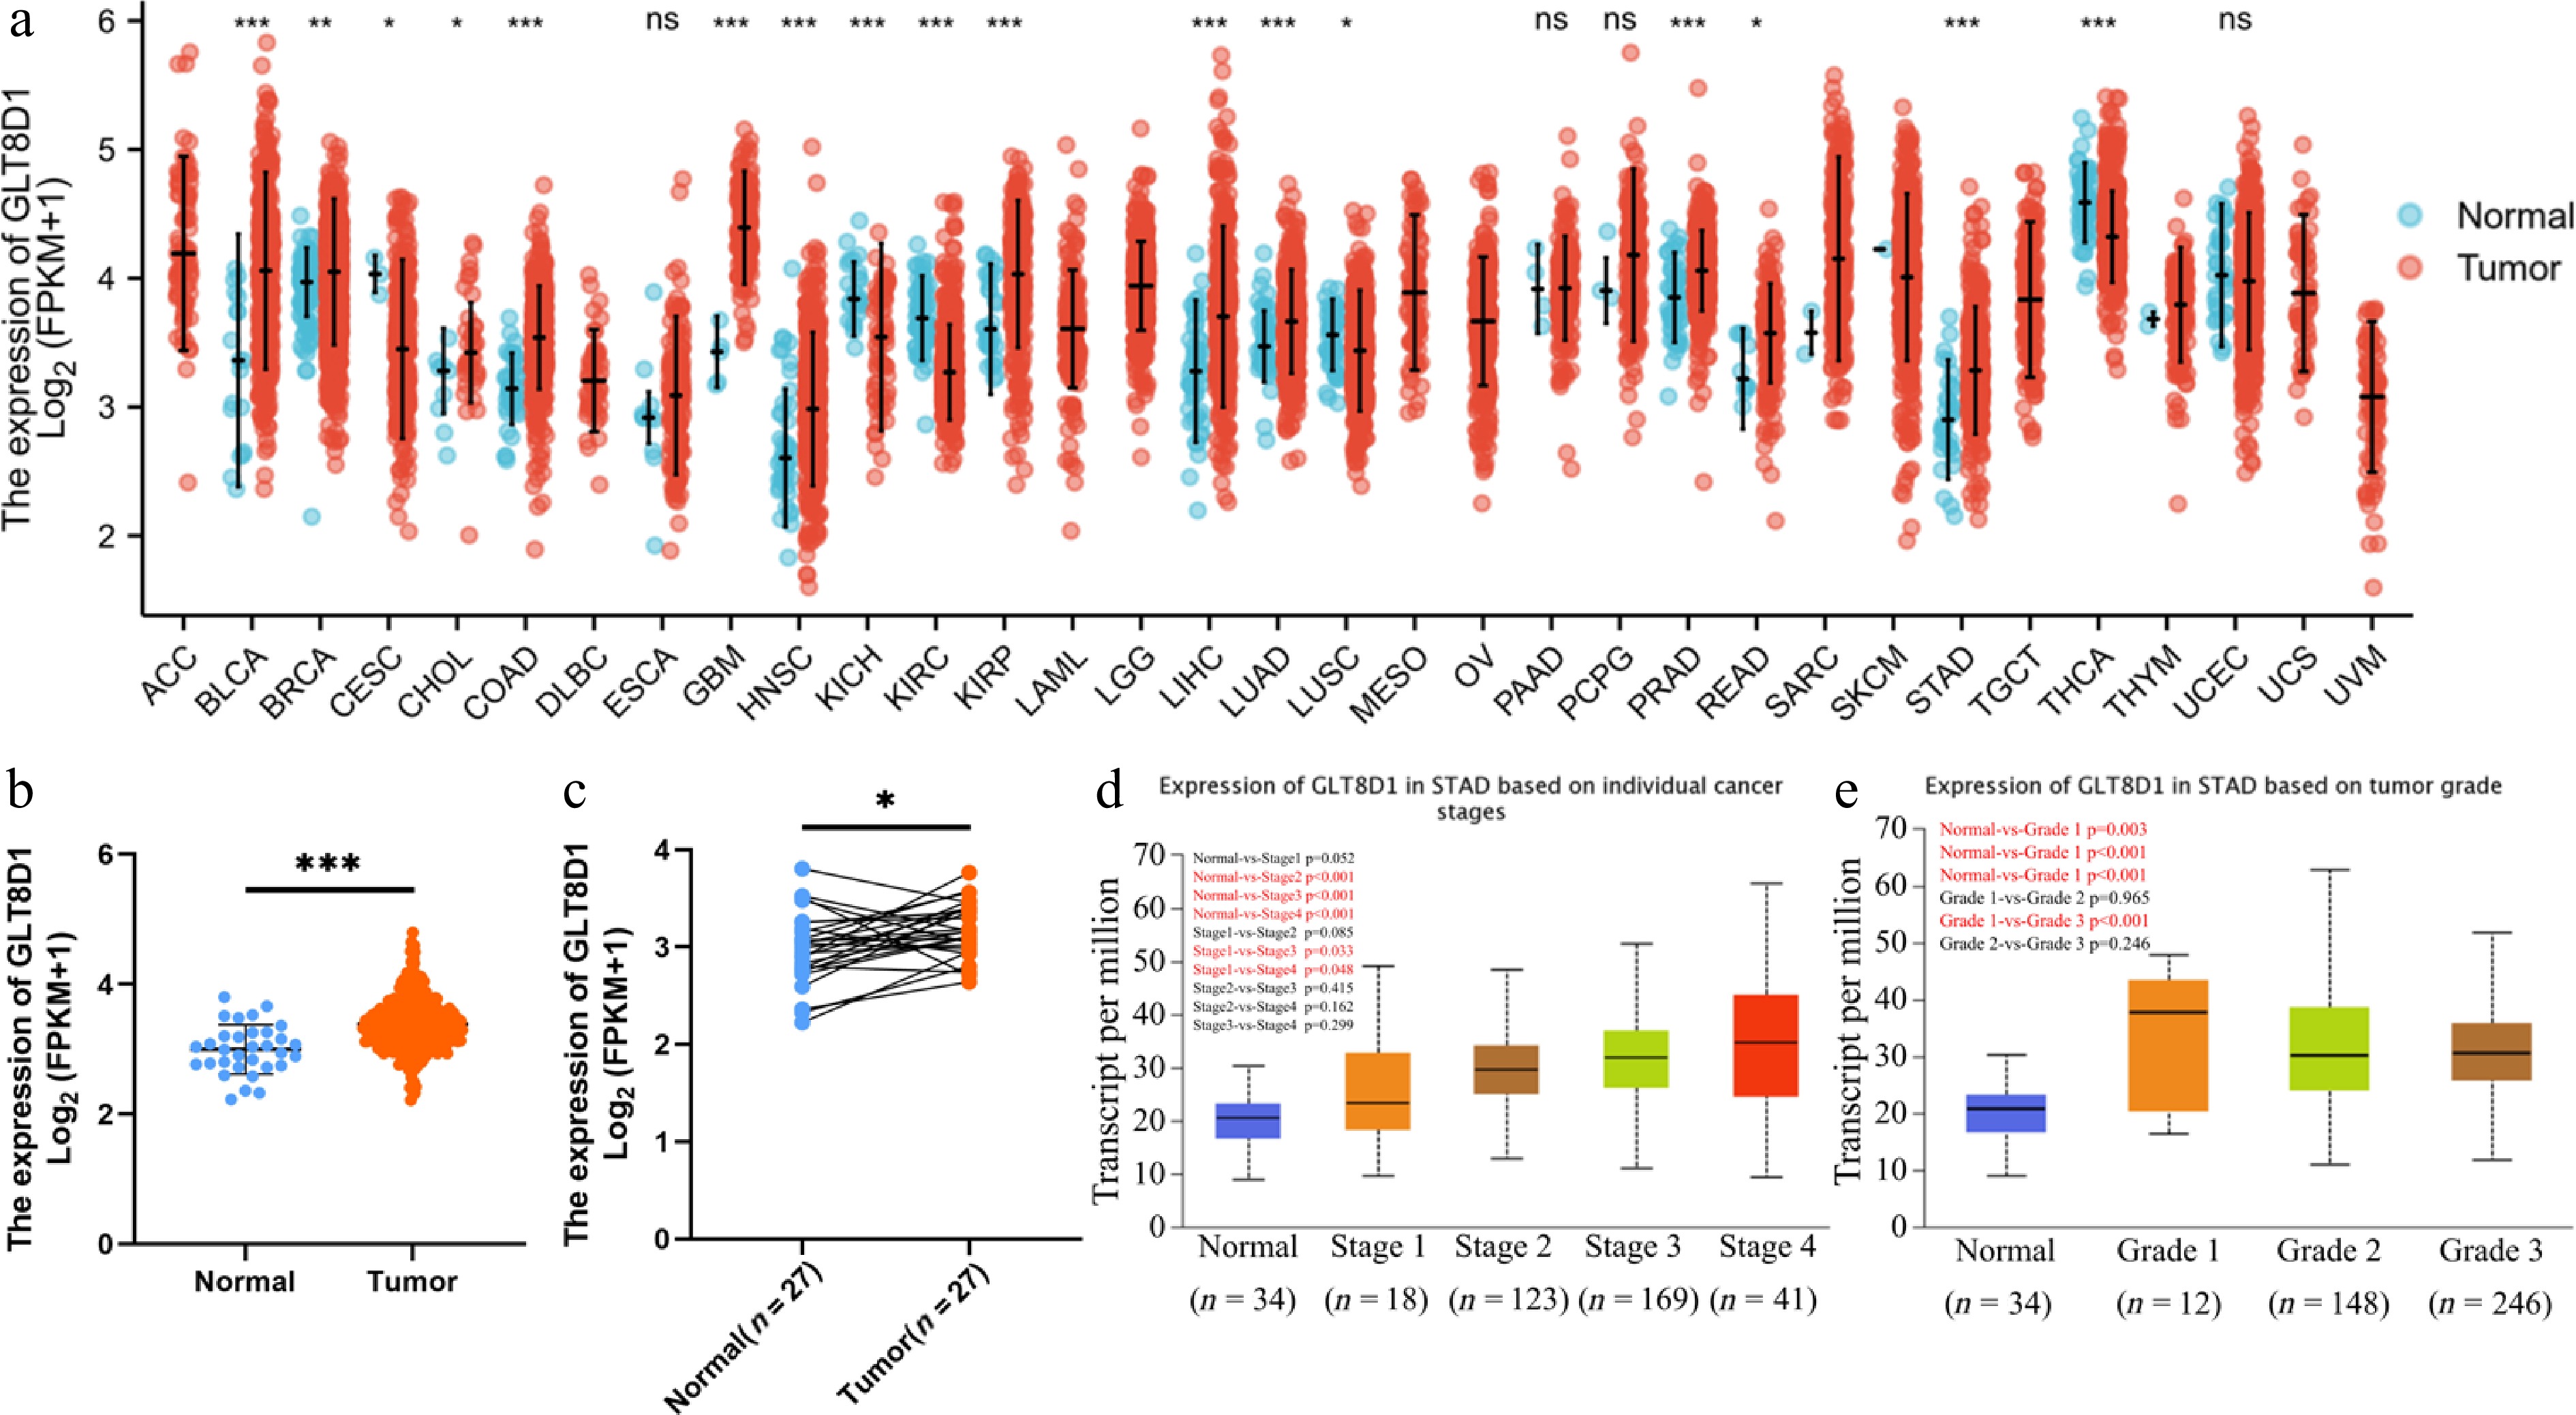
Figure 1.
Upregulated GLT8D1 expression in gastric cancer and GLT8D1 expression in different gastric cancer stages and grades. (a) mRNA expression of GLT8D1 in unpaired normal and pan-cancer. (b, c) GLT8D1 expression in unpaired and paired gastric cancer samples. (d, e) Evaluation of the expression of GLT8D1 in different tumor stages and grades in gastric cancer. * p < 0.05; ** p < 0.01; *** p < 0.001; ns, no significance.
-
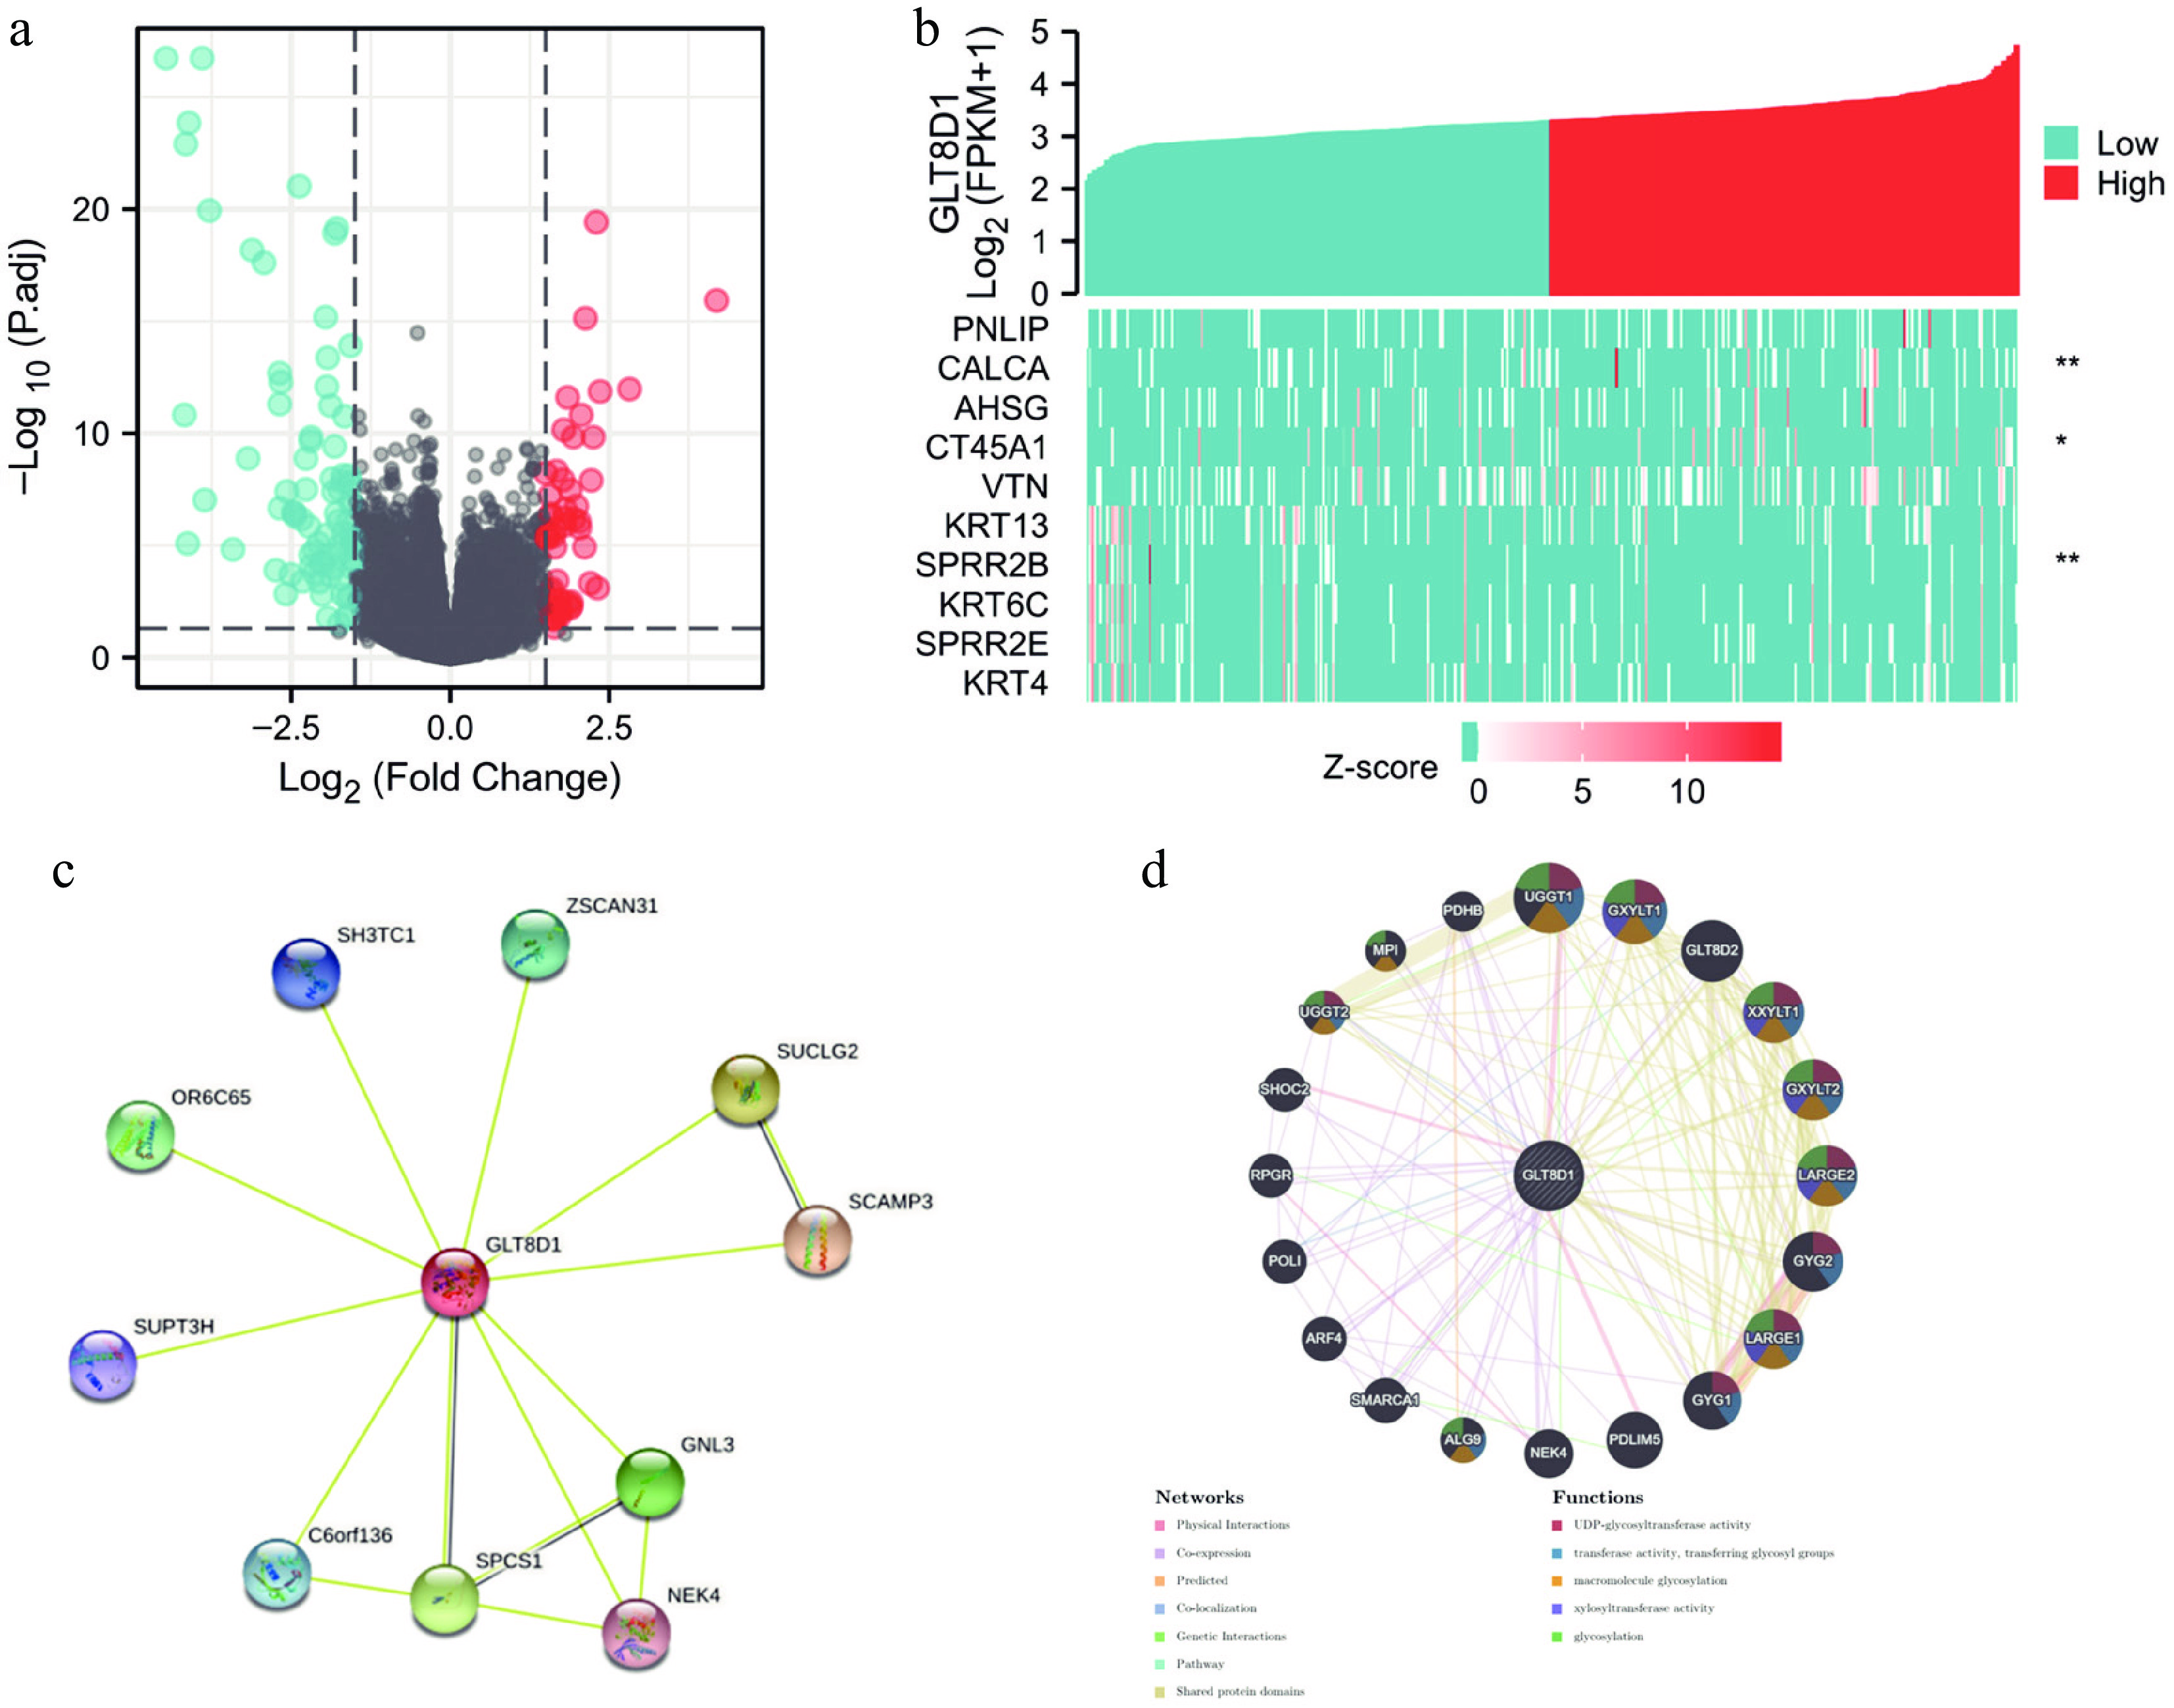
Figure 2.
Differentially expressed gene analysis of GLT8D1 in gastric cancer, protein–protein interaction, and gene–gene network of GLT8D1. (a) The volcano plot showed differentially expressed genes, including 54 upregulated (red) and 107 downregulated (blue) genes. (b) Heatmap showing the top five regulated DEGs and top five downregulated DEGs. (c) PPI network generated by the STRING database. (d) Gene–gene network constructed by the GeneMANIA database. * p < 0.05; ** p < 0.01.
-
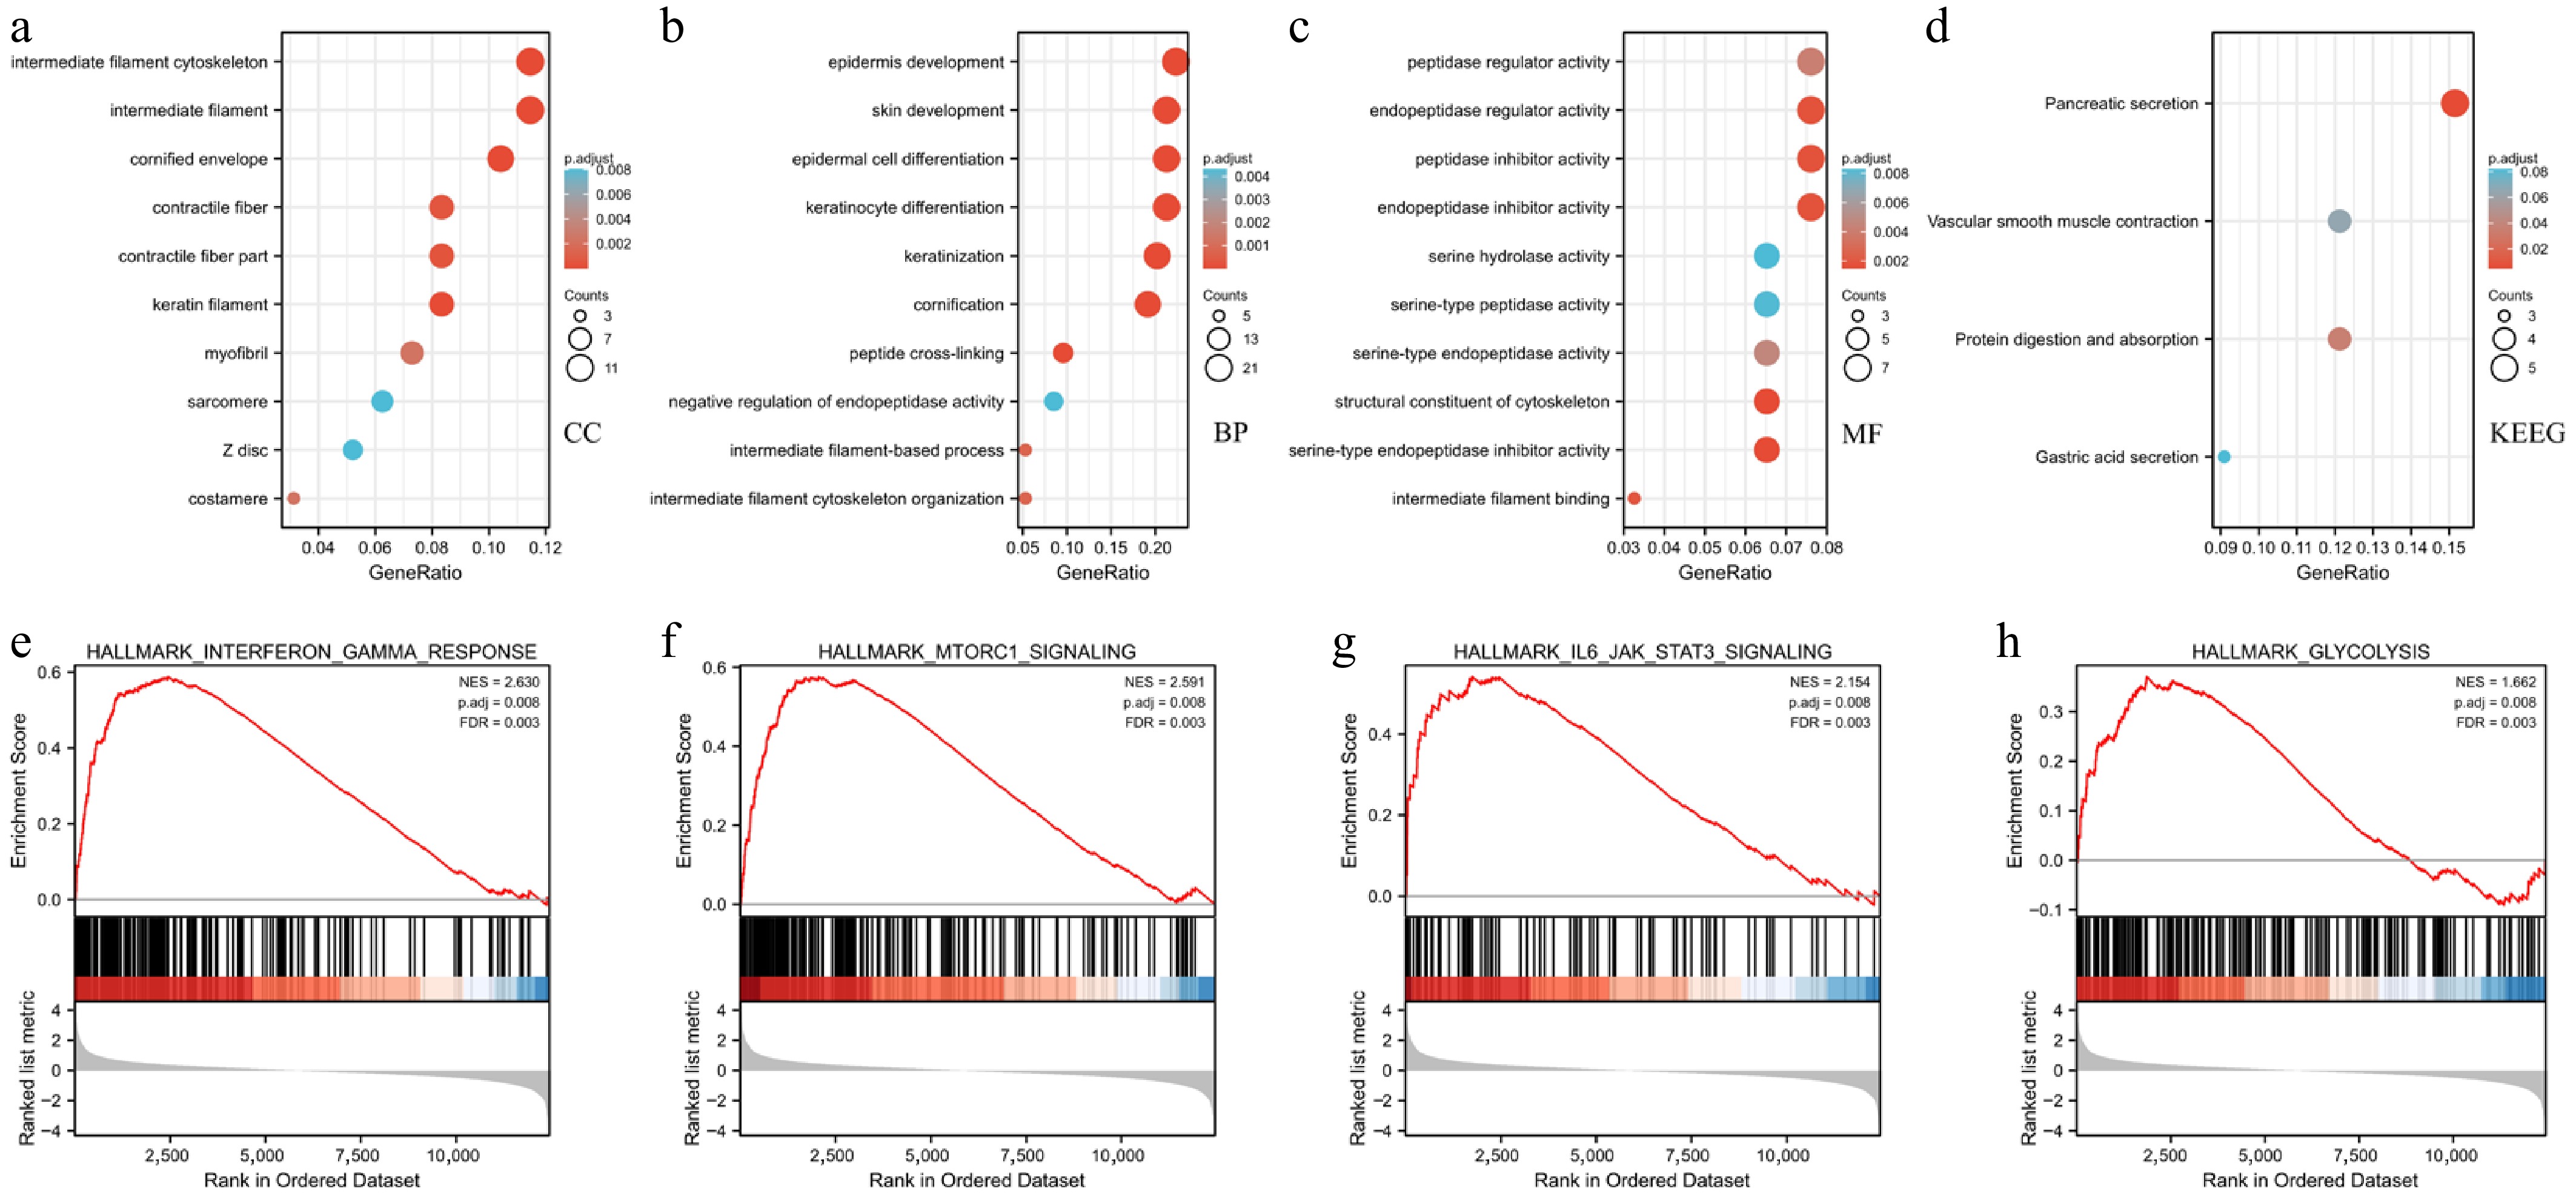
Figure 3.
GO, KEGG, and GSEA analysis of DEGs between high- and low-GLT8D1 expression in the TCGA-STAD dataset. (a) GO term of cellular component. (b) GO term of biological process. (c) GO term of molecular function. (d) Enrichment pathway analysis of KEGG. (e–h) Enrichment plot of GSEA.
-
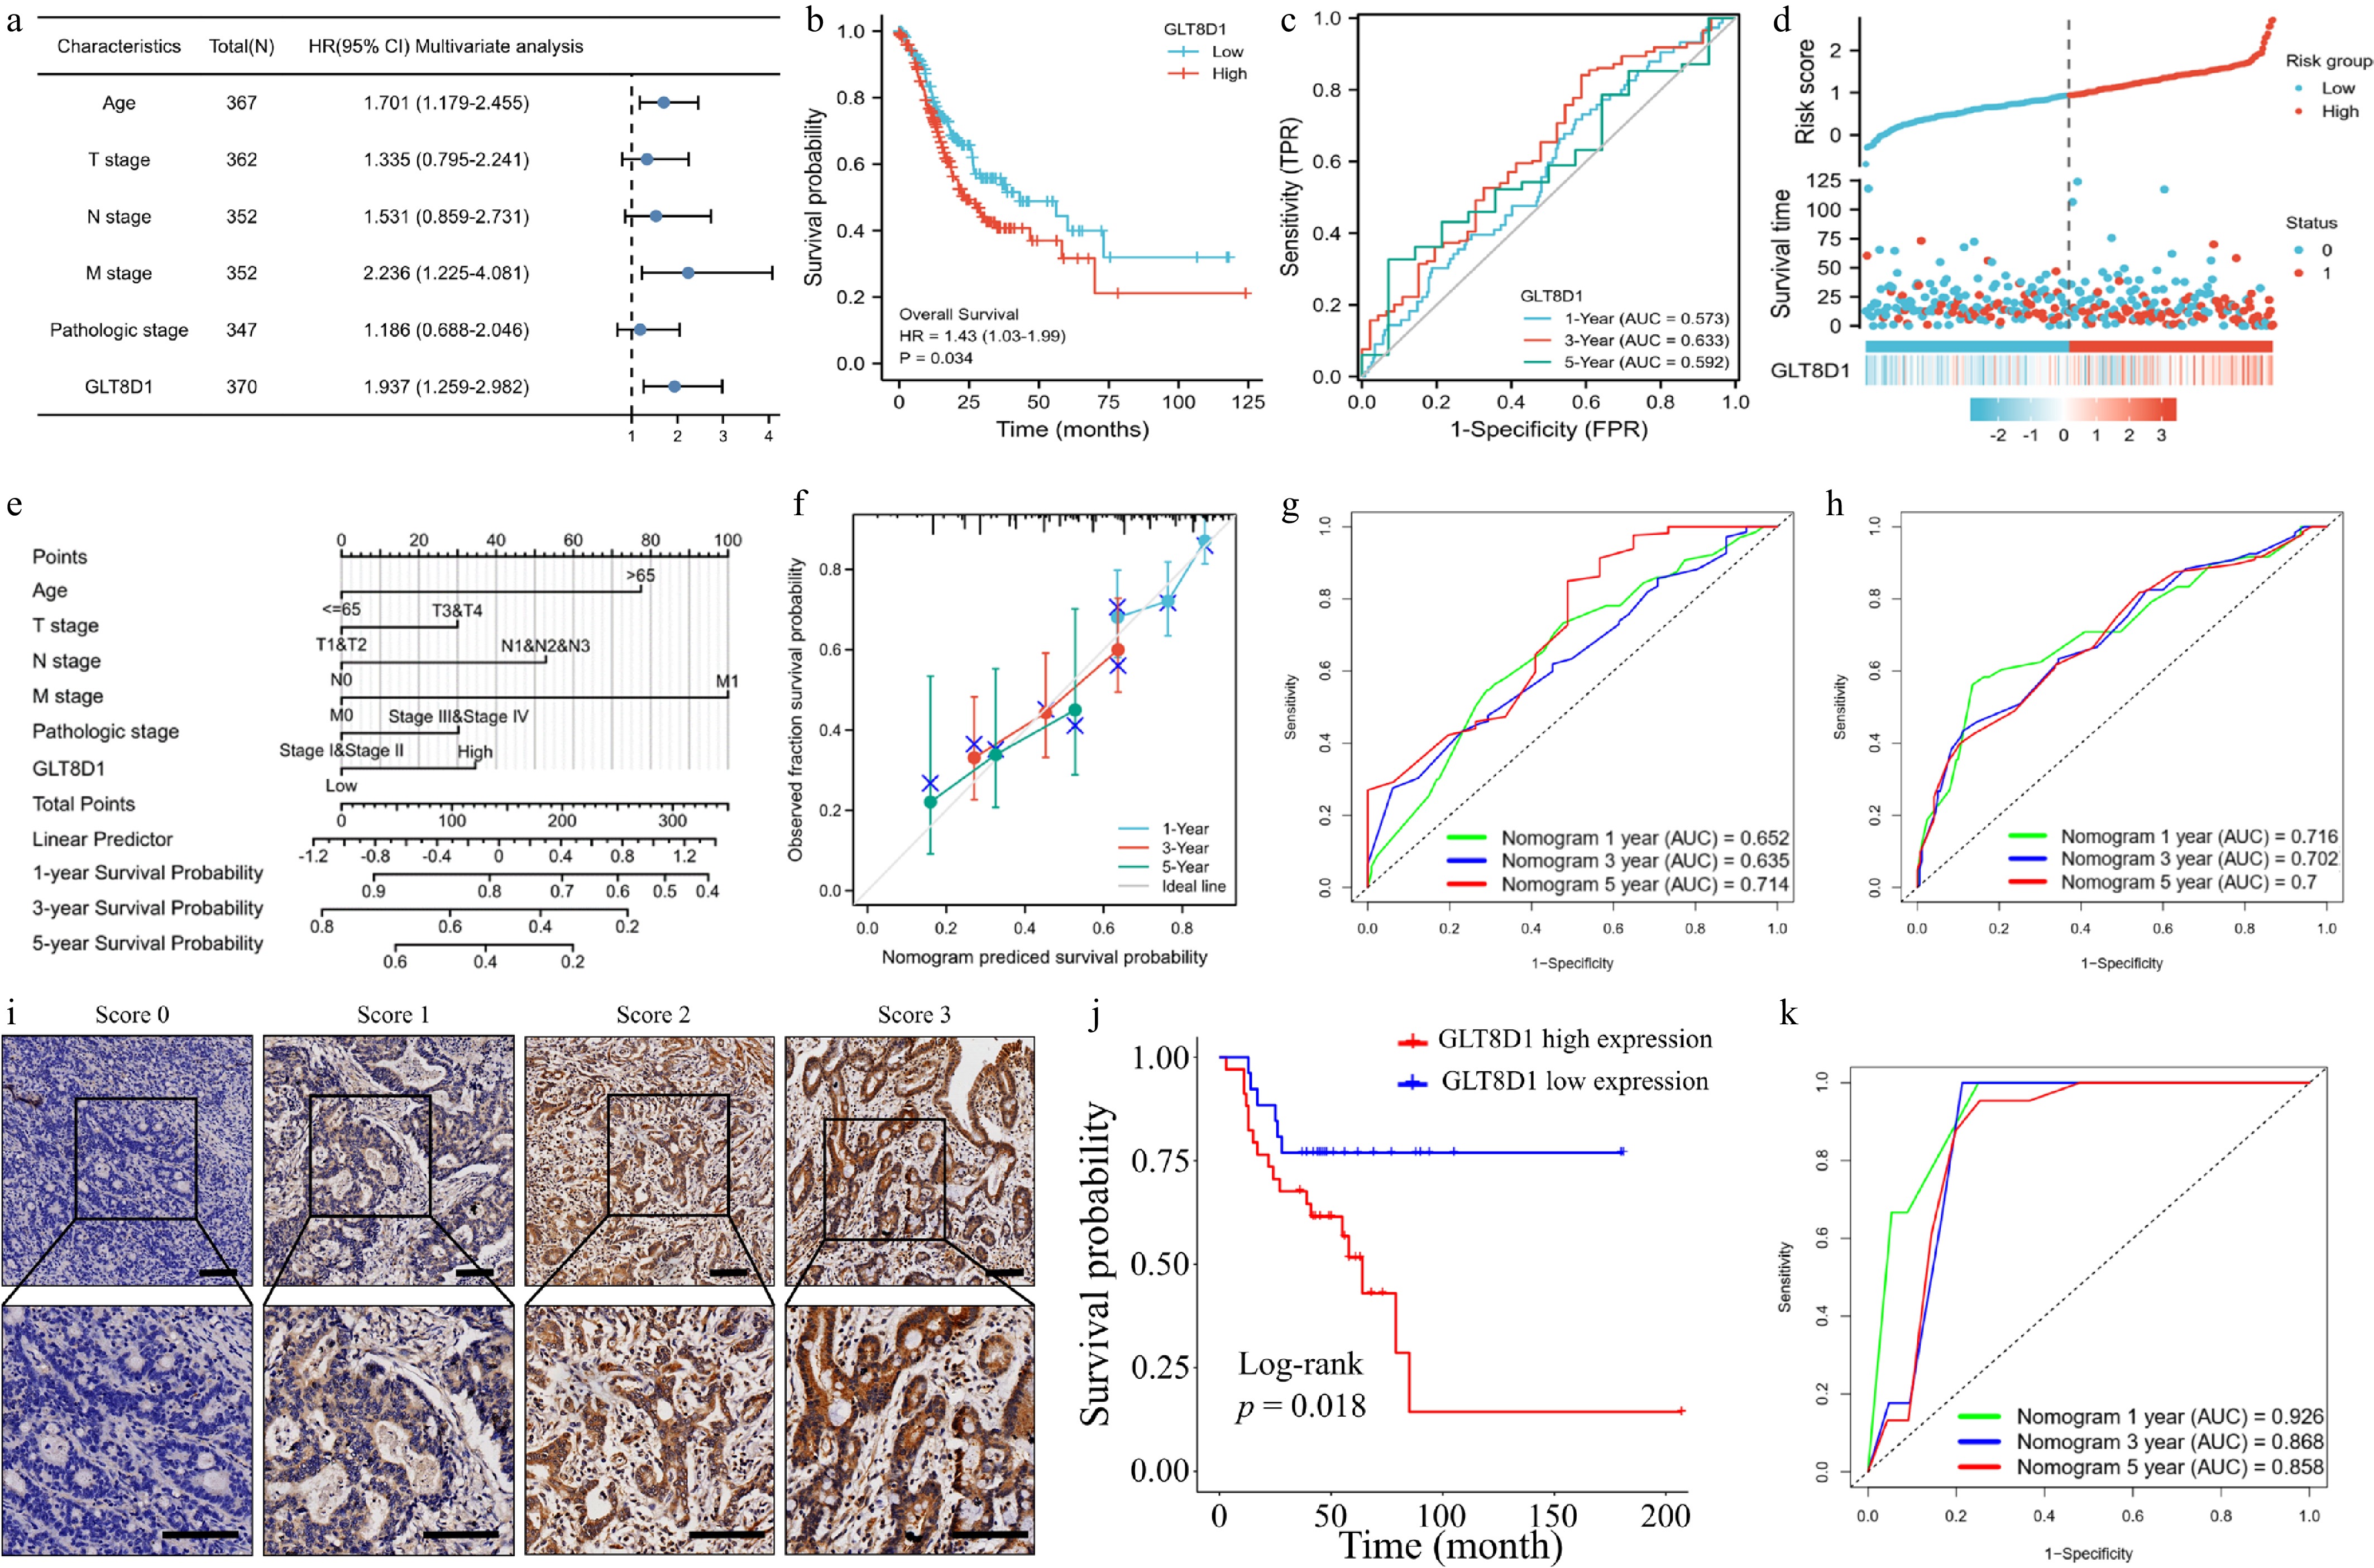
Figure 4.
Evaluation of the clinical significance of GLT8D1 in gastric cancer. (a) Forest plot showing multivariate analysis results. (b) Kaplan–Meier analysis between high- and low-GLT8D1 expression groups of TCGA-STAD samples. (c) ROC curve analysis predicted 1-, 3-, and 5-year overall survival probabilities. (d) Scatter plot showing survival time and risk score based on GLT8D1 expression. (e) Constructing a prognostic nomogram based on clinical factors and the expression level of GLT8D1. (f) Calibration curve analysis of the predicted nomogram. (g) Training set of TCGA-STAD dataset showing ROC values of the nomogram predicting 1-, 3-, and 5-year overall survival probabilities. (h) External validation of the GSE62254 dataset showing ROC values of the nomogram predicting 1-, 3-, and 5-year overall survival probabilities. (i) Immunohistochemical staining intensity of GLT8D1 in paraffin sections of the FAHSYSU cohort's gastric cancer tissues. Scale bar: 100 µm. (j) Kaplan–Meier analysis between groups of high- and low-GLT8D1 expression based on IHC results. (k) External validation of the FAHSYSU cohort showing ROC values of the nomogram predicting 1-, 3-, and 5-year overall survival probabilities.
-
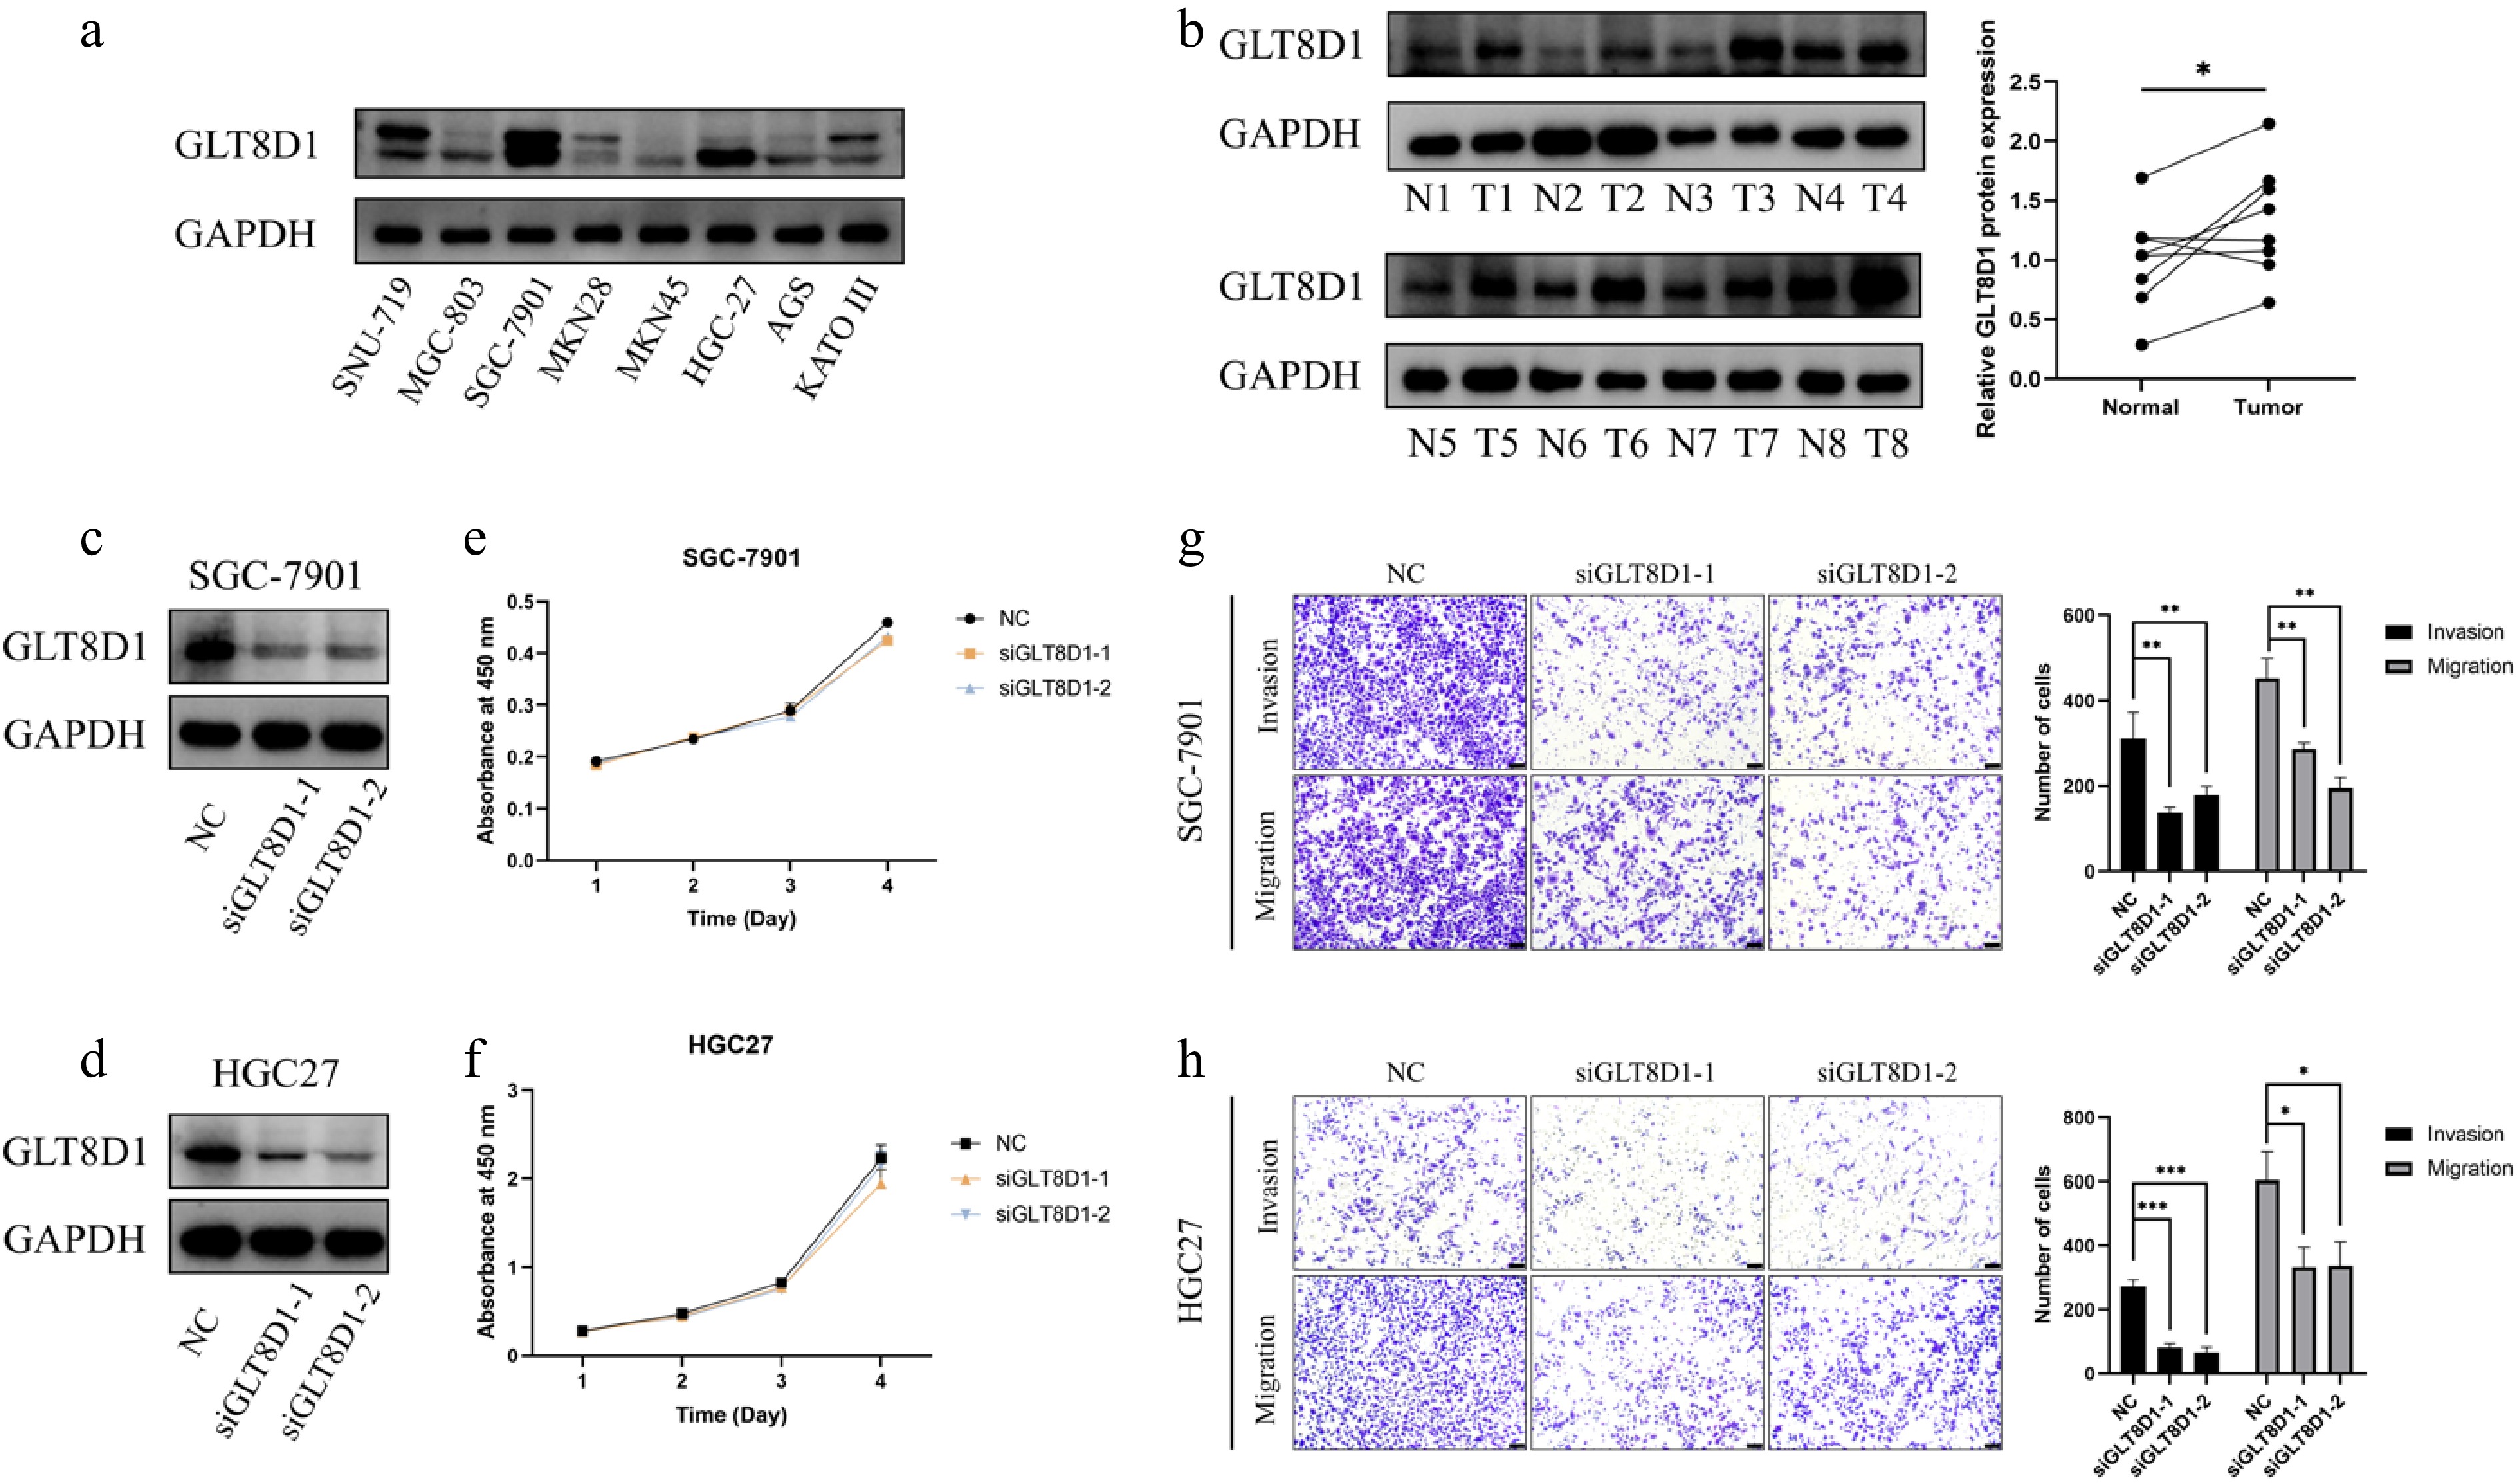
Figure 5.
GLT8D1 expression level and biological function analysis. (a) GLT8D1 expression in different gastric cancer cell lines. (b) GLT8D1 expression in gastric cancer tissue and adjacent normal tissue specimens. (c) Western blot analysis showed GLT8D1 knockdown in an SGC-7901 cell line. (d) Western blot analysis showed GLT8D1 knockdown in the HGC-27 cell line. (e) Cell viability assay of GLT8D1 in the SGC-7901 cell line. (f) Cell viability assay of GLT8D1 in the HGC-27 cell line. (g) Transwell assay of GLT8D1 in an SGC-7901 cell line. (h) Transwell assay of GLT8D1 in the HGC-27 cell line. * p < 0.05; ** p < 0.01; *** p < 0.001. Scale bar: 100 µm.
-
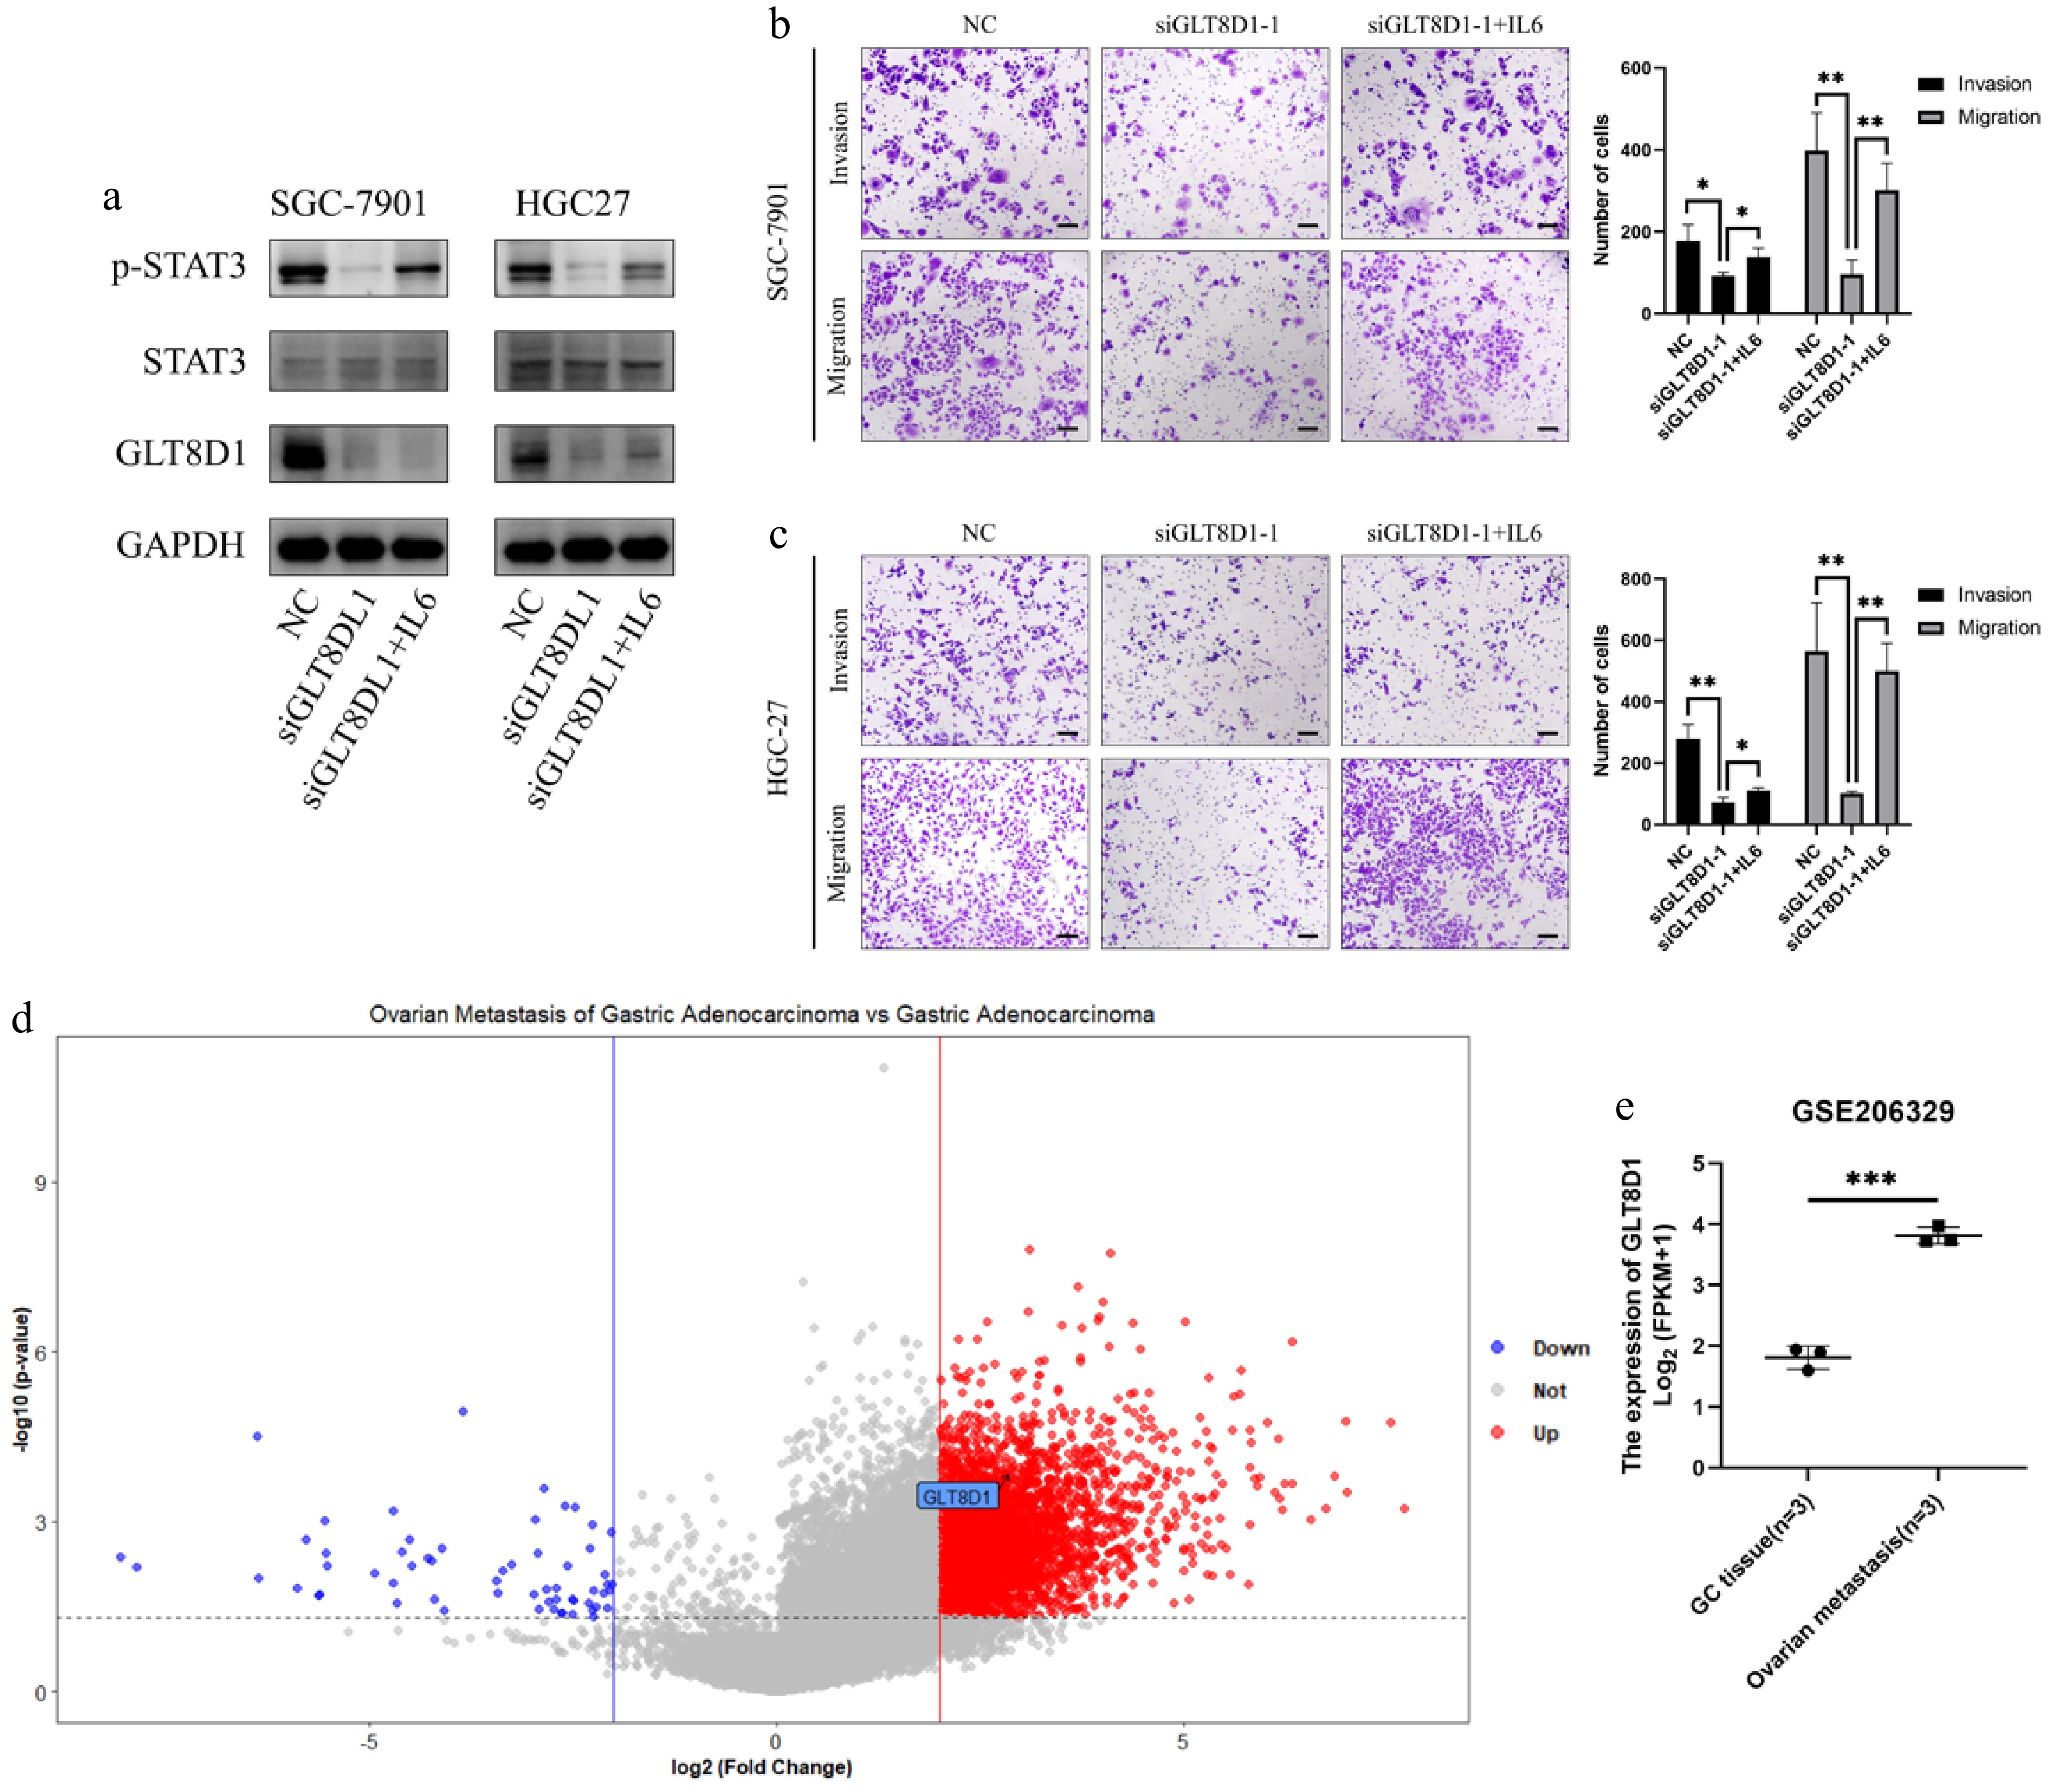
Figure 6.
GLT8D1 promotes gastric cancer cell invasion and migration, which is associated with activating the IL6/STAT3 signaling pathway. (a) Western blot analysis showed p-STAT3, STAT3, and GLT8D1 expression levels in GLT8D1 knockdown and GLT8D1 knockdown after IL6 treatment (20 ng/mL for 48-h incubation). (b, c) Transwell assay analysis showed GLT8D1 knockdown and GLT8D1 knockdown after IL6 treatment. (d) Volcano plot analysis of GSE206329 showed GLT8D1 was an upregulated gene (black arrow) in DEGs (ovarian metastasis versus primary gastric cancer). (e) GLT8D1 expression level in primary gastric cancer tissue and ovarian metastasis in the GSE206329 dataset. * p < 0.05; ** p < 0.01; *** p < 0.001. Scale bar: 100 µm.
-
Characteristics Total (N) Univariate analysis Multivariate analysis HR (95% CI) p value HR (95% CI) p value Age 367 ≤ 65 163 Reference > 65 204 1.620 (1.154–2.276) 0.005 1.701 (1.179–2.455) 0.005 Gender 370 Female 133 Reference Male 237 1.267 (0.891–1.804 0.188 Histologic grade 361 G1 10 Reference G2 134 1.648 (0.400–6.787) 0.489 G3 217 2.174 (0.535–8.832) 0.278 T stage 362 T1&T2 96 Reference T3&T4 266 1.719 (1.131–2.612) 0.011 1.335 (0.795–2.241) 0.275 N stage 352 N0 107 Reference N1&N2&N3 245 1.925 (1.264–2.931) 0.002 1.531 (0.859–2.731) 0.149 M stage 352 M0 327 Reference M1 25 2.254 (1.295–3.924) 0.004 2.236 (1.225–4.081) 0.009 Pathologic stage 347 Stage I&Stage II 160 Reference Stage III&Stage IV 187 1.947 (1.358–2.793) < 0.001 1.186 (0.688–2.046) 0.539 GLT8D1 370 1.868 (1.257–2.777) 0.002 1.937 (1.259–2.982) 0.003 HR, hazard ratio; CI, confidence interval. The significance of the bold values means p < 0.05. Table 1.
Univariate and multivariate analyses for the overall survival of TCGA-STAD patients.
-
Characteristics Total (N) Univariate analysis Multivariate analysis HR (95% CI) p value HR (95% CI) p value Age 60 < 60 48 Reference ≥ 60 12 2.229 (0.921–5.396) 0.076 Gender 60 Female 30 Reference Male 30 0.566 (0.247–1.295) 0.178 Gastrectomy 60 Proximal 1 Reference Distal 38 0.182 (0.023–1.466) 0.110 Total 21 0.722 (0.094–5.574) 0.755 Tumor diameter 60 < 5 cm 46 Reference ≥ 5 cm 14 3.103 (1.315–7.323) 0.010 1.997 (0.790–5.048) 0.144 Lymphovascular invasion 60 No 51 Reference Yes 9 4.702 (1.889–11.710) 0.0009 5.511 (1.814–16.740) 0.003 Perineural invasion 60 No 55 Reference Yes 5 2.895 (0.838–9.997) 0.093 T stage 60 T1&T2 23 Reference T3&T4 37 18.830 (2.539–139.6) 0.004 11.681 (1.240–110.067) 0.032 N stage 60 N0 22 Reference N1&N2&N3 38 19.99 (2.691–148.5) 0.003 7.748 (0.983–61.071) 0.052 Differentiation 60 Poor 48 Reference Well/moderate 12 0.365 (0.086–1.554) 0.173 Borrmann type 60 I-II 26 Reference III-IV 34 9.006 (2.644–30.67) 0.0004 1.401 (0.331–5.925) 0.647 GLT8D1 60 High expression 34 Reference Low expression 26 0.341 (0.134–0.869) 0.024 0.332 (0.126–0.874) 0.026 HR, hazard ratio; CI, confidence interval. The significance of the bold values means p < 0.05. Table 2.
Univariate and multivariate analyses for overall survival of the First Affiliated Hospital of Sun Yat-sen University cohort.
Figures
(6)
Tables
(2)