-
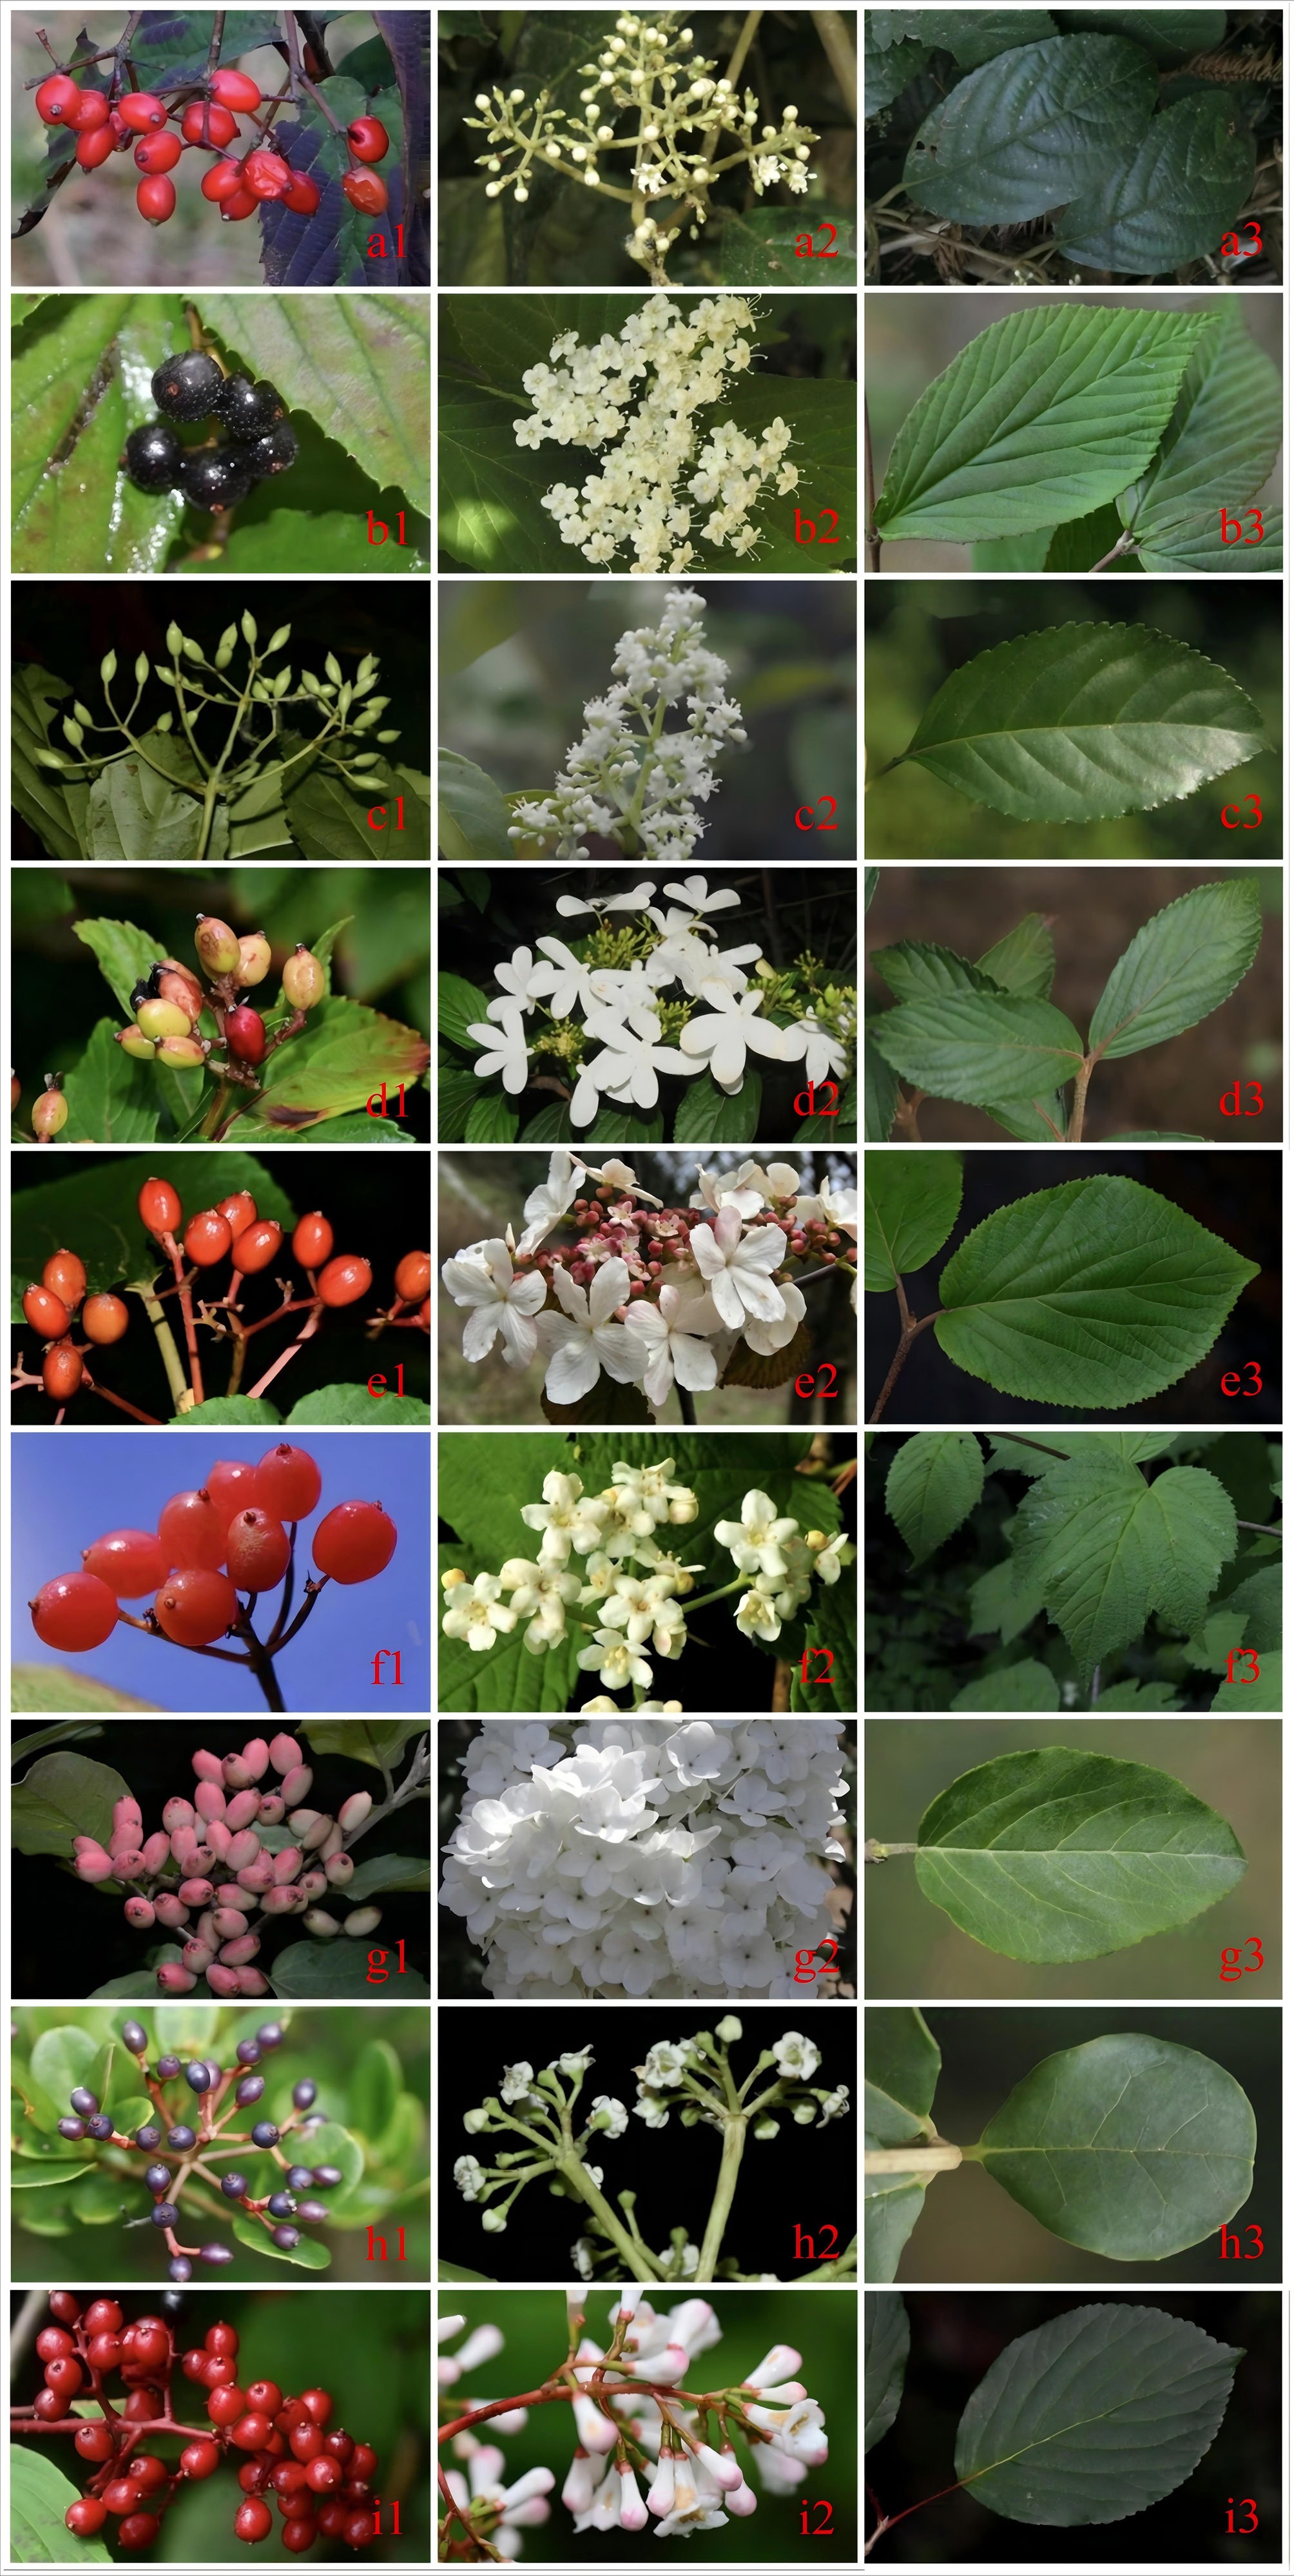
Figure 1.
Morphological characterization of flower and leaf blades of Viburnum fruits, Sect. Platyphylla: (a) Viburnum laterale; Sect. Odontotinus: (b) Viburnum erosum; Sect. Megalotinus: (c)Viburnum lutescens; Sect. Pseudopulus: (d) Viburnum hanceanum; Sect. Pseudotinus: (e) Viburnum sympodiale; Sect. Opulus: (f) Viburnum koreanum; Sect. Viburnum: (g) Viburnum keteleeri 'Sterile'; Sect. Tinus: (h) Viburnum atrocyaneum; Sect. Thyrsosma: (i) Viburnum erubescens.
-
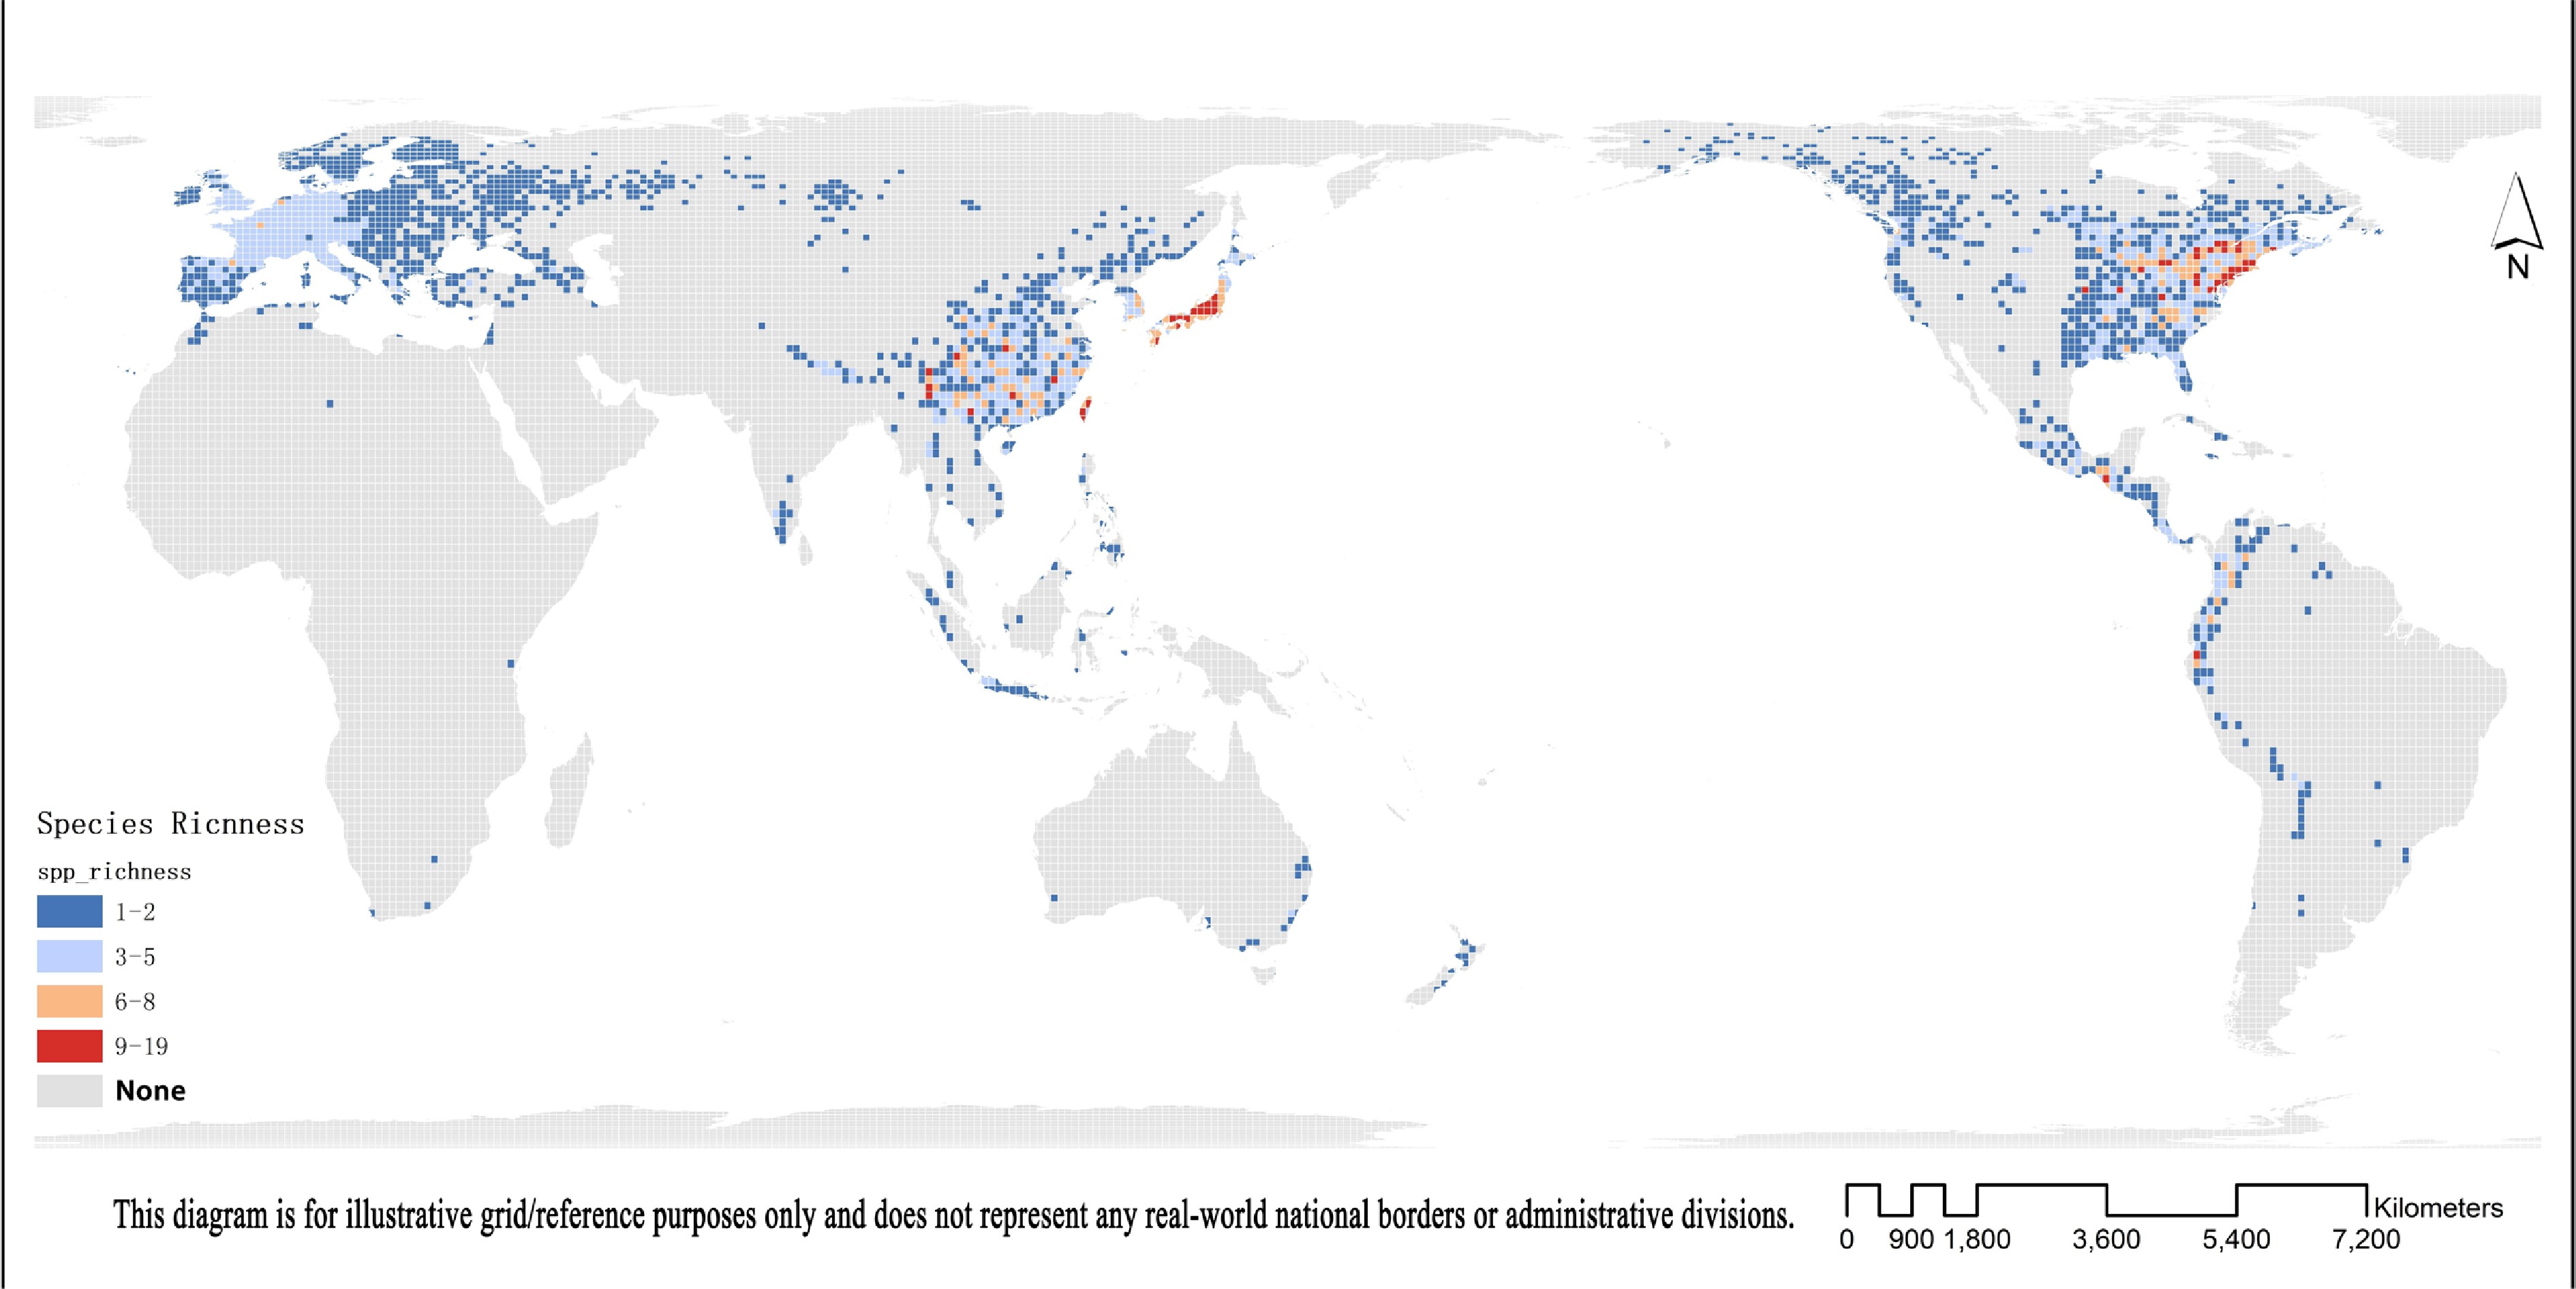
Figure 2.
Global patterns of Viburnum species diversity mapped in 100 km × 100 km grid cells.
-
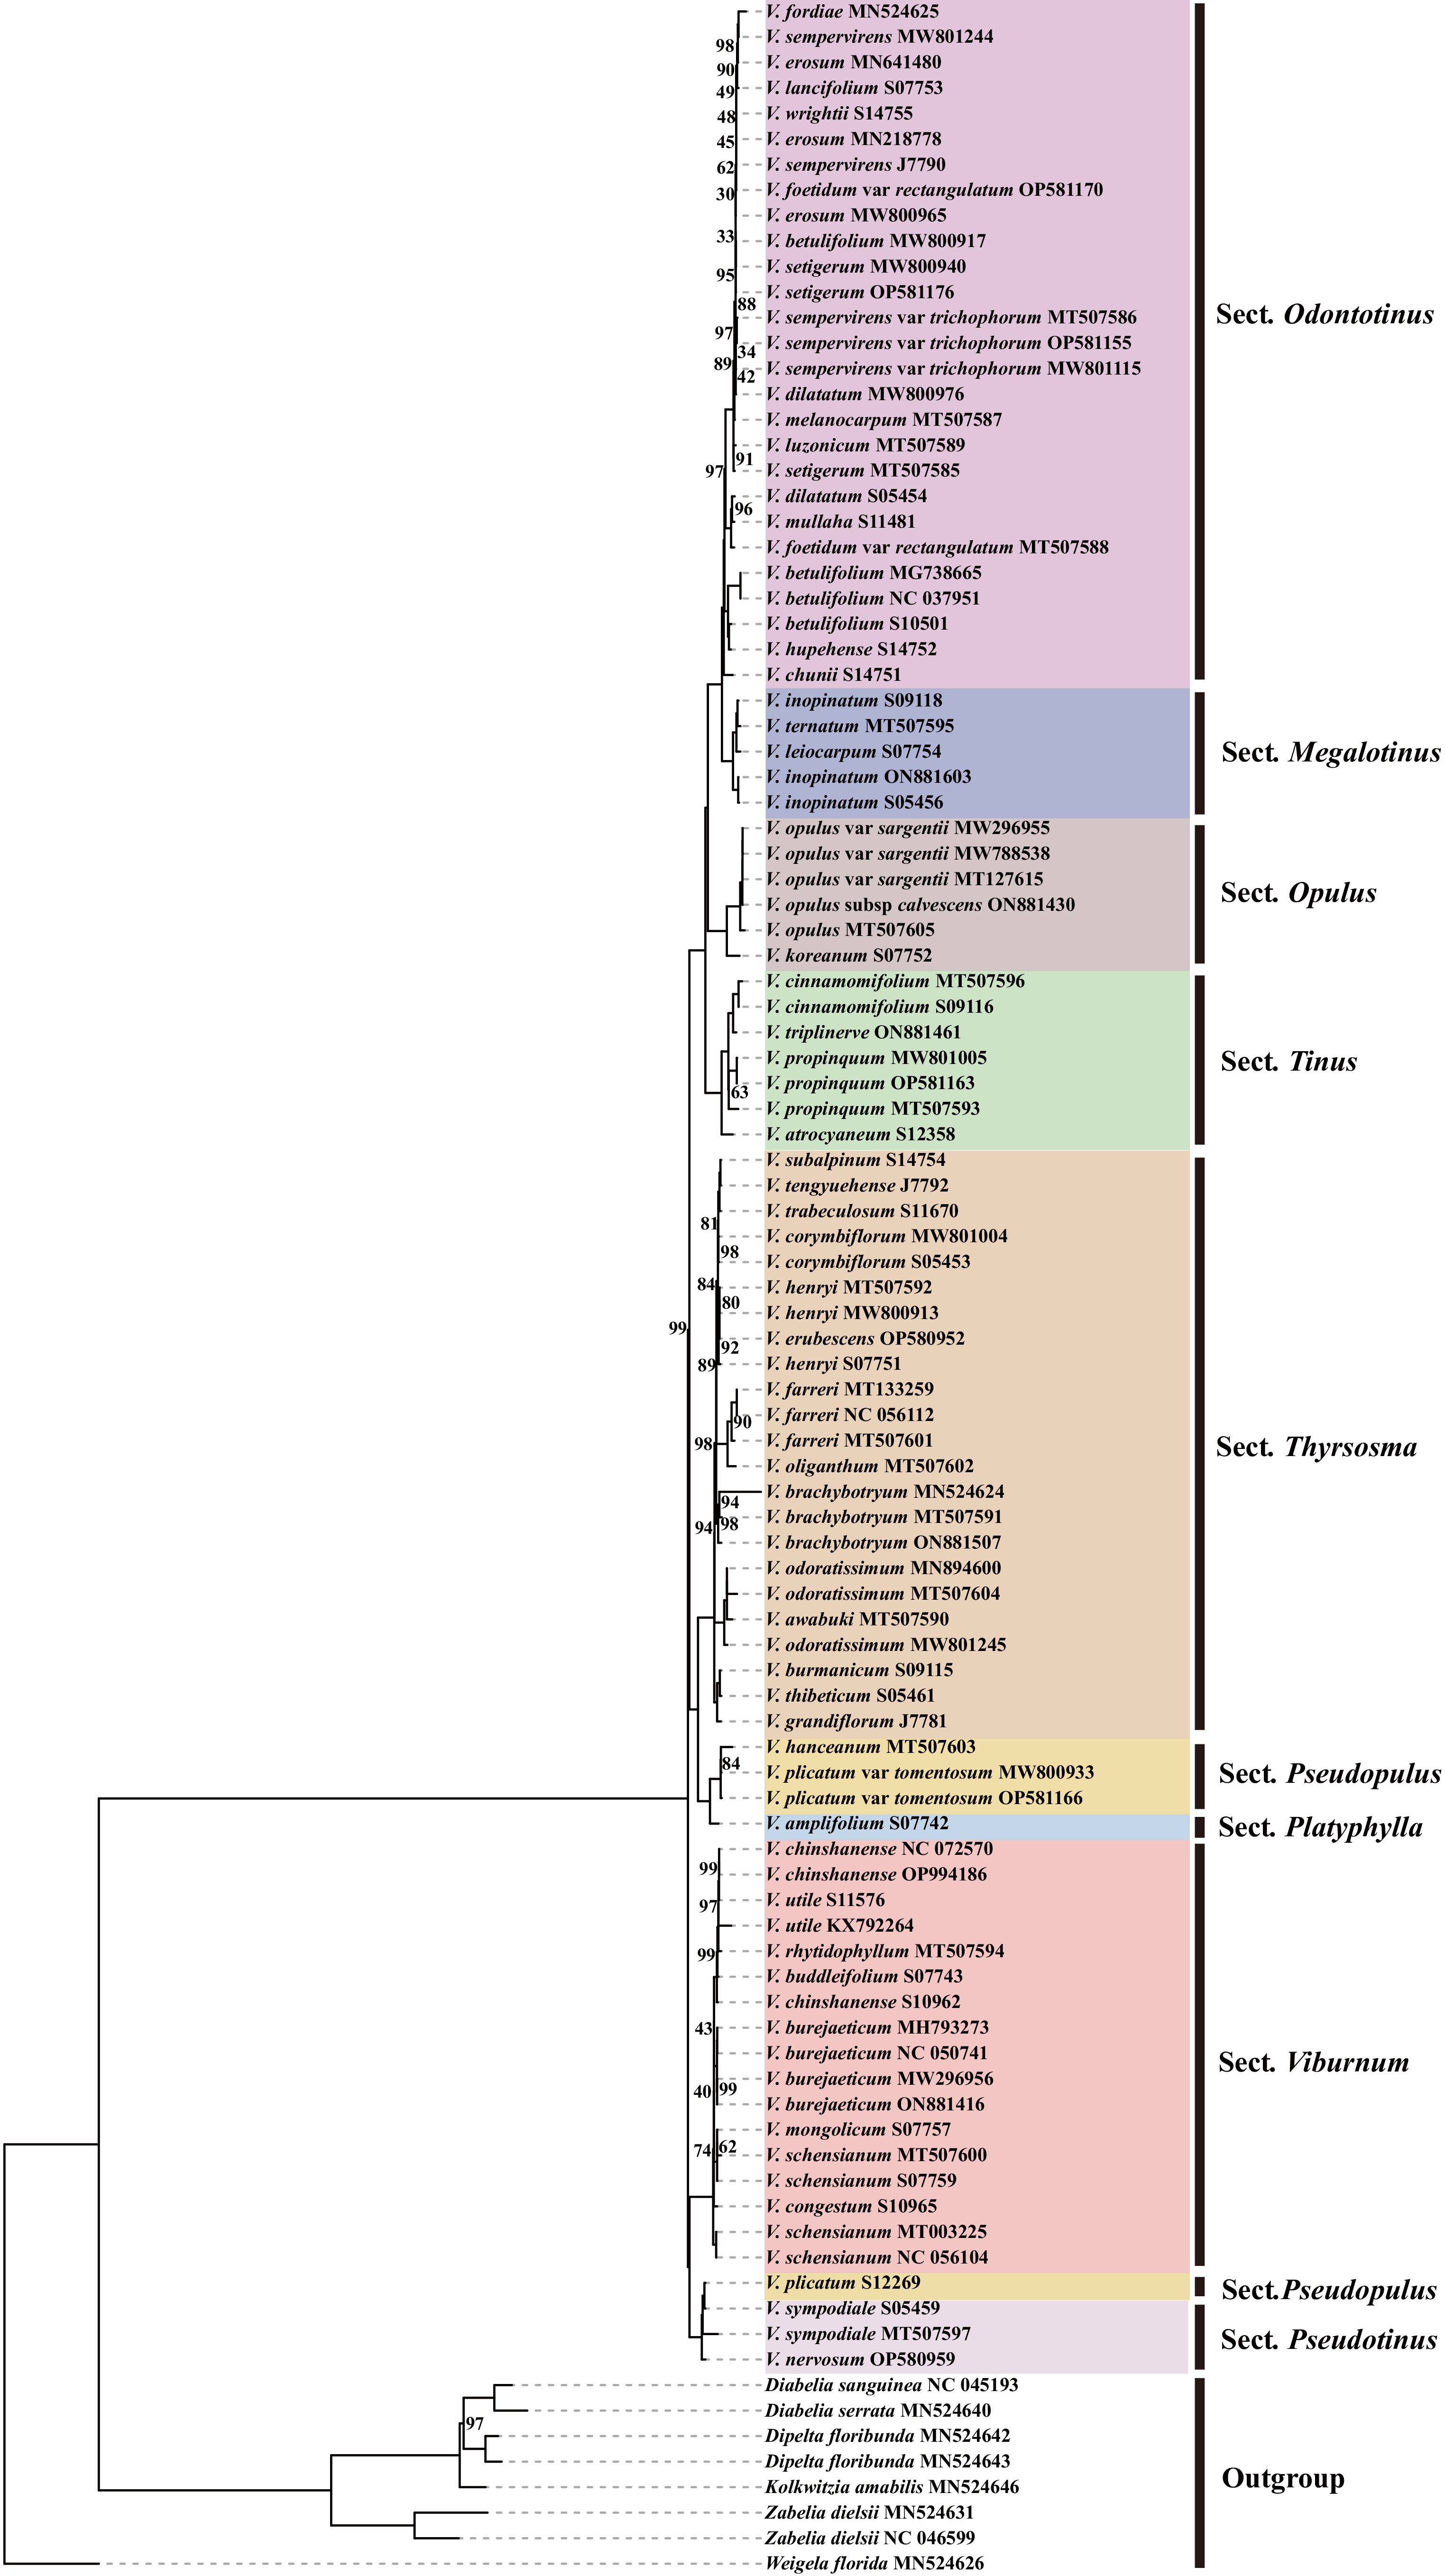
Figure 3.
IQtree constructed based on chloroplast whole genome data.
-
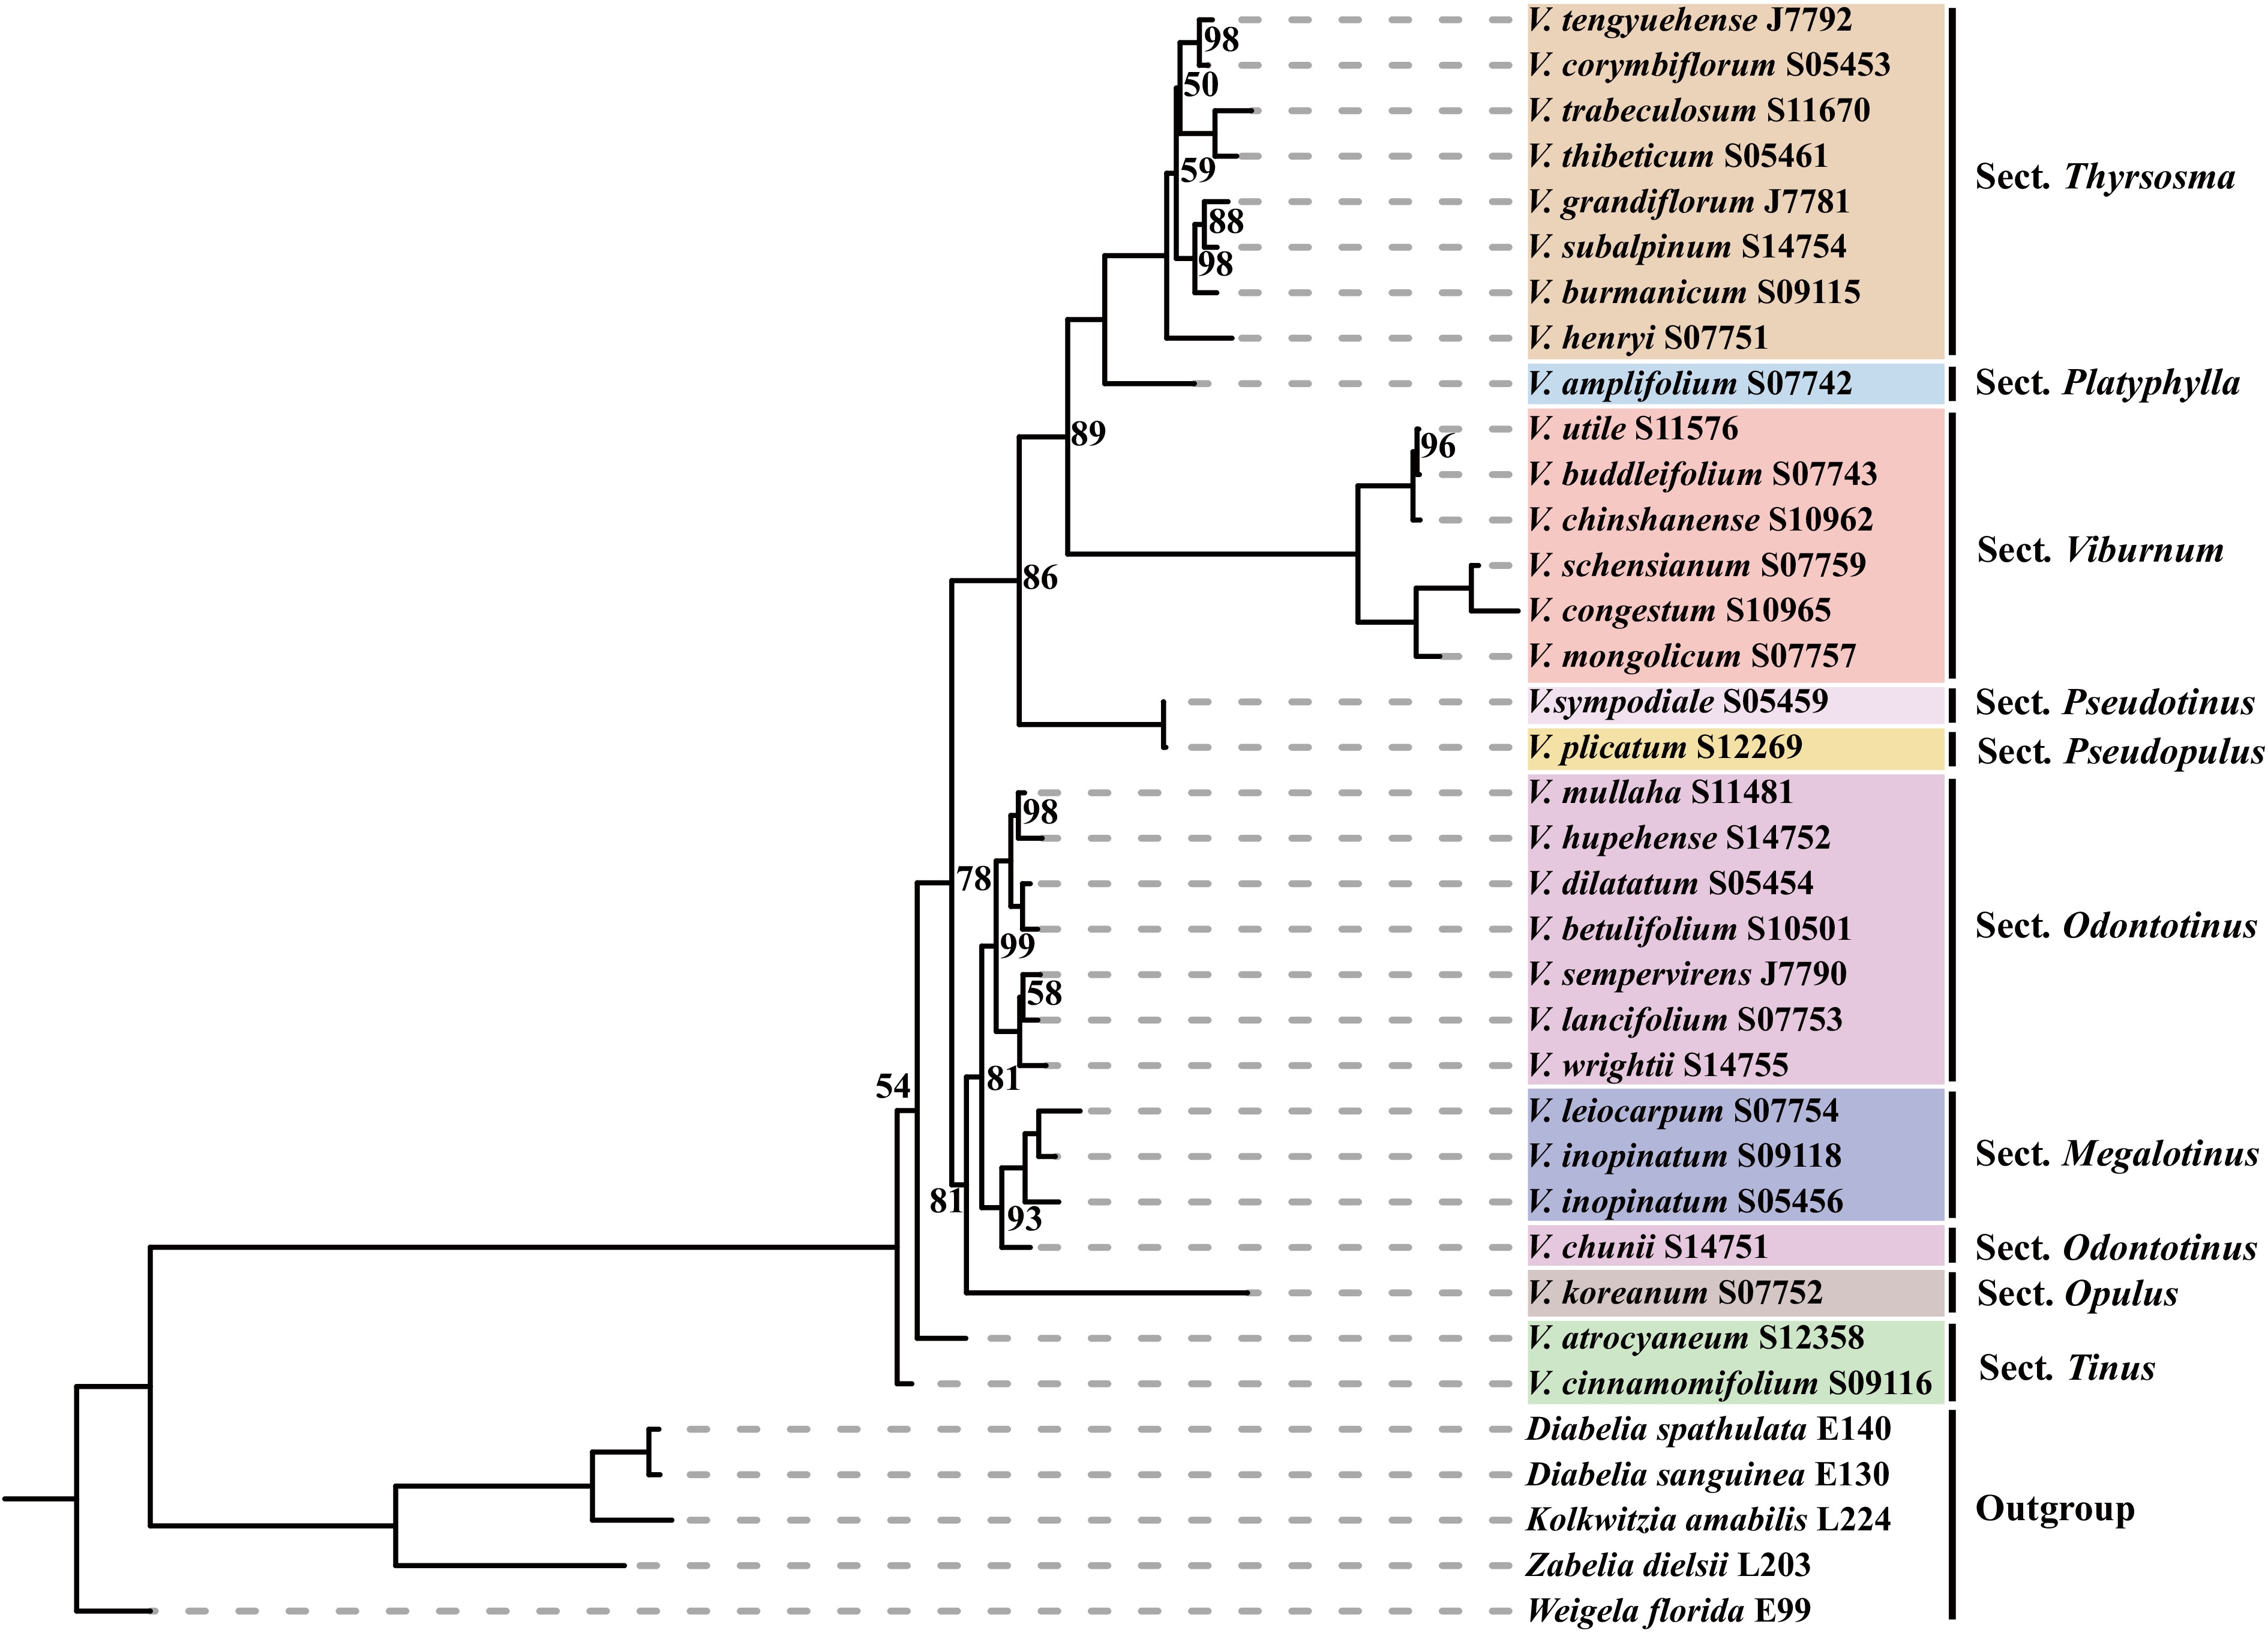
Figure 4.
IQtree constructed based on internal and external transcribed spacers (ITS and ETS) of nuclear genes.
-
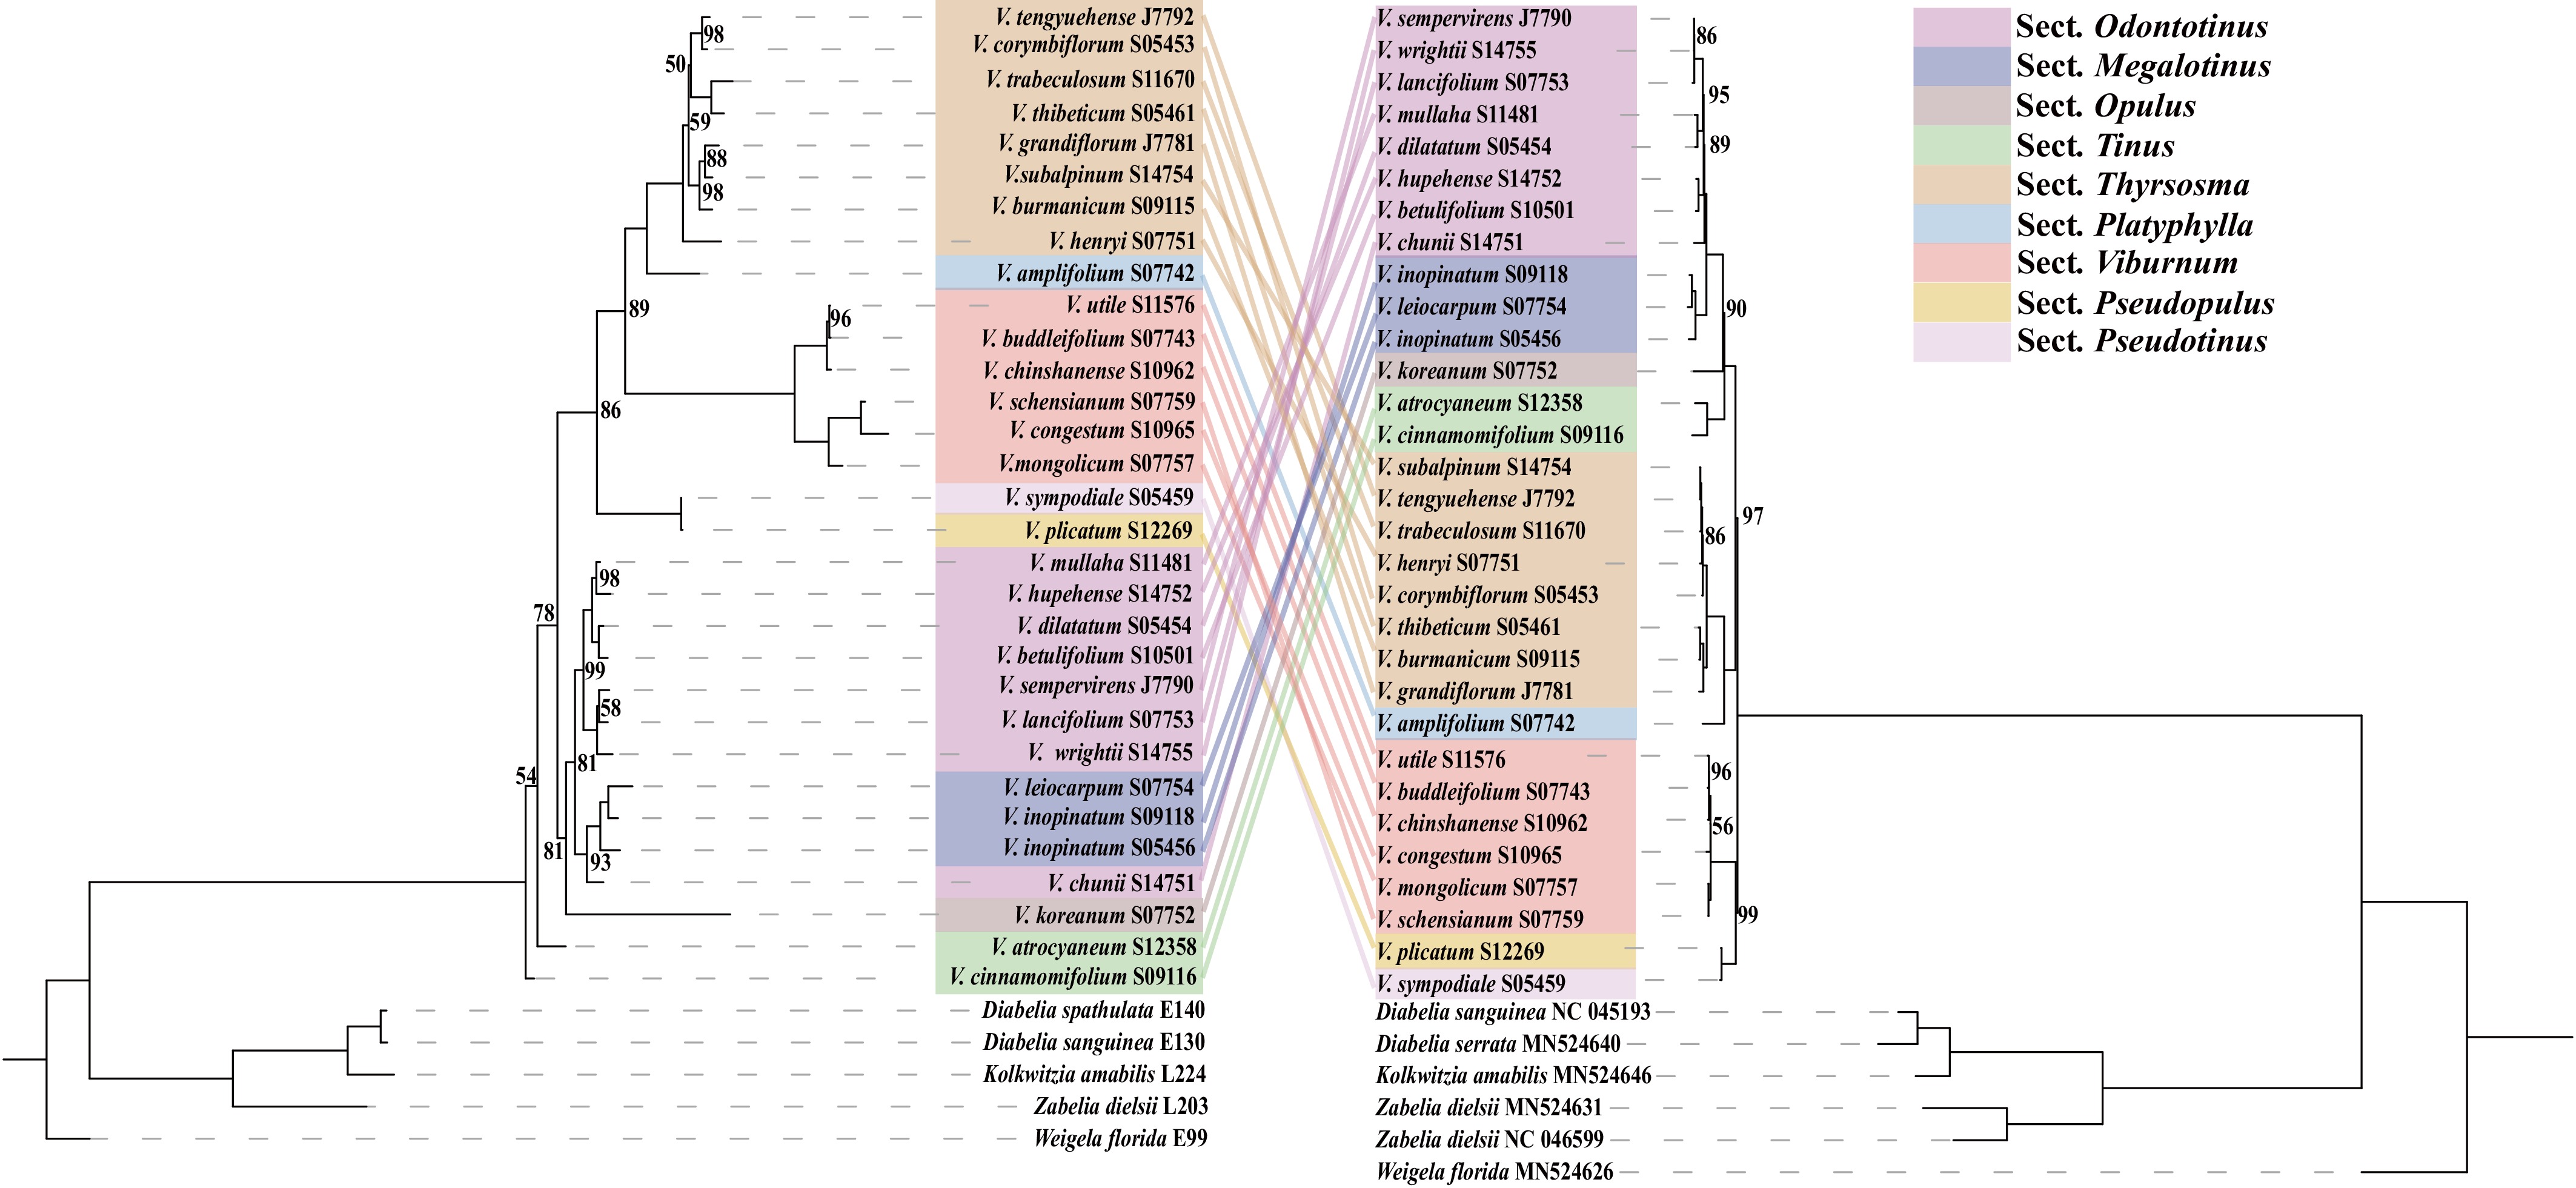
Figure 5.
Comparative phylogenetic trees of nuclear genes (left) and chloroplasts (right) are shown. The dotted lines connect homologous taxa on both phylogenetic trees.
-
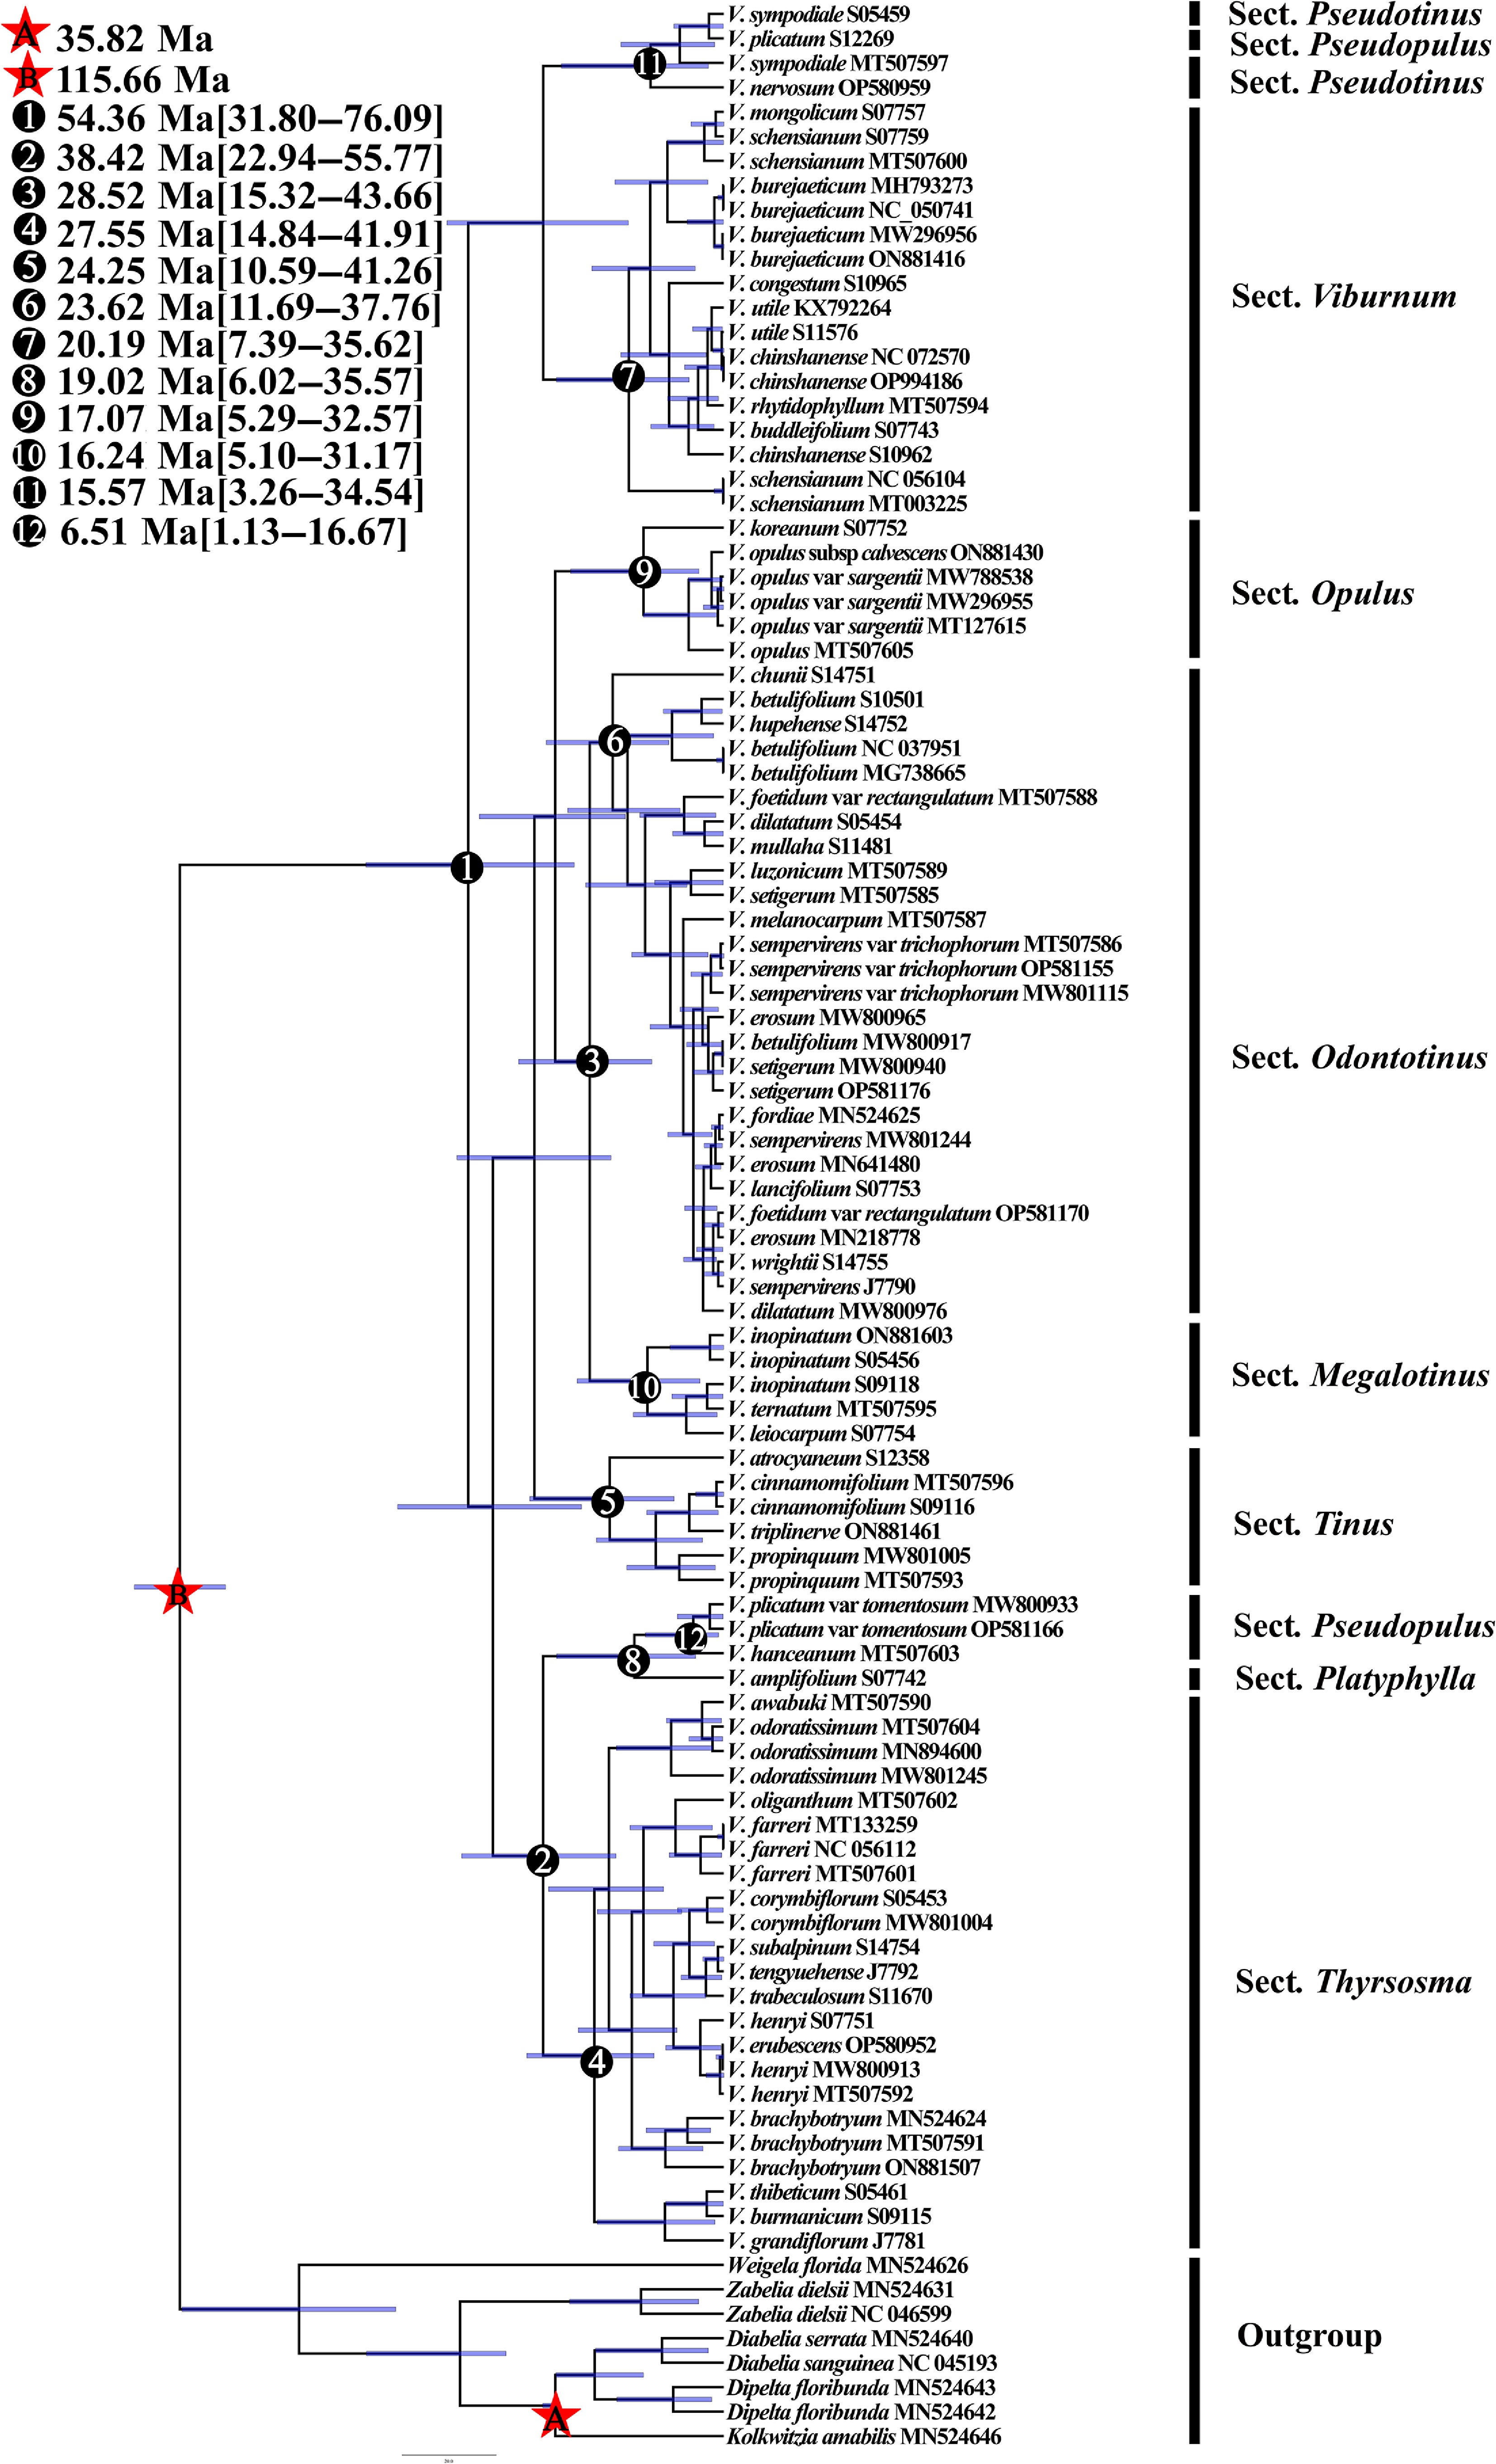
Figure 6.
BEAST divergence time analysis based on whole chloroplast genome construction. Calibration points are indicated by asterisks. Numbers 1–12 represent major divergence events in Viburnum.
-
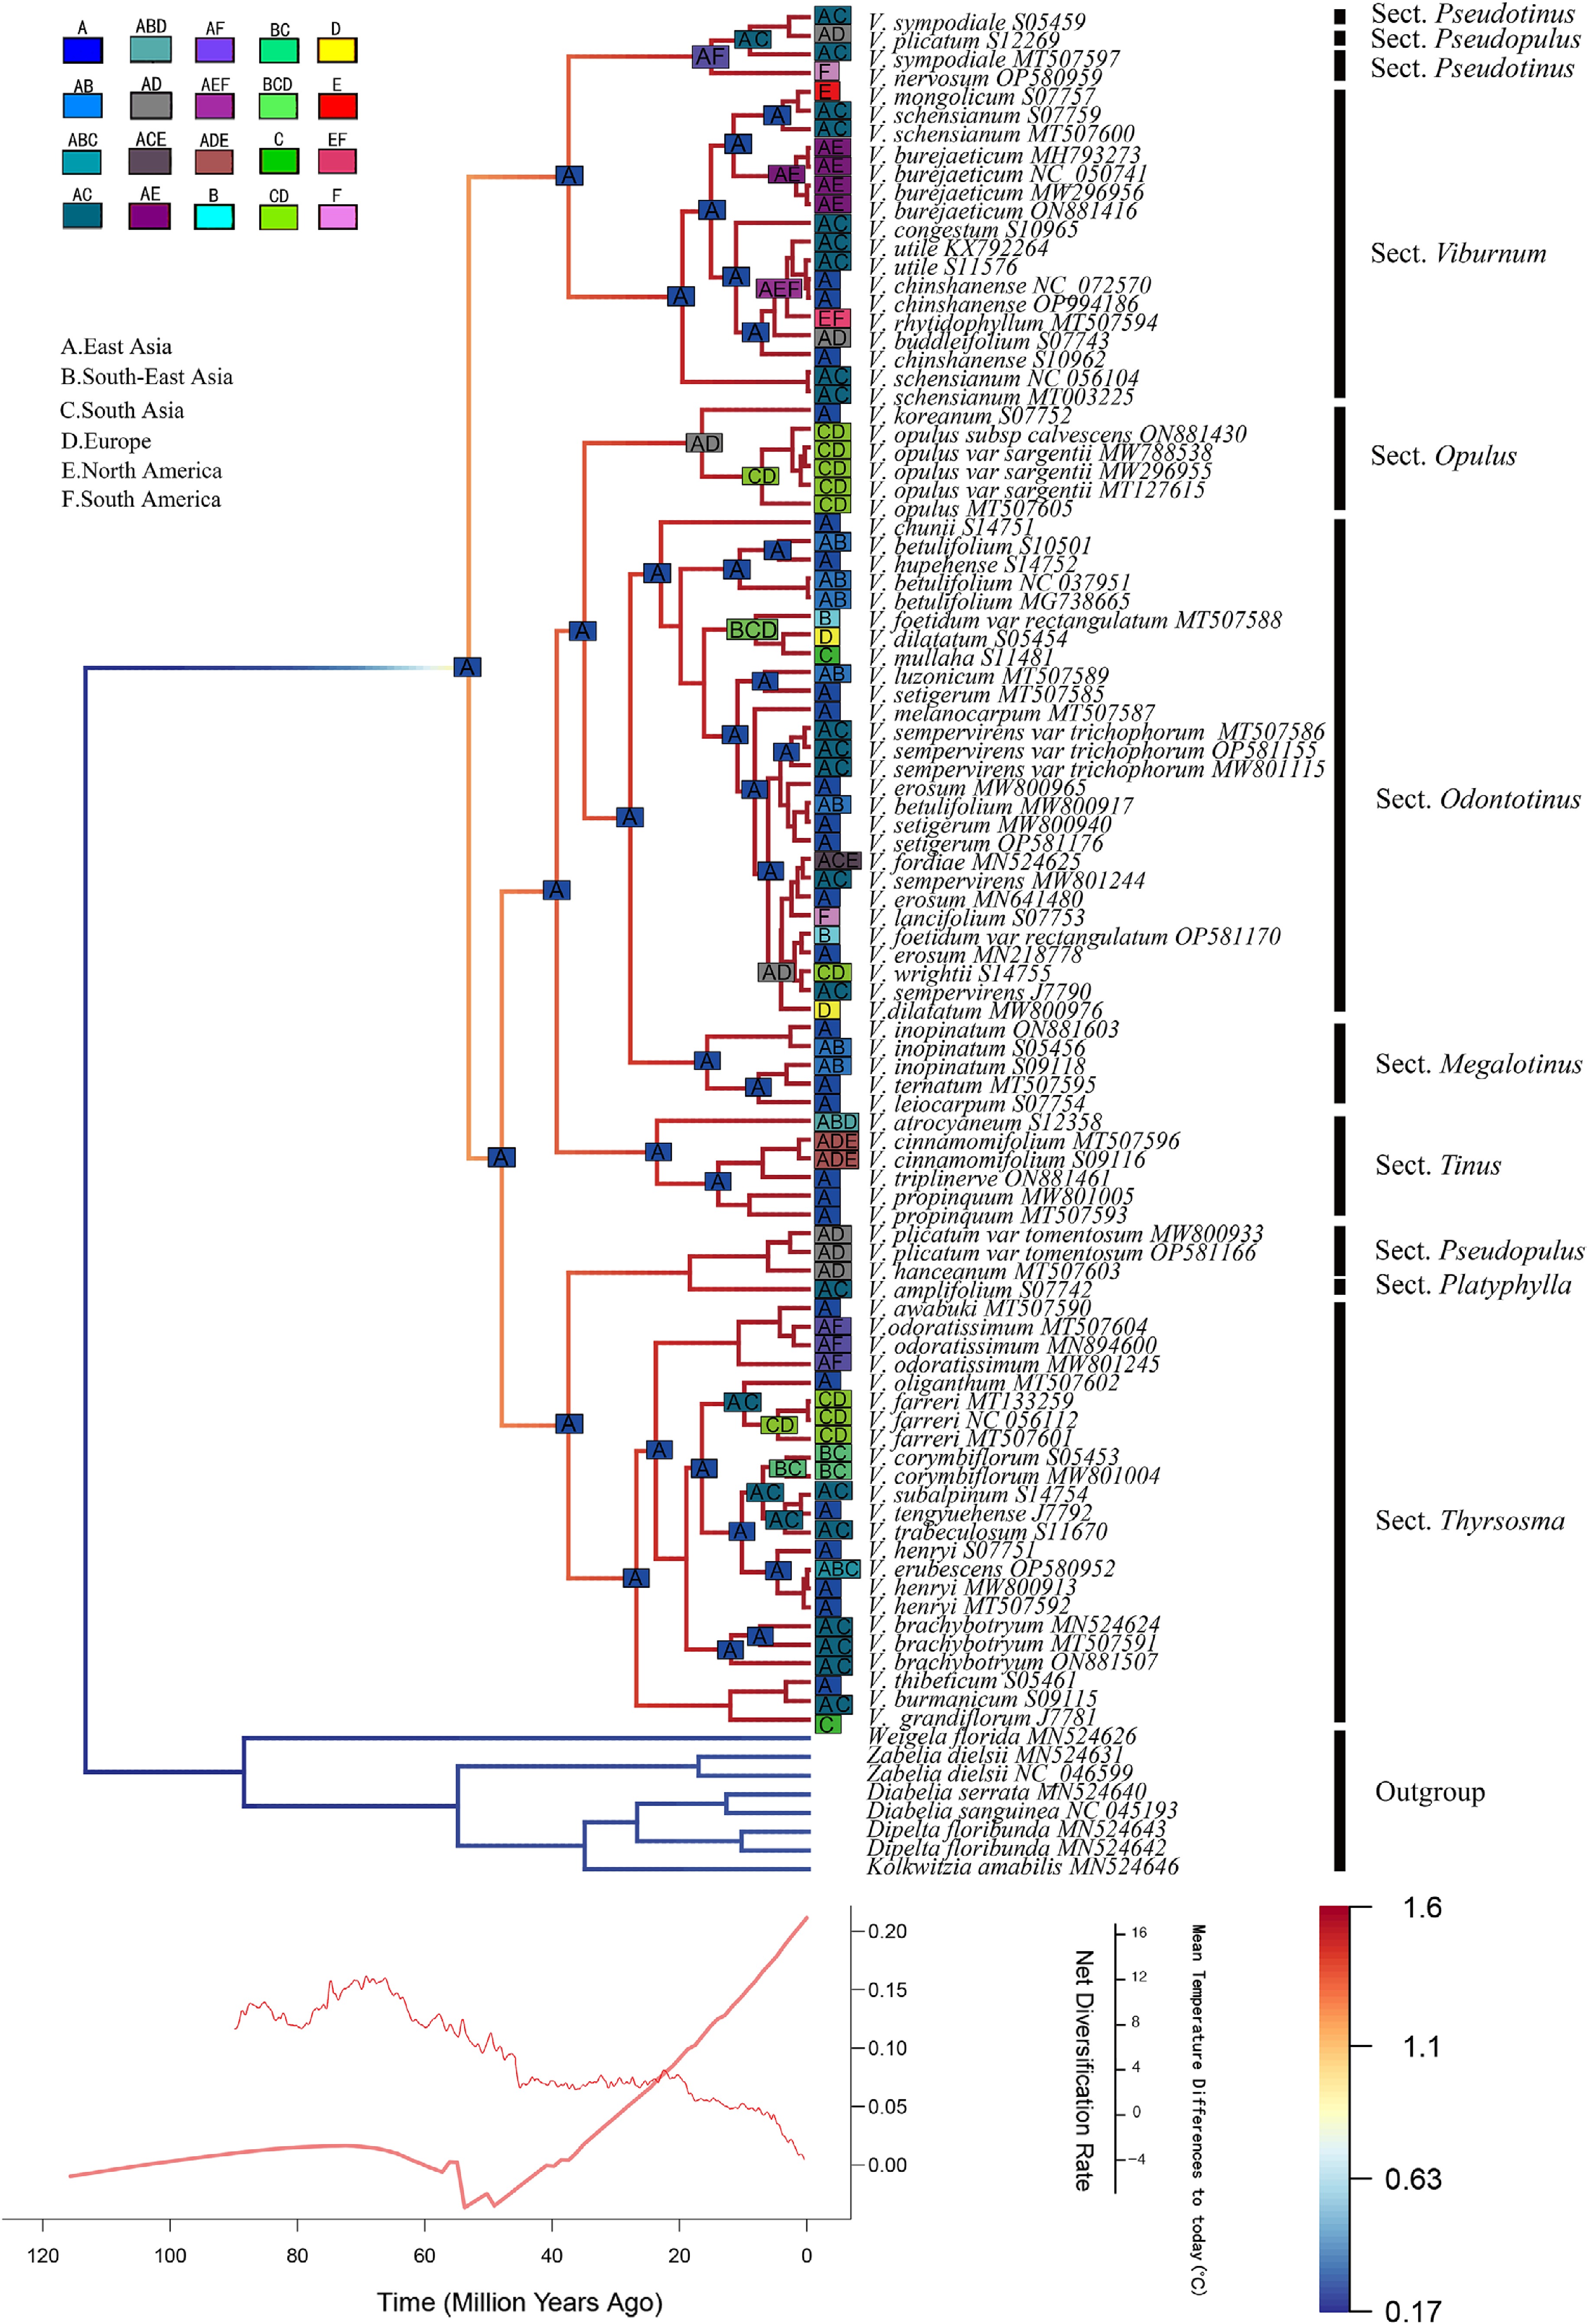
Figure 7.
DEC + J model used in BioGeoBEARS to infer ancestral distribution areas of Viburnum, (a) East Asia, (b) Southeast Asia, (c) South Asia, (d) Europe, (e) North America, and (f) South America. BAMM plot depicting trajectory of net diversification rate over time vs. global temperature change[39].
-
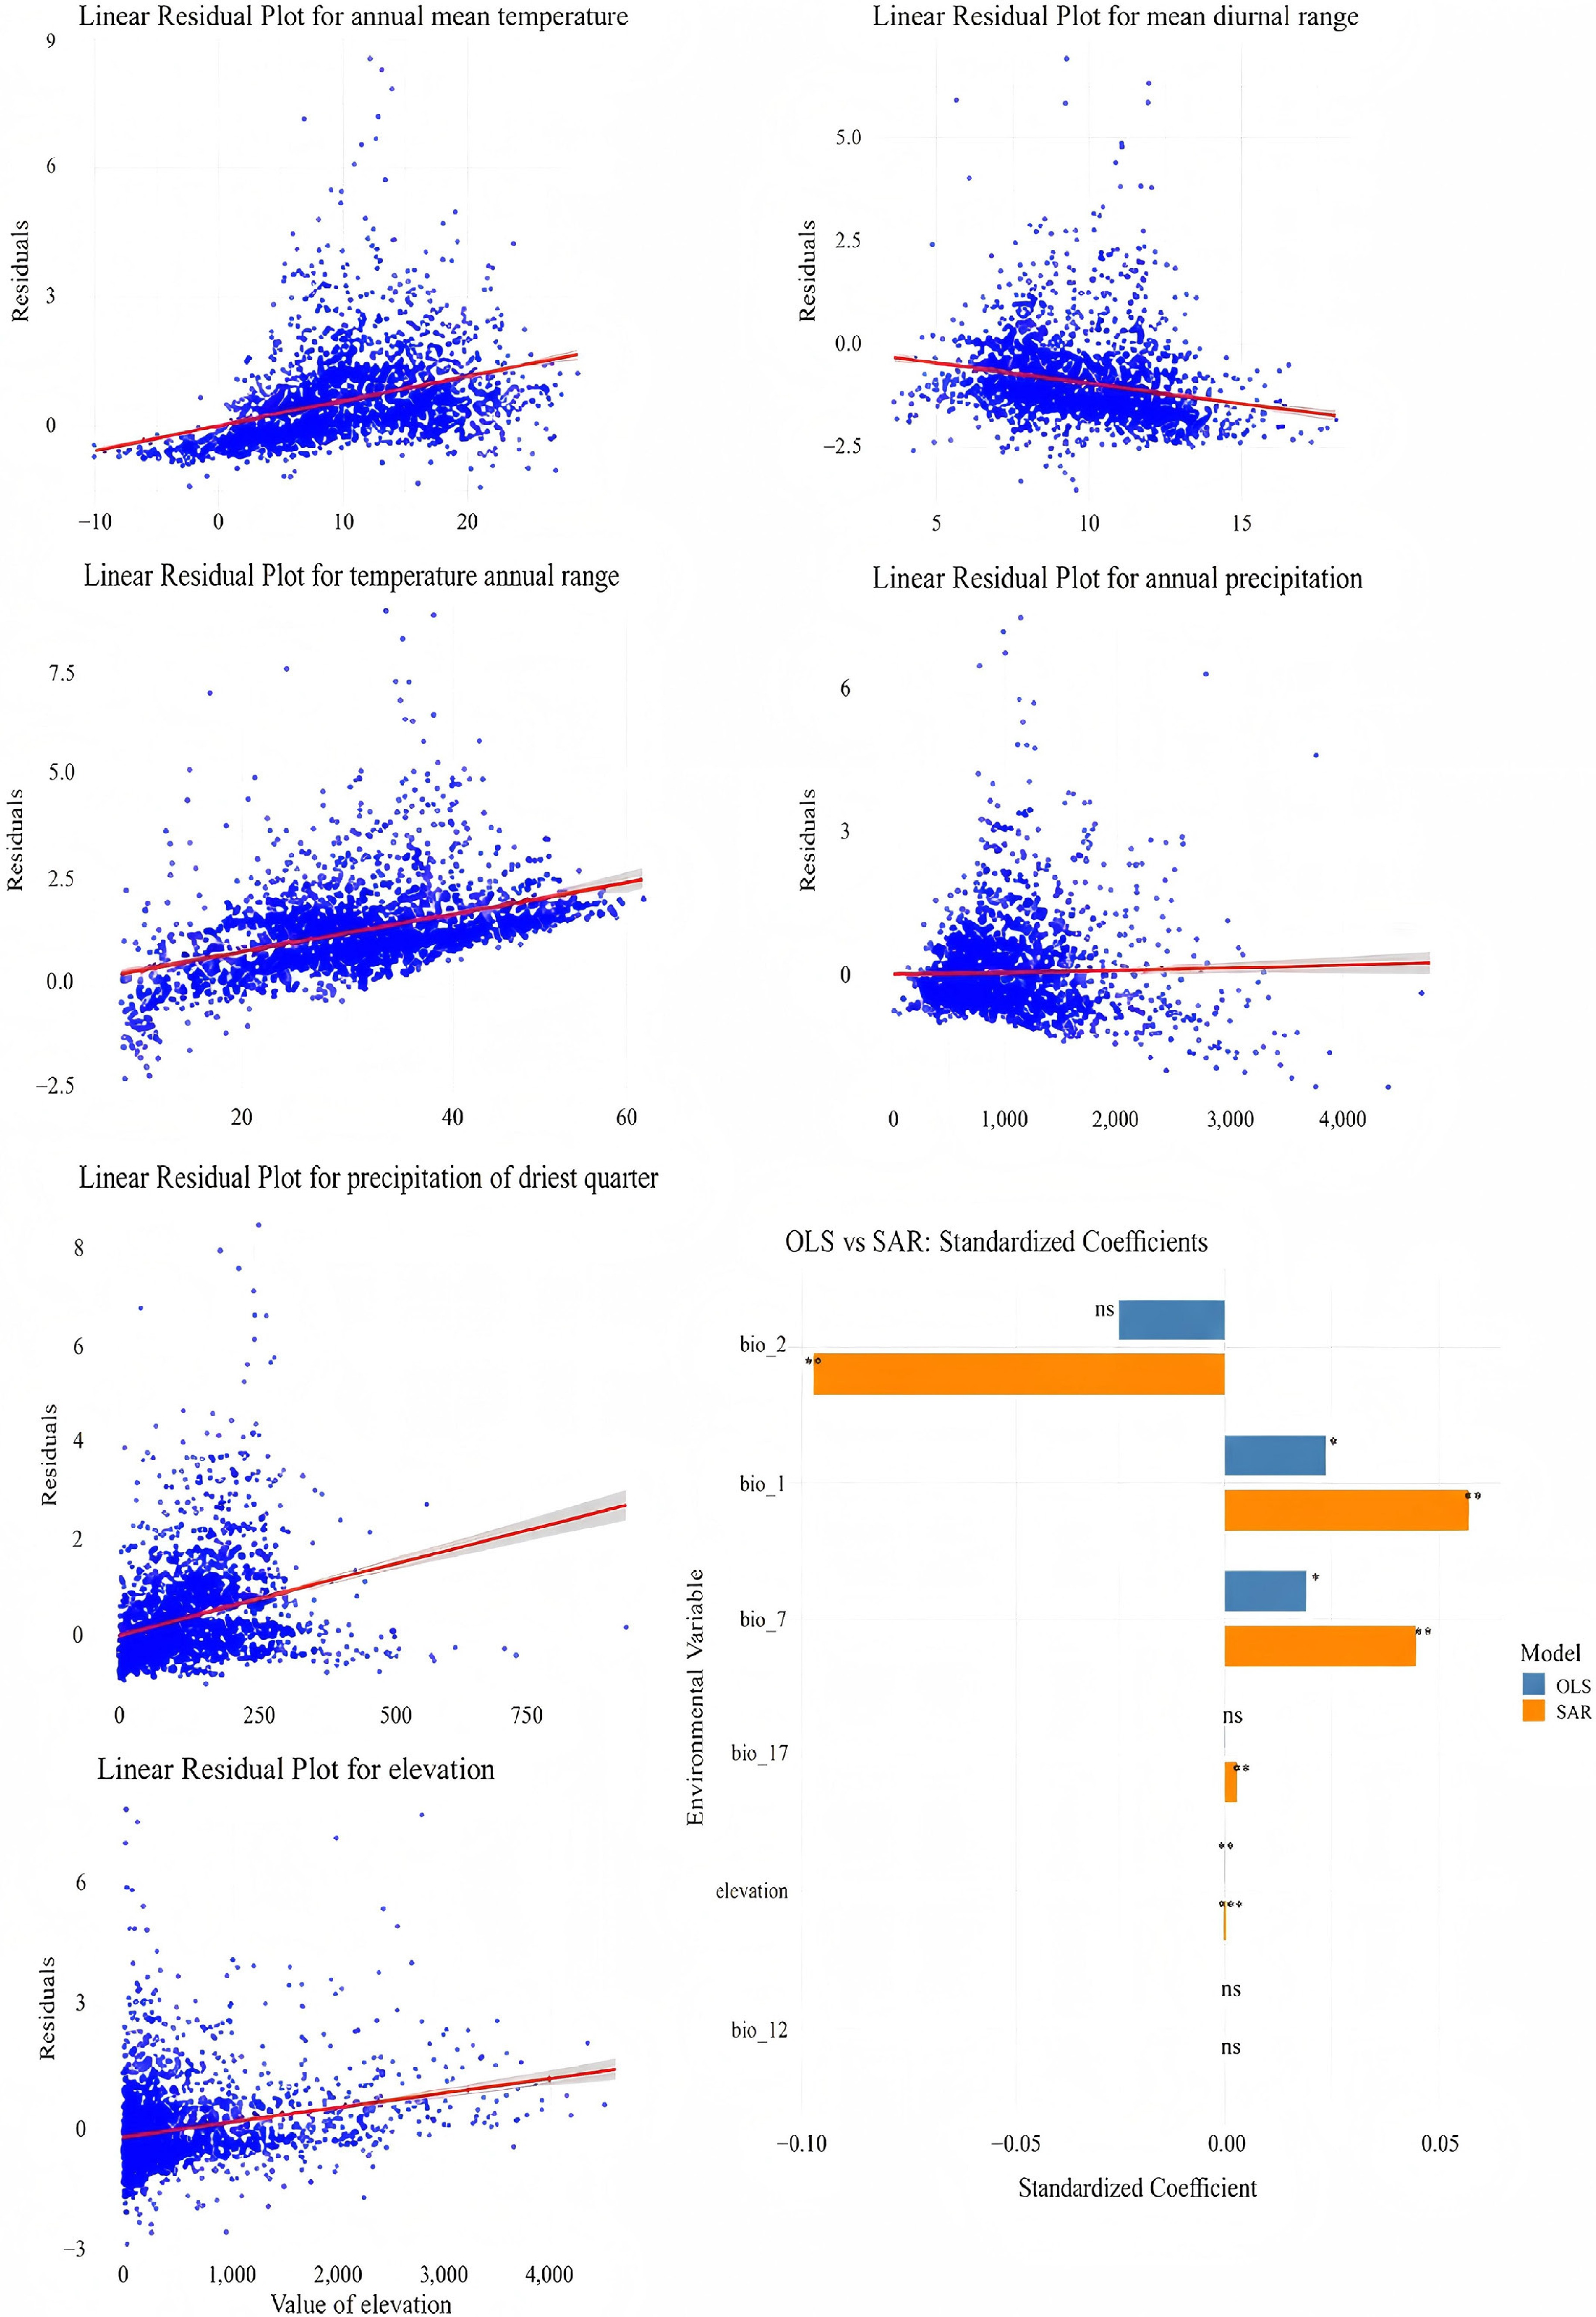
Figure 8.
Effects of different environmental factors on Viburnum species diversity. Bar graphs show the correlation between six variables; BIO1: mean annual air temperature; BIO2: mean diurnal temperature difference; BIO7: annual temperature difference; BIO12: annual precipitation; BIO17: precipitation in the driest season; and a topographic factor (altitude).
Figures
(8)
Tables
(0)