-
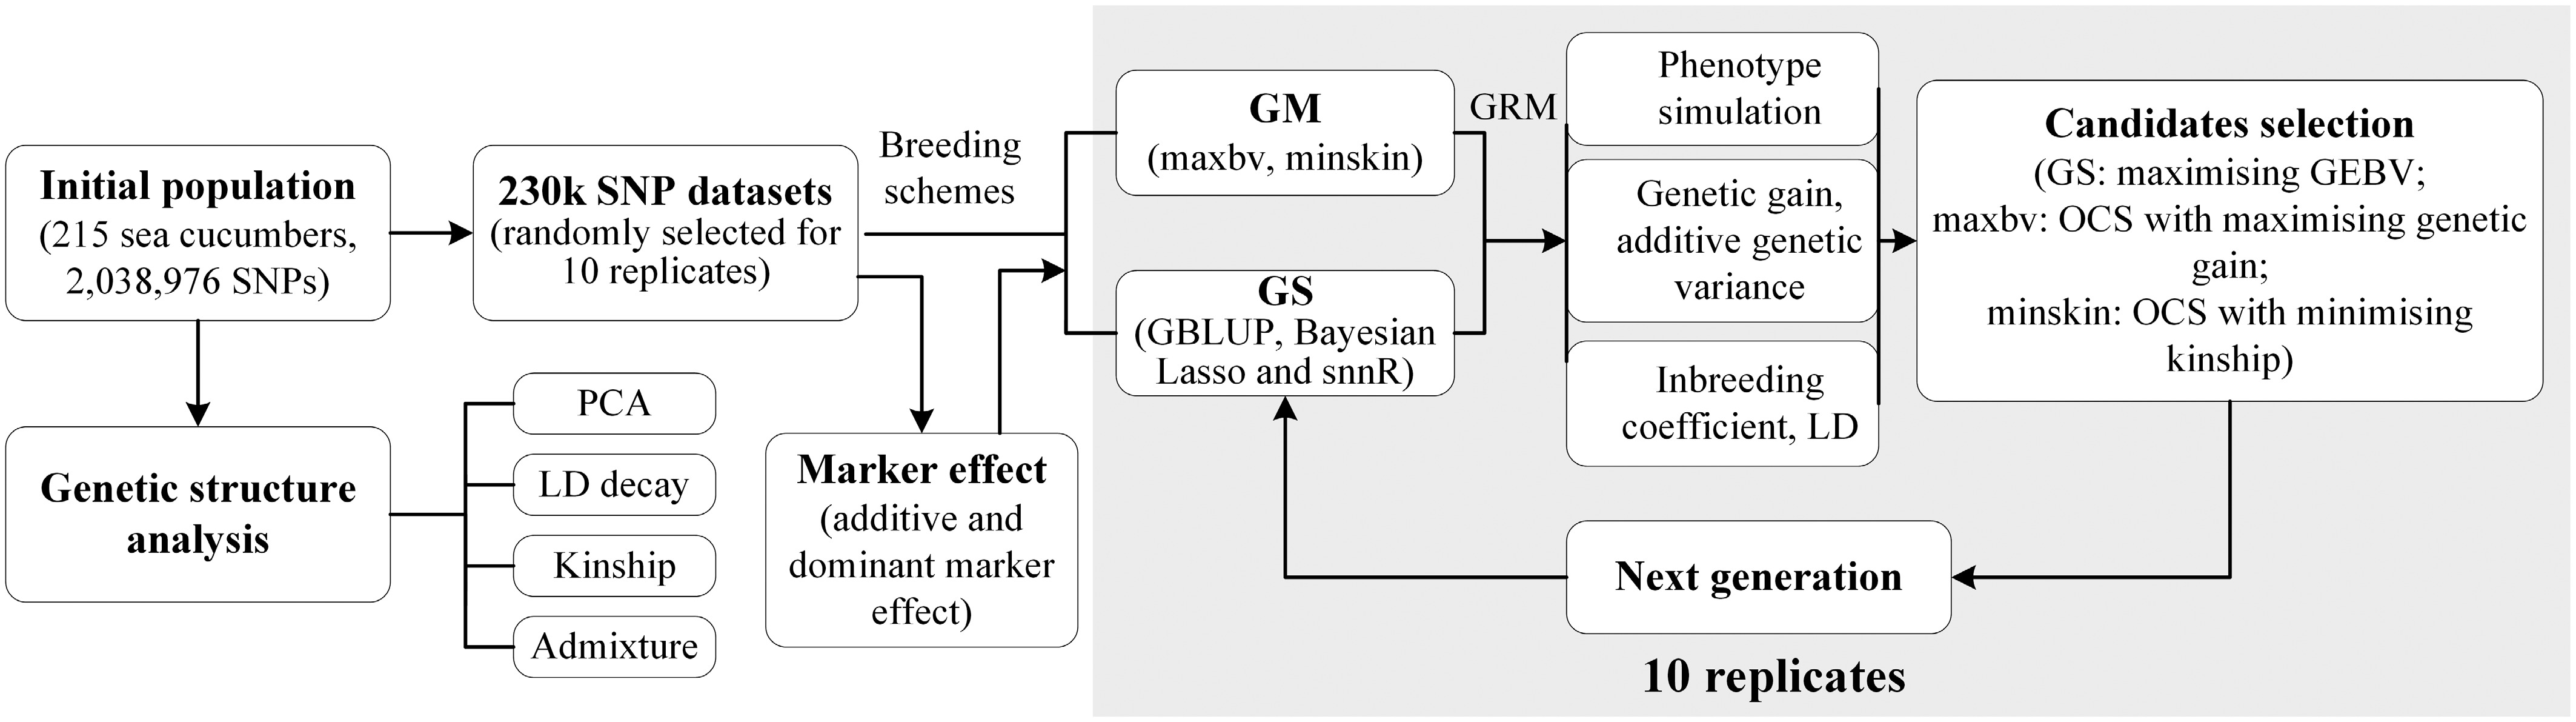
Figure 1.
Construction process of genomic selection (GS) and genomic mating (GM) for breeding simulation.
-
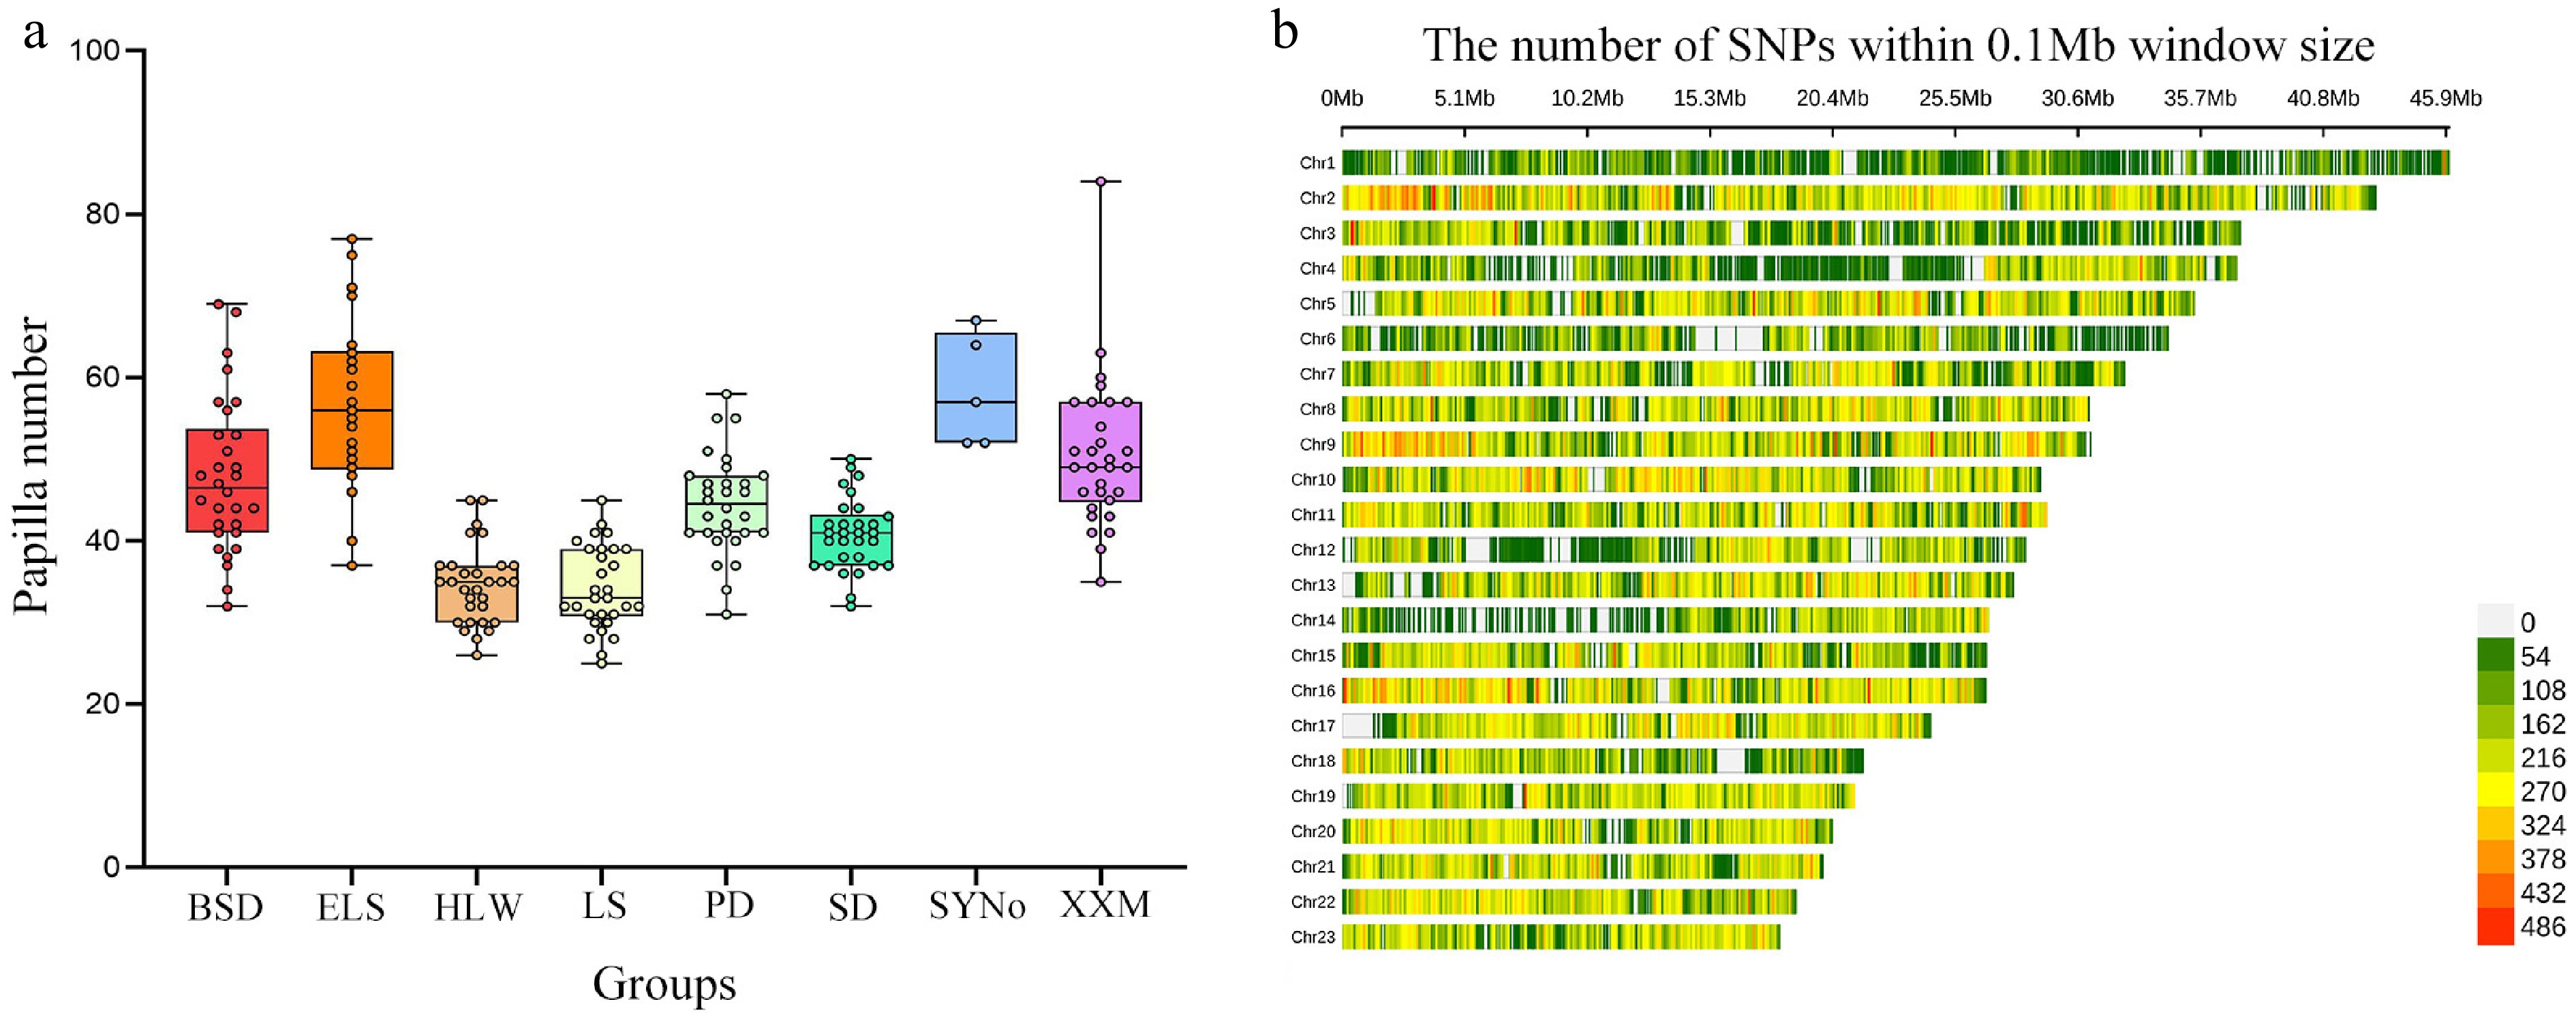
Figure 2.
Phenotypic and genotypic data for the initial population. (a) Statistics for papilla number of 215 sea cucumbers from eight different geographical locations. (b) SNP density distribution plot.
-
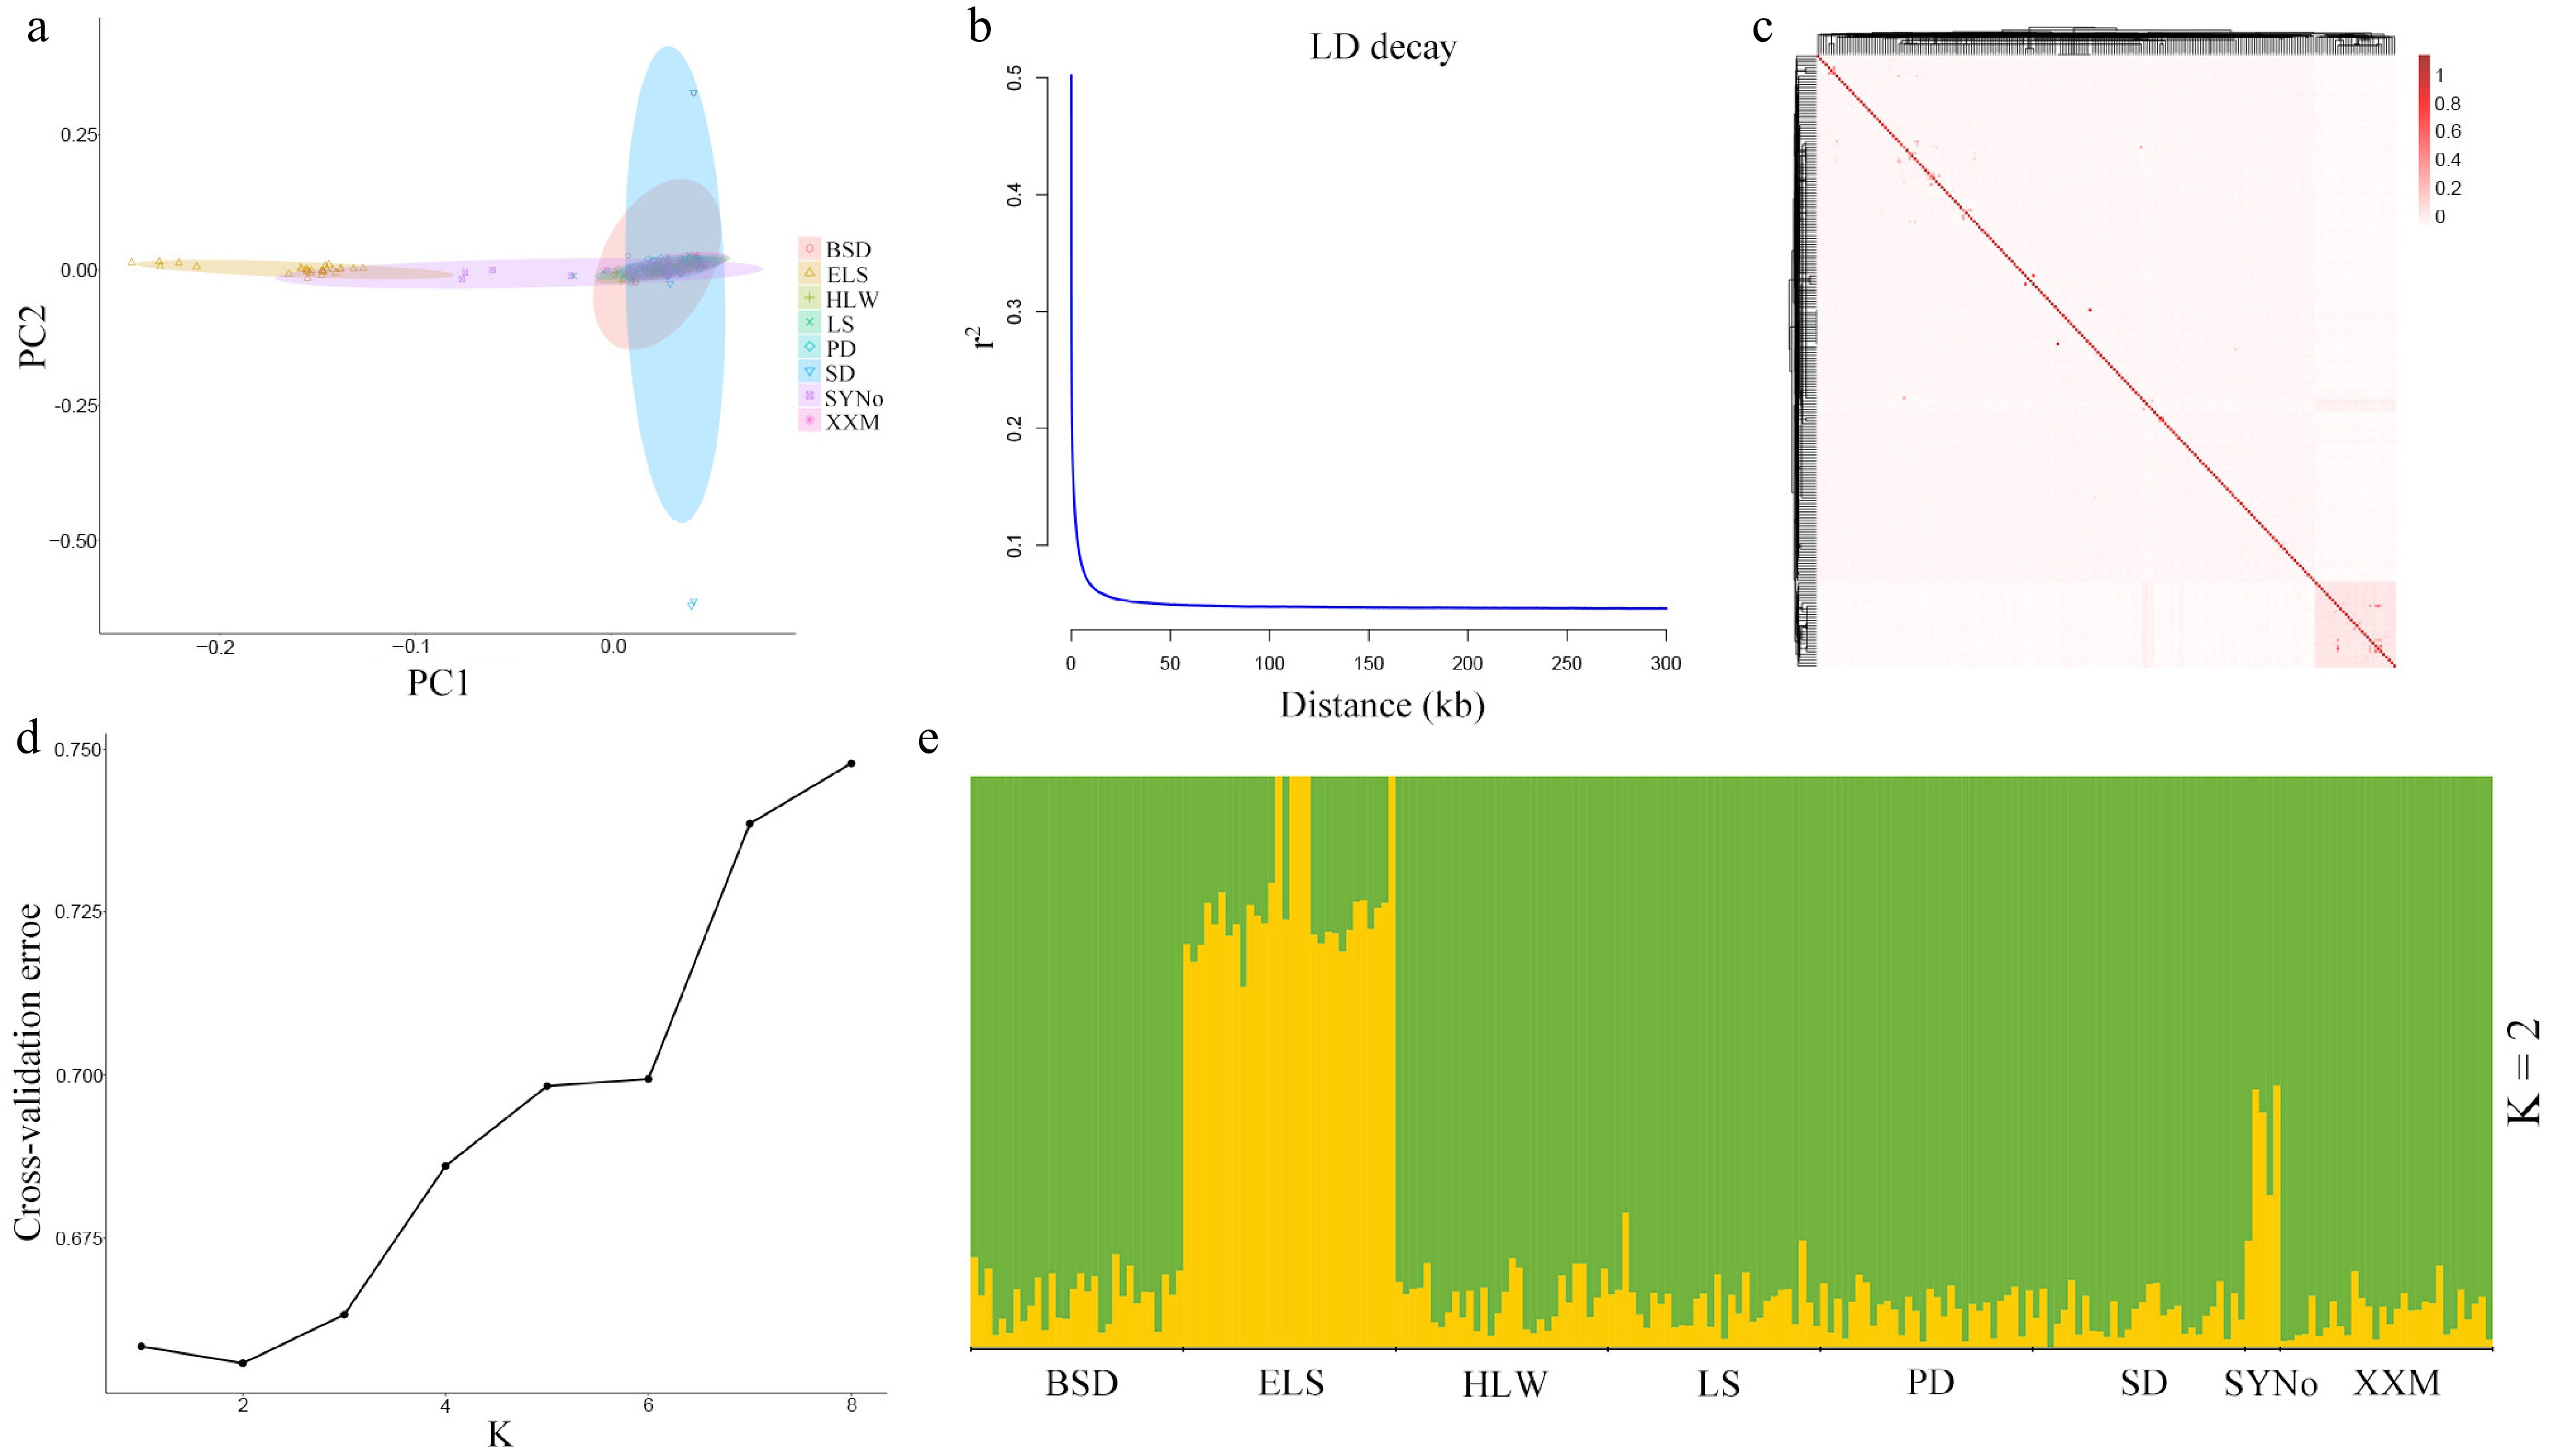
Figure 3.
Population genetic analysis of 215 sea cucumbers of the initial population. (a) Principle component analysis (PCA) plots. (b) LD decay plot. (c) Heatmap plot of kinship. (d), (e) Population genetic structure.
-
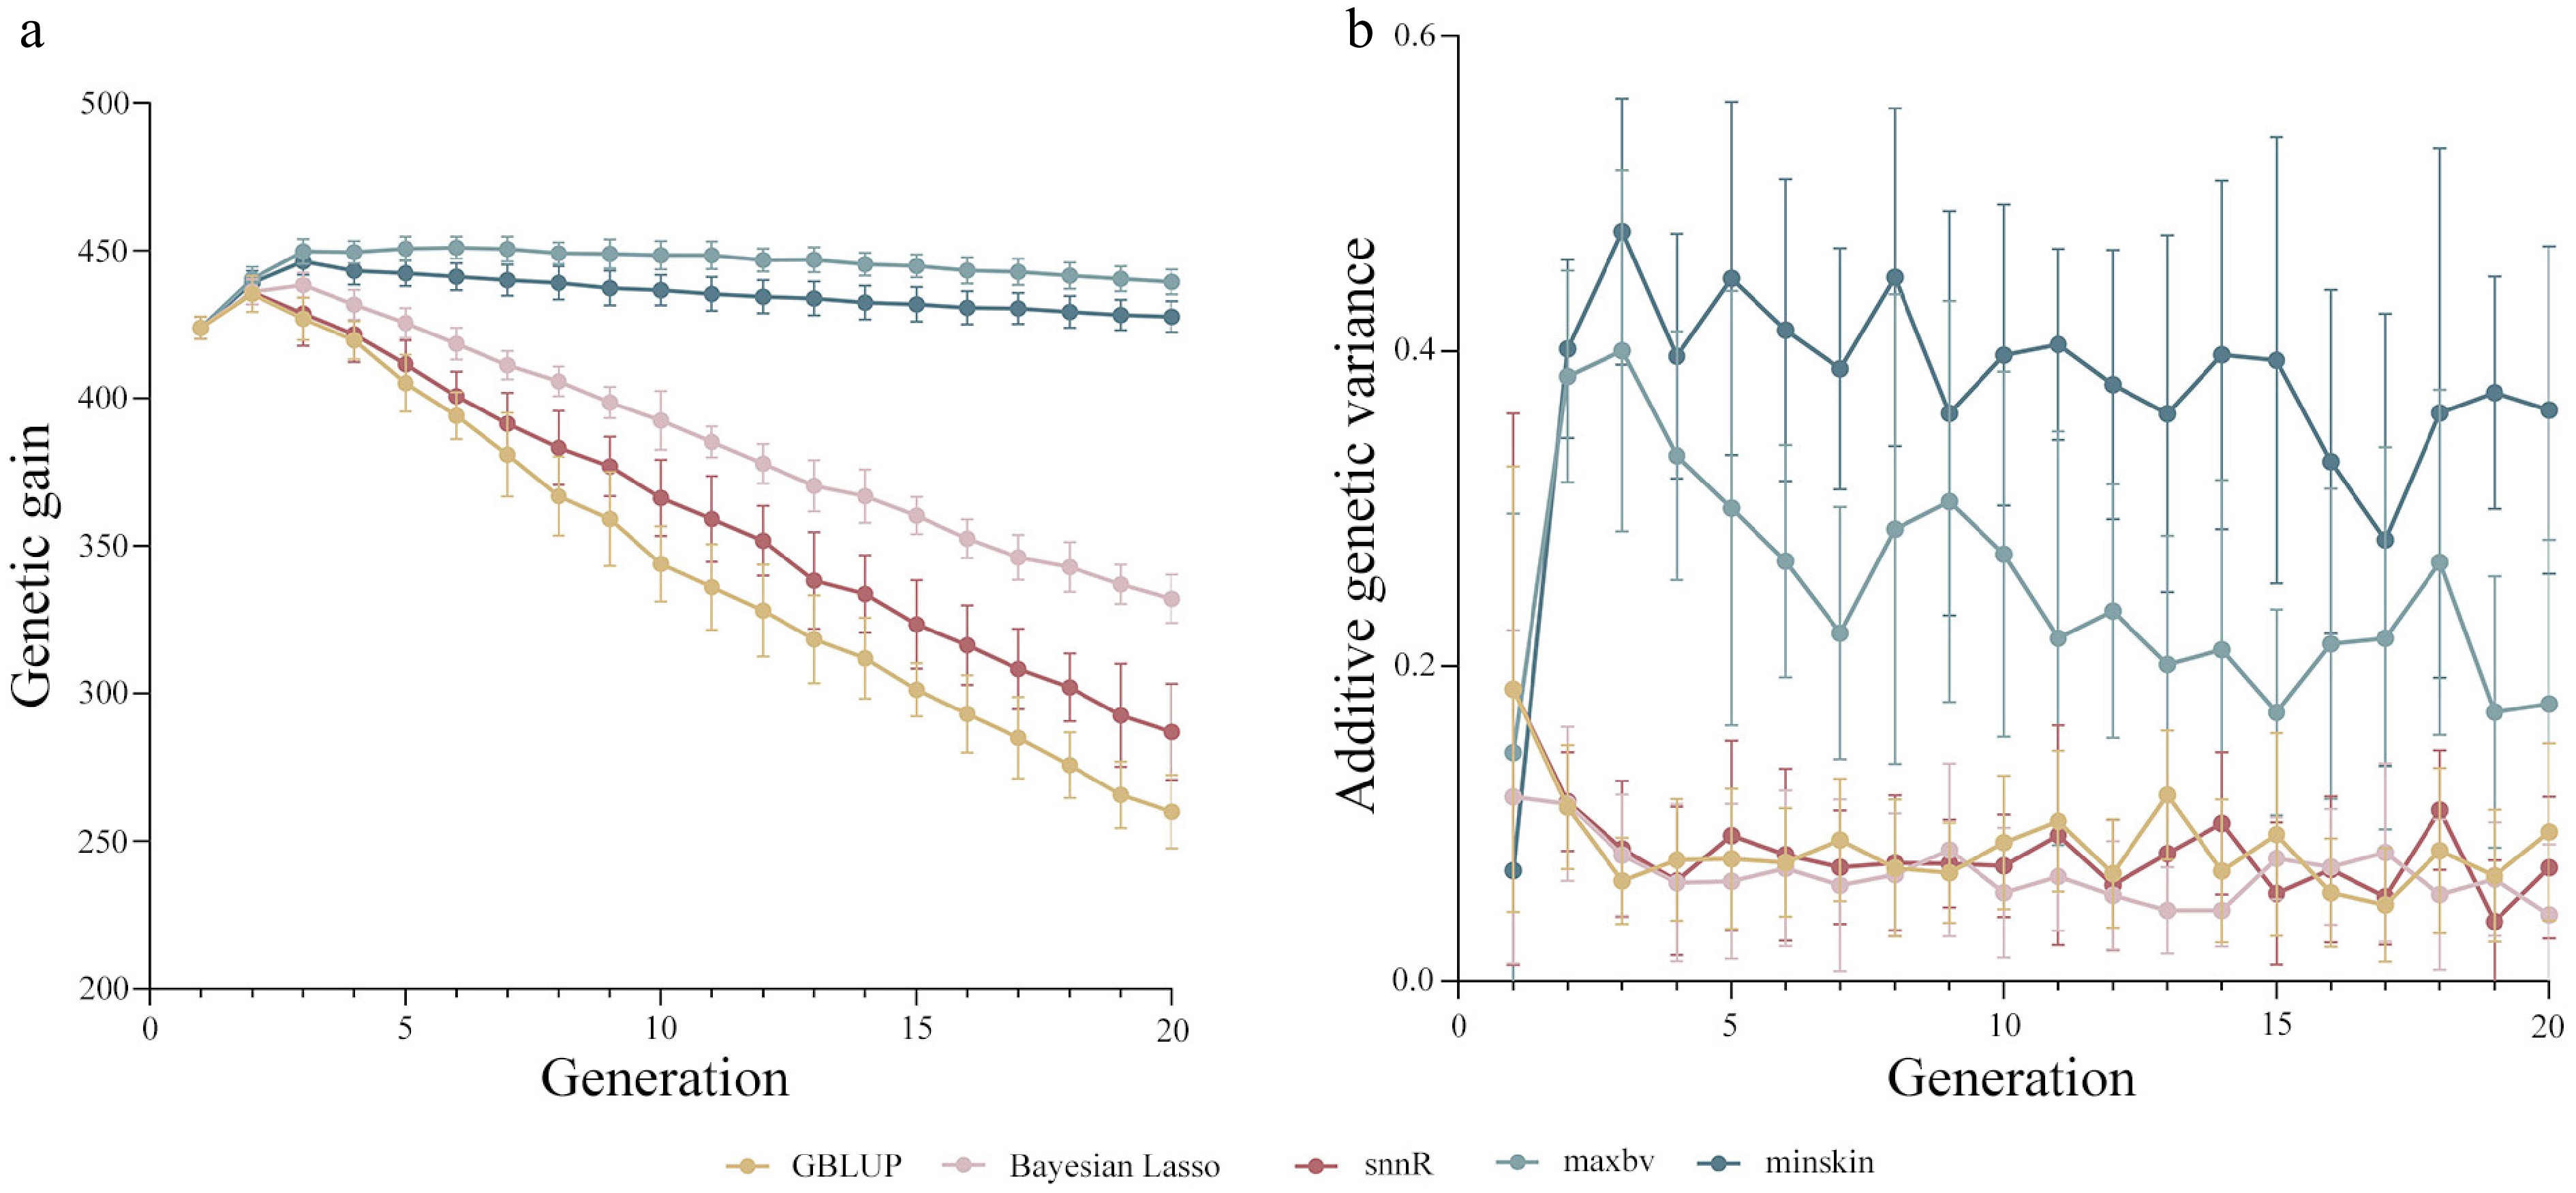
Figure 4.
(a) Genetic gain, and (b) additive genetic variance of genomic mating (GM) and genomic selection (GS) schemes on papilla number in all generations.
-
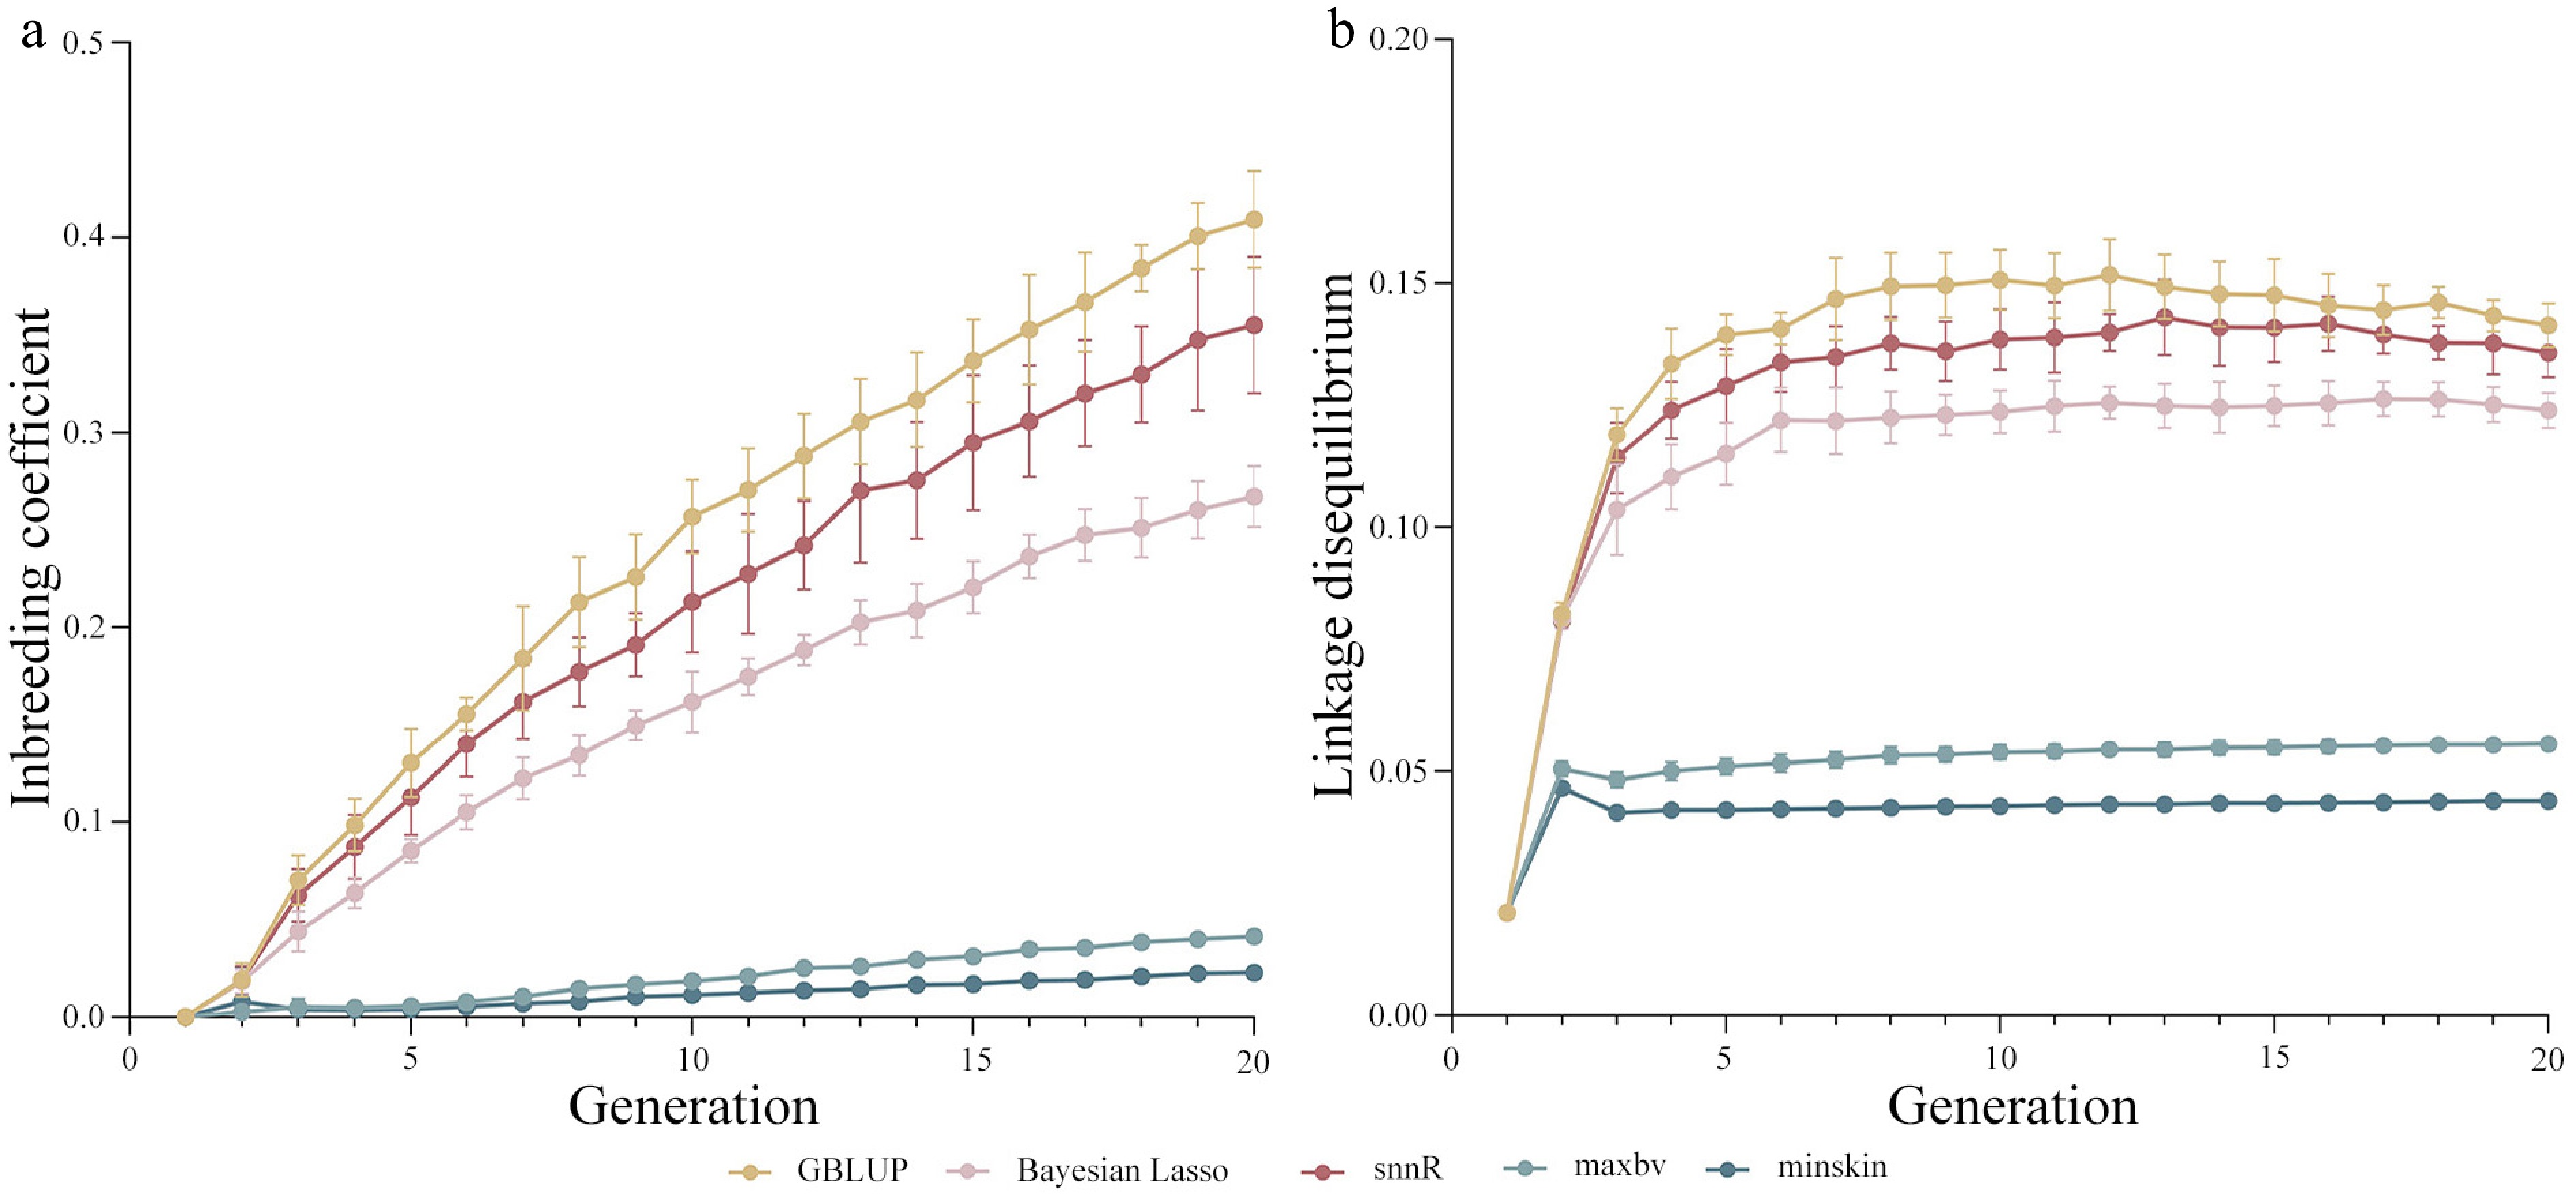
Figure 5.
(a) Genomic inbreeding coefficient, and (b) linkage disequilibrium of genomic mating (GM) and genomic selection (GS) schemes in all generations.
Figures
(5)
Tables
(0)