-
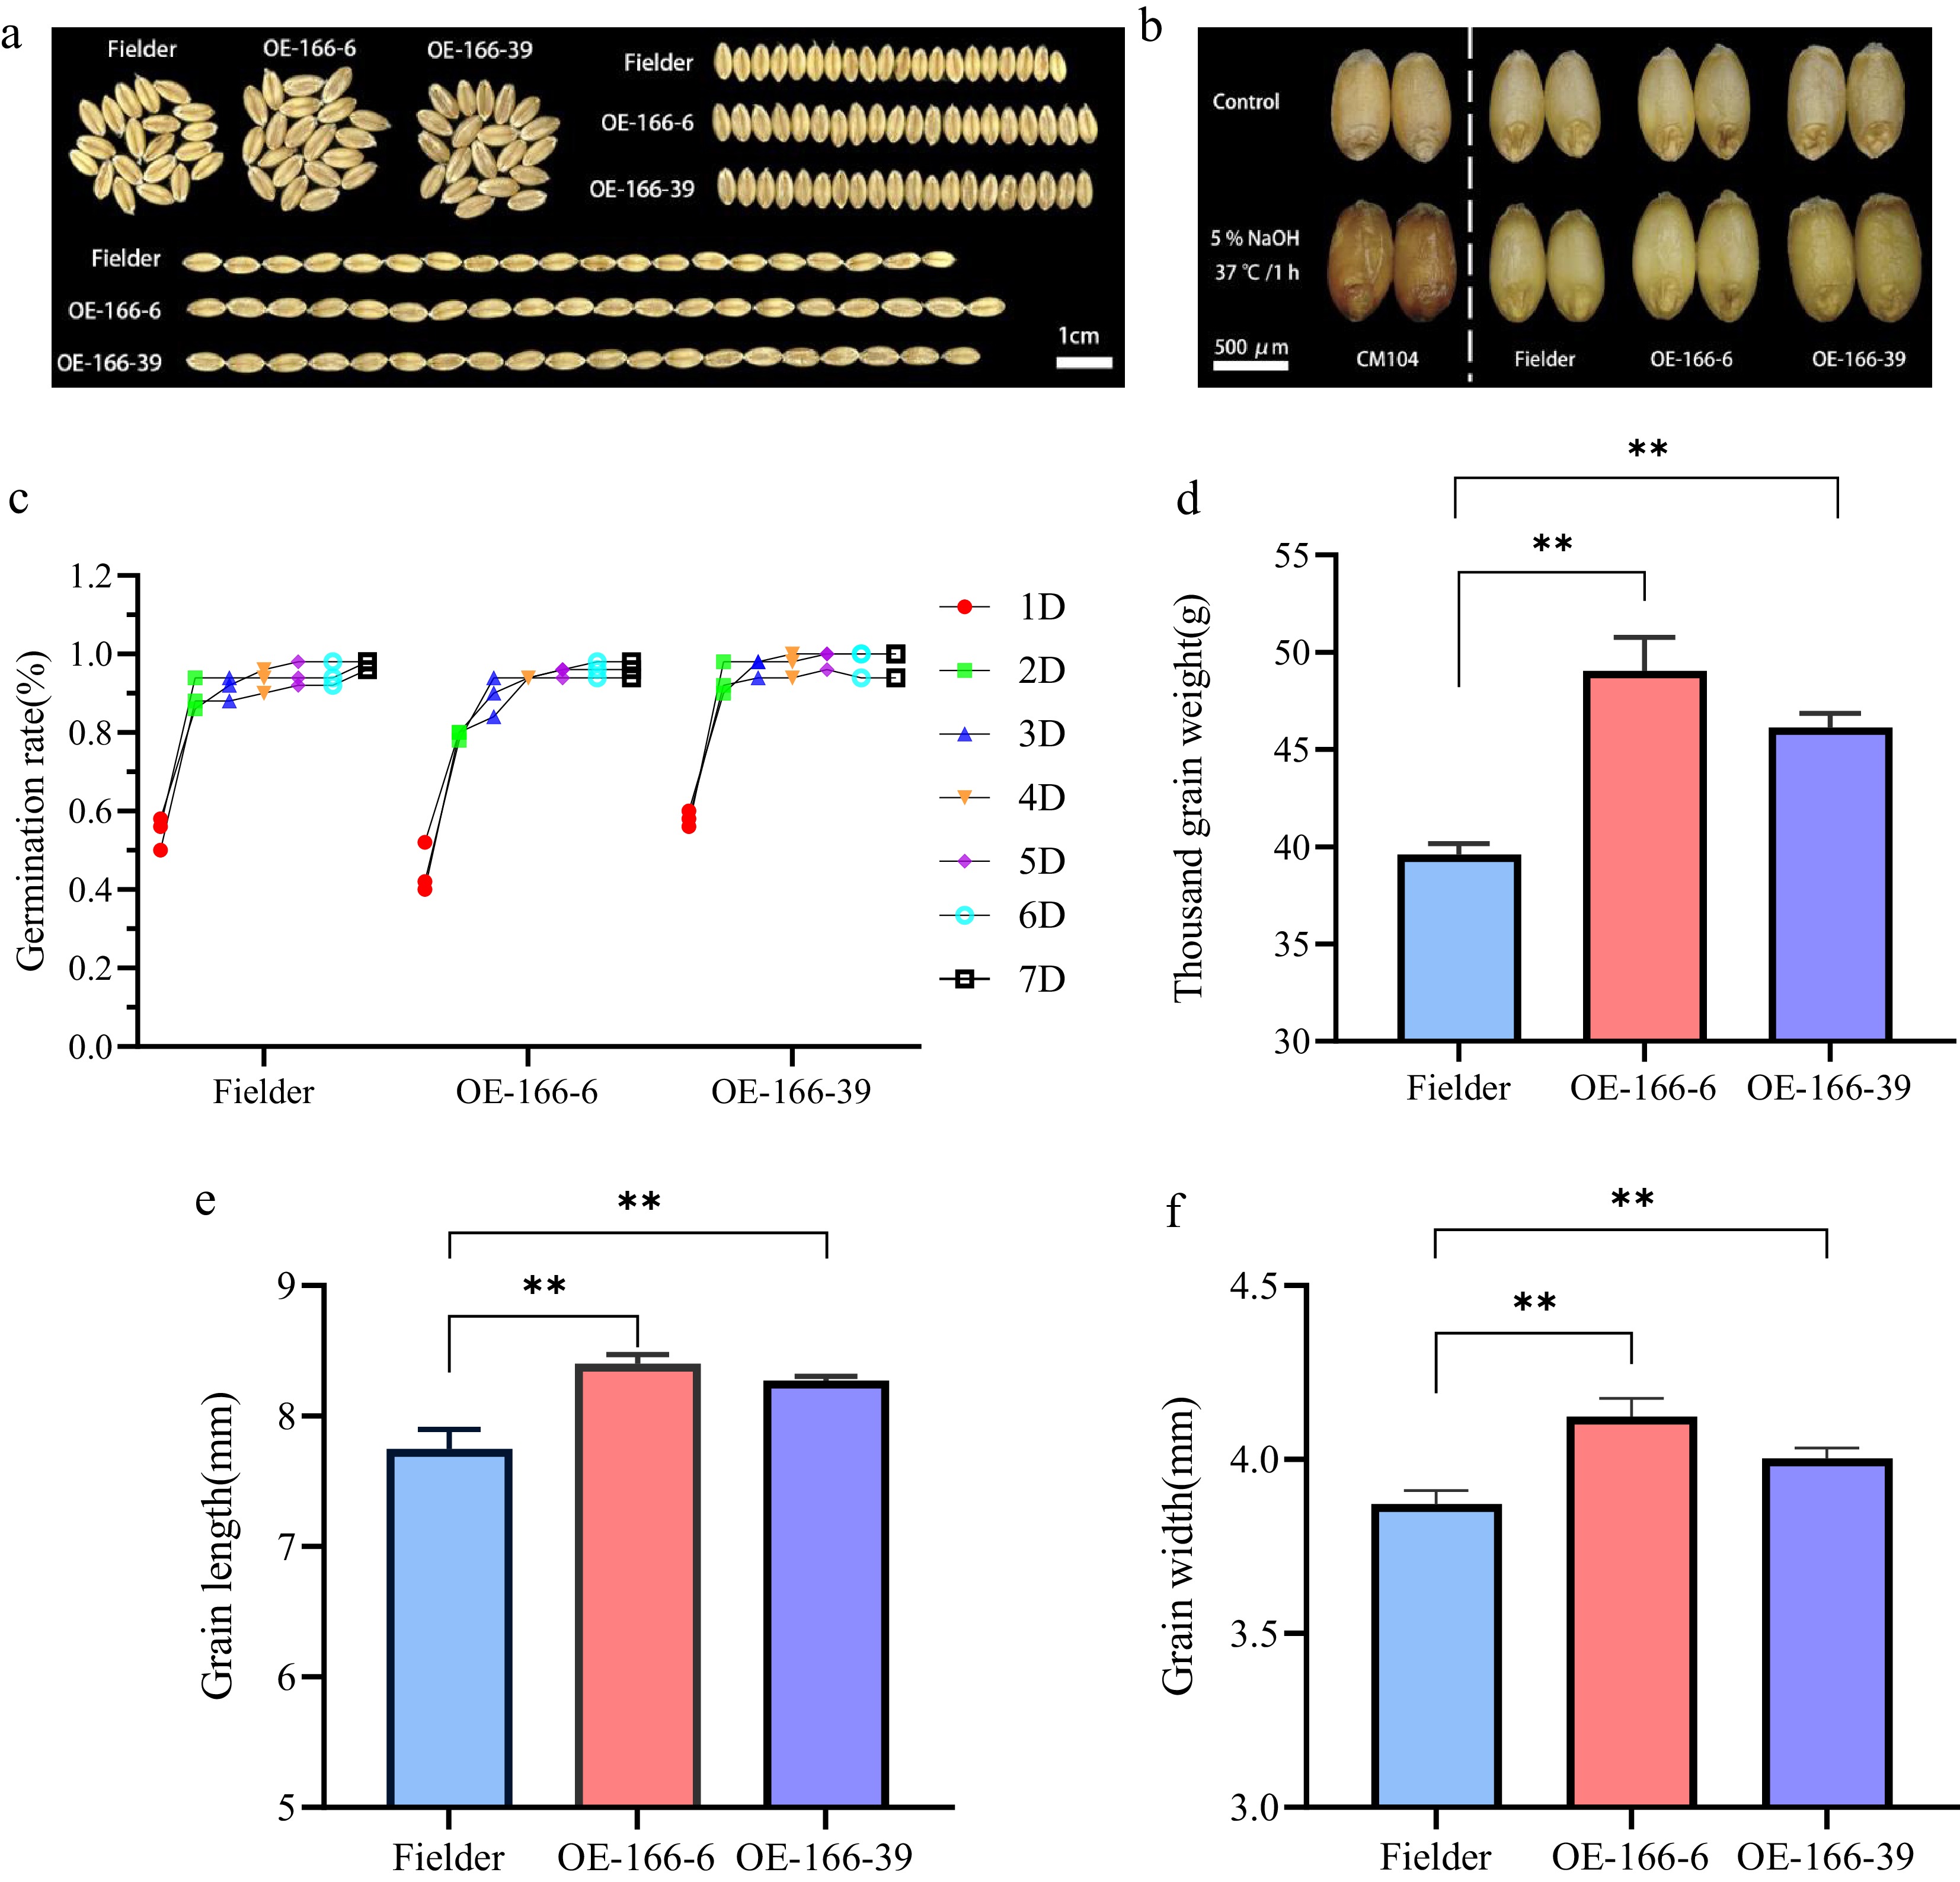
Figure 1.
Analysis of wheat grain phenotype and key agronomic traits in the field. (a) Comparison of grain size between wild-type Fielder and TaPGS1 overexpression wheat. (b) Comparison of grain permeability between wild-type Fielder, TaPGS1 overexpression lines, and red-skinned cultivar Chuanmai 104 (CM104) after NaOH treatment. CM104 (red-pericarp cultivar) was included as a positive control to validate the NaOH-based anthocyanin detection assay and was not used for statistical comparison with the wild type (Fielder) or TaPGS1 overexpression lines. The vertical dashed line separates the positive control from the experimental groups. (c) Comparative analysis of 7-d germination vigor between wild-type Fielder and TaPGS1 overexpression lines. (d−f) Field analysis of thousand-grain weight (d), grain length (e), and grain width (f) between wild-type Fielder and TaPGS1 overexpression lines (* p < 0.05; ** p < 0.01, student's t-test).
-
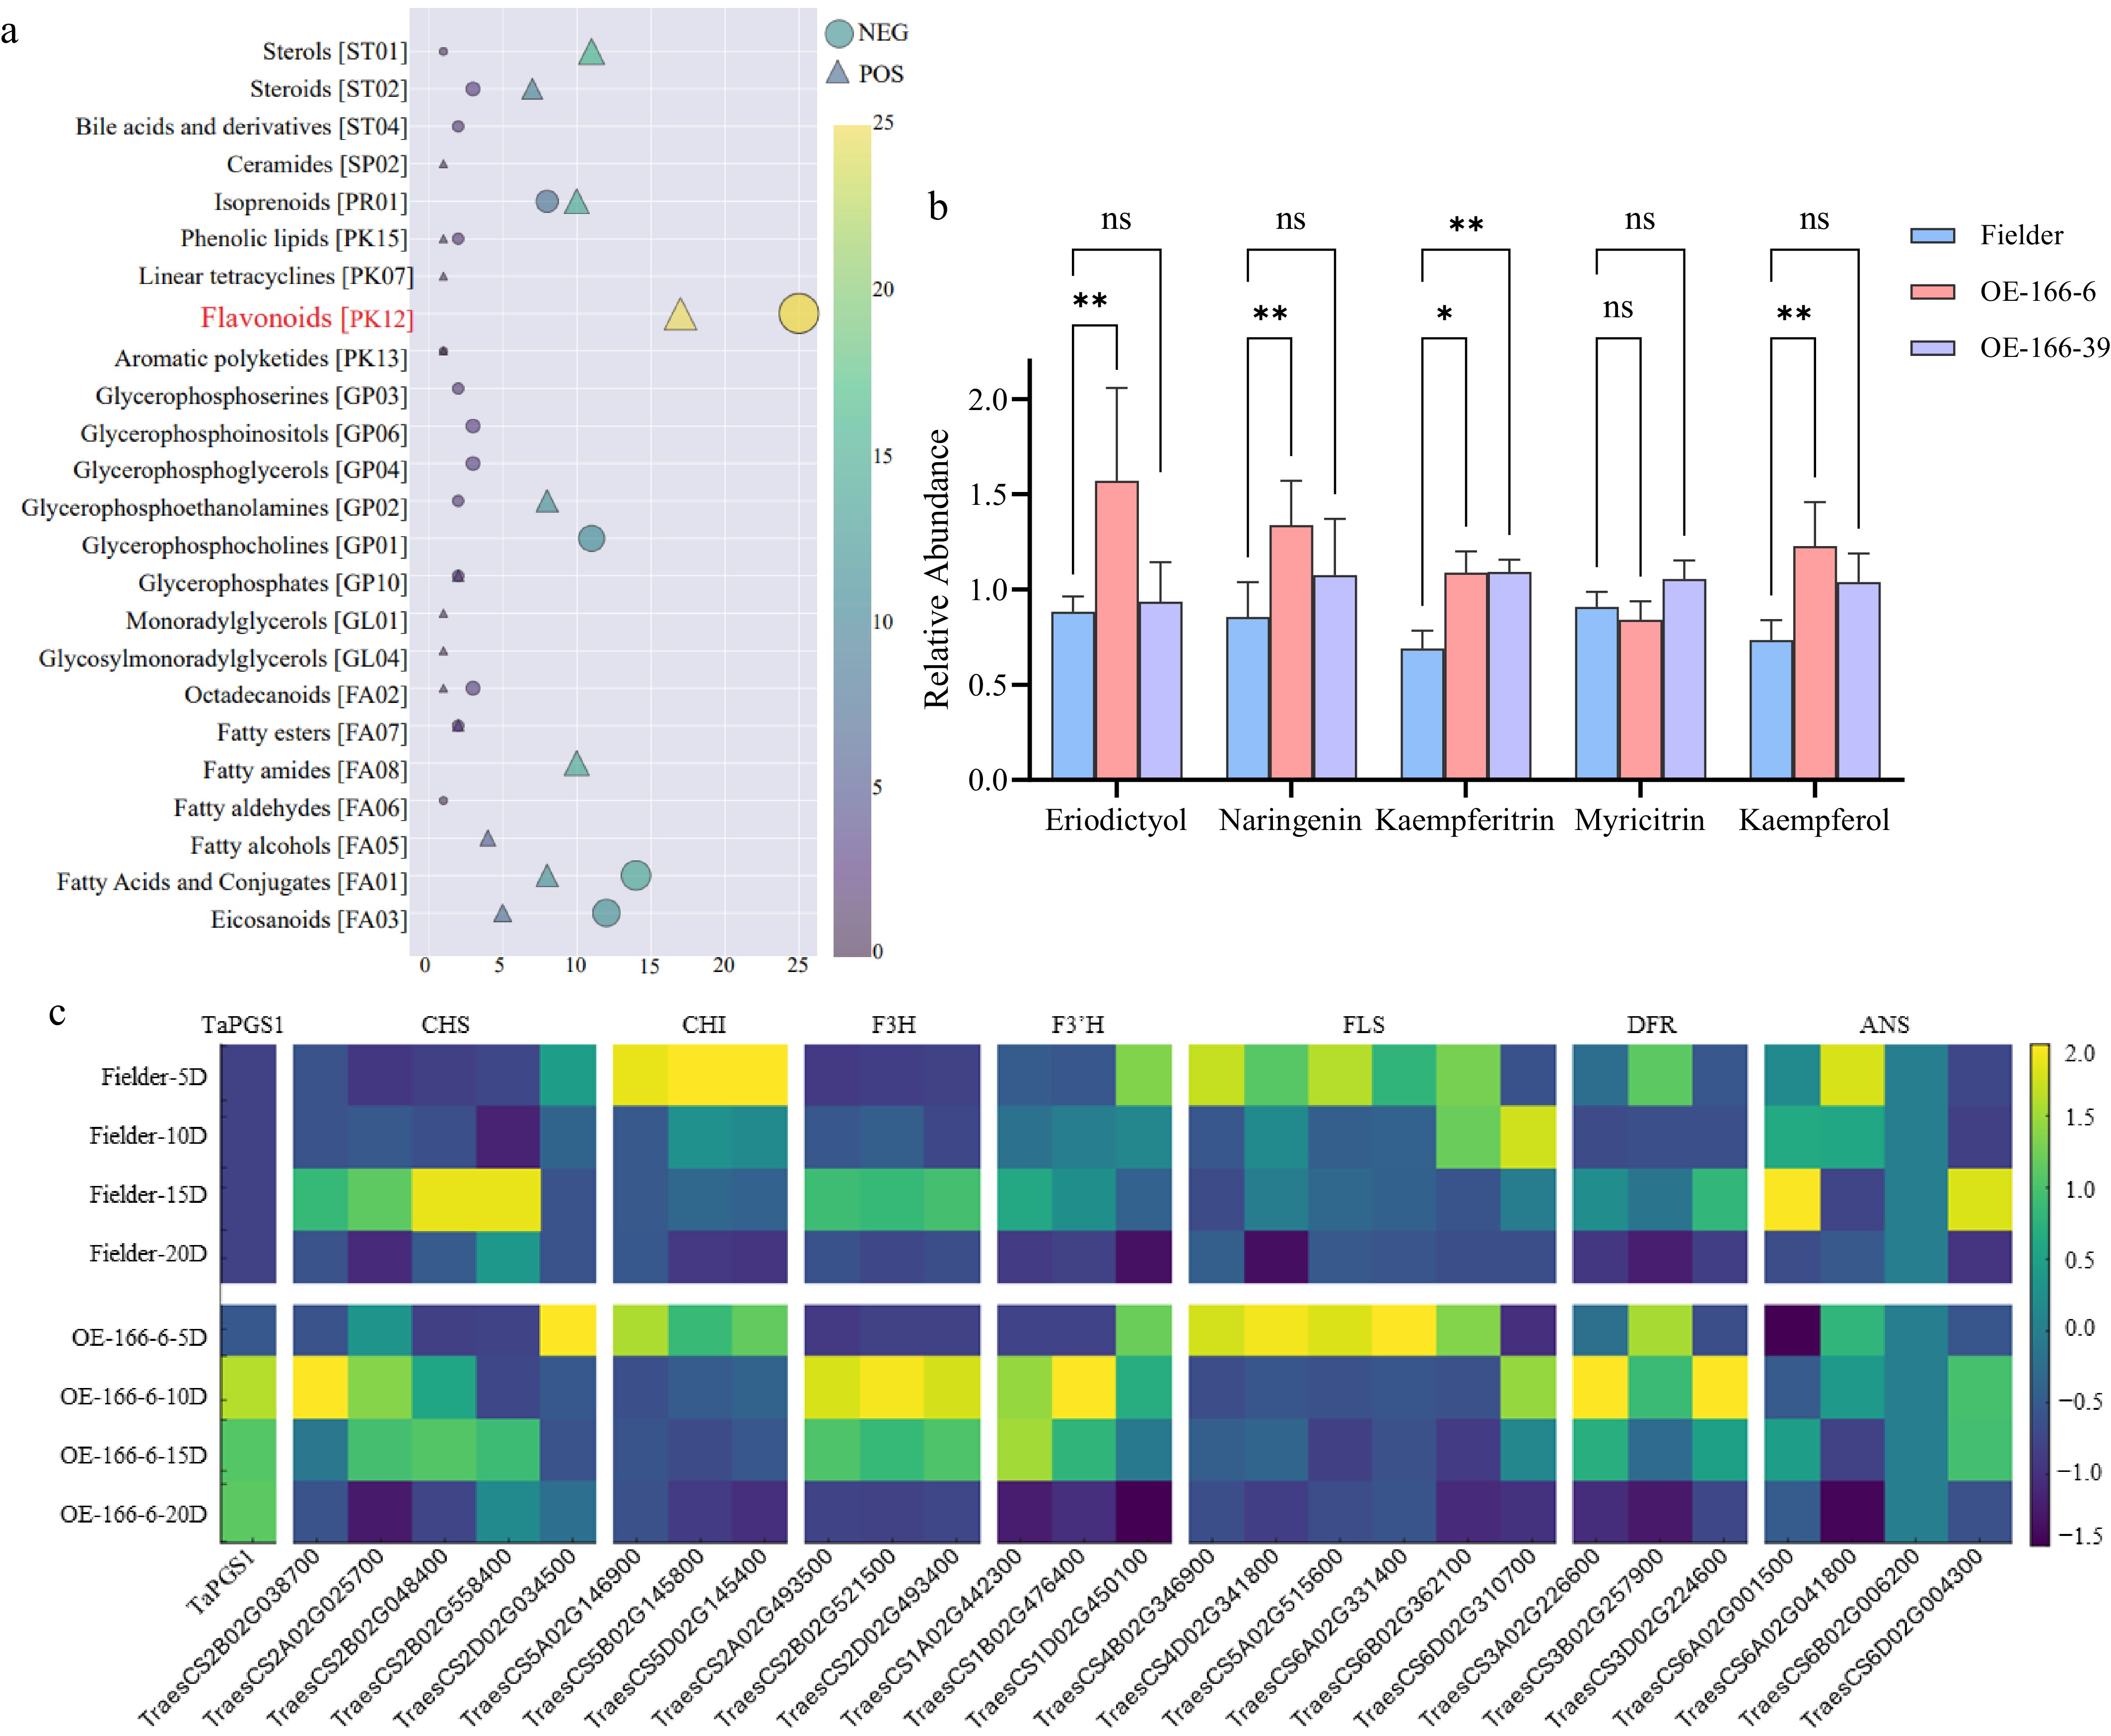
Figure 2.
Metabolomic and transcriptomic profiles of Fielder and TaPGS1 overexpression (OE) seeds at 5 DPA. (a) Class-level enrichment of differentially abundant metabolites; the flavonoid class contains the largest number of significantly changed features. The full set of 42 annotated flavonoid-class compounds with group means and statistics is provided in Supplementary Table S2. (b) Flavonol-related metabolites: naringenin, eriodictyol (precursors) and kaempferol, kaempferitrin, myricitrin (flavonol/its glycosides). Bars show abundance normalized to the QC median (sample peak area / QC median peak area), averaged over four biological replicates (mean ± SD; * p < 0.05; ** p < 0.01, student's t-test). Exact values for all 42 flavonoid-class compounds are listed in Supplementary Table S2. (c) Heatmap of flavonoid-pathway genes in wild-type and TaPGS1-OE seeds at 5, 10, 15, and 20 DPA. Gene names are shown across the top of the heatmap; the corresponding gene IDs are shown along the bottom (see also Supplementary Table S4). Values are TPM that were centered and scaled per gene (row-wise z-score) for visualization, as indicated by the color bar.
-
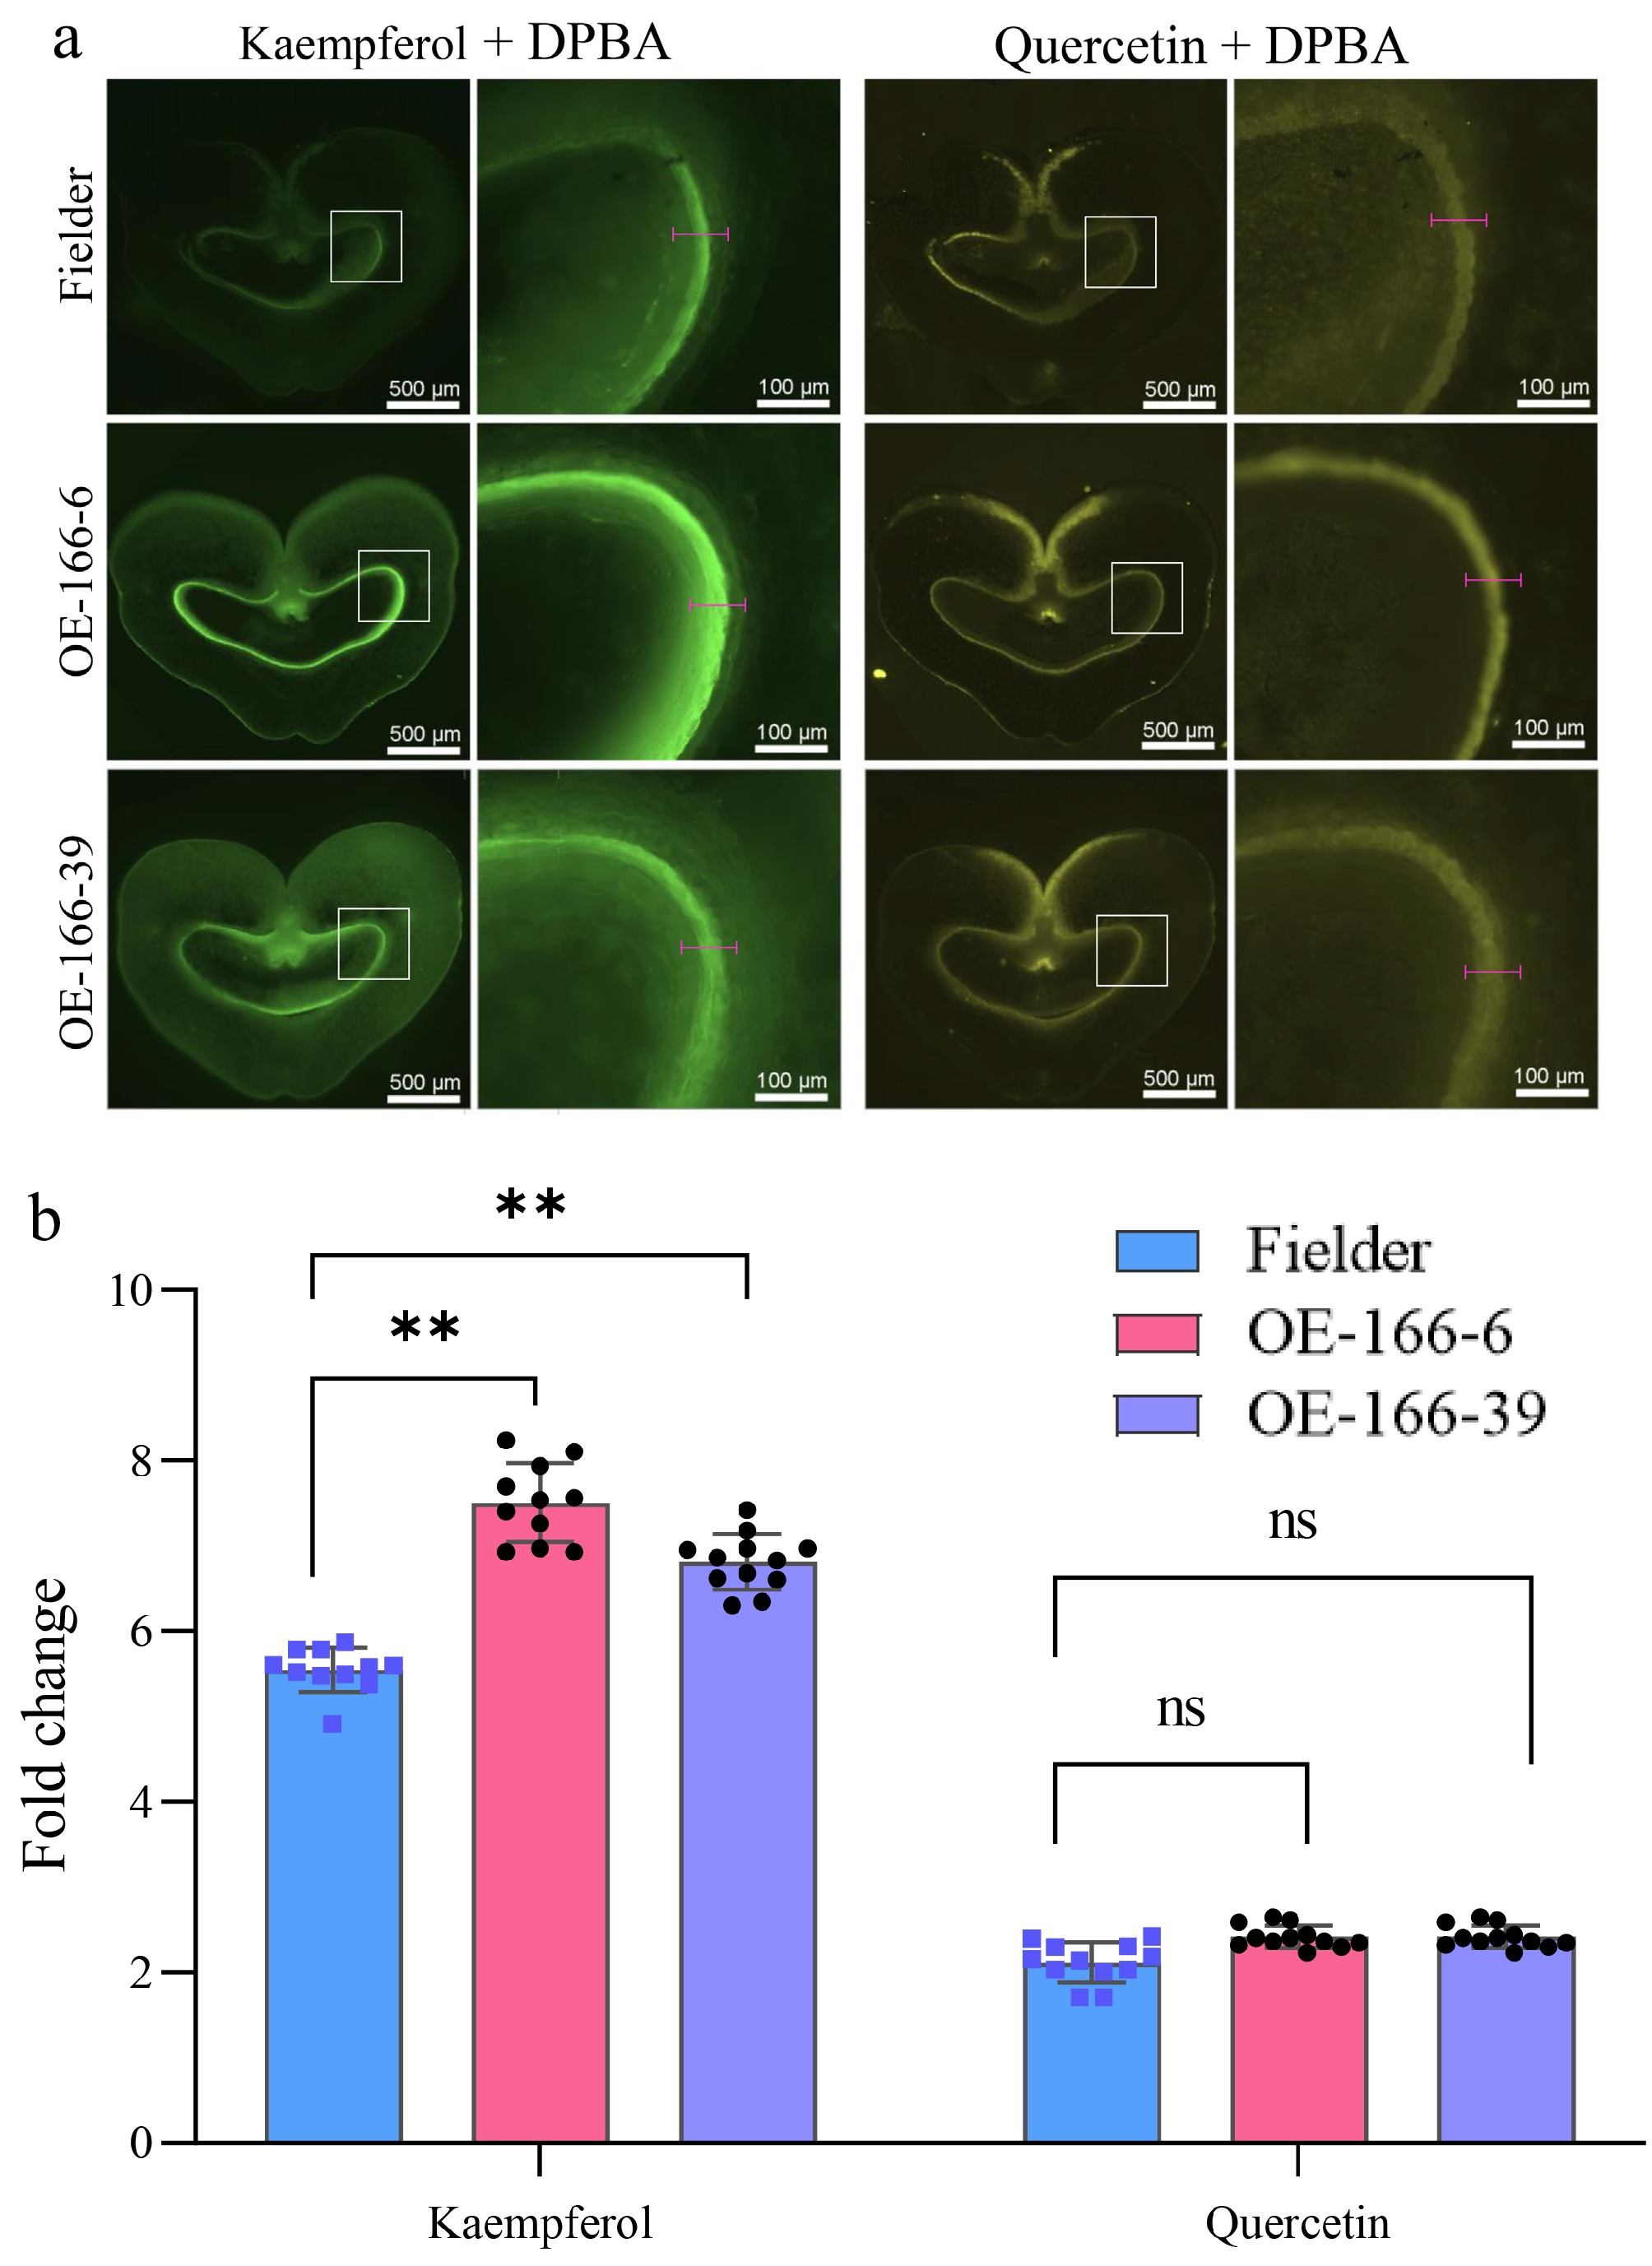
Figure 3.
Localization and relative fluorescence of flavonols in wheat seeds. (a) DPBA staining of seeds at 5 DPA (green = kaempferol-associated, yellow = quercetin-associated). The white box marks the enlarged area. The red line segment indicates the region used for intensity extraction. (b) Relative fluorescence intensities of the green and yellow channels from (a) (n = 10 per genotype; p < 0.05; p < 0.01, student's t-test).
-
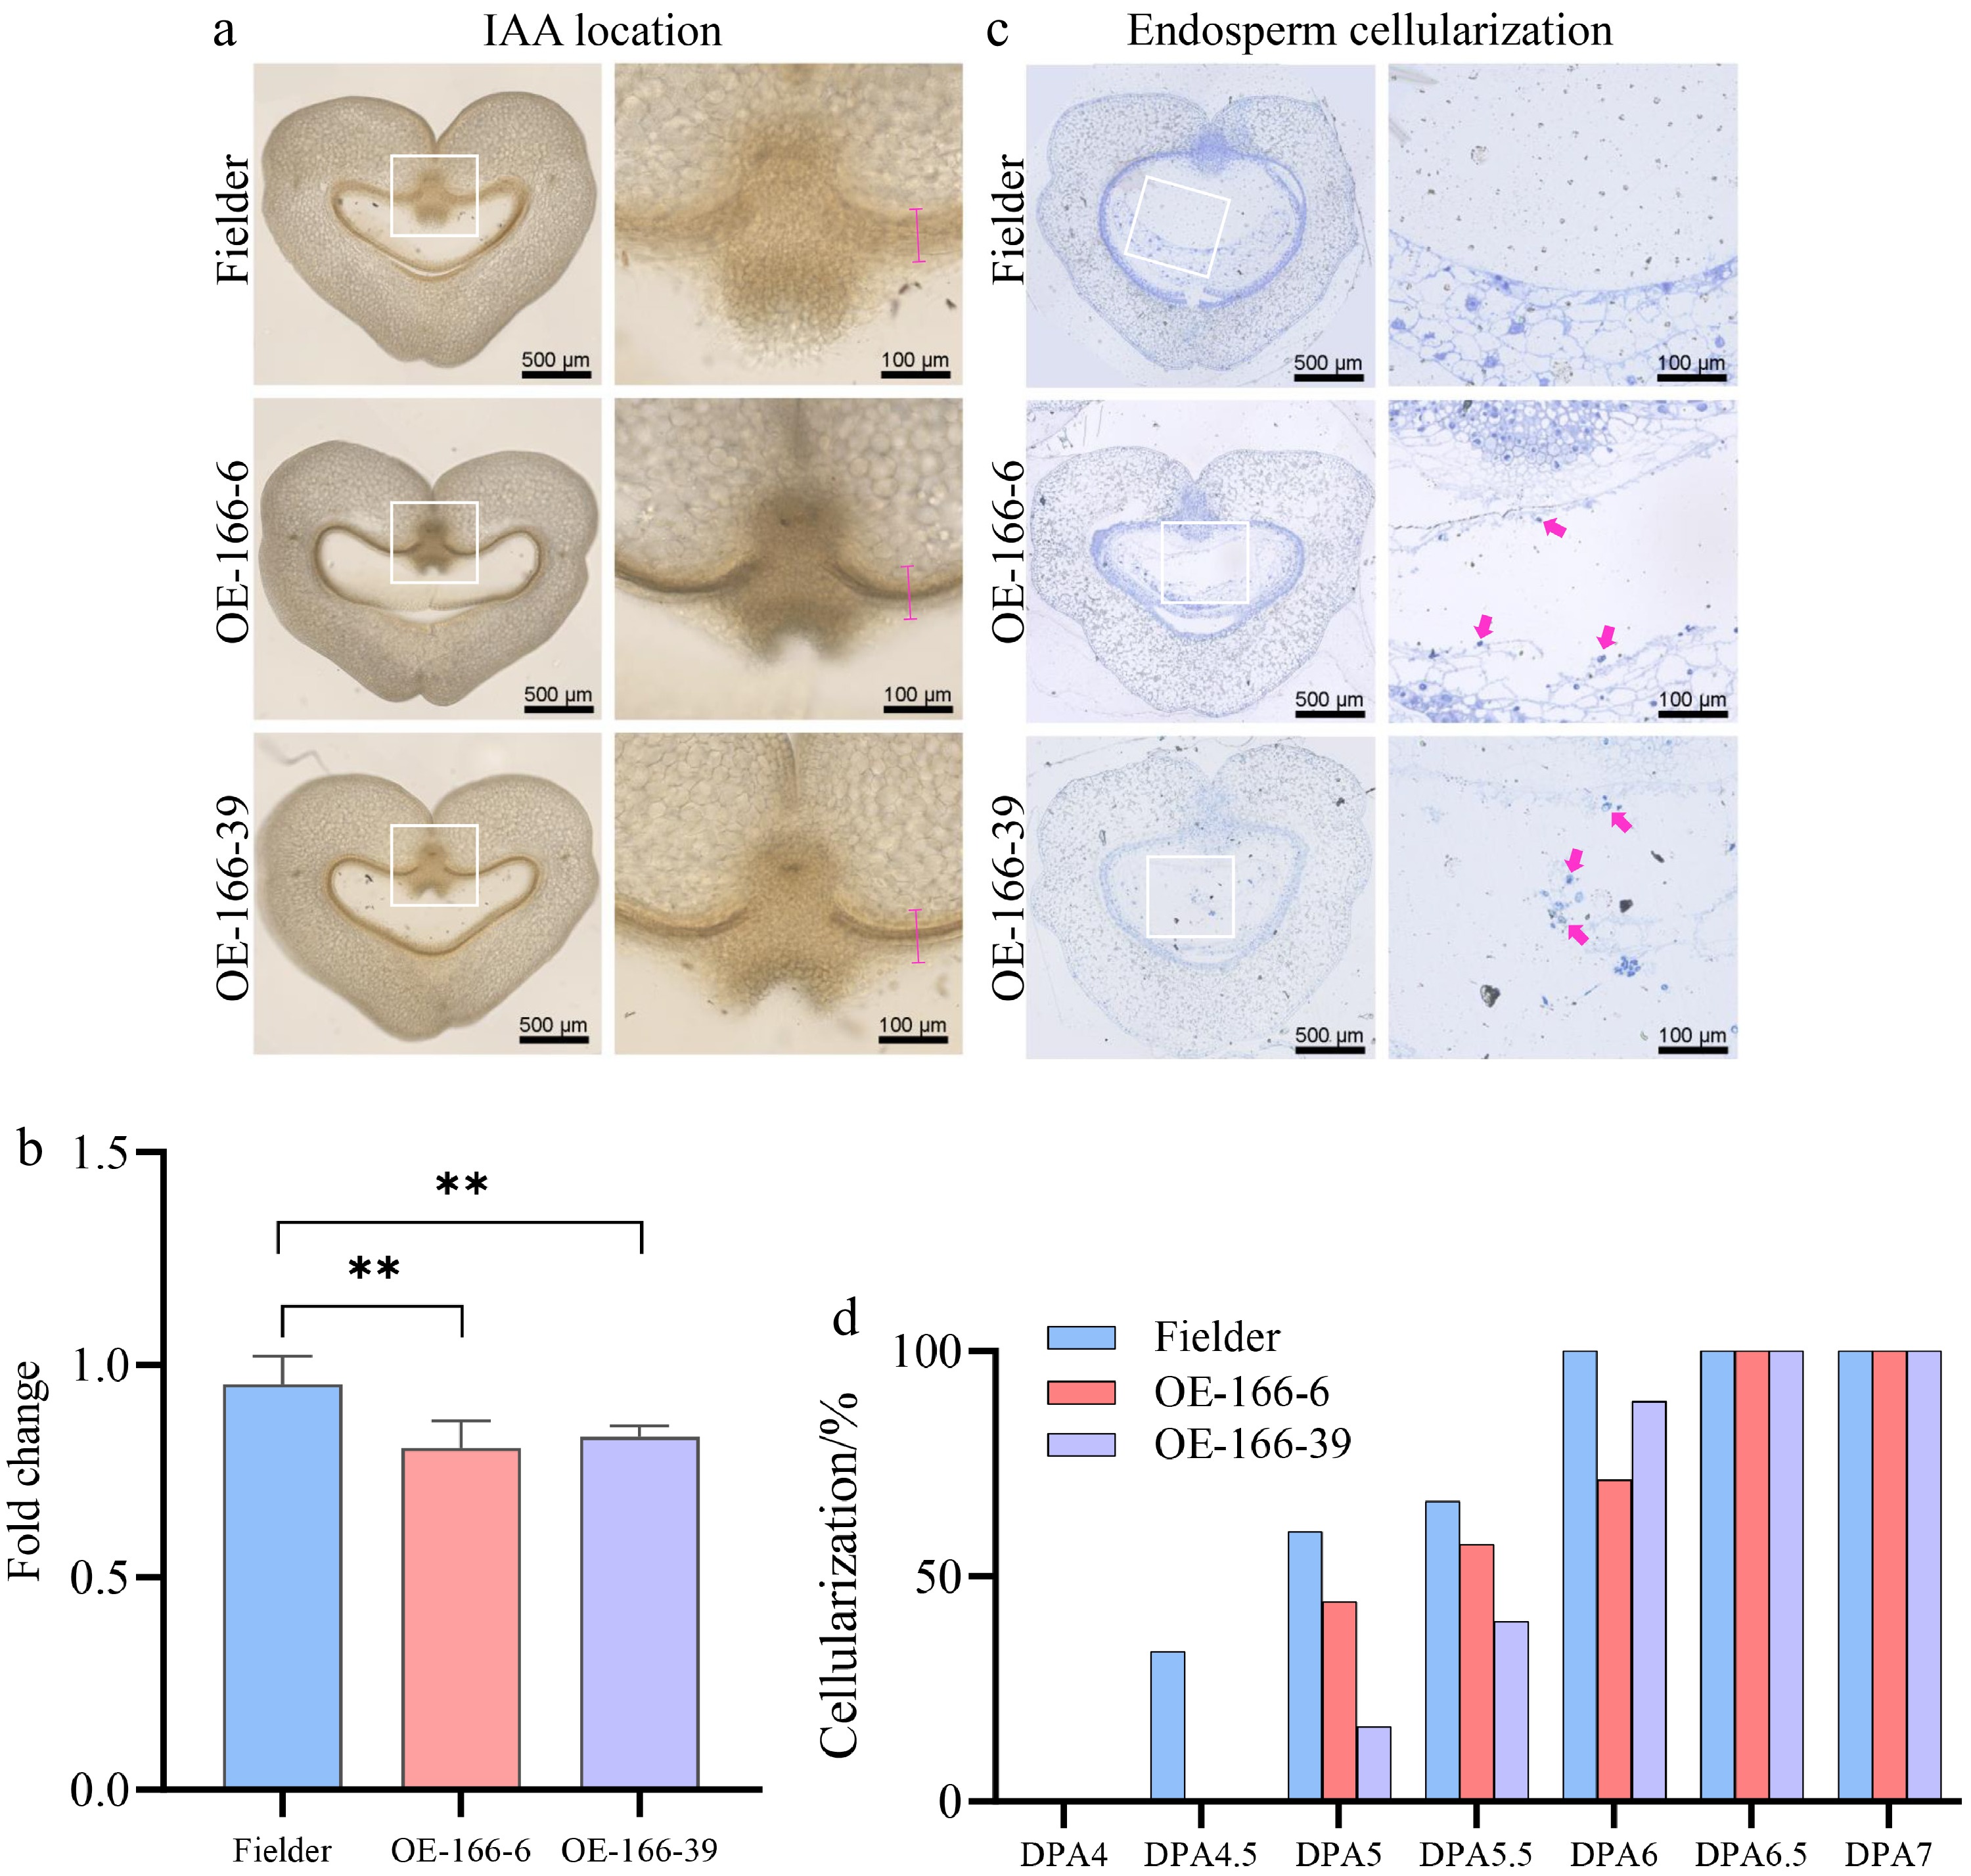
Figure 4.
Analysis of auxin localization and endosperm cellularization phenotype in TaPGS1 overexpression lines. (a) Auxin accumulation in the seeds of wild--type Fielder and TaPGS1 overexpression lines at 5 DPA. The white box indicates the enlarged display area. The red line segment represents the data collection area. (b) Quantification of the auxin accumulation shown in (a). The difference in auxin levels between the TaPGS1 overexpression lines and wild-type Fielder is significant (n = 10; mean ± SD; * p < 0.05; ** p < 0.01, student's t-test). (c) Schematic representation of endosperm cellularization observed through semi-thin sectioning of seeds. The red arrow marks the free nuclei in the coenocytic endosperm that has not yet undergone cellularization. (d) Proportion of seeds with completed cellularization at different DPA. Cellularization was delayed in TaPGS1 overexpression lines compared to Fielder, particularly at 4.5 to 6 DPA (n≥5).
-
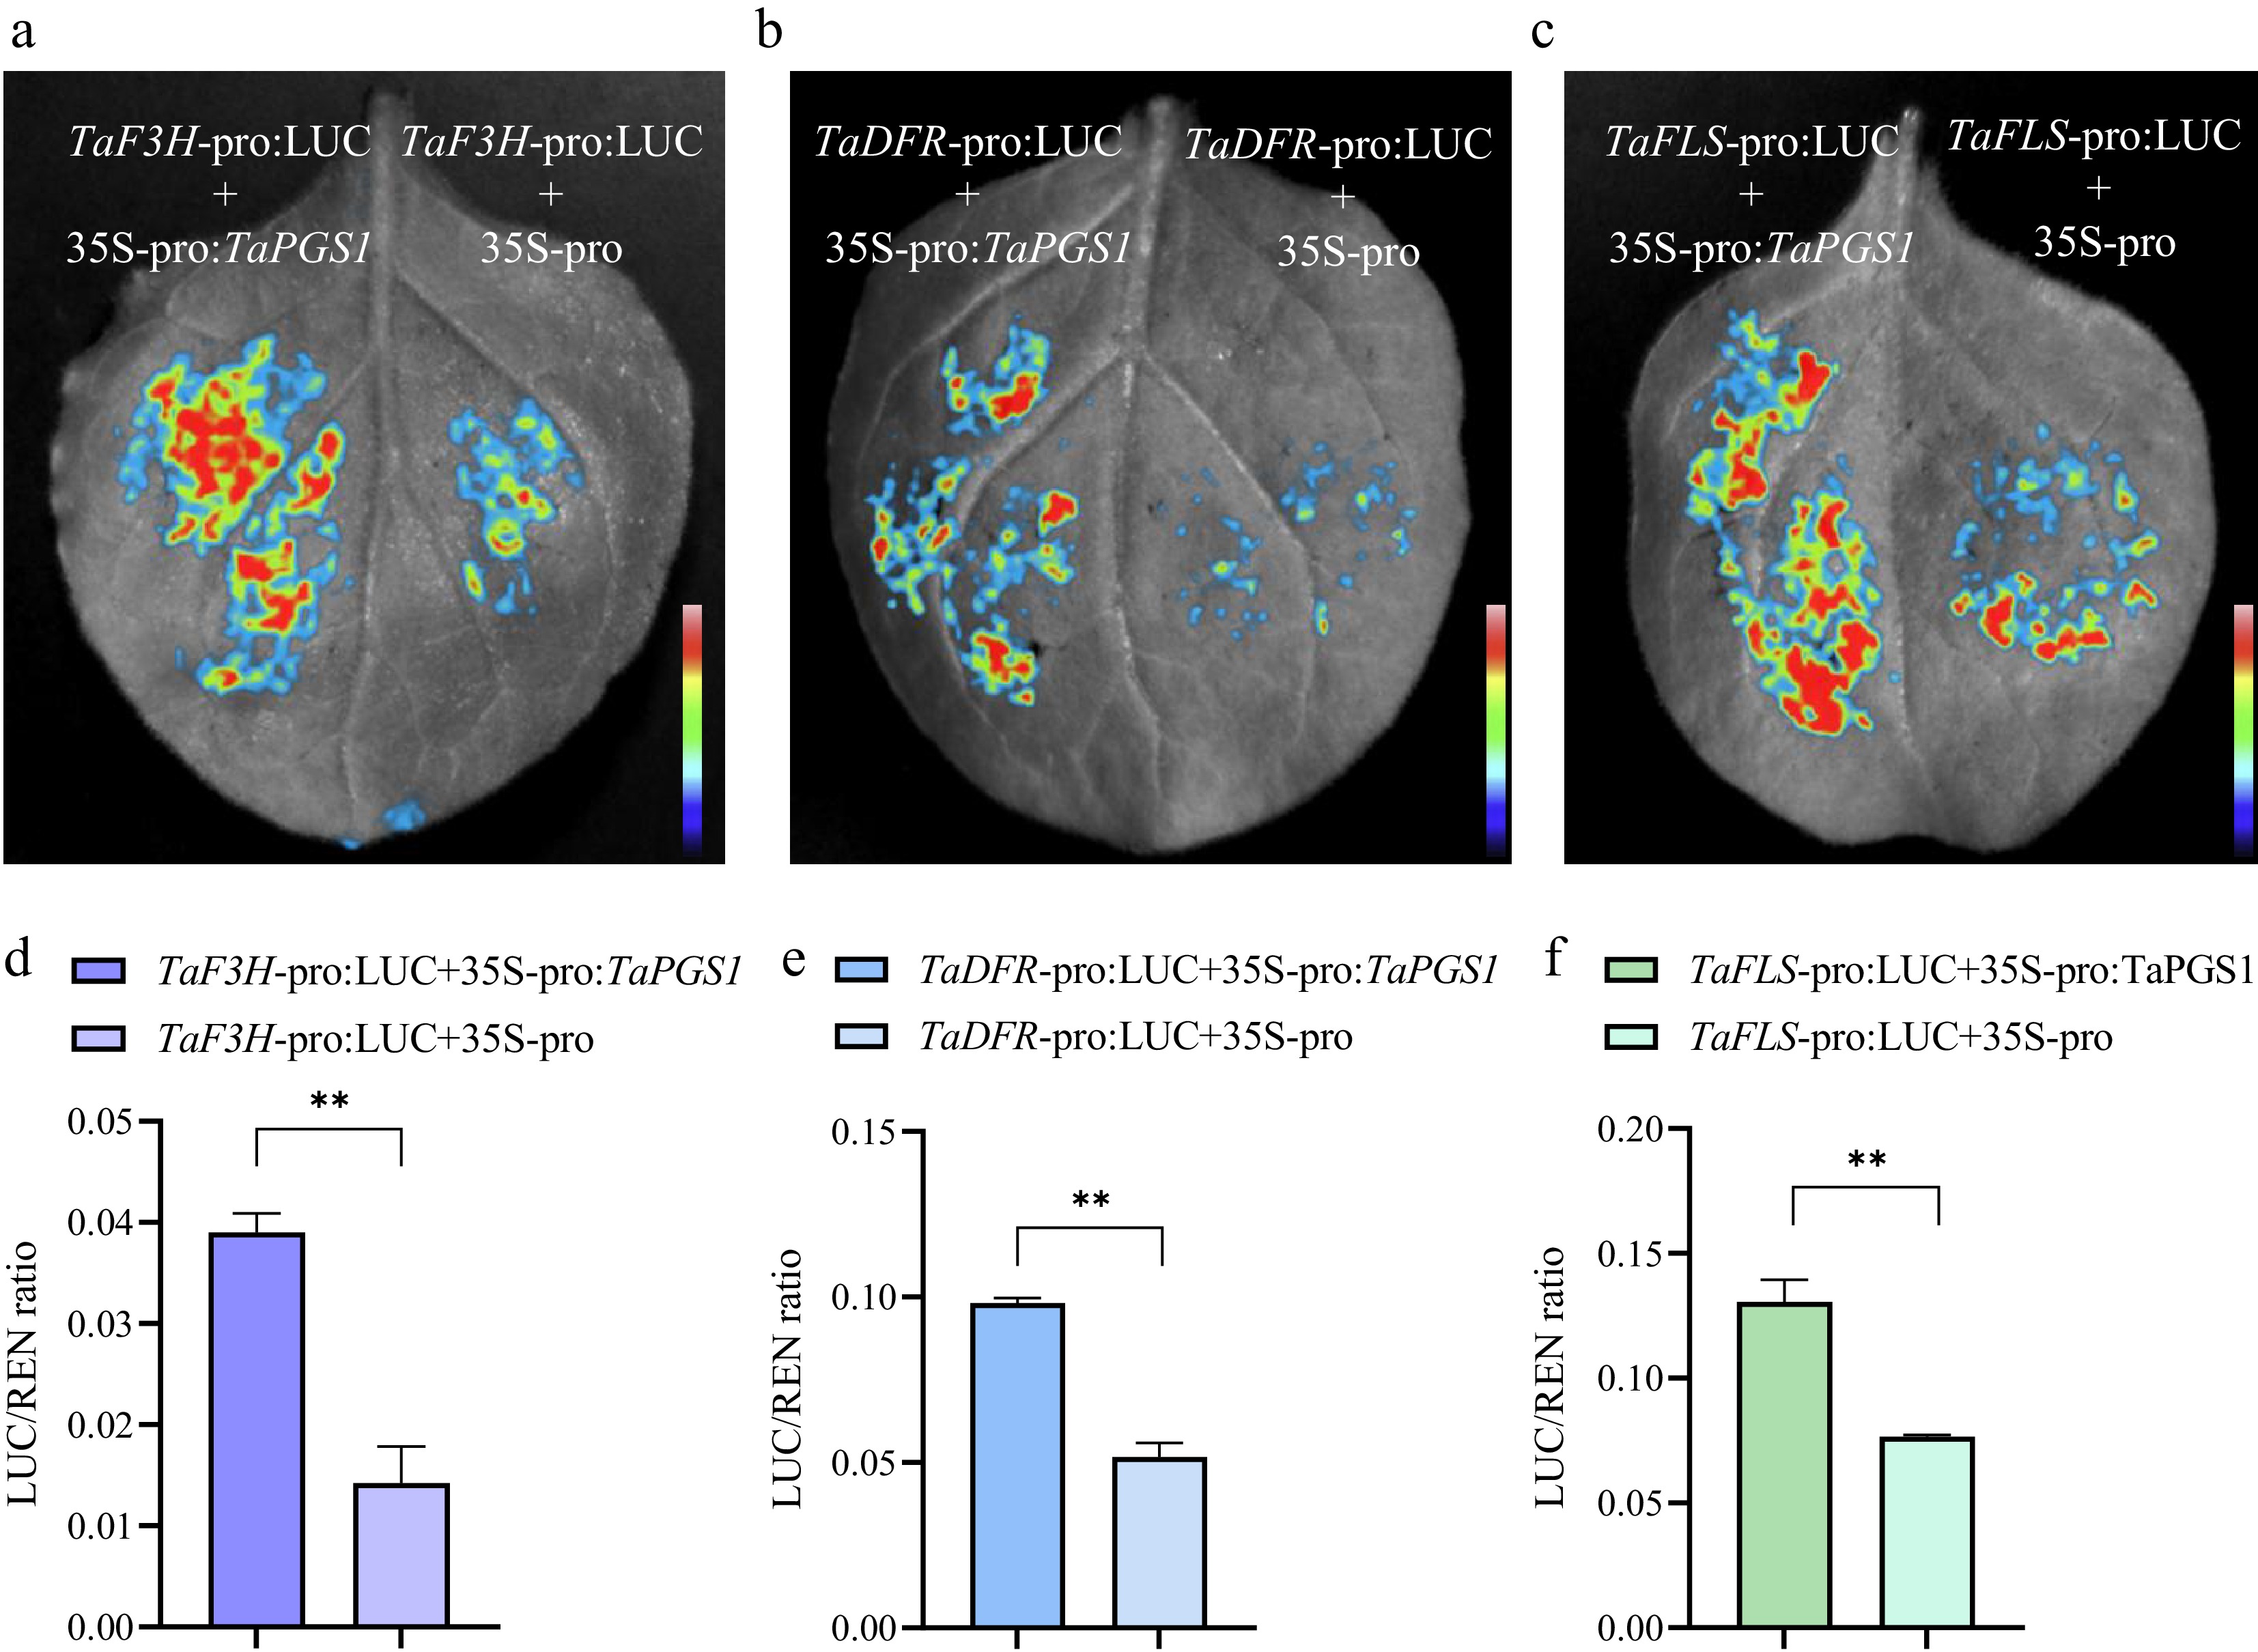
Figure 5.
TaPGS1 transactivates TaFLS, TaF3H, and TaDFR promoters. (a–c) Luminescence images of TaF3H-pro:LUC (a), TaDFR-pro:LUC (b), and TaFLS-pro:LUC (c) co-expressed with 35S-pro:TaPGS1 (left) or empty effector (35S-Pro, right) in tobacco leaves. (d–f) Quantification of relative promoter activity (LUC/REN) for TaF3H-pro:LUC (d), TaDFR-pro:LUC (e), and TaFLS-pro:LUC (f). Bars show mean ± SD; significance: mean ± SD; * p < 0.05; ** p < 0.01, student's t-test.
-
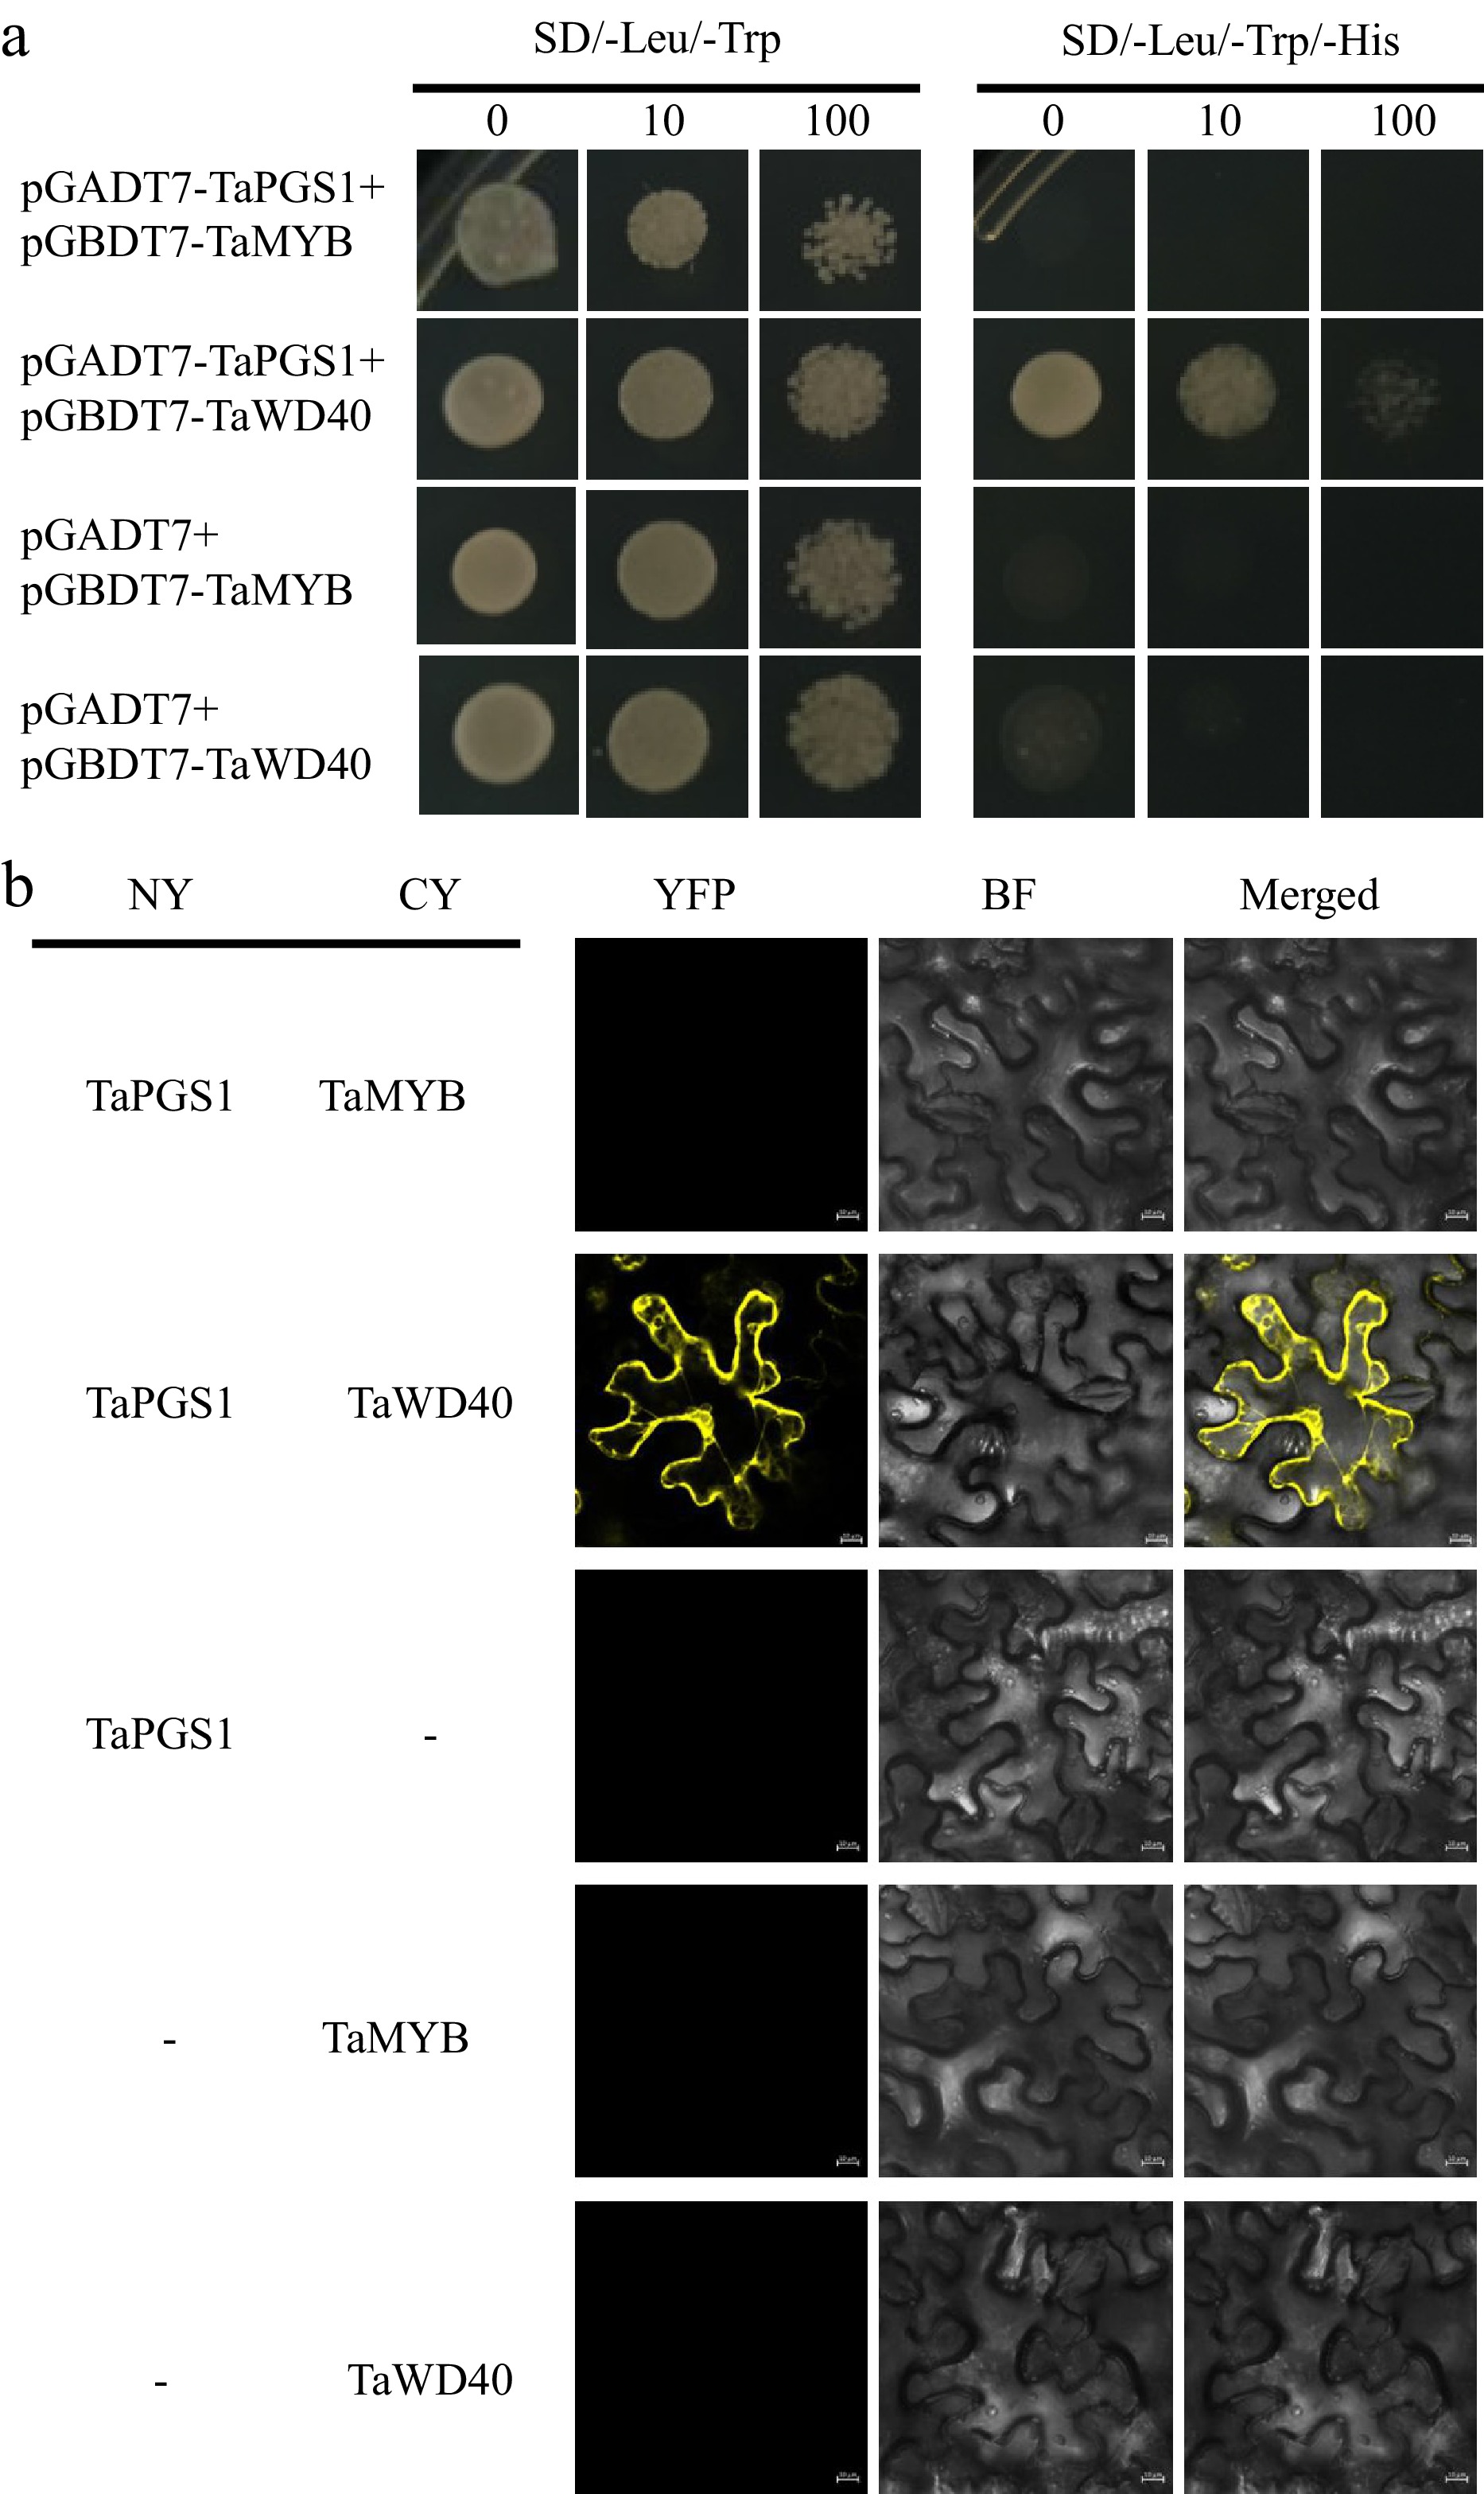
Figure 6.
Validation of interaction proteins of TaPGS1. (a) Yeast two-hybrid assay validating the interactions between TaPGS1 and TaMYB and TaWD40. (b) BiFC validating the interactions between TaPGS1 and TaMYB and TaWD40.
Figures
(6)
Tables
(0)