-
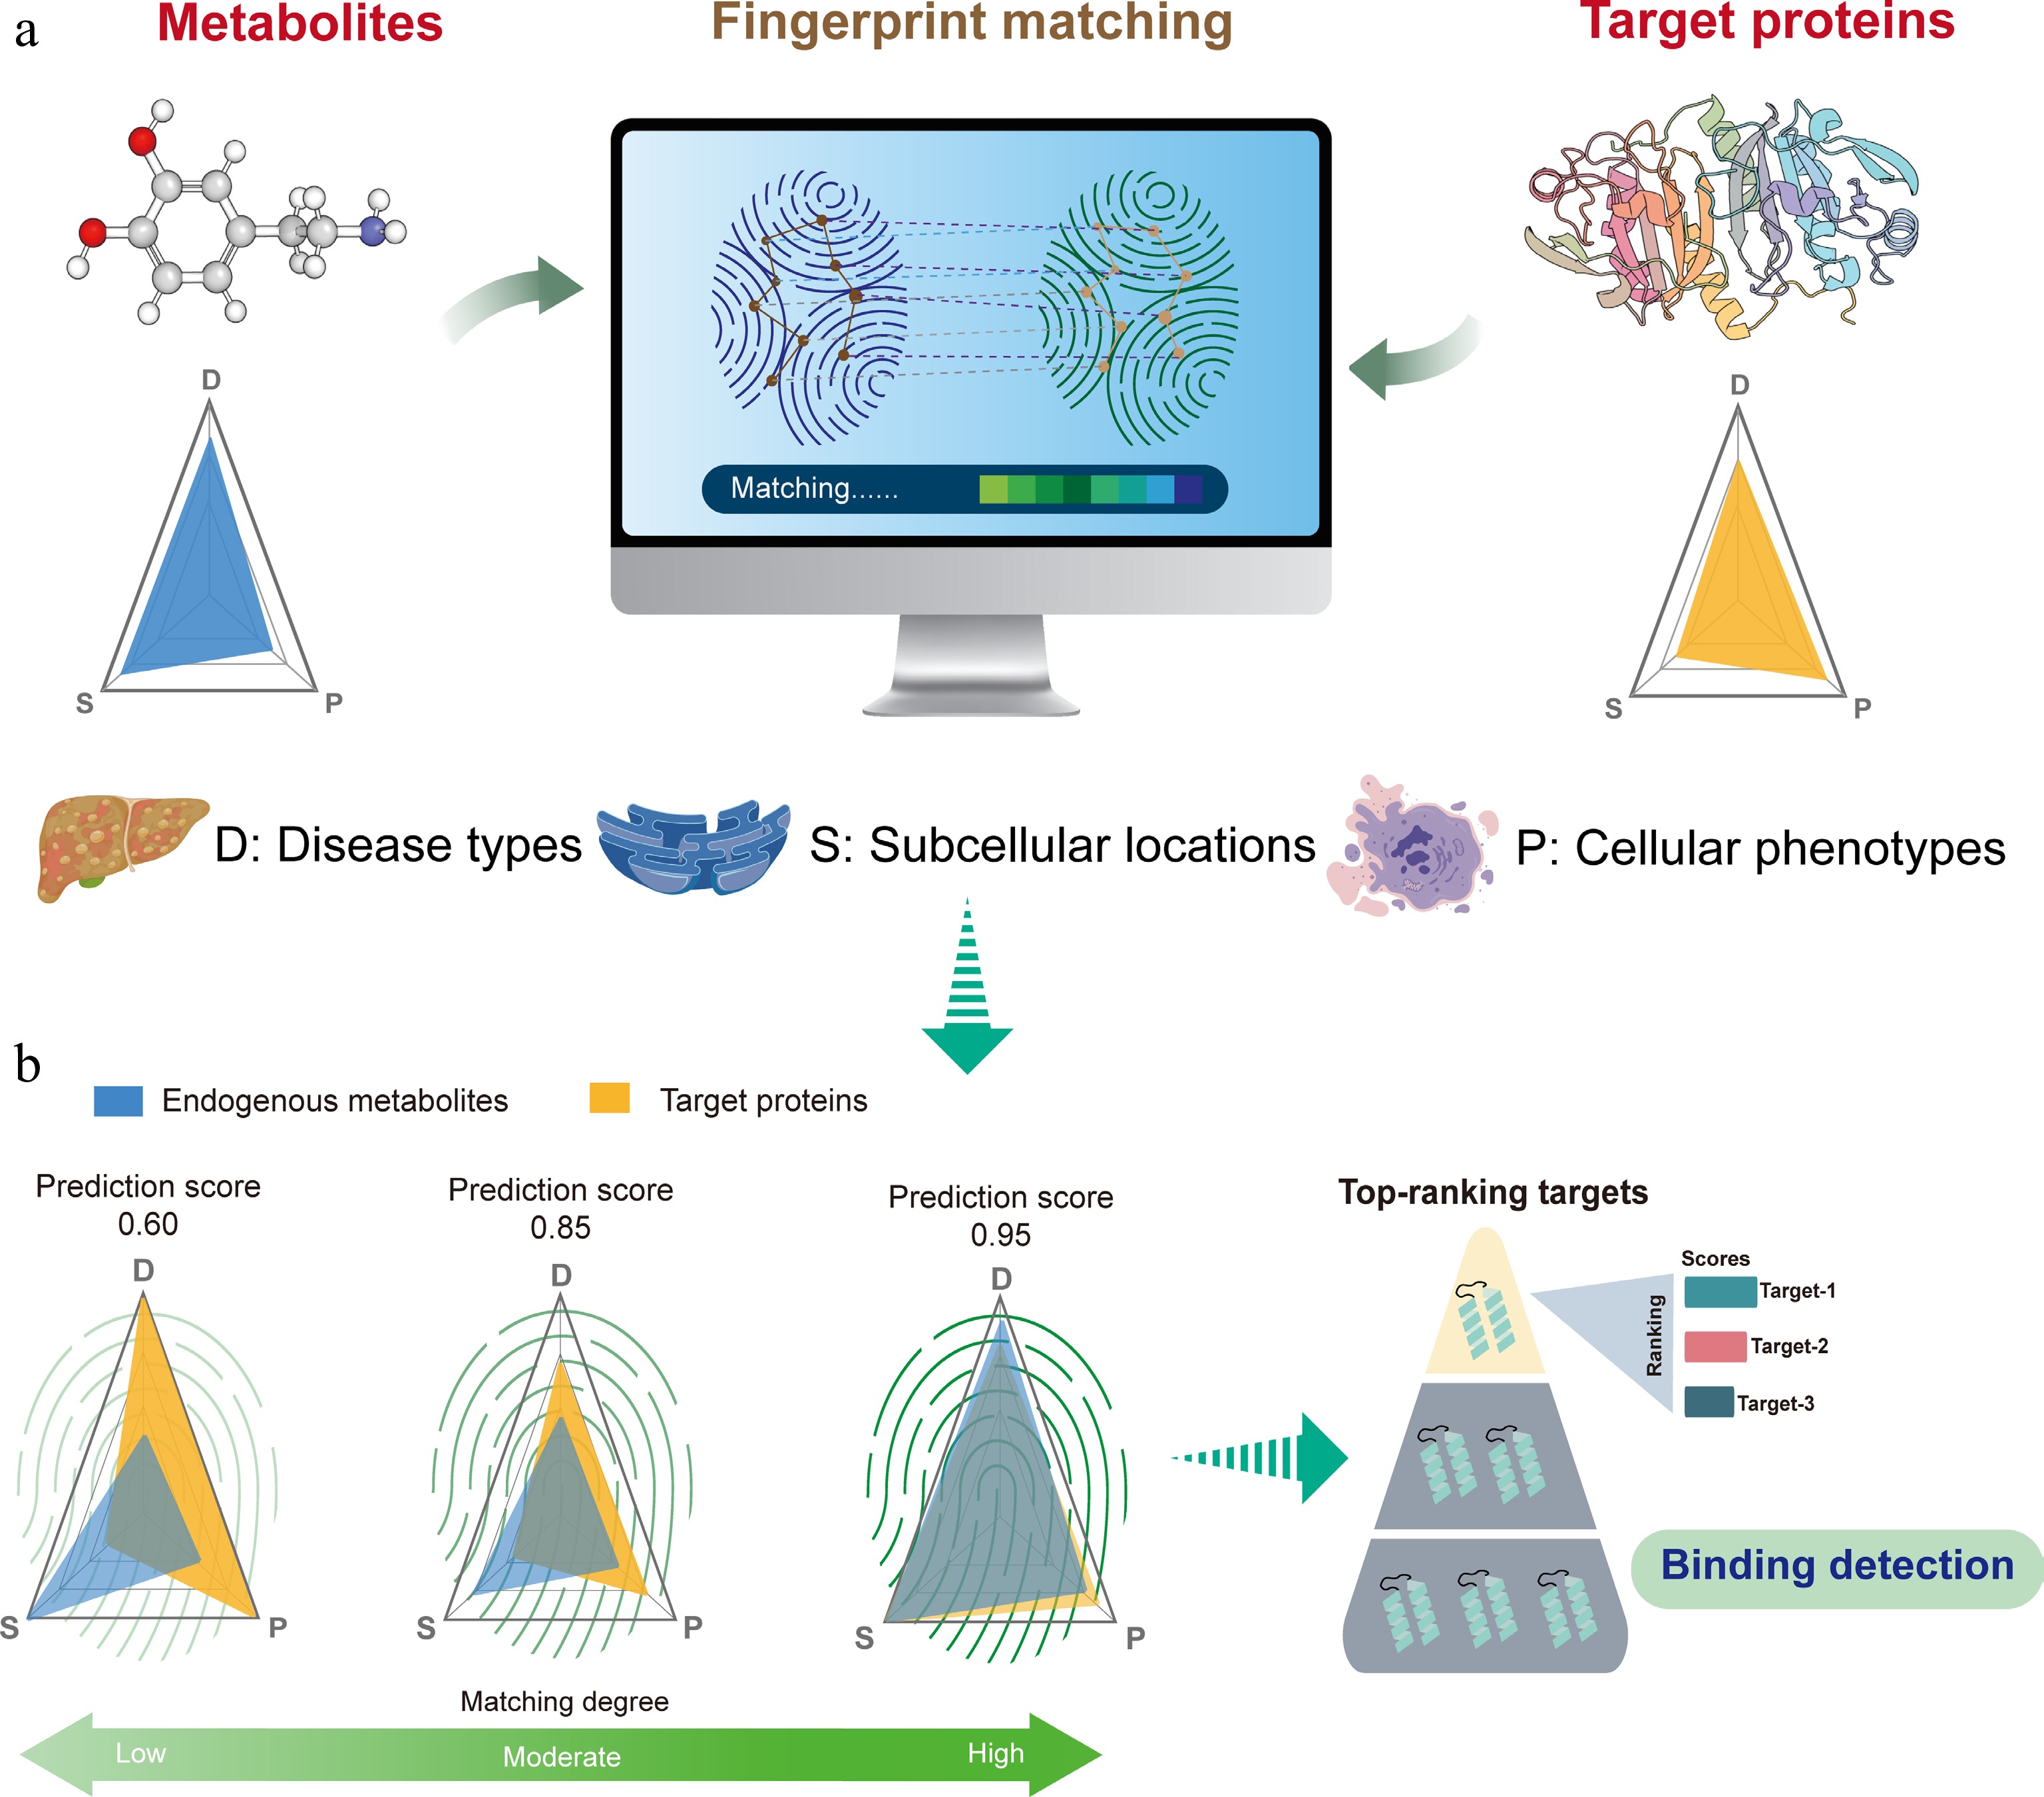
Figure 1.
Hypothesis of biological similarities of metabolites and its potential targets guides the development of DeepETD. (a) Biologically similar features were demonstrated: if an endogenous metabolite exhibits significant correlation or consistency with a certain protein at the multidimensional biological feature level (associated diseases, cellular phenotypes, and subcellular localization), then this protein may serve as a potential target for the metabolite. (b) The match of biologically similar features guides the development of DeepETD: the model represents the biological characteristics of metabolites and proteins as unified characteristic fingerprints; the potential association/binding probability (fingerprint matching) between metabolites and proteins was quantified through deep learning.
-
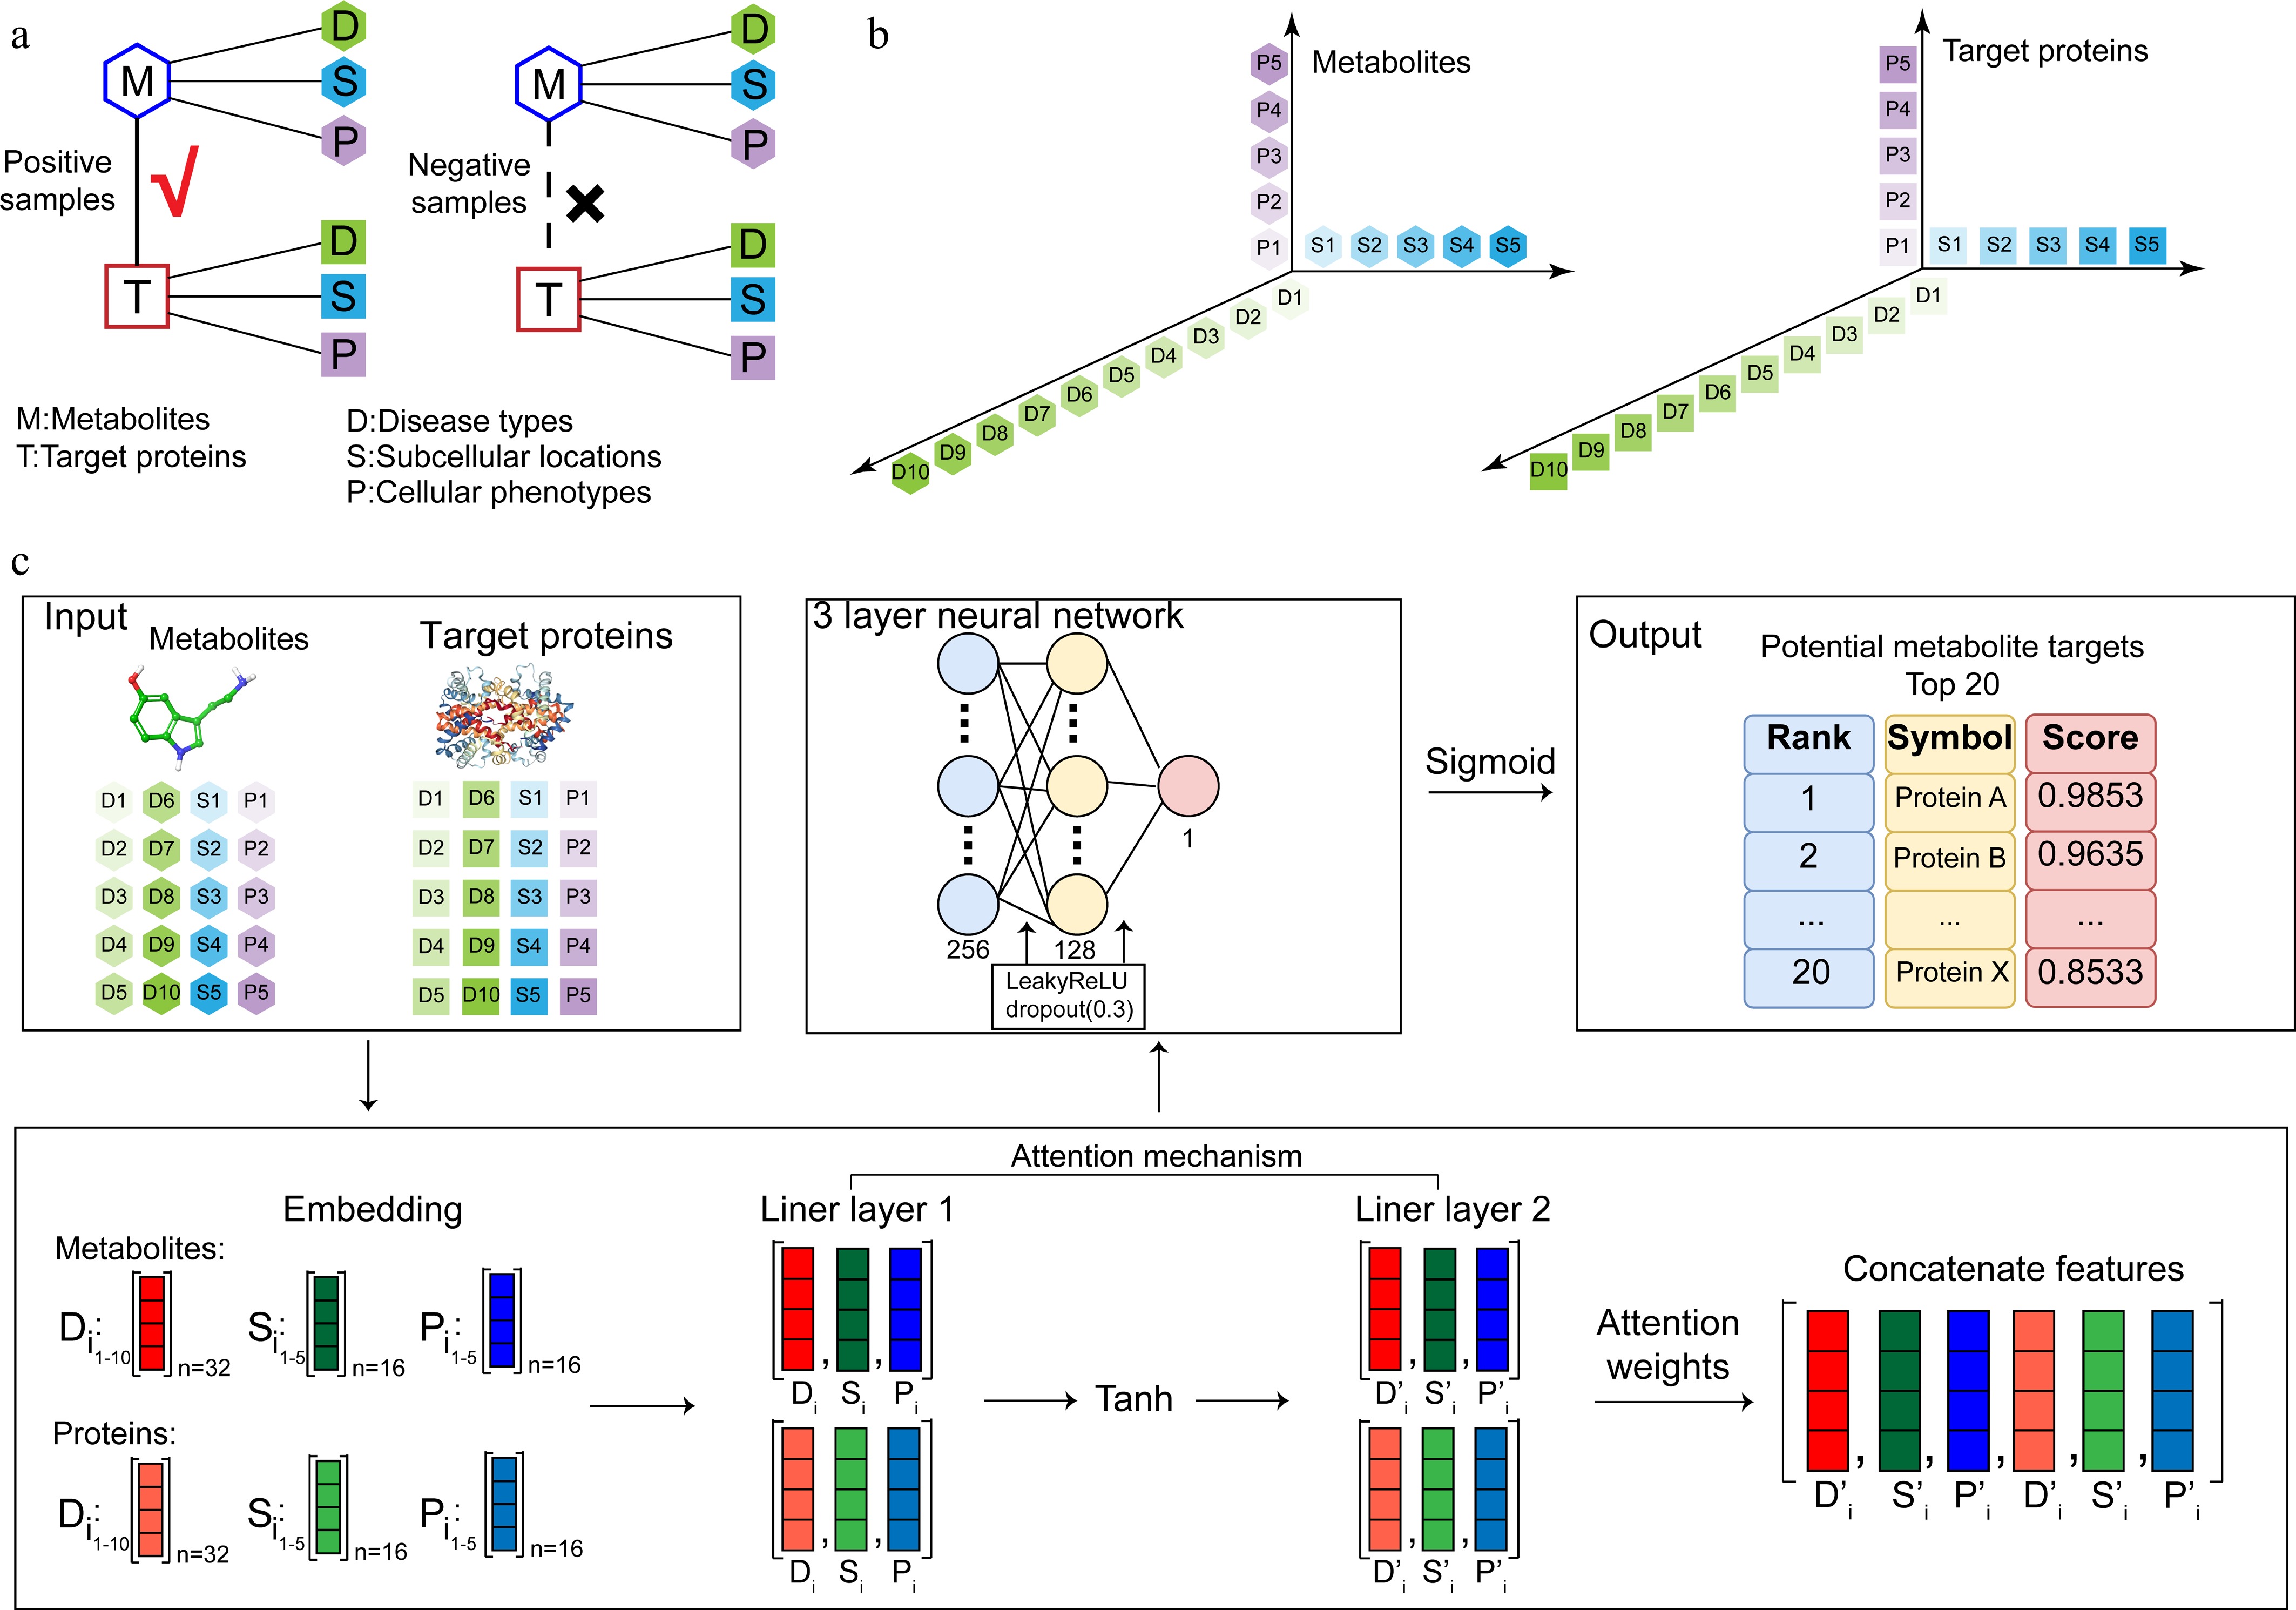
Figure 2.
Dataset construction and model workflow of DeepETD. (a) Training dataset construction: a dataset containing positive and negative samples of interactions between endogenous metabolites and target proteins. (b) Multidimensional feature matrix representation of metabolites and target proteins. (c) Model design: the input features (associated diseases, cellular phenotypes, and subcellular localization) are encoded through the embedding layer. The encoded features are processed by the attention mechanism, followed by the feature concatenation layer. The model employs a fully connected layer to output the potential binding probability scores between endogenous metabolites and target proteins, and generates a list of the top 20 potential target proteins for subsequent experimental verification.
-
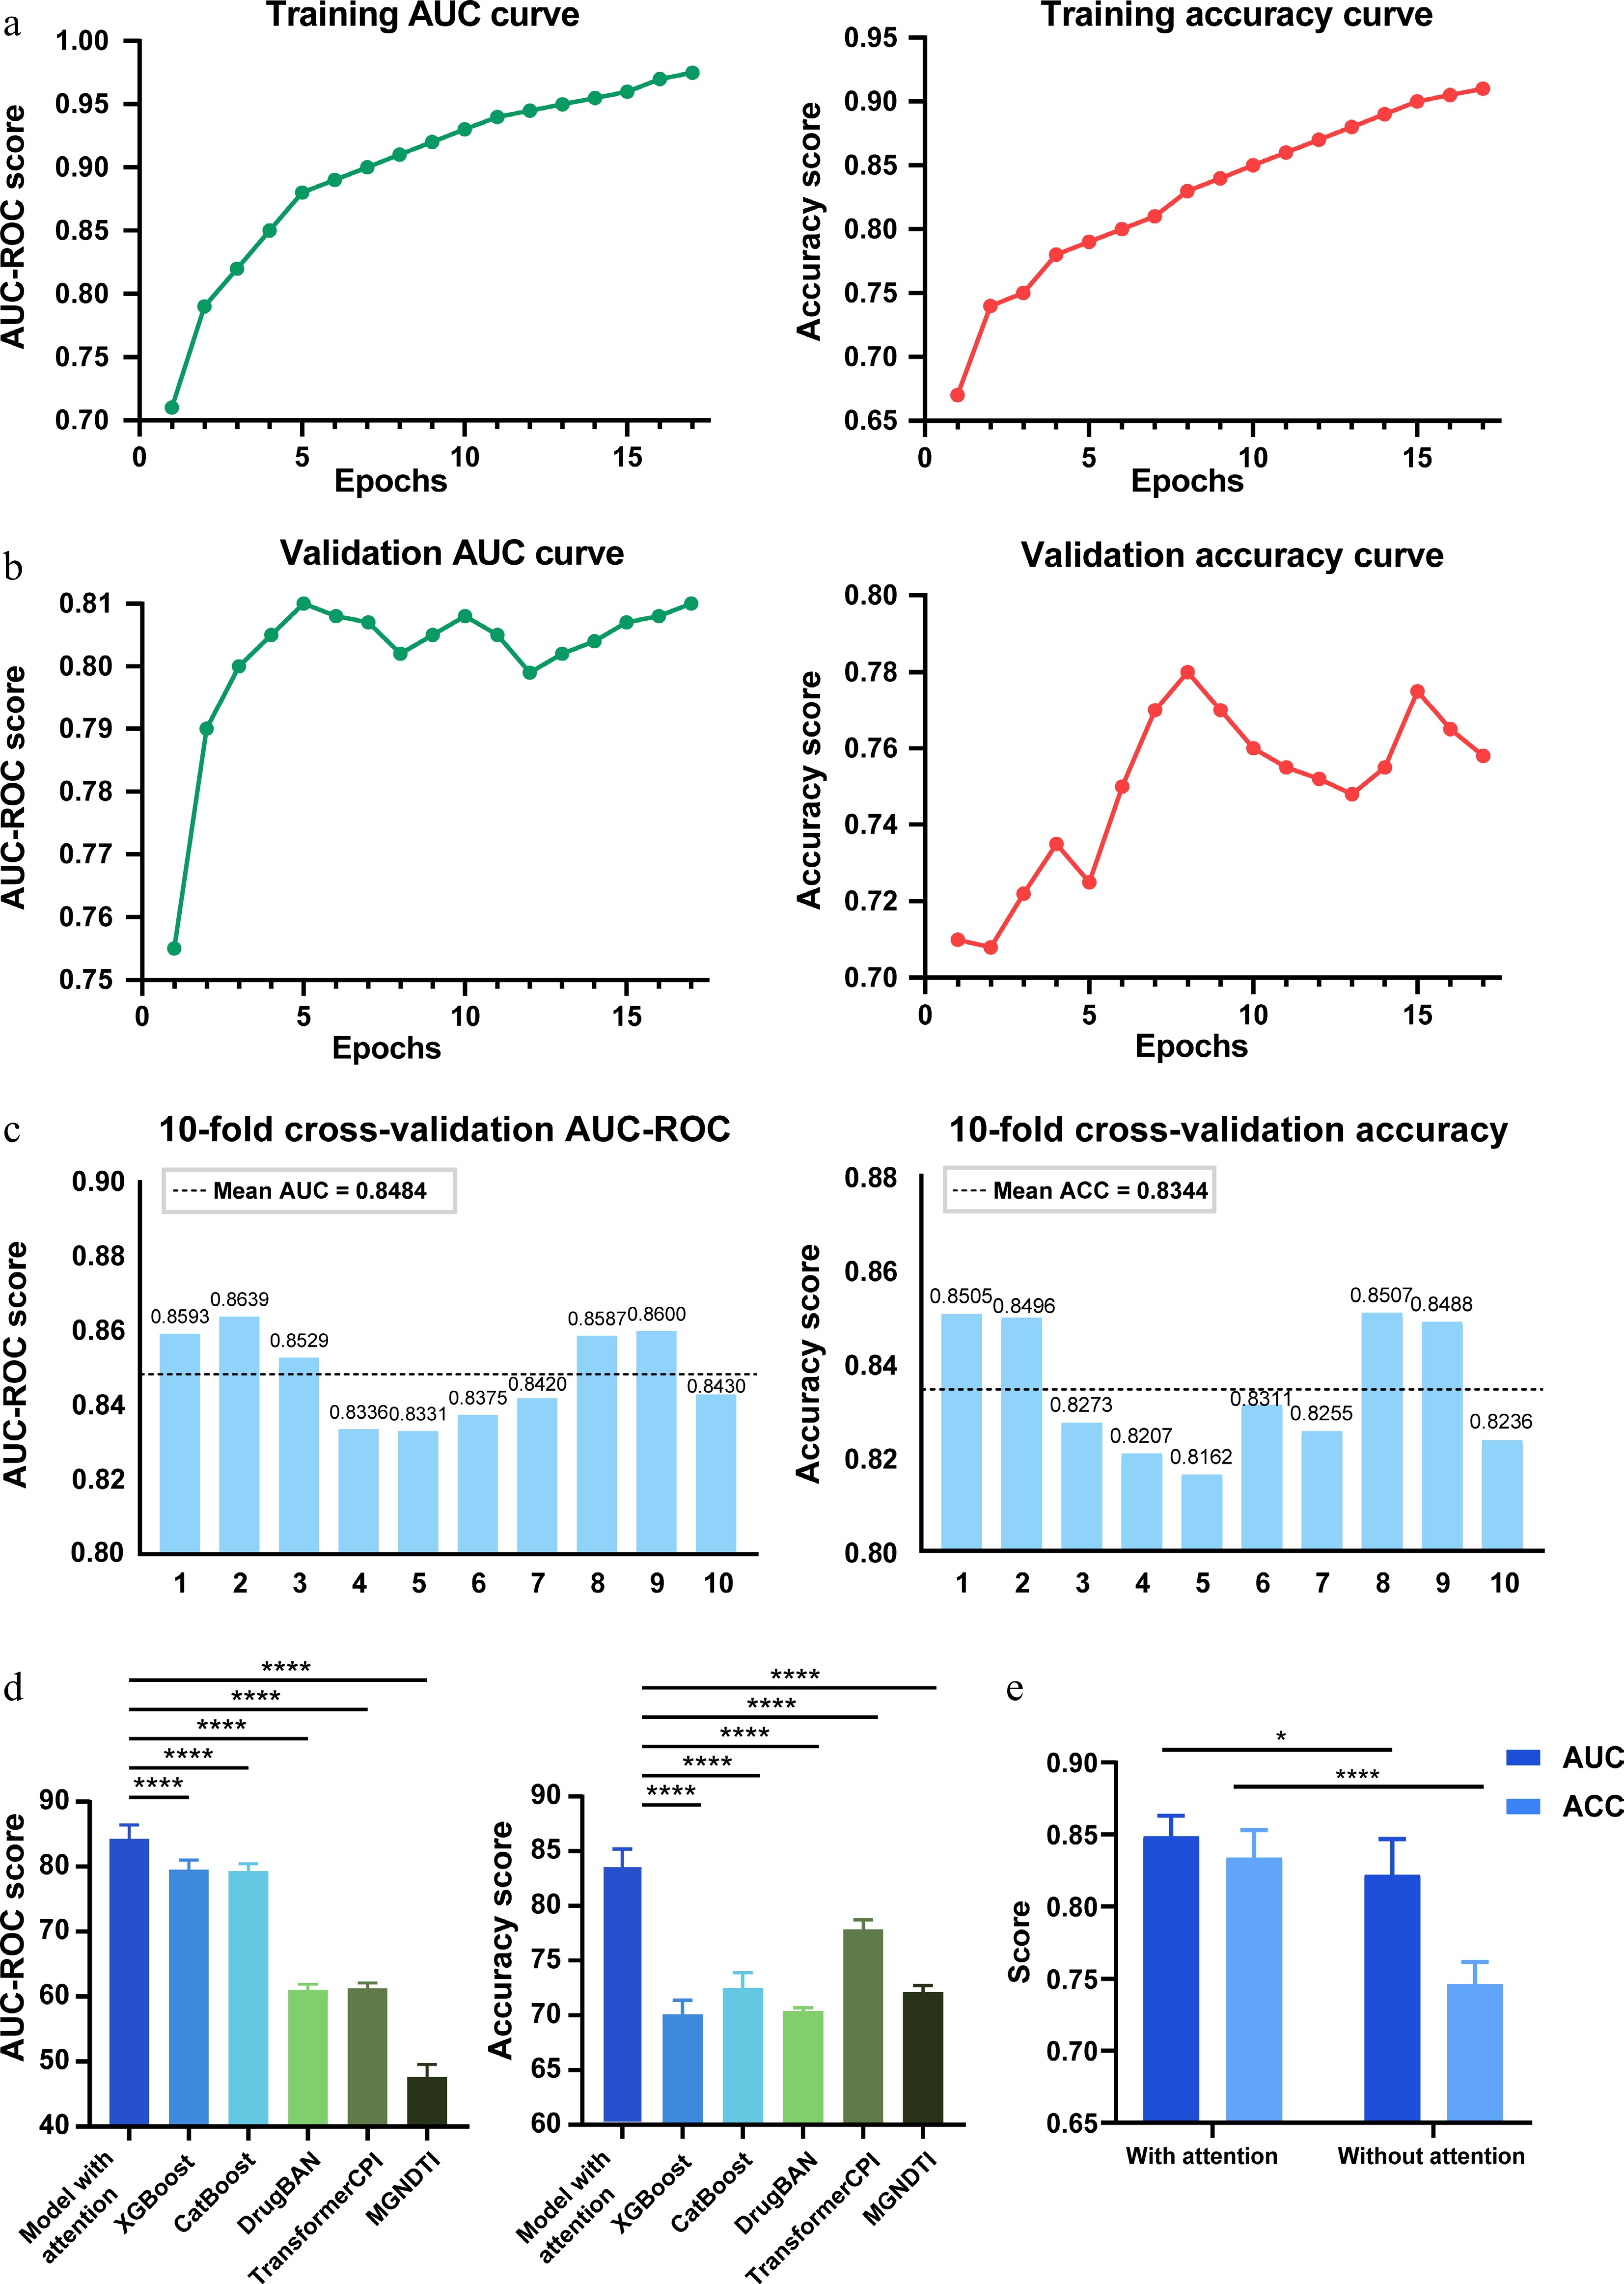
Figure 3.
Model training and performance evaluation. (a) Performance of the DeepETD model on the training set. The AUC-ROC curve and accuracy results demonstrate the predictive capability of DeepETD. (b) Performance of the DeepETD model on the validation set. (c) Evaluation of model stability using 10-fold cross-validation. Most AUC values fall within the range of 0.80 to 0.88, with an average of 0.8484 and a standard deviation of 0.0137 Similarly, most accuracy values lie between 0.80 and 0.86, with a mean of 0.8344 and an approximate standard deviation of 0.0145. (d) Performance comparison of DeepETD with baseline models (XGBoost/CatBoost) and deep learning models (DrugBAN/TransformerCPI/MGNDTI). DeepETD showed better predictive performance than the other models. **** P < 0.0001; one-way ANOVA. (e) An ablation study was conducted to evaluate the contribution of the attention mechanism to model performance. Results from models with and without the attention layer demonstrate that the attention mechanism significantly improves prediction accuracy. **** P < 0.0001, * P < 0.05; one-way ANOVA. Data are presented as the mean ± SEM, n = 5.
-
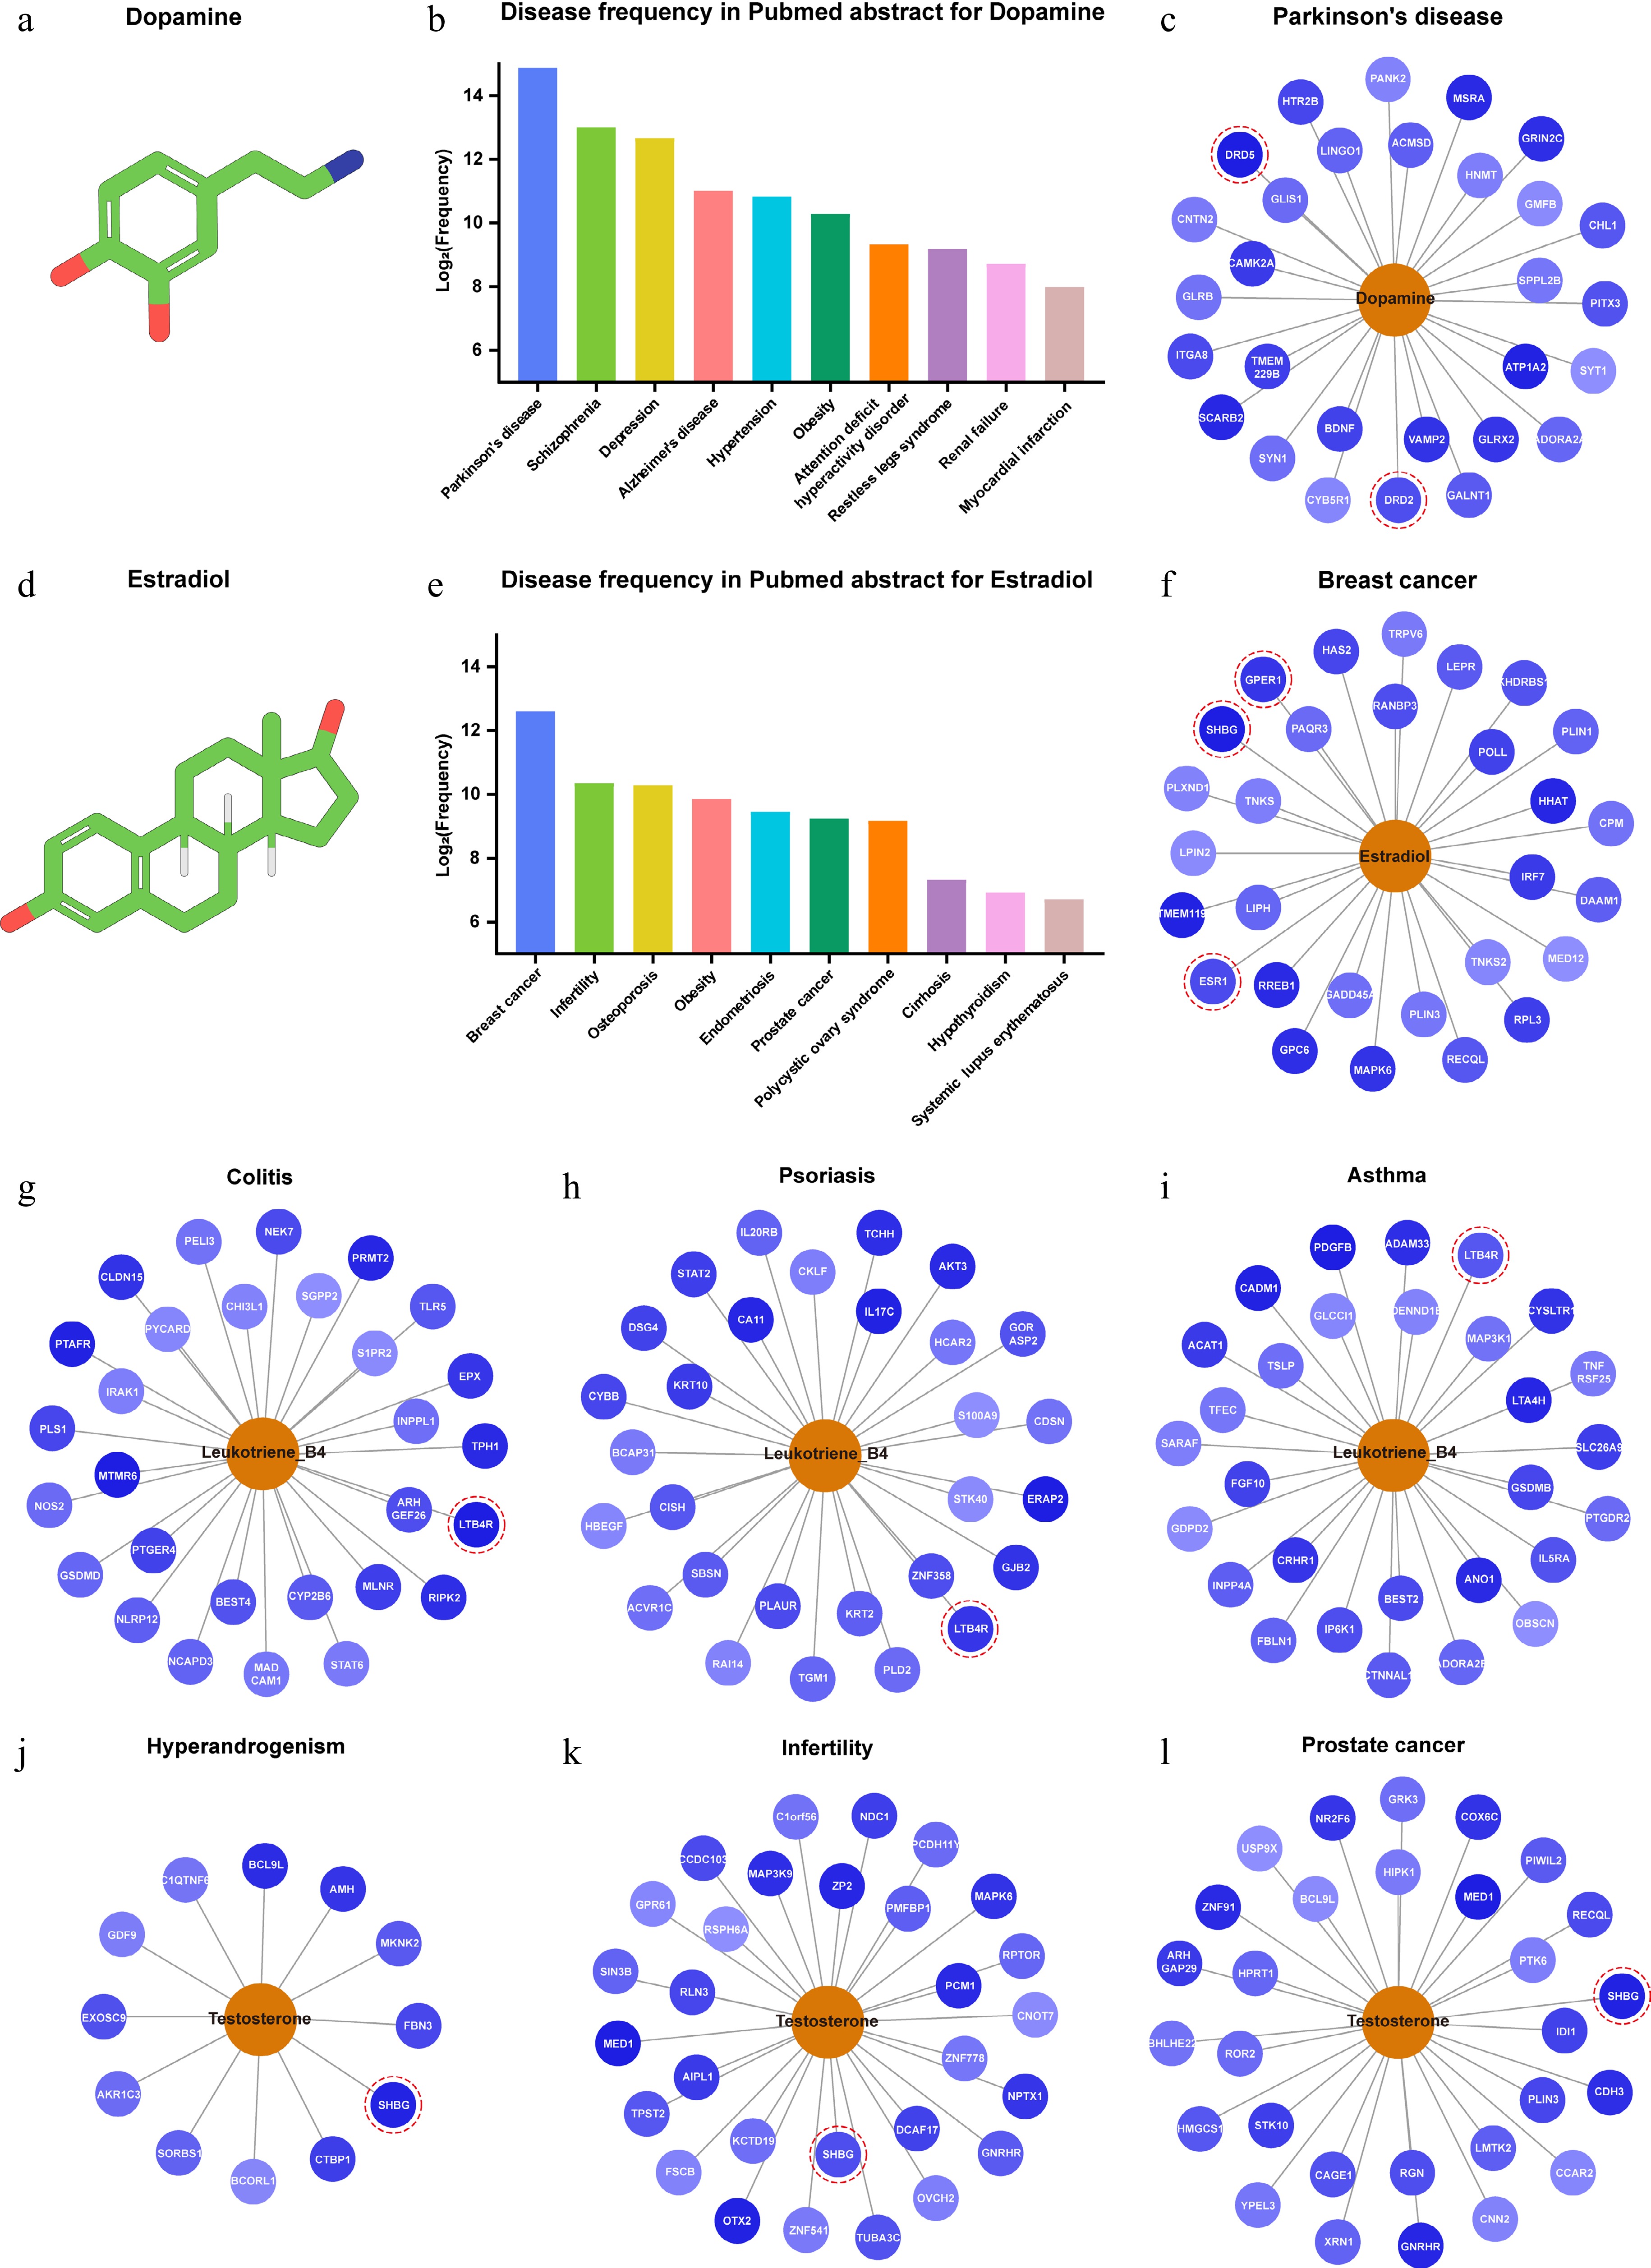
Figure 4.
DeepETD successfully enriched disease-related targets of common metabolites. The standard output format of DeepETD via divergence plot and bar graph (taking dopamine and estradiol as examples). Bar chart: displaying the top 10 associated diseases with the highest frequency of appearance in endogenous metabolite literature. Divergence plot: showing the fingerprint matching strength between endogenous metabolites and their top 20 predicted target proteins. (a) Chemical structure of dopamine. (b) Co-occurrence frequency of dopamine-related diseases in PubMed abstracts (top 10). (c) Successful prediction of multiple known targets of dopamine in the context of Parkinson's disease: DRD2 and DRD5. (d) Chemical structure of estradiol. (e) Co-occurrence frequency of estradiol-related diseases in PubMed abstracts (top 10). (f) Successful prediction of multiple known targets of estradiol in the context of breast cancer: GPER1, SHBG, and ESR1. (g)–(l) Successful identification of verified targets for a variety of metabolites in multiple disease contexts: LTB4R and SHBG.
-
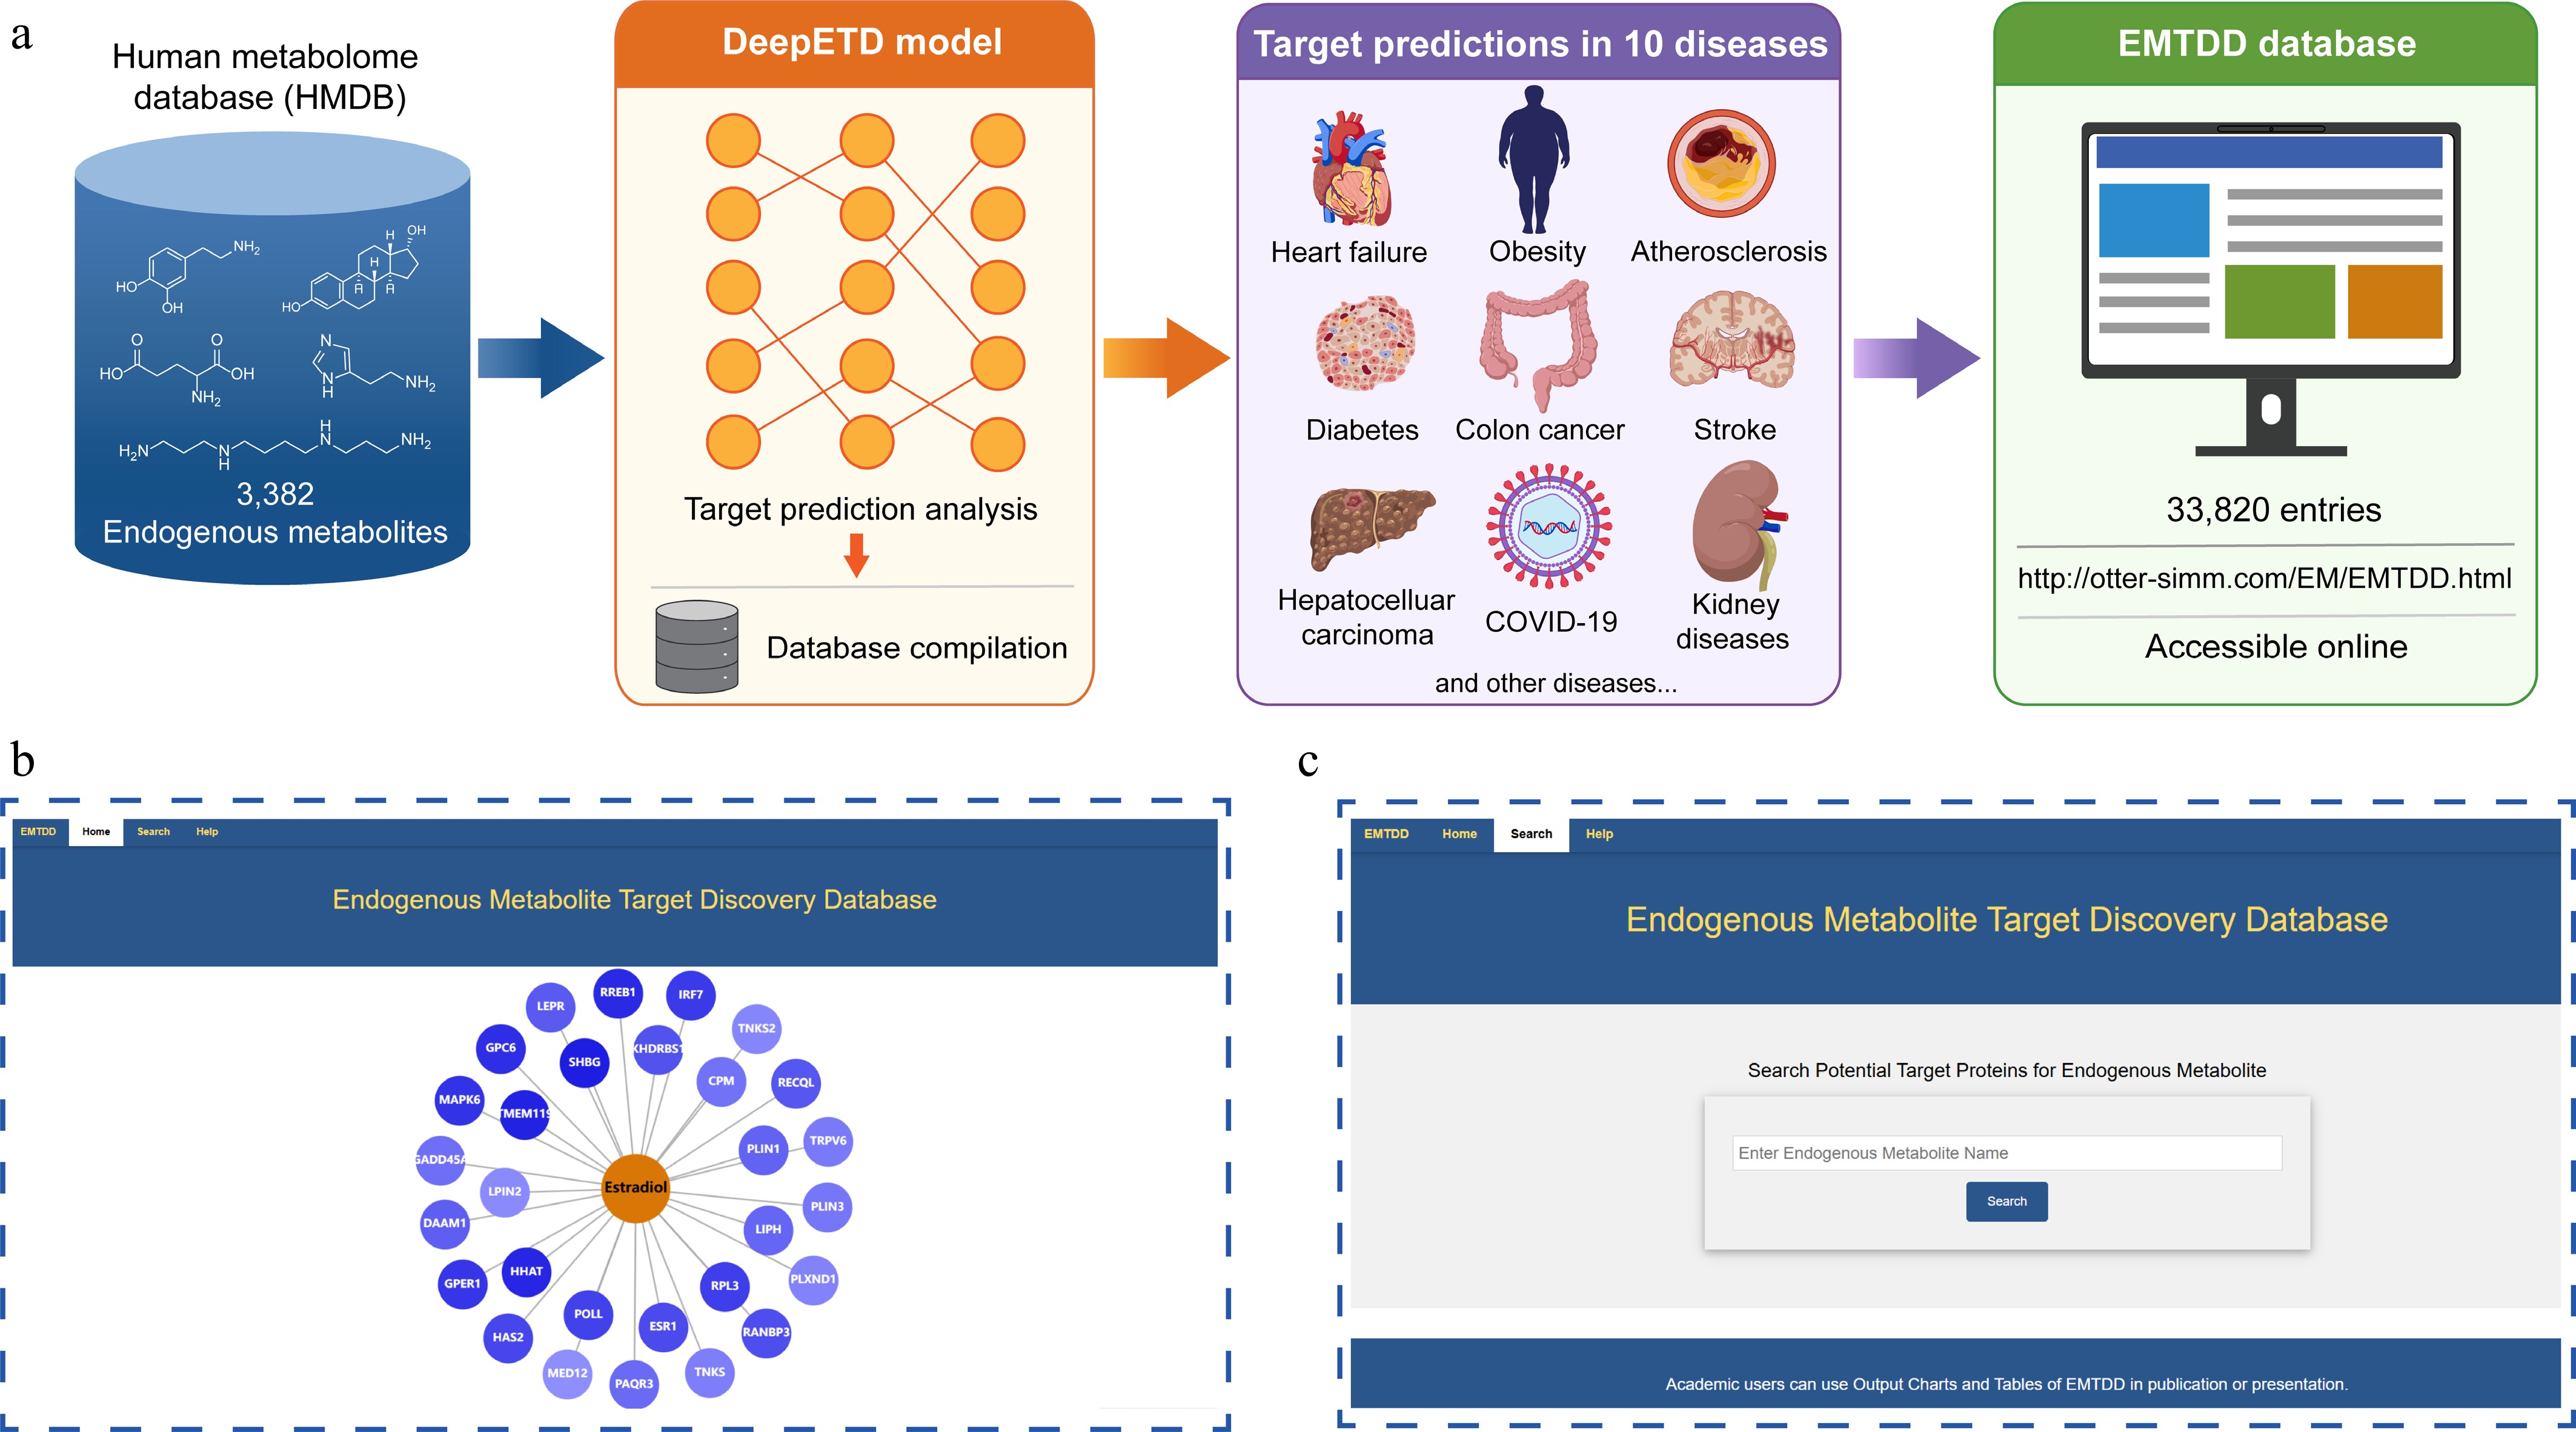
Figure 5.
Construction of the Endogenous Metabolites Target Discovery Database (EMTDD). (a) Data source: collection of 3,382 endogenous metabolites from the Human Metabolome Database (HMDB). Database component: the database encompasses 10 associated diseases with high-frequency co-occurrence of each metabolite in PubMed, along with corresponding potential target prediction results totaling 33,820 entries. (b), (c) EMTDD web interface display: the Homepage and Search function.
-
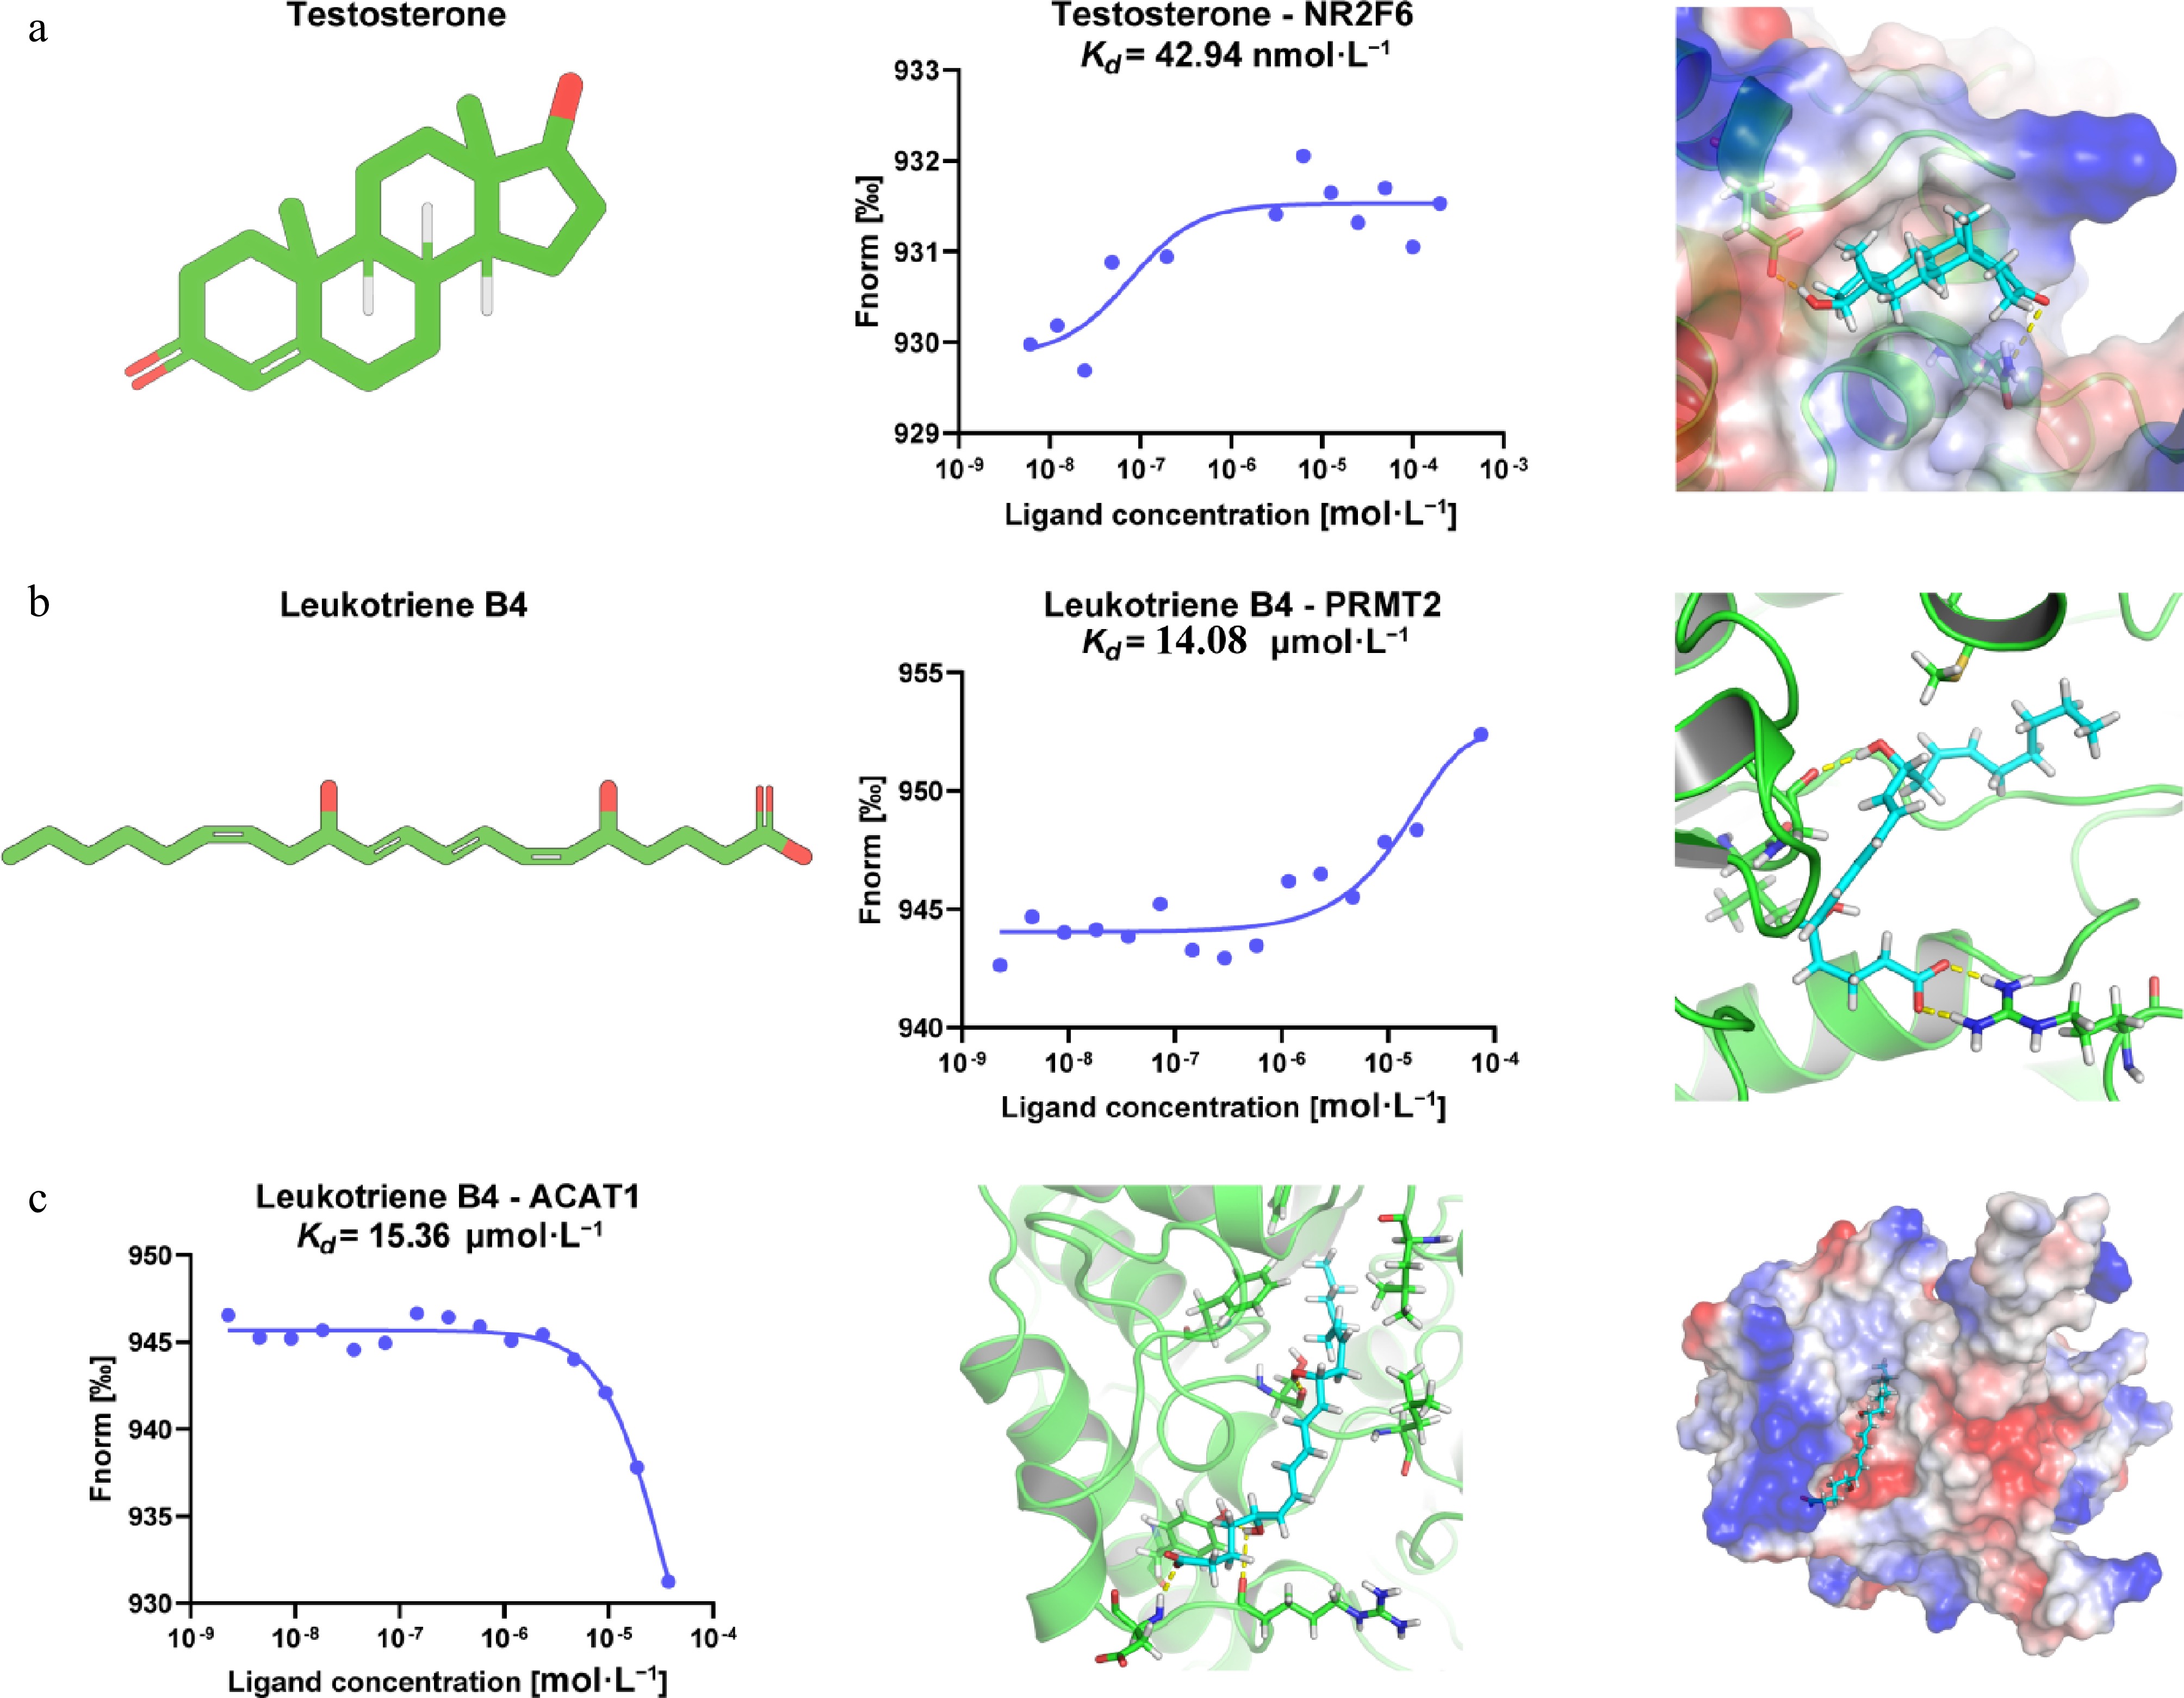
Figure 6.
Experimental validation of endogenous metabolite-target binding predicted by DeepETD. (a) Validation of the interaction between testosterone and NR2F6. Left: chemical structure of testosterone. Middle: MST binding assay demonstrating direct binding of testosterone to NR2F6. Right: molecular docking analysis shows that testosterone may occupy the predicted ligand-binding pocket of NR2F6 and form favorable interactions with surrounding amino acid residues. (b) Validation of the interaction between leukotriene B4 (LTB4) and PRMT2. Left: chemical structure of LTB4. Middle: MST analysis confirms the direct binding of LTB4 to PRMT2, with the dissociation constant Kd of 14.08 μmol·L−1. Right: the molecular docking analysis elucidates the predicted binding mode of LTB4 in the binding pocket of PRMT2 and its interactions with surrounding residues. (c) Validation of the interaction between LTB4 and ACAT1. Left: MST binding curve shows direct binding of LTB4 to ACAT1, with the dissociation constant Kd of 15.36 μmol·L−1. Middle and right: the molecular docking analysis shows the binding conformation of LTB4 within the ACAT1 pocket and the electrostatic potential of the protein-ligand complex.
Figures
(6)
Tables
(0)