-
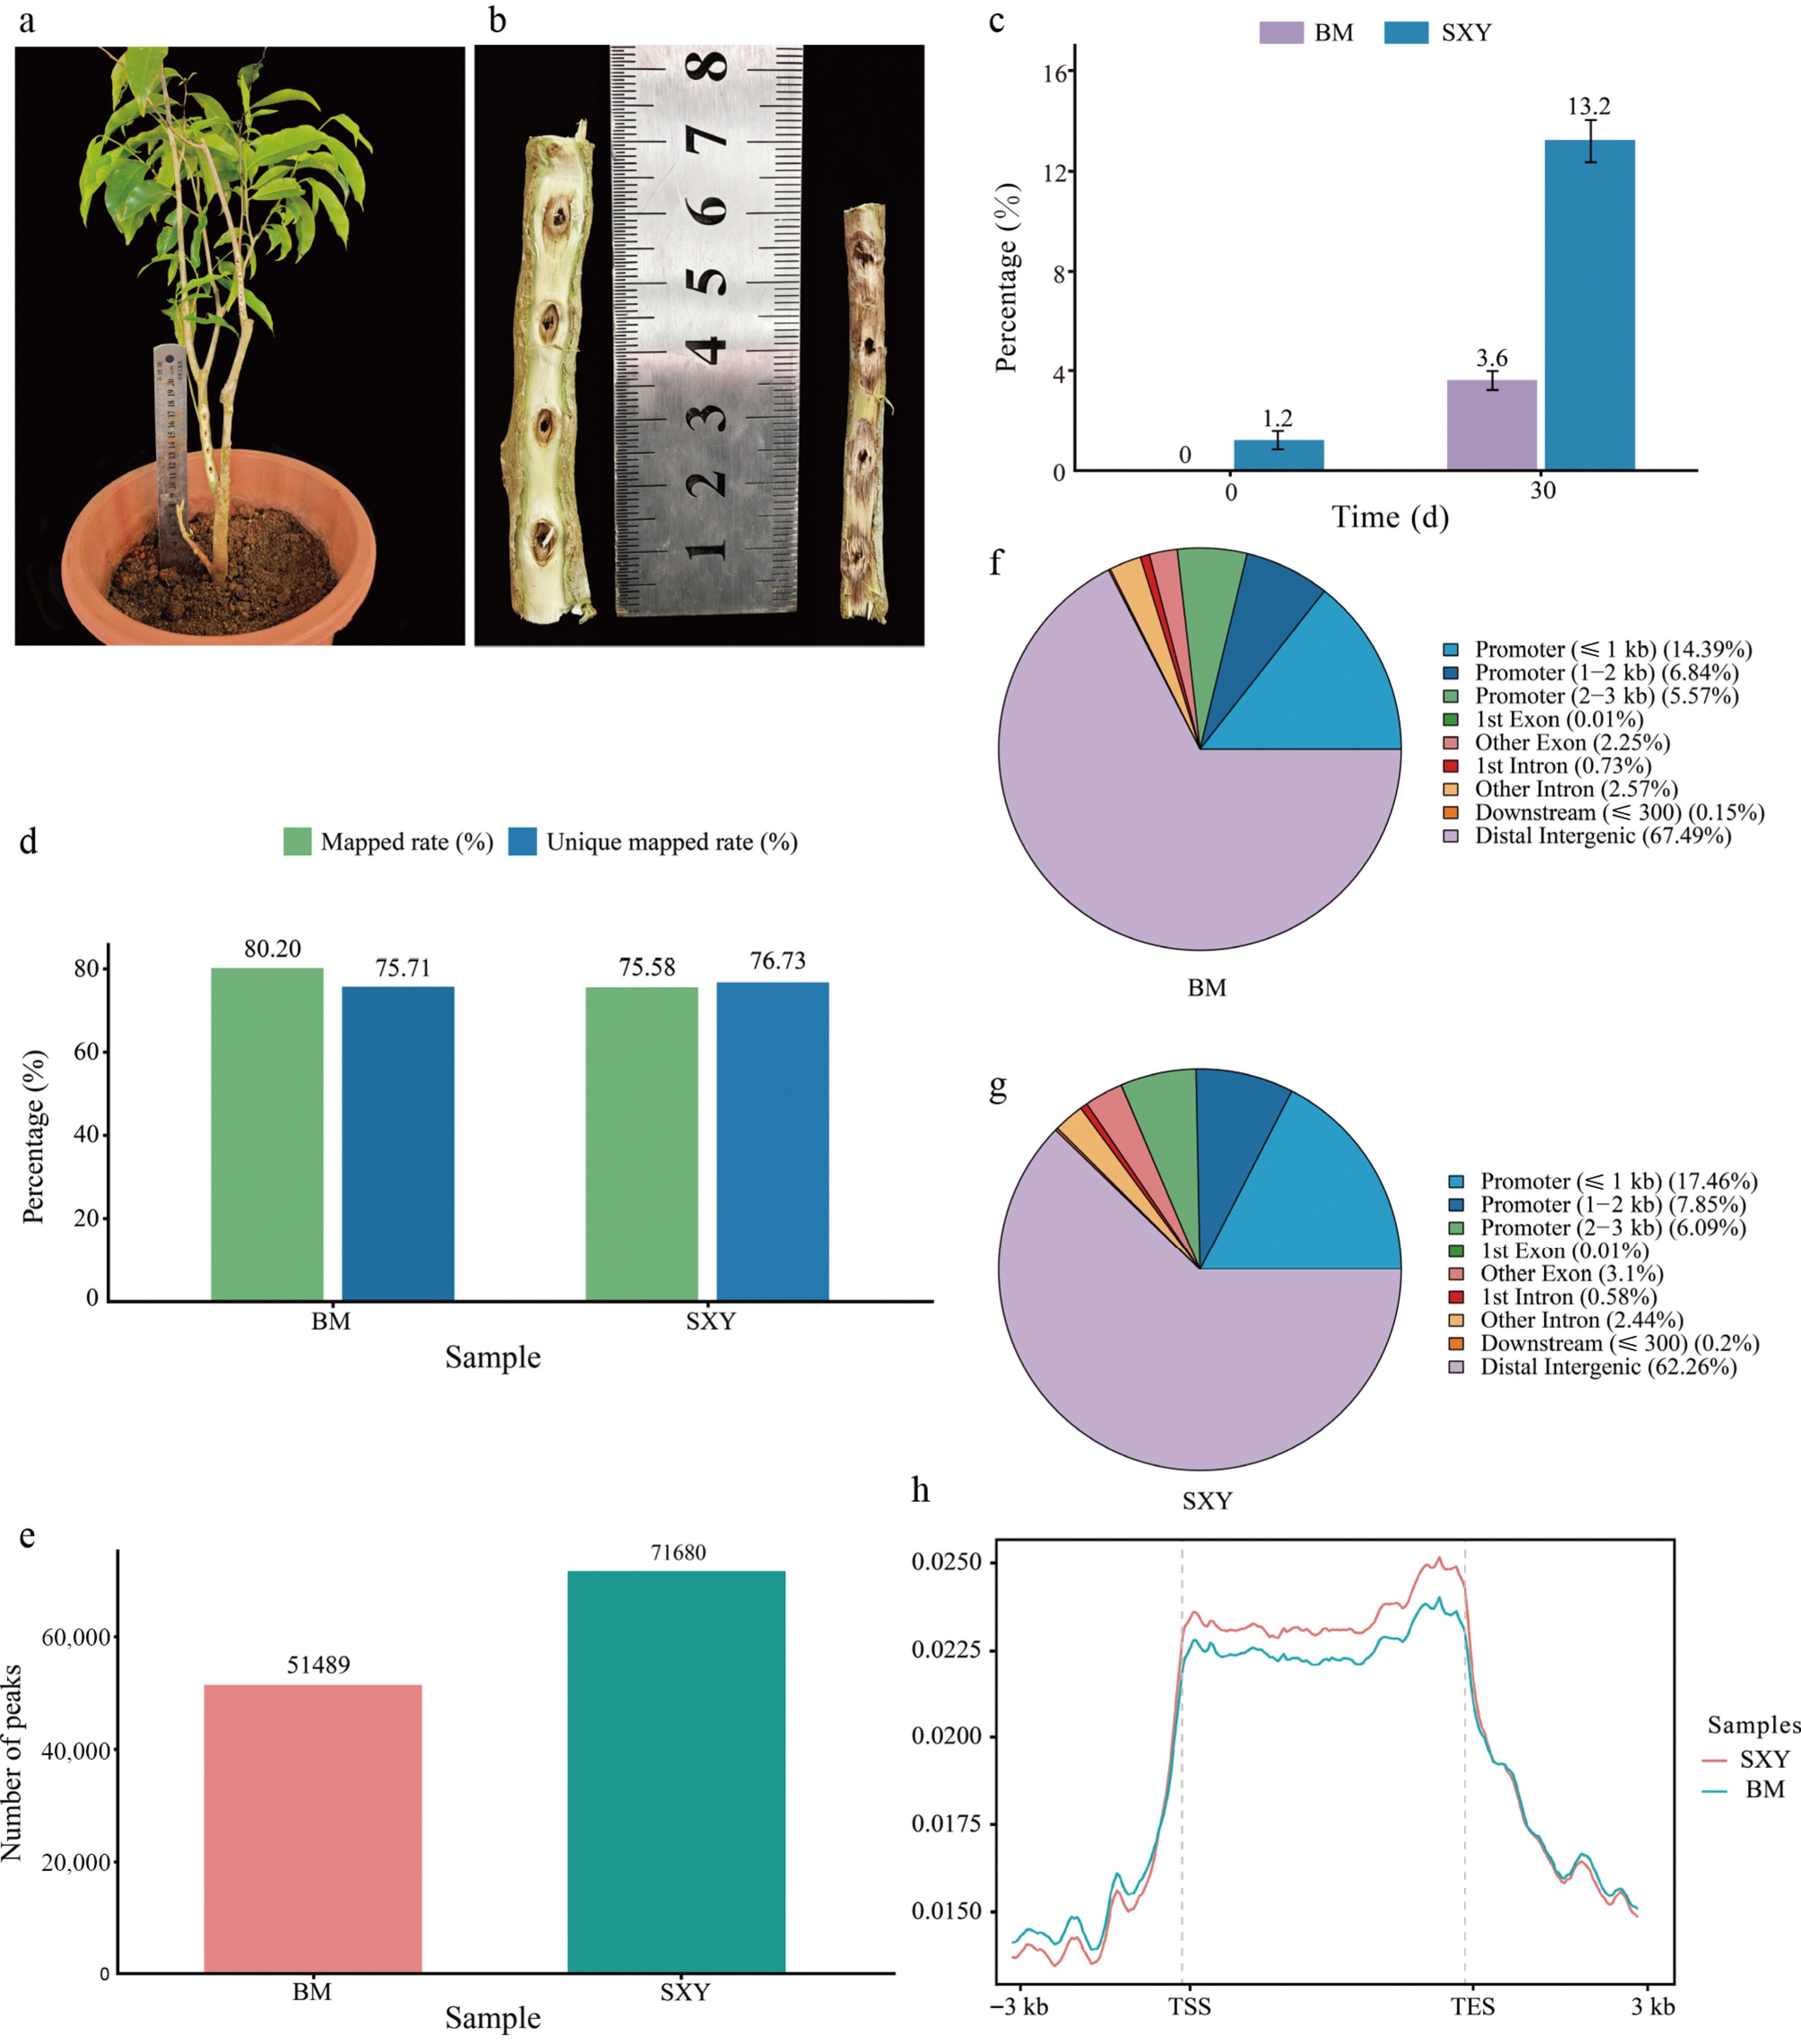
Figure 1.
Detection of the agarotetrol peak in SXY resin extracts via HPLC. (a) Representative grafted A. sinensis plants used for induction. (b) Representative induced stems at 30 d post-injury, showing stronger resinous discoloration in the SXY branch than in the BM branch. (c) Alcohol-soluble extractive content at 0 and 30 d post-injury (mean ± SD, n = 3; two-sided Student's t-test, p < 0.05). (d) ATAC-seq mapping and unique mapping rates (0 d). (e) Total number of called peaks in BM and SXY (0 d). (f), (g) Genomic feature distribution of ATAC-seq peaks in (f) BM, and (g) SXY. (h) Metagene plot of ATAC-seq signal across gene bodies with transcription start site (TSS) and transcription end site (TES) landmarks (± 3 kb flanks).
-
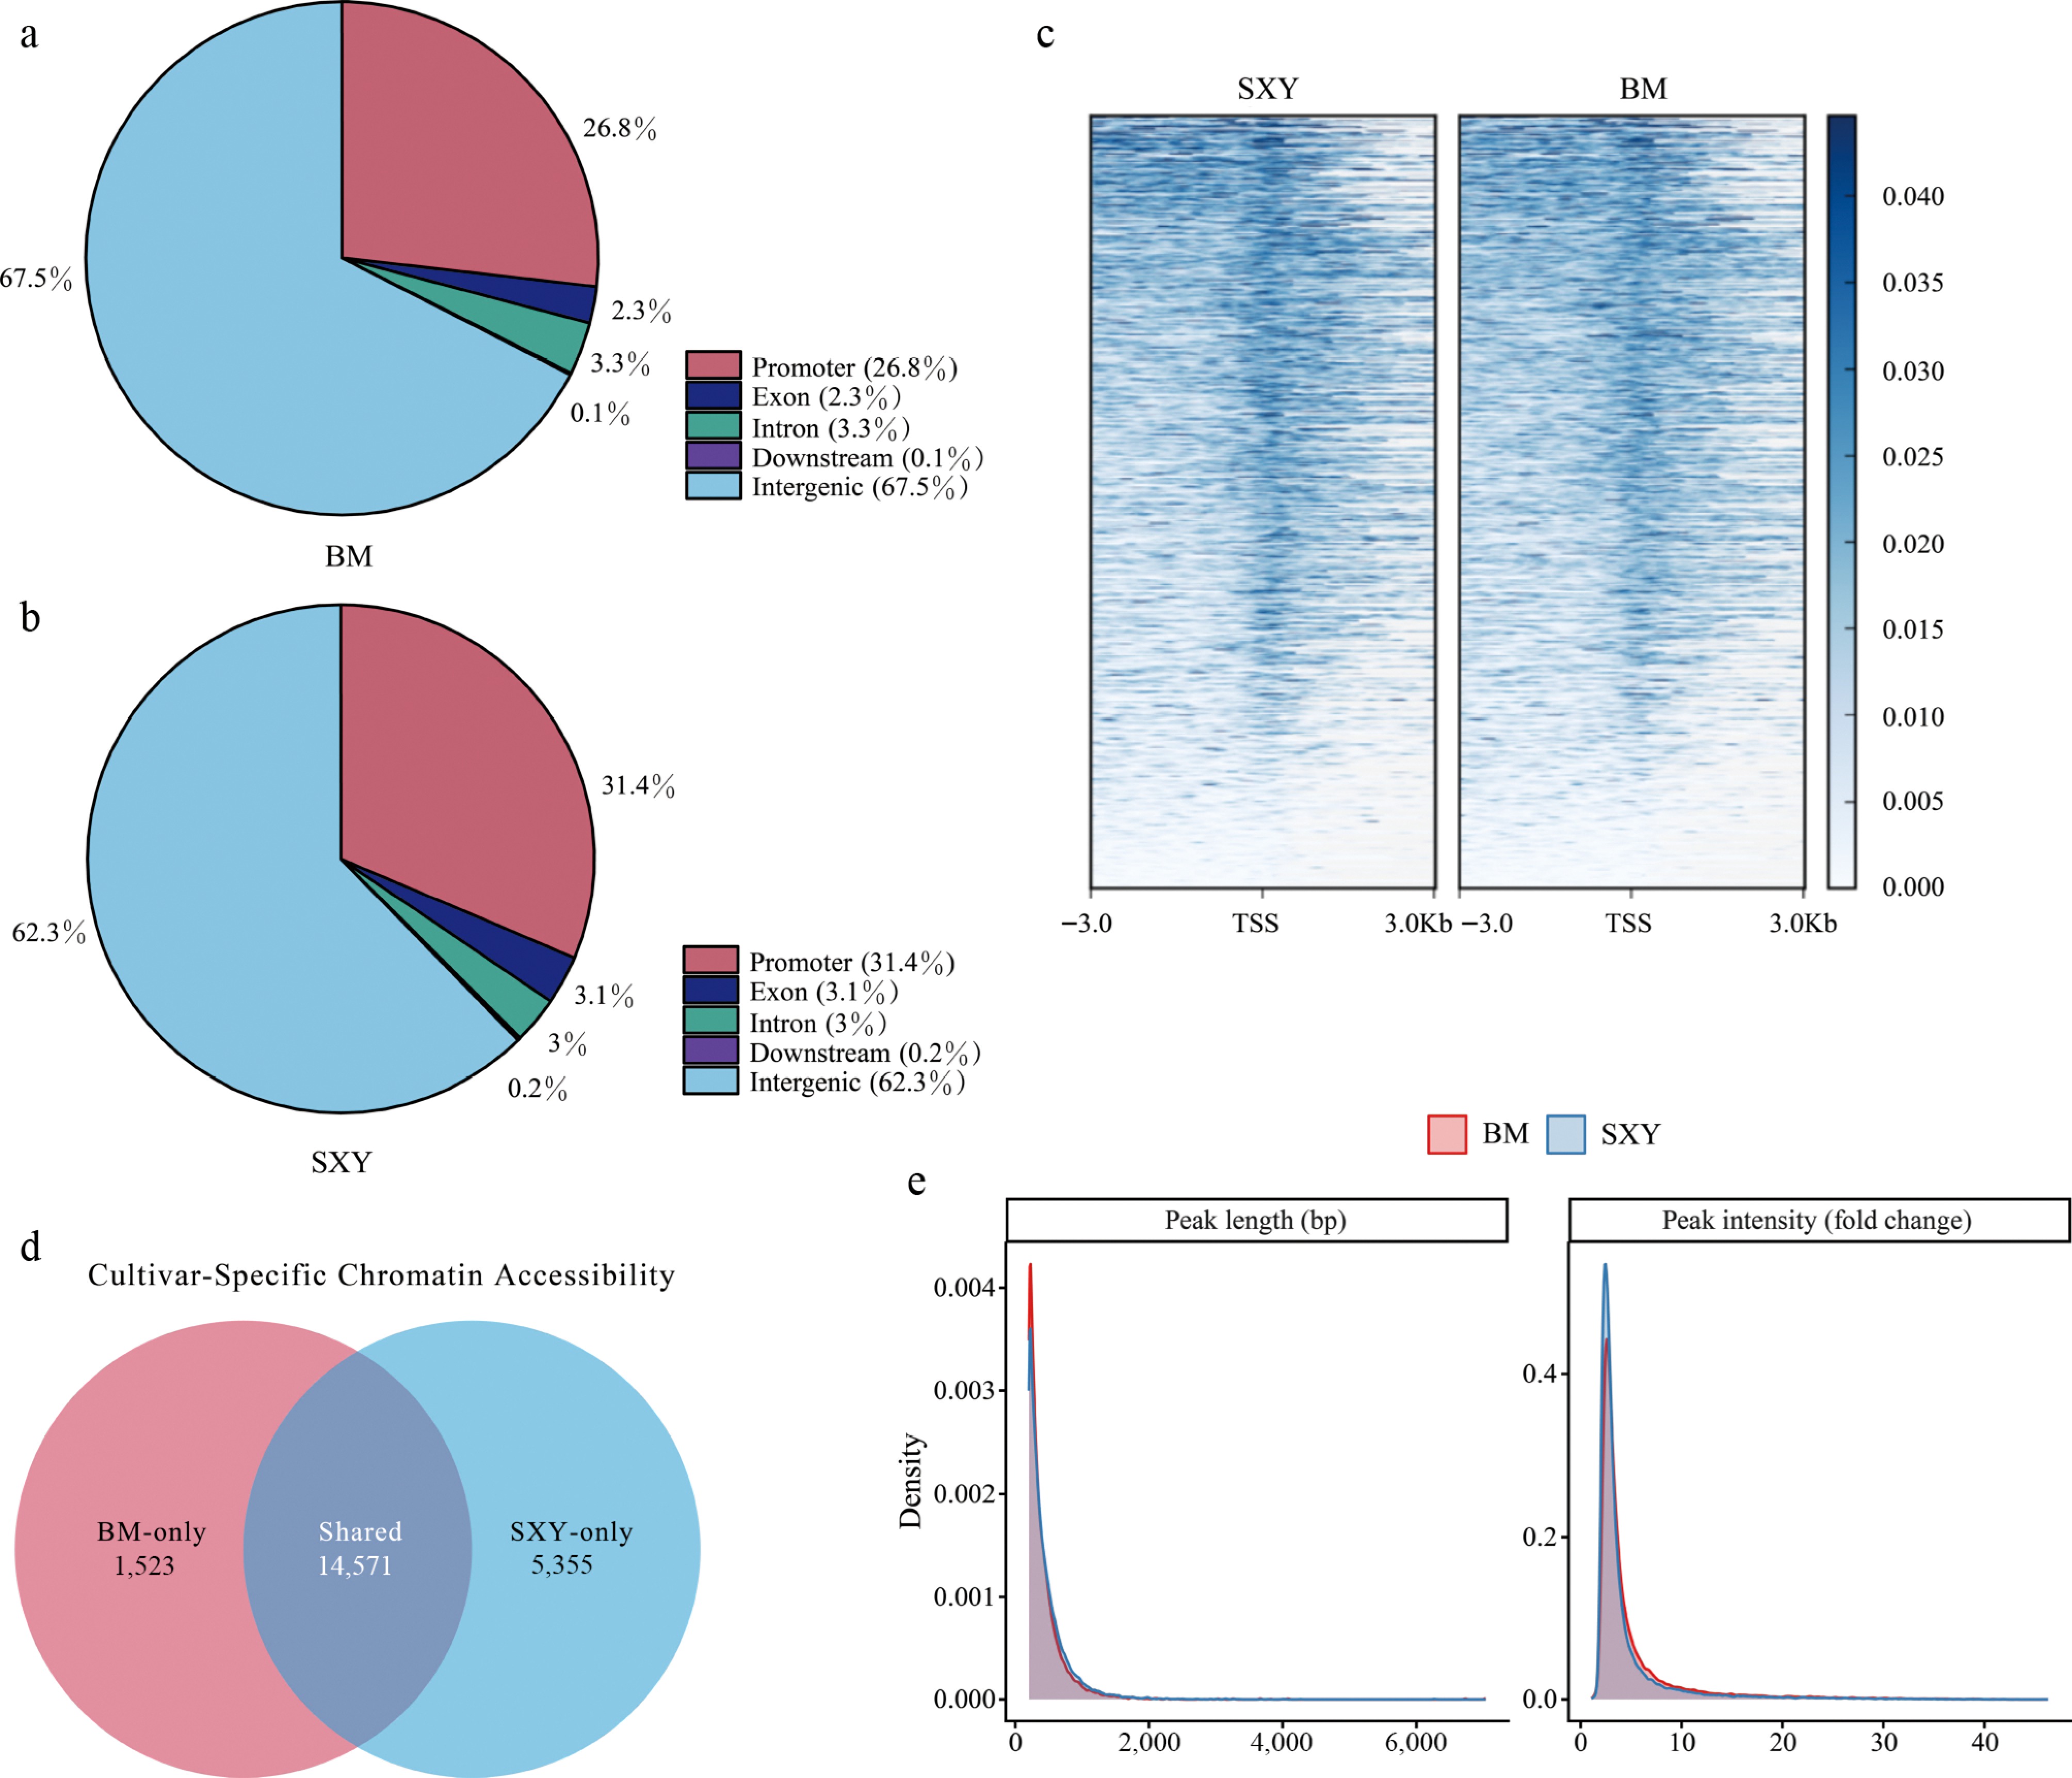
Figure 2.
Landscape of accessible chromatin regions (ACRs). (a), (b) Distribution of peaks relative to genomic features in (a) BM, and (b) SXY. (c) Heatmap of ATAC-seq signal intensity within ± 3 kb around the TSS of all genes. (d) Venn diagram showing cultivar-specific (SXY-only, BM-only) and shared ACRs. (e) Distributions of peak length and peak intensity for BM and SXY.
-
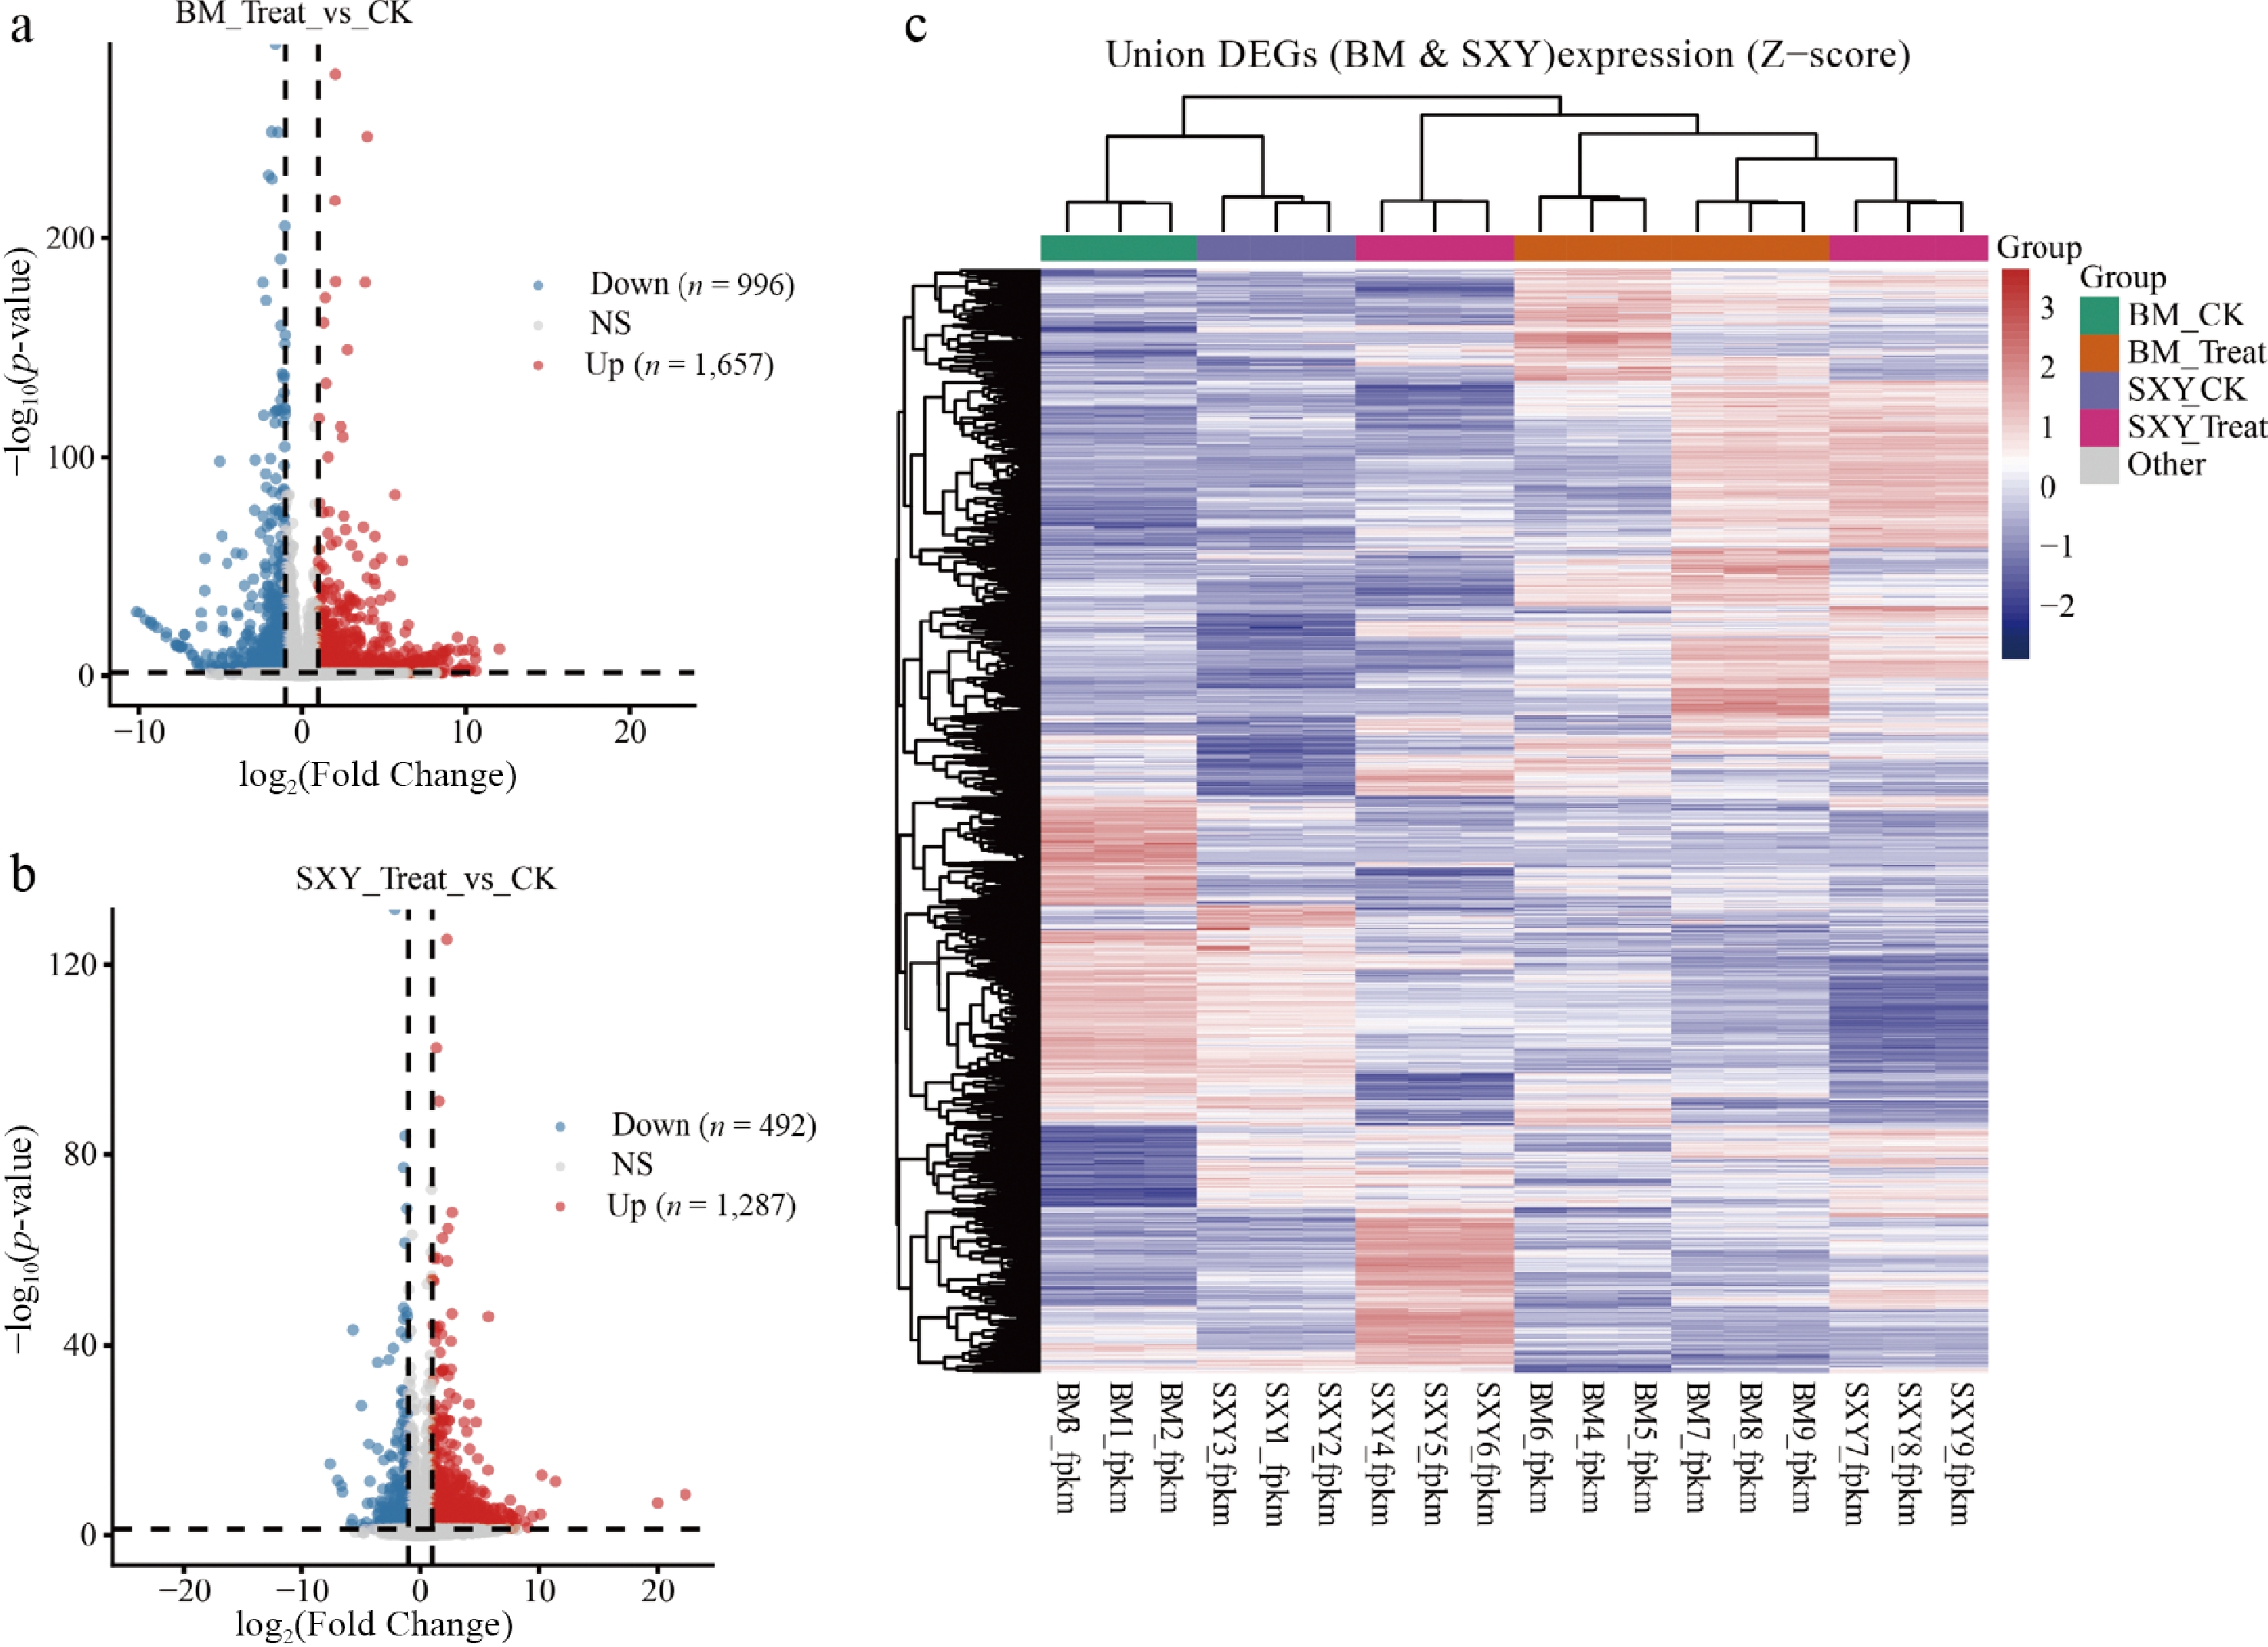
Figure 3.
Gene set enrichment analysis (GSEA) of terpenoid-related gene sets. (a), (b) Volcano plots of differentially expressed genes (DEGs) in (a) BM, and (b) SXY (Treat vs CK; |log2FC| ≥ 1, p-value ≤ 0.05). (c) Hierarchical clustering heatmap of all identified DEGs across cultivars and treatments.
-
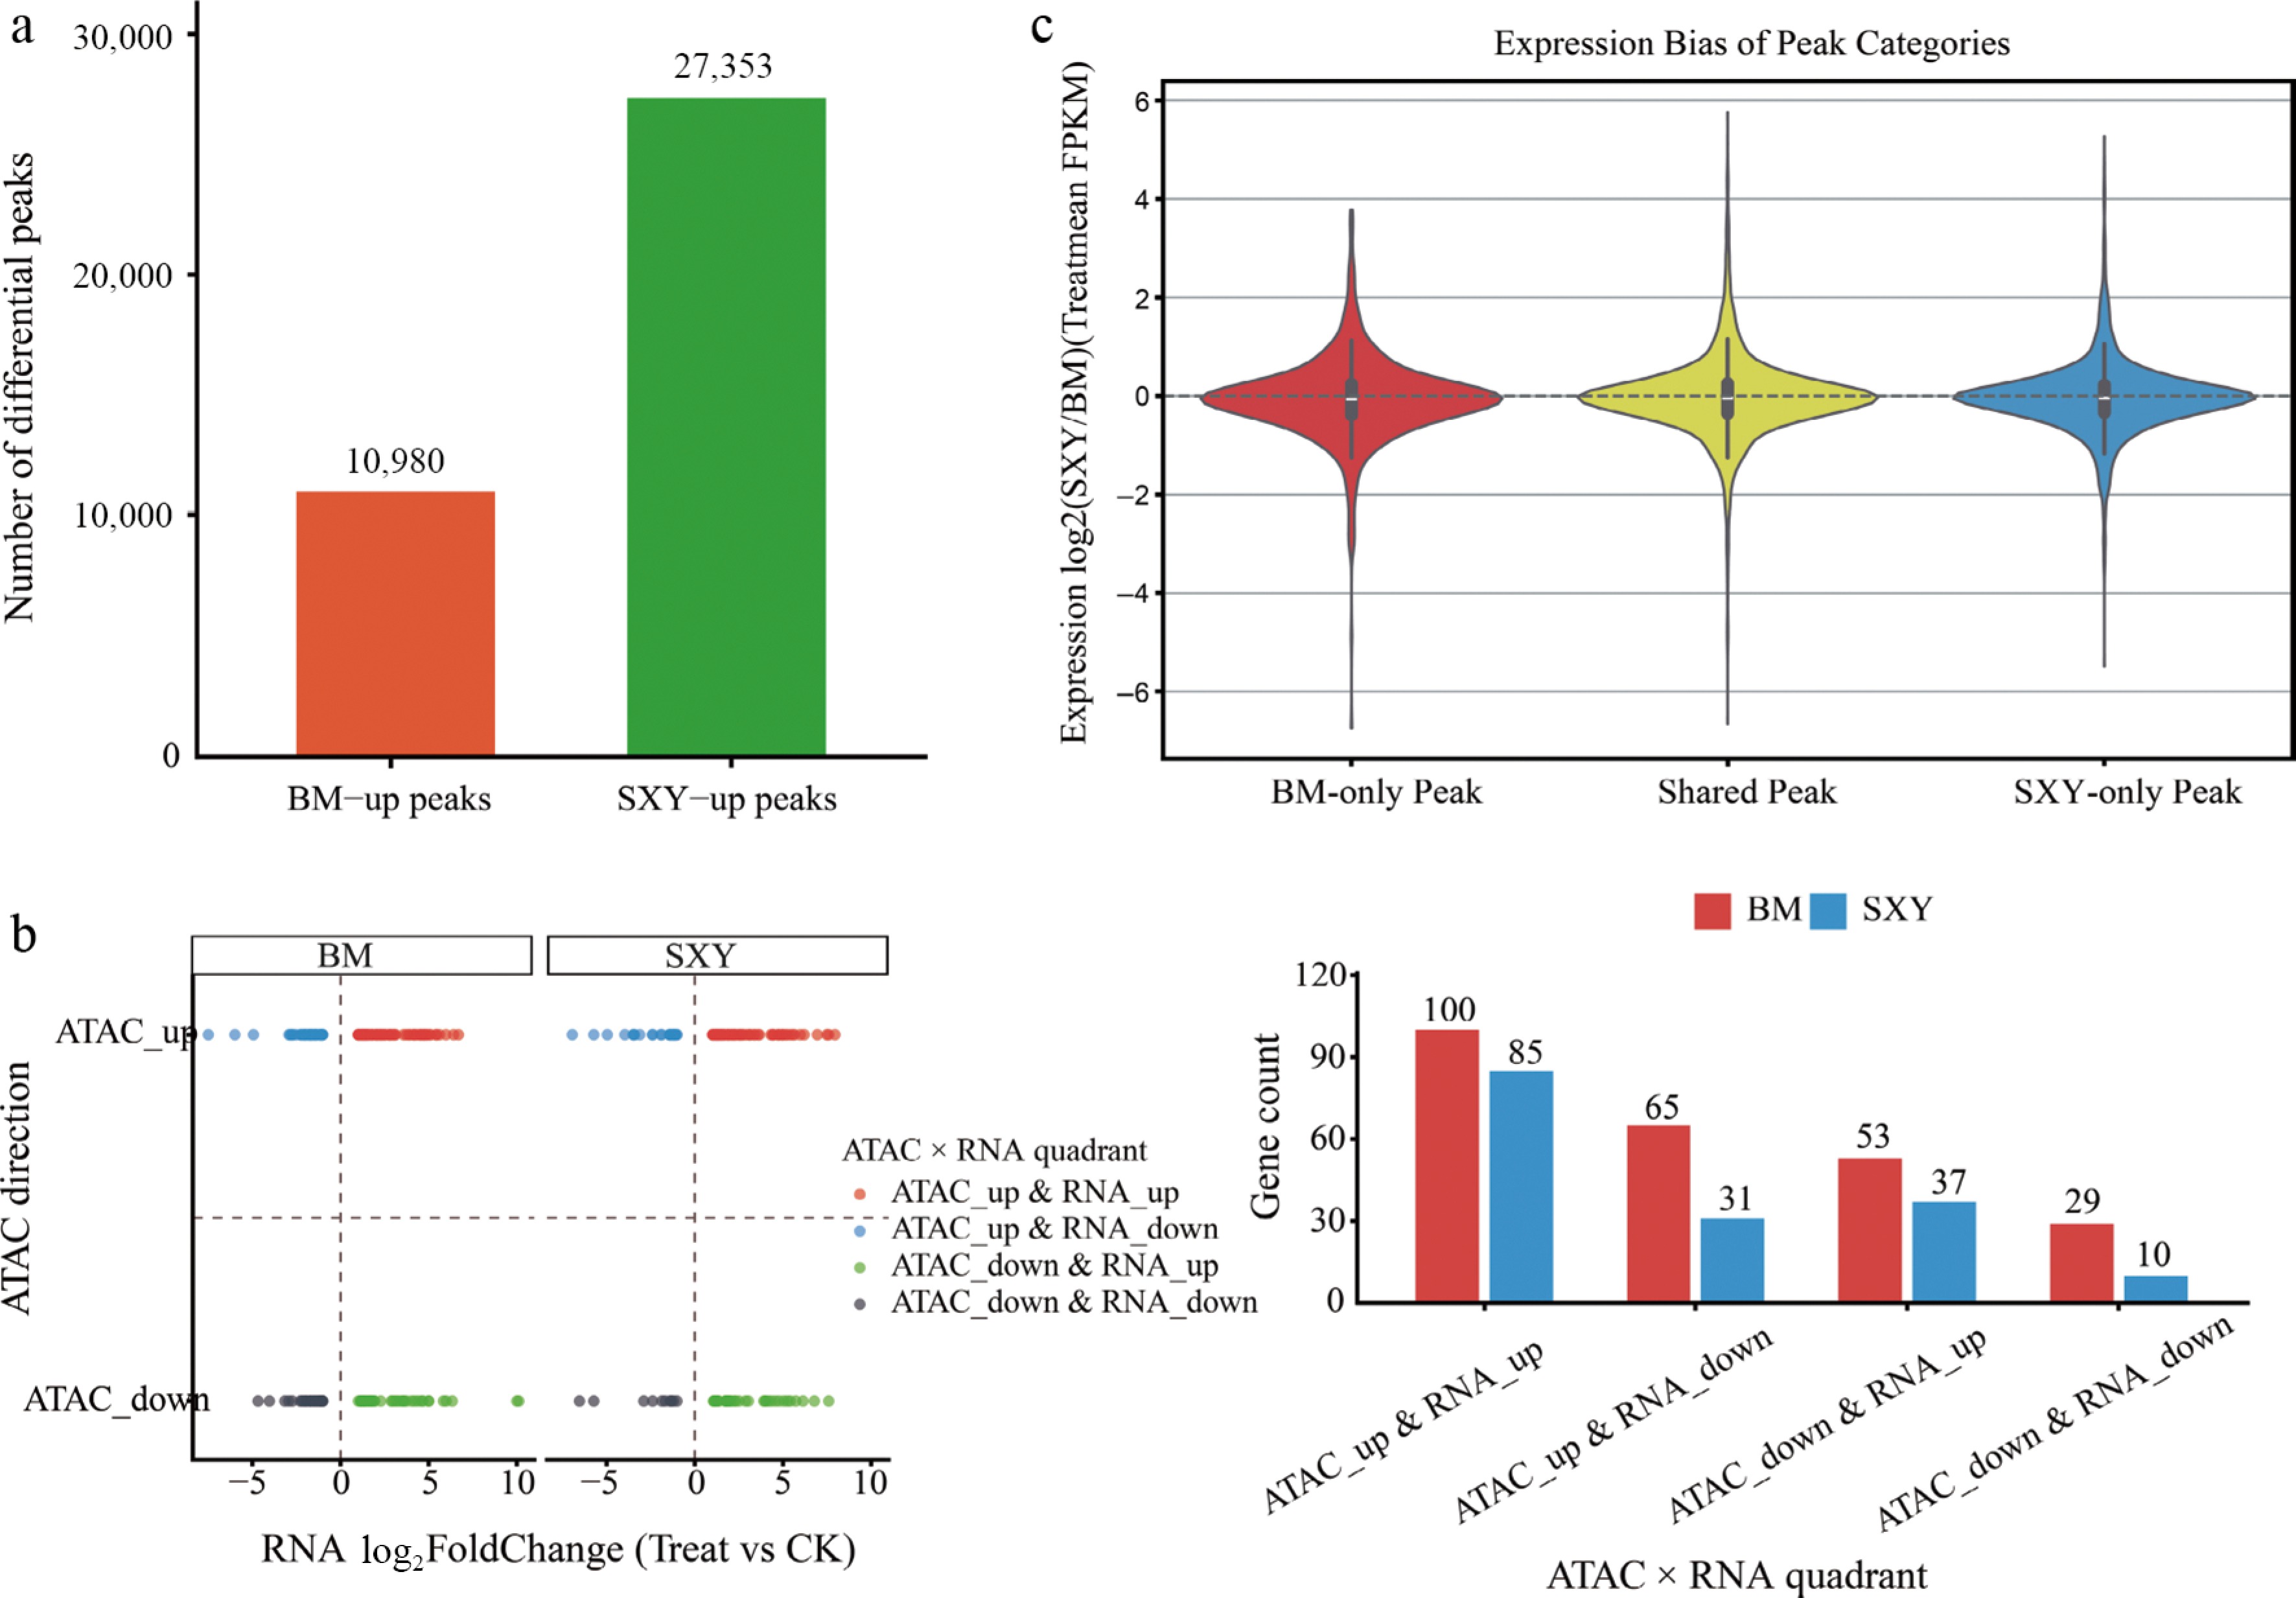
Figure 4.
Integration of chromatin accessibility and gene expression. (a) Classification of cultivar-biased peaks (SXY-up vs BM-up). (b) Quadrant analysis integrating accessibility direction (SXY vs BM) and expression change (Treat vs CK). (c) Violin plot showing the distribution of expression bias (log2(Treat/CK) in Treat samples) for genes associated with cultivar-specific or shared peaks.
-
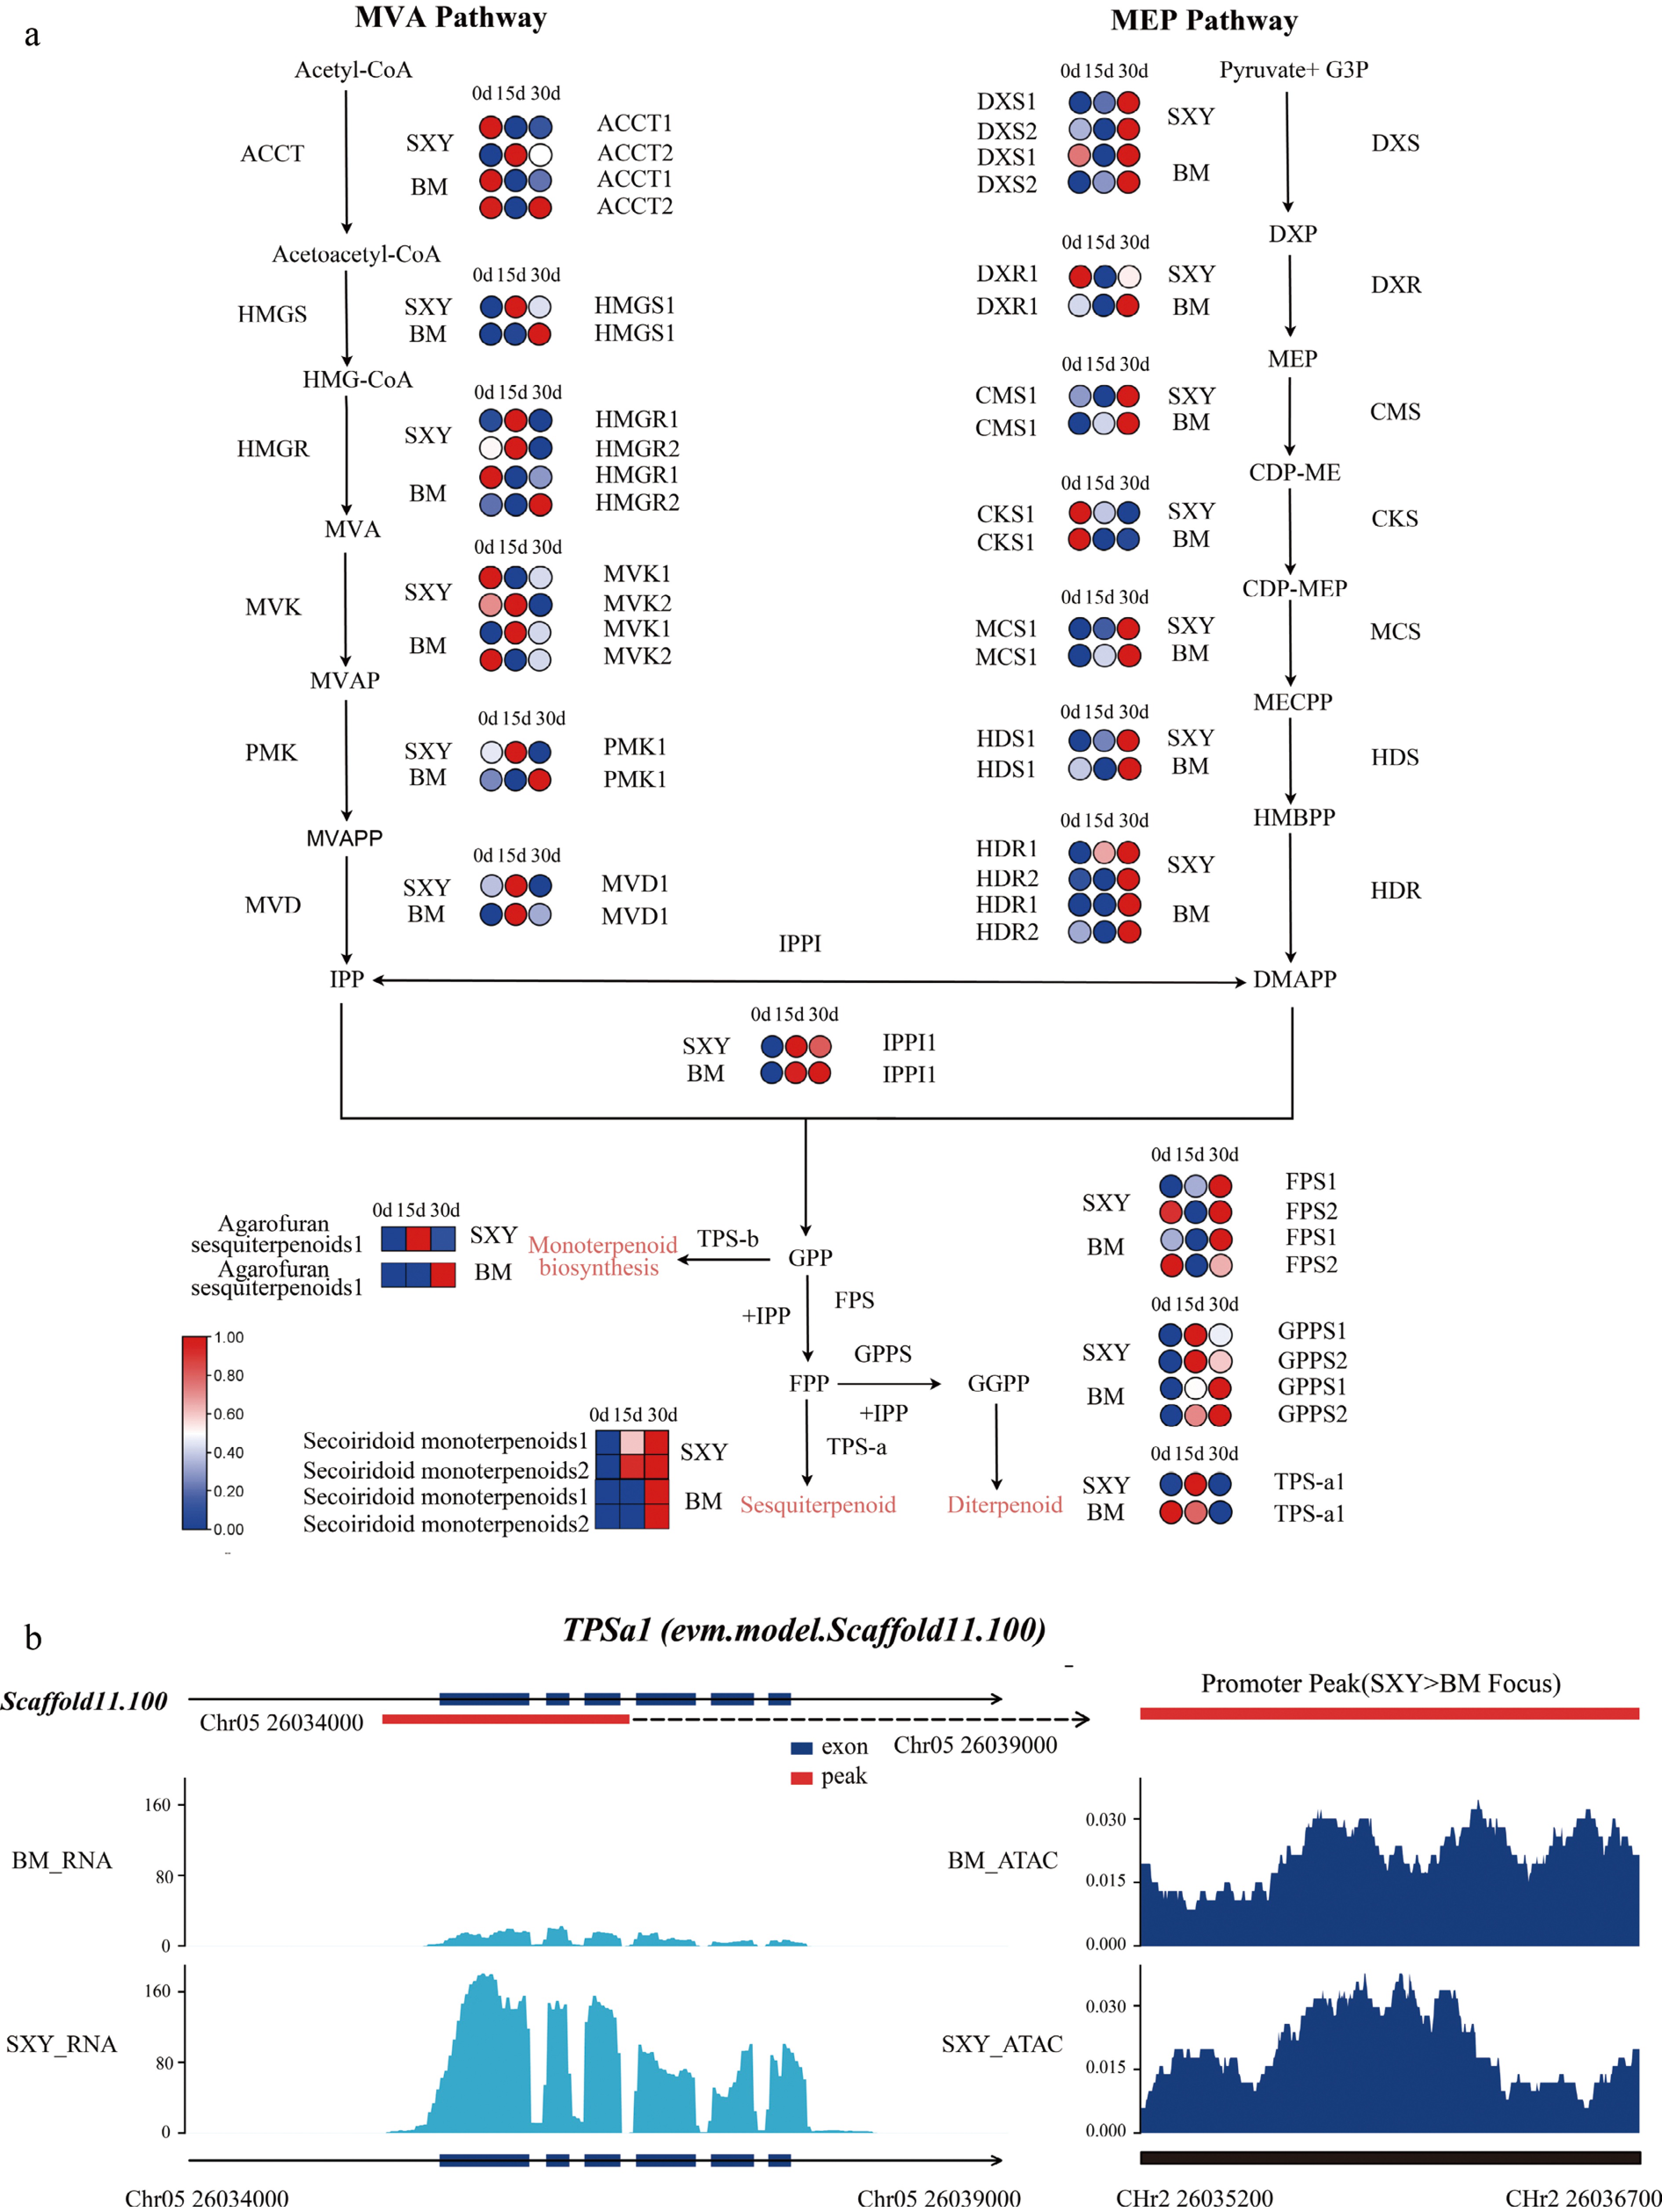
Figure 5.
Multi-omics evidence for the terpenoid biosynthetic pathway. (a) Simplified pathway map showing cultivar-biased expression changes at key nodes (e.g., DXS, HMGS, TPSa1). (b) Genome browser view of the TPSa1 locus (corresponding to AsTPS1 in the text; evm.model.Scaffold11.100), showing higher promoter accessibility in SXY alongside stronger expression after injury.
-
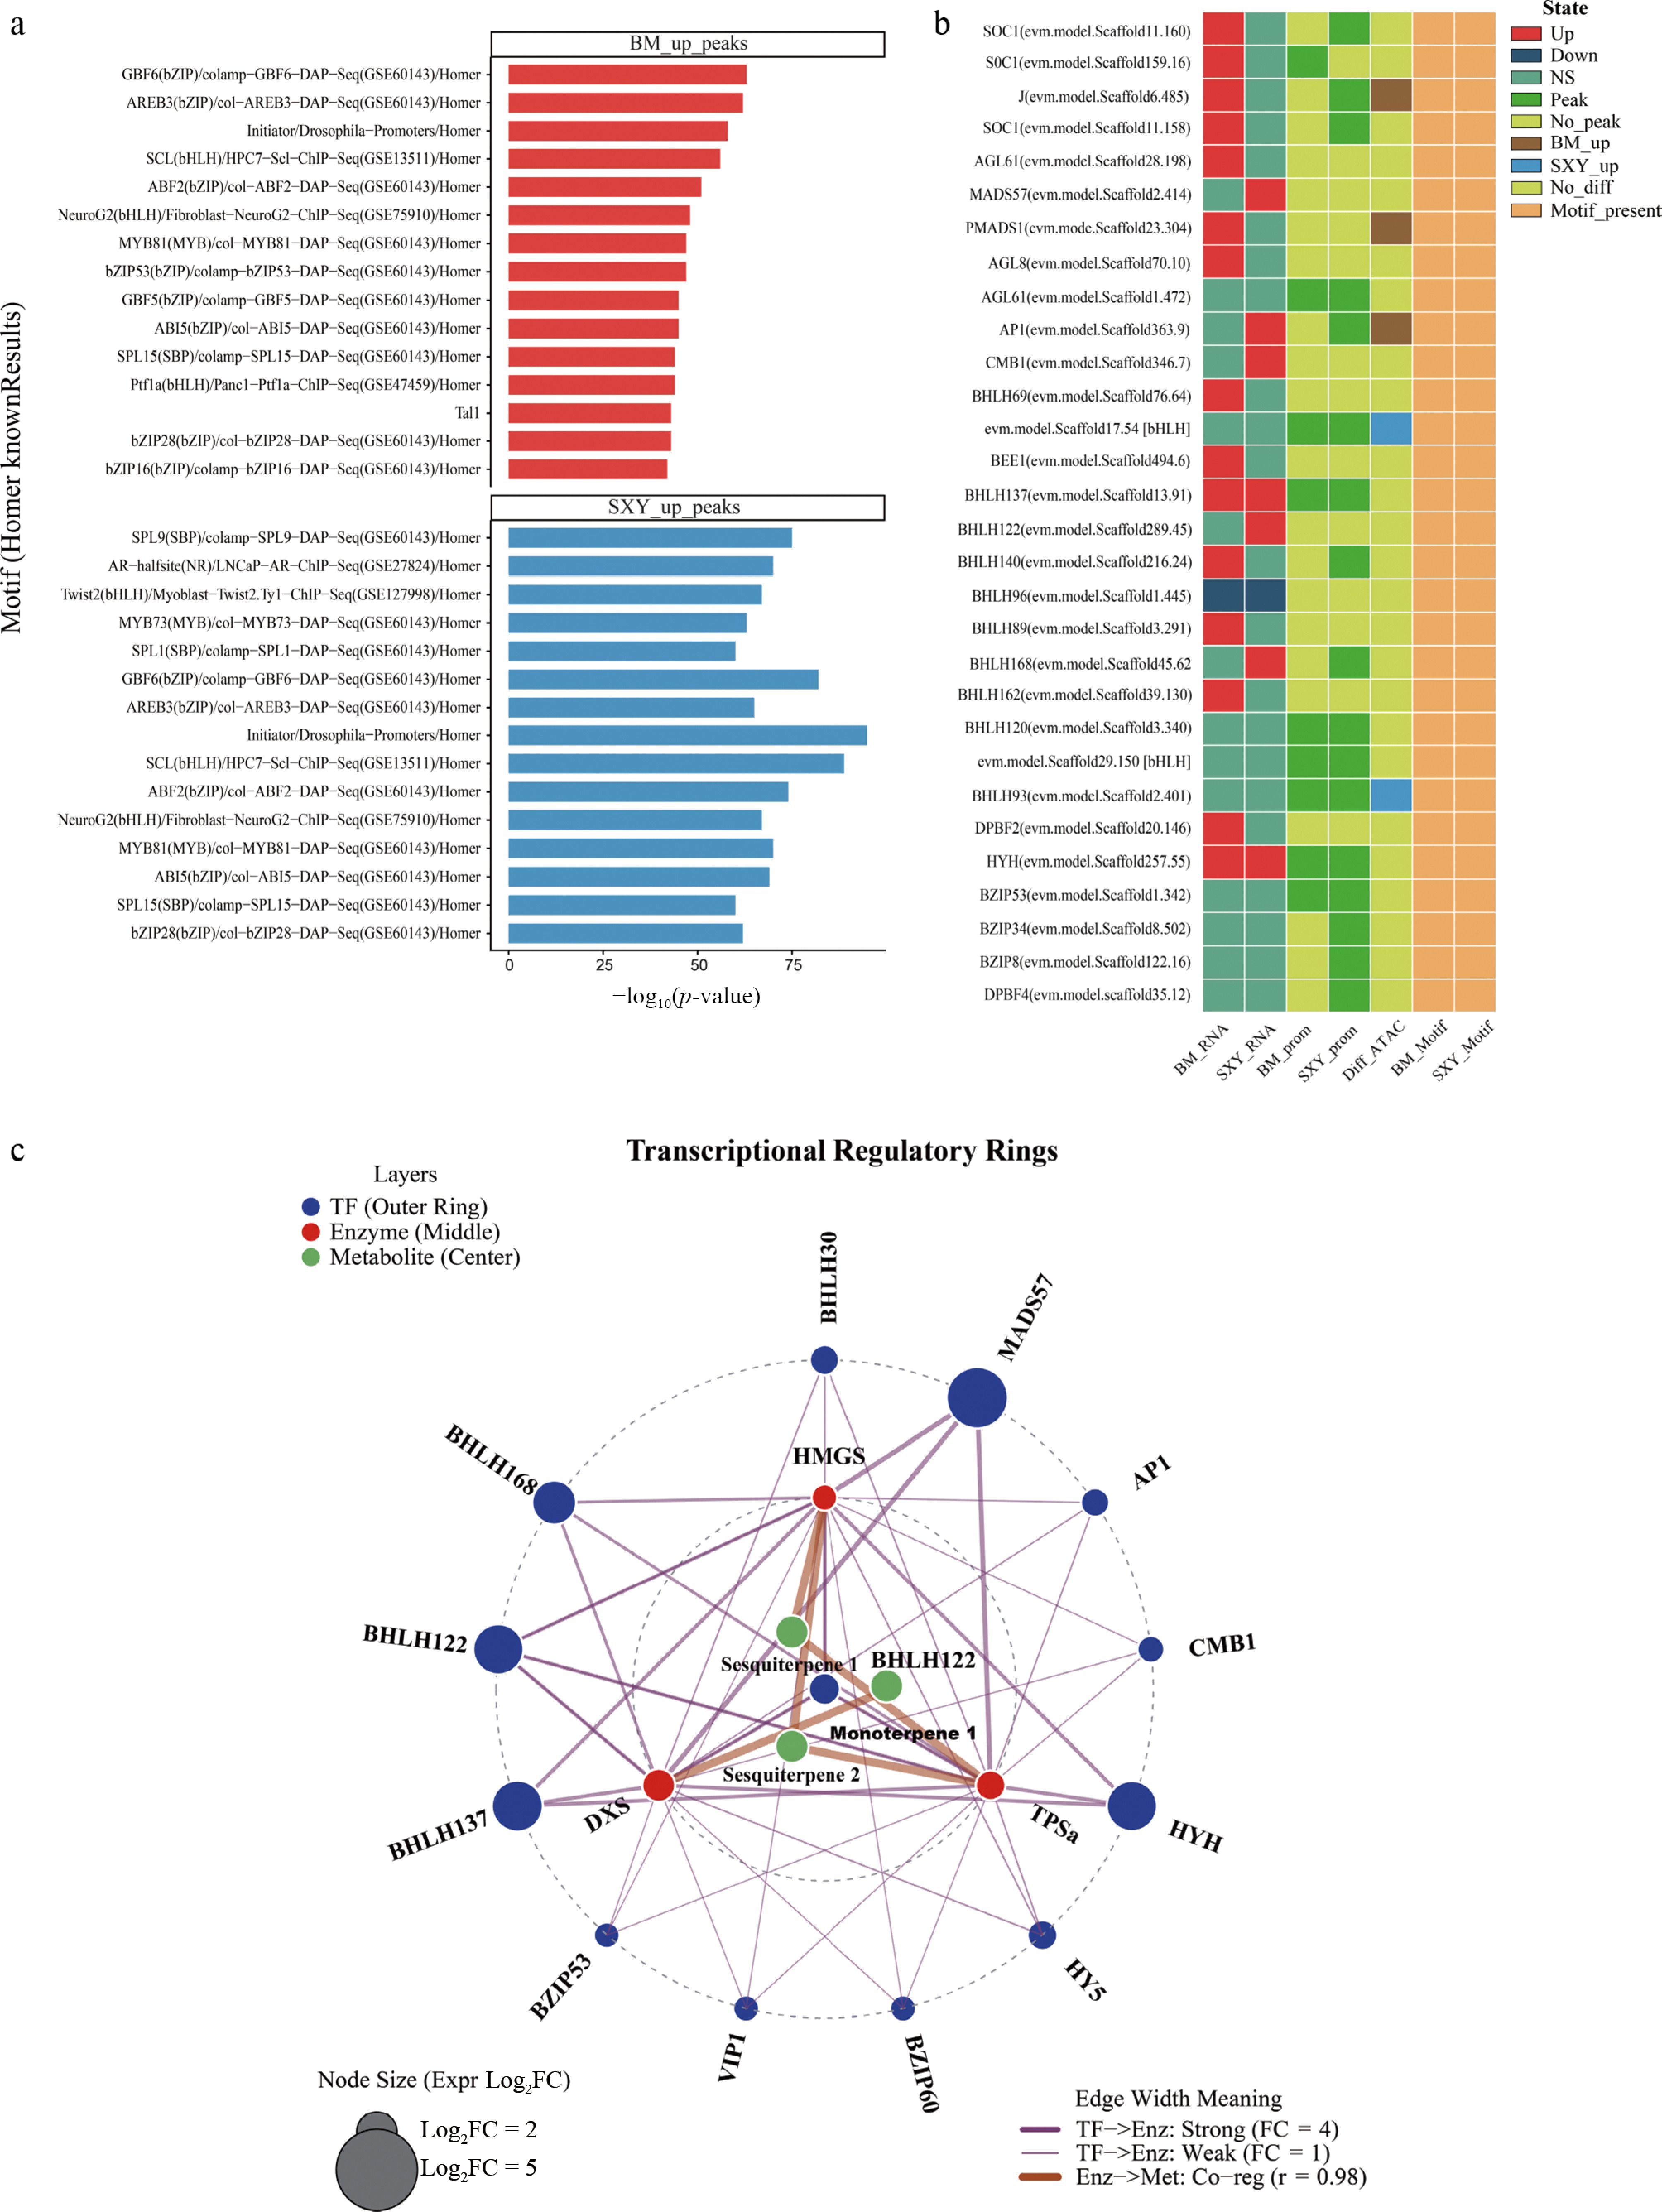
Figure 6.
Candidate transcription factors and a putative regulatory framework. (a) Motif enrichment analysis for SXY-up and BM-up peaks. (b) Integrated evidence matrix for candidate TFs, summarizing differential expression, promoter accessibility, and motif enrichment. (c) Putative regulatory network linking candidate TFs to terpenoid biosynthesis genes.
Figures
(6)
Tables
(0)