-
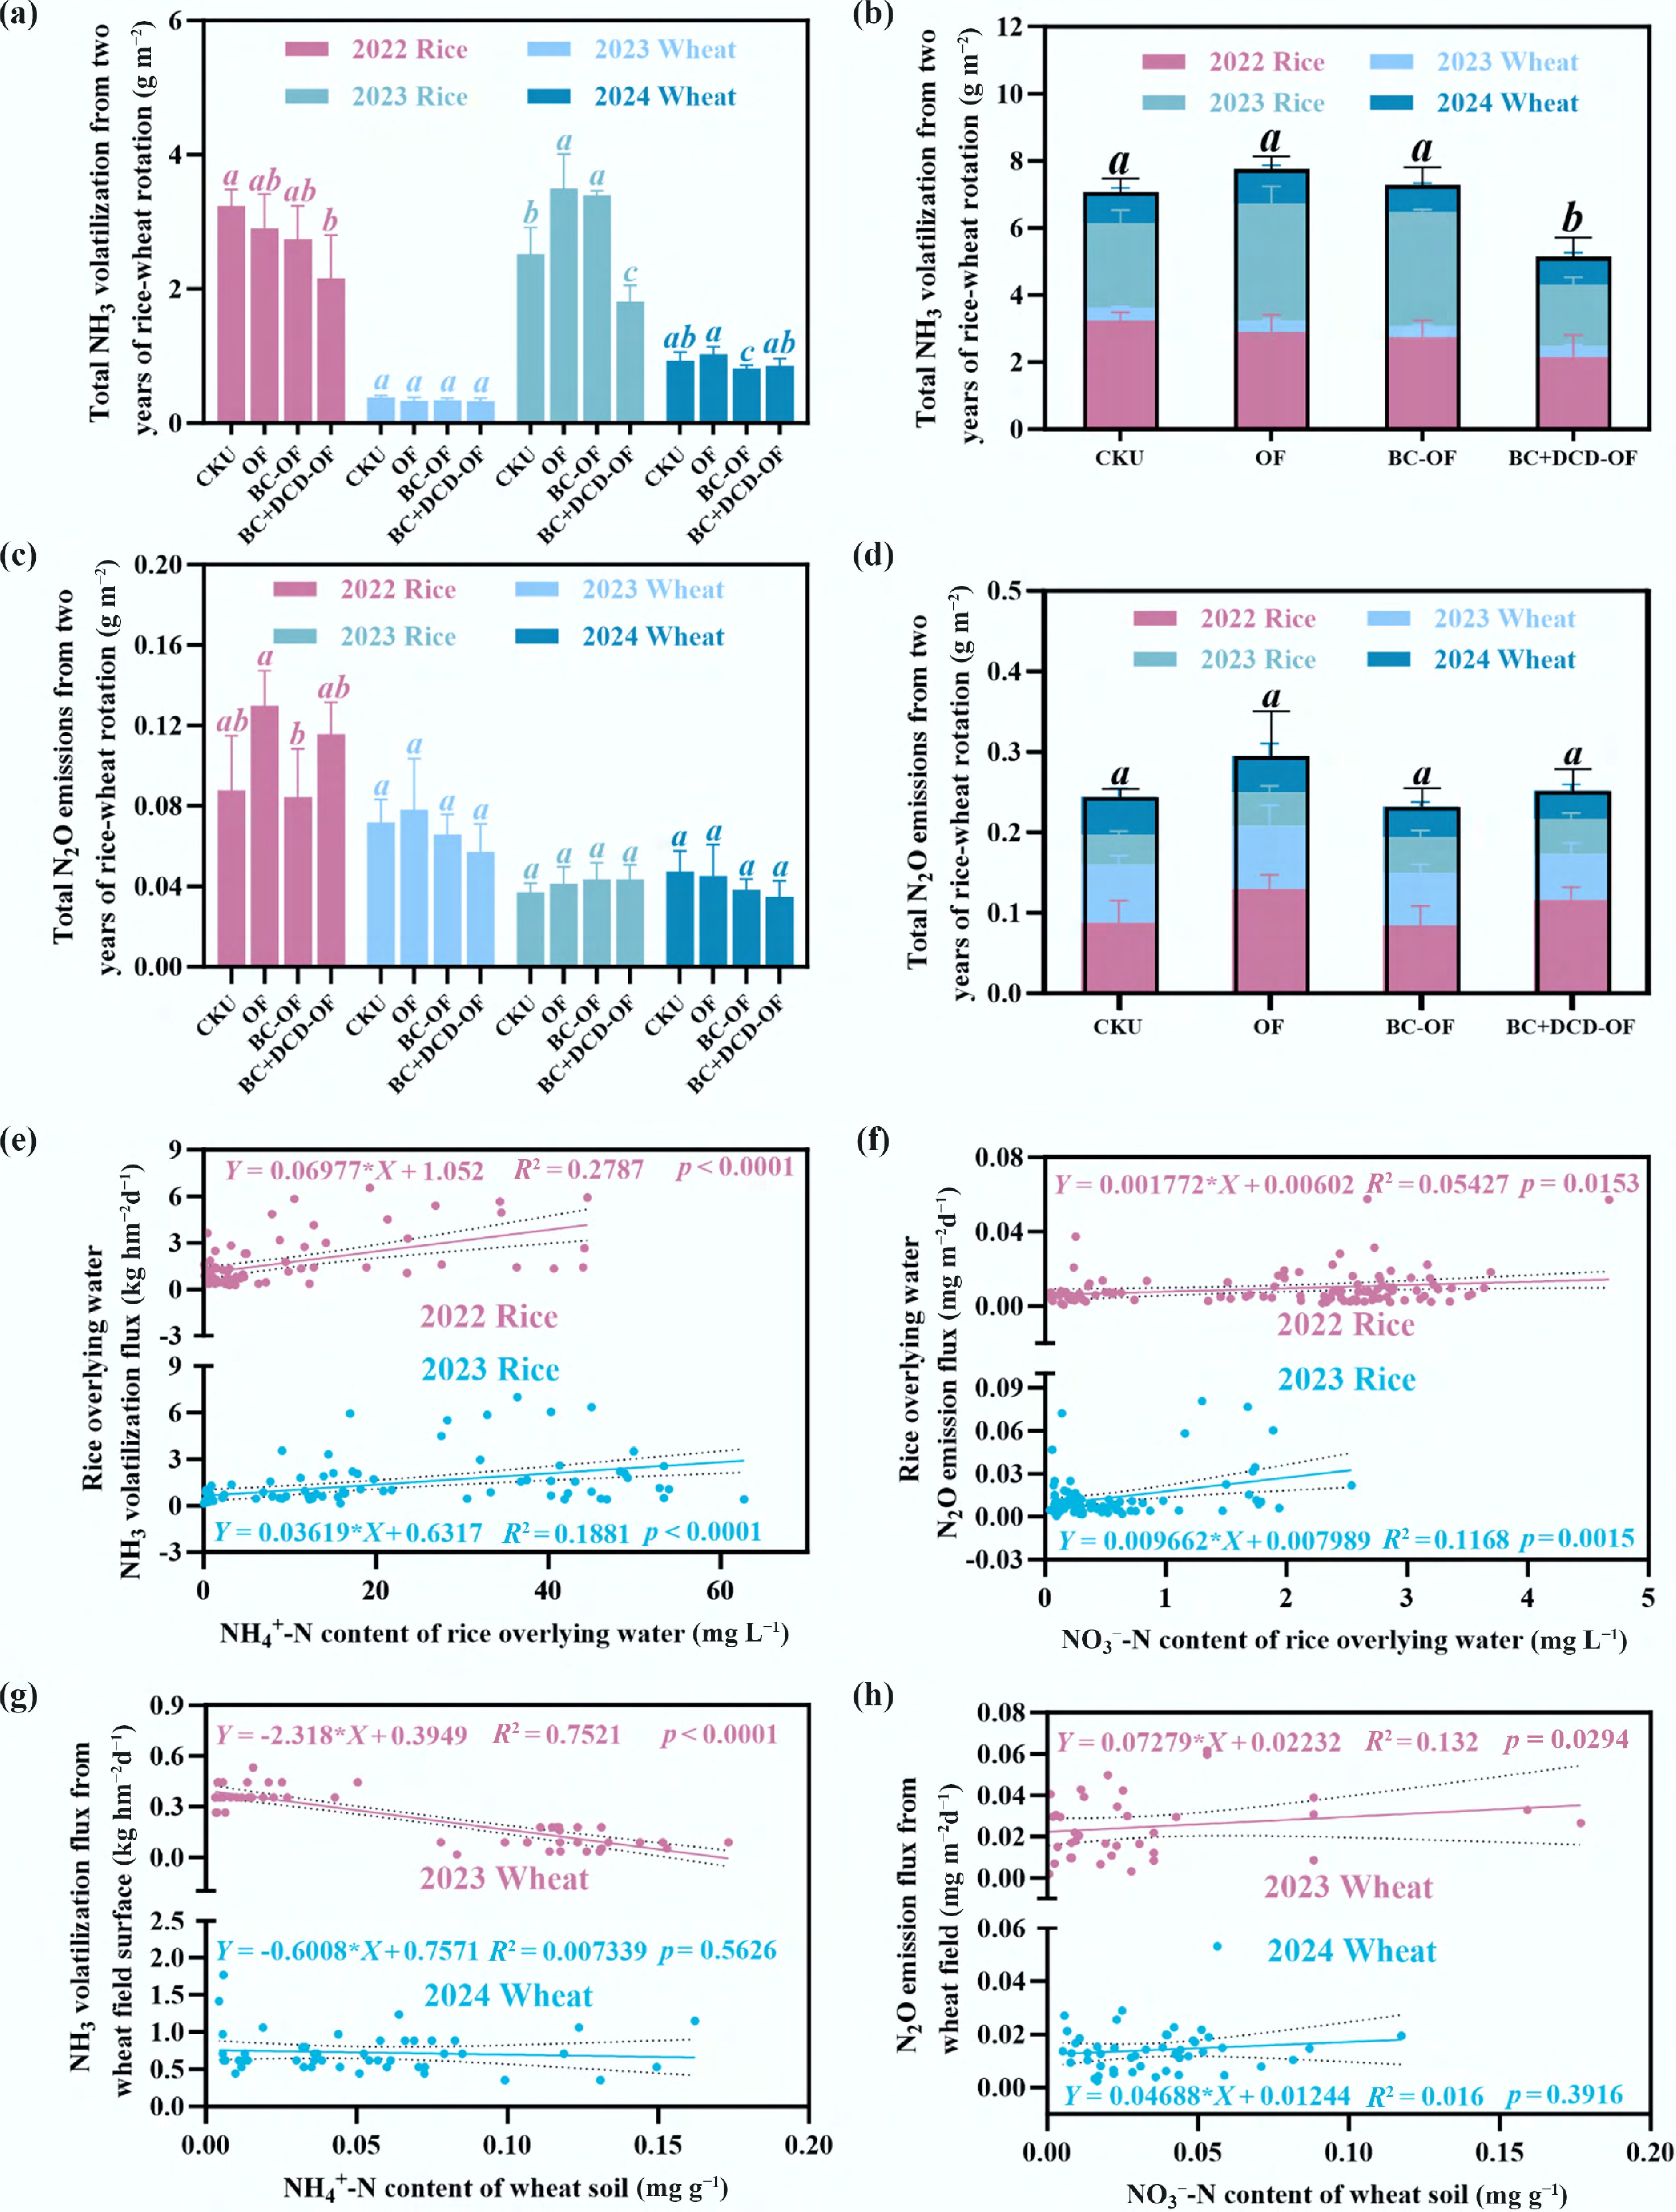
Figure 1.
(a) Total NH3 volatilization during a single growing season; (b) over the entire rice-wheat rotation; (c) total N2O emissions during a single growing season; and (d) over the entire rotation under different fertilization treatments from 2022 to 2024. Panels (e) and (f) show the relationships between NH3 volatilization, N2O emission fluxes, and NH4+-N and NO3−-N concentrations in the overlying water during the rice season, while panels (g) and (h) present the relationships between NH4+-N and NO3−-N concentrations in the soil during the wheat season. Data are presented as mean ± SD (n = 3). Different lowercase letters above the bars indicate significant differences among treatments at p < 0.05. CKU, urea only; OF, conventional straw-chicken manure organic fertilizer; BC-OF, organic fertilizer amended with 15% biochar; BC + DCD-OF, organic fertilizer amended with 15% biochar and 0.5% dicyandiamide. BF, SF1, and SF2 represent the basal, first, and second supplementary N fertilization periods, respectively. All abbreviations presented in Figure 1 are adopted uniformly in the subsequent figures.
-
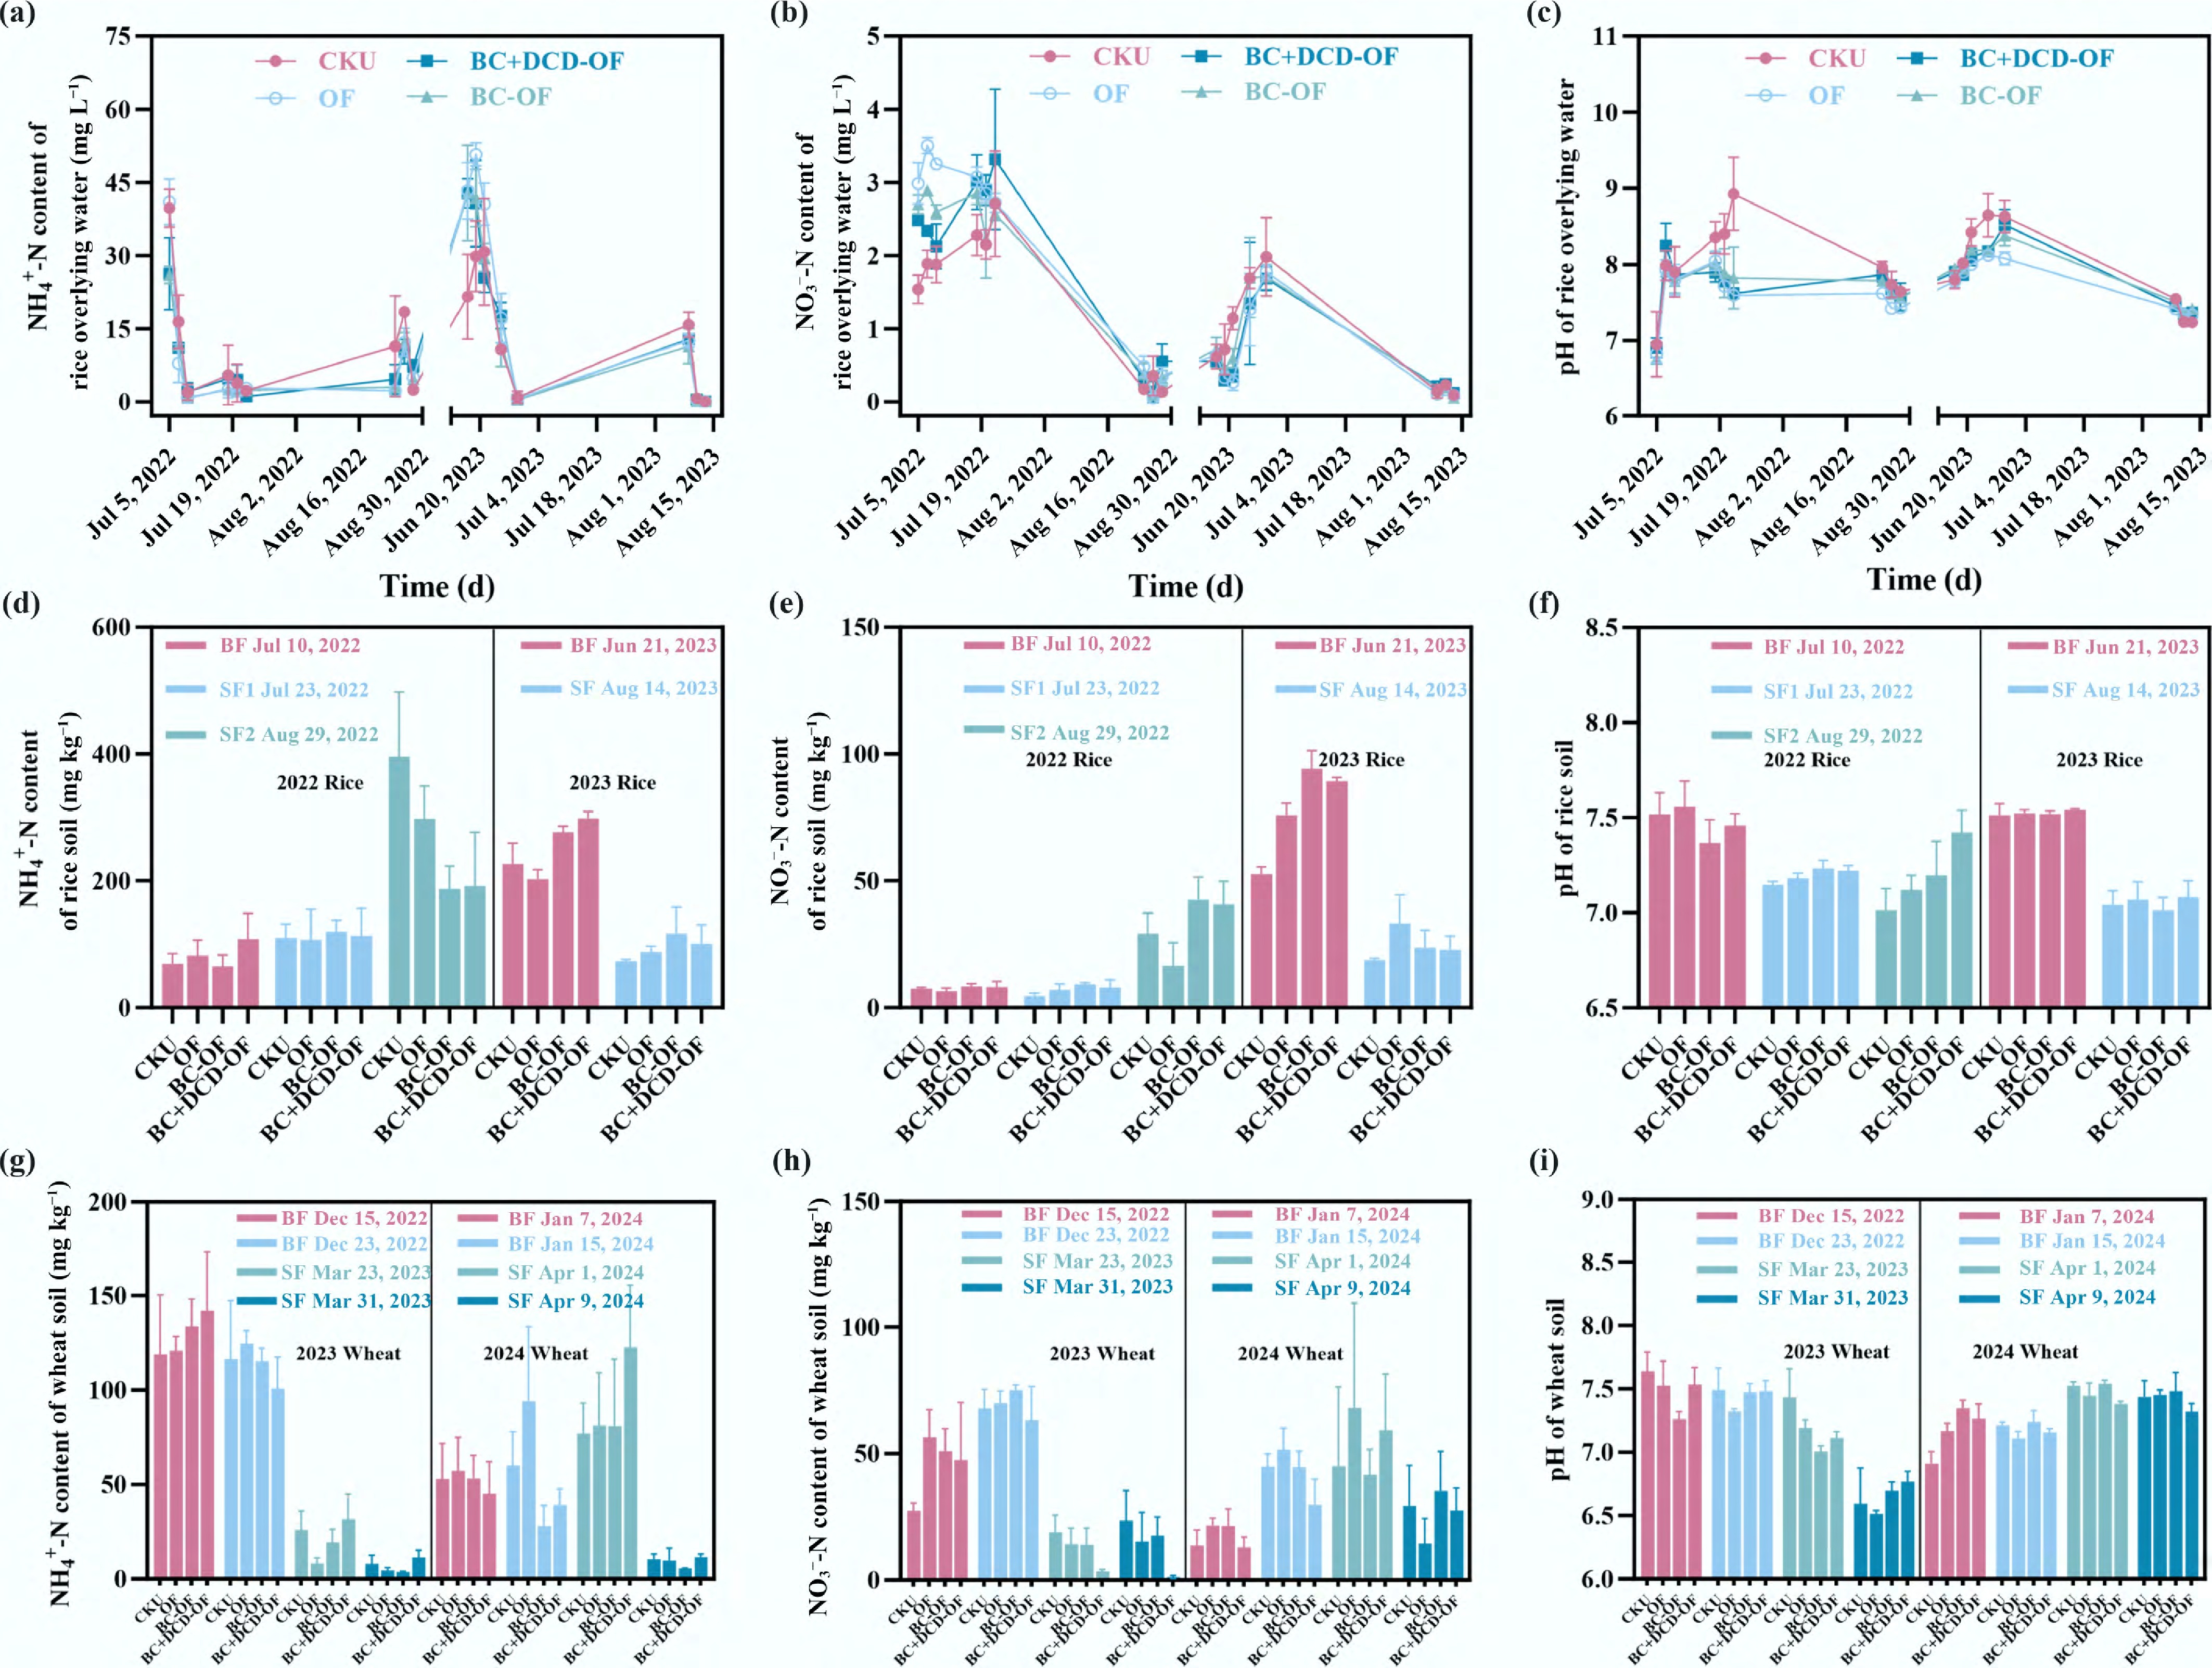
Figure 2.
Chemical characteristics of the overlying water and soil under different fertilization treatments during the rice-wheat rotation. Panels (a)–(c) show NH4+-N concentration, NO3−-N concentration, and pH of the overlying water during the rice seasons. Panels (d)–(f) present soil NH4+-N, NO3−-N, and pH in the rice-growing period, while panels (g)–(i) show soil NH4+-N, NO3−-N, and pH during the wheat-growing period. Data are presented as mean ± SD (n = 3). Different lowercase letters above the bars indicate significant differences among treatments at p < 0.05.
-
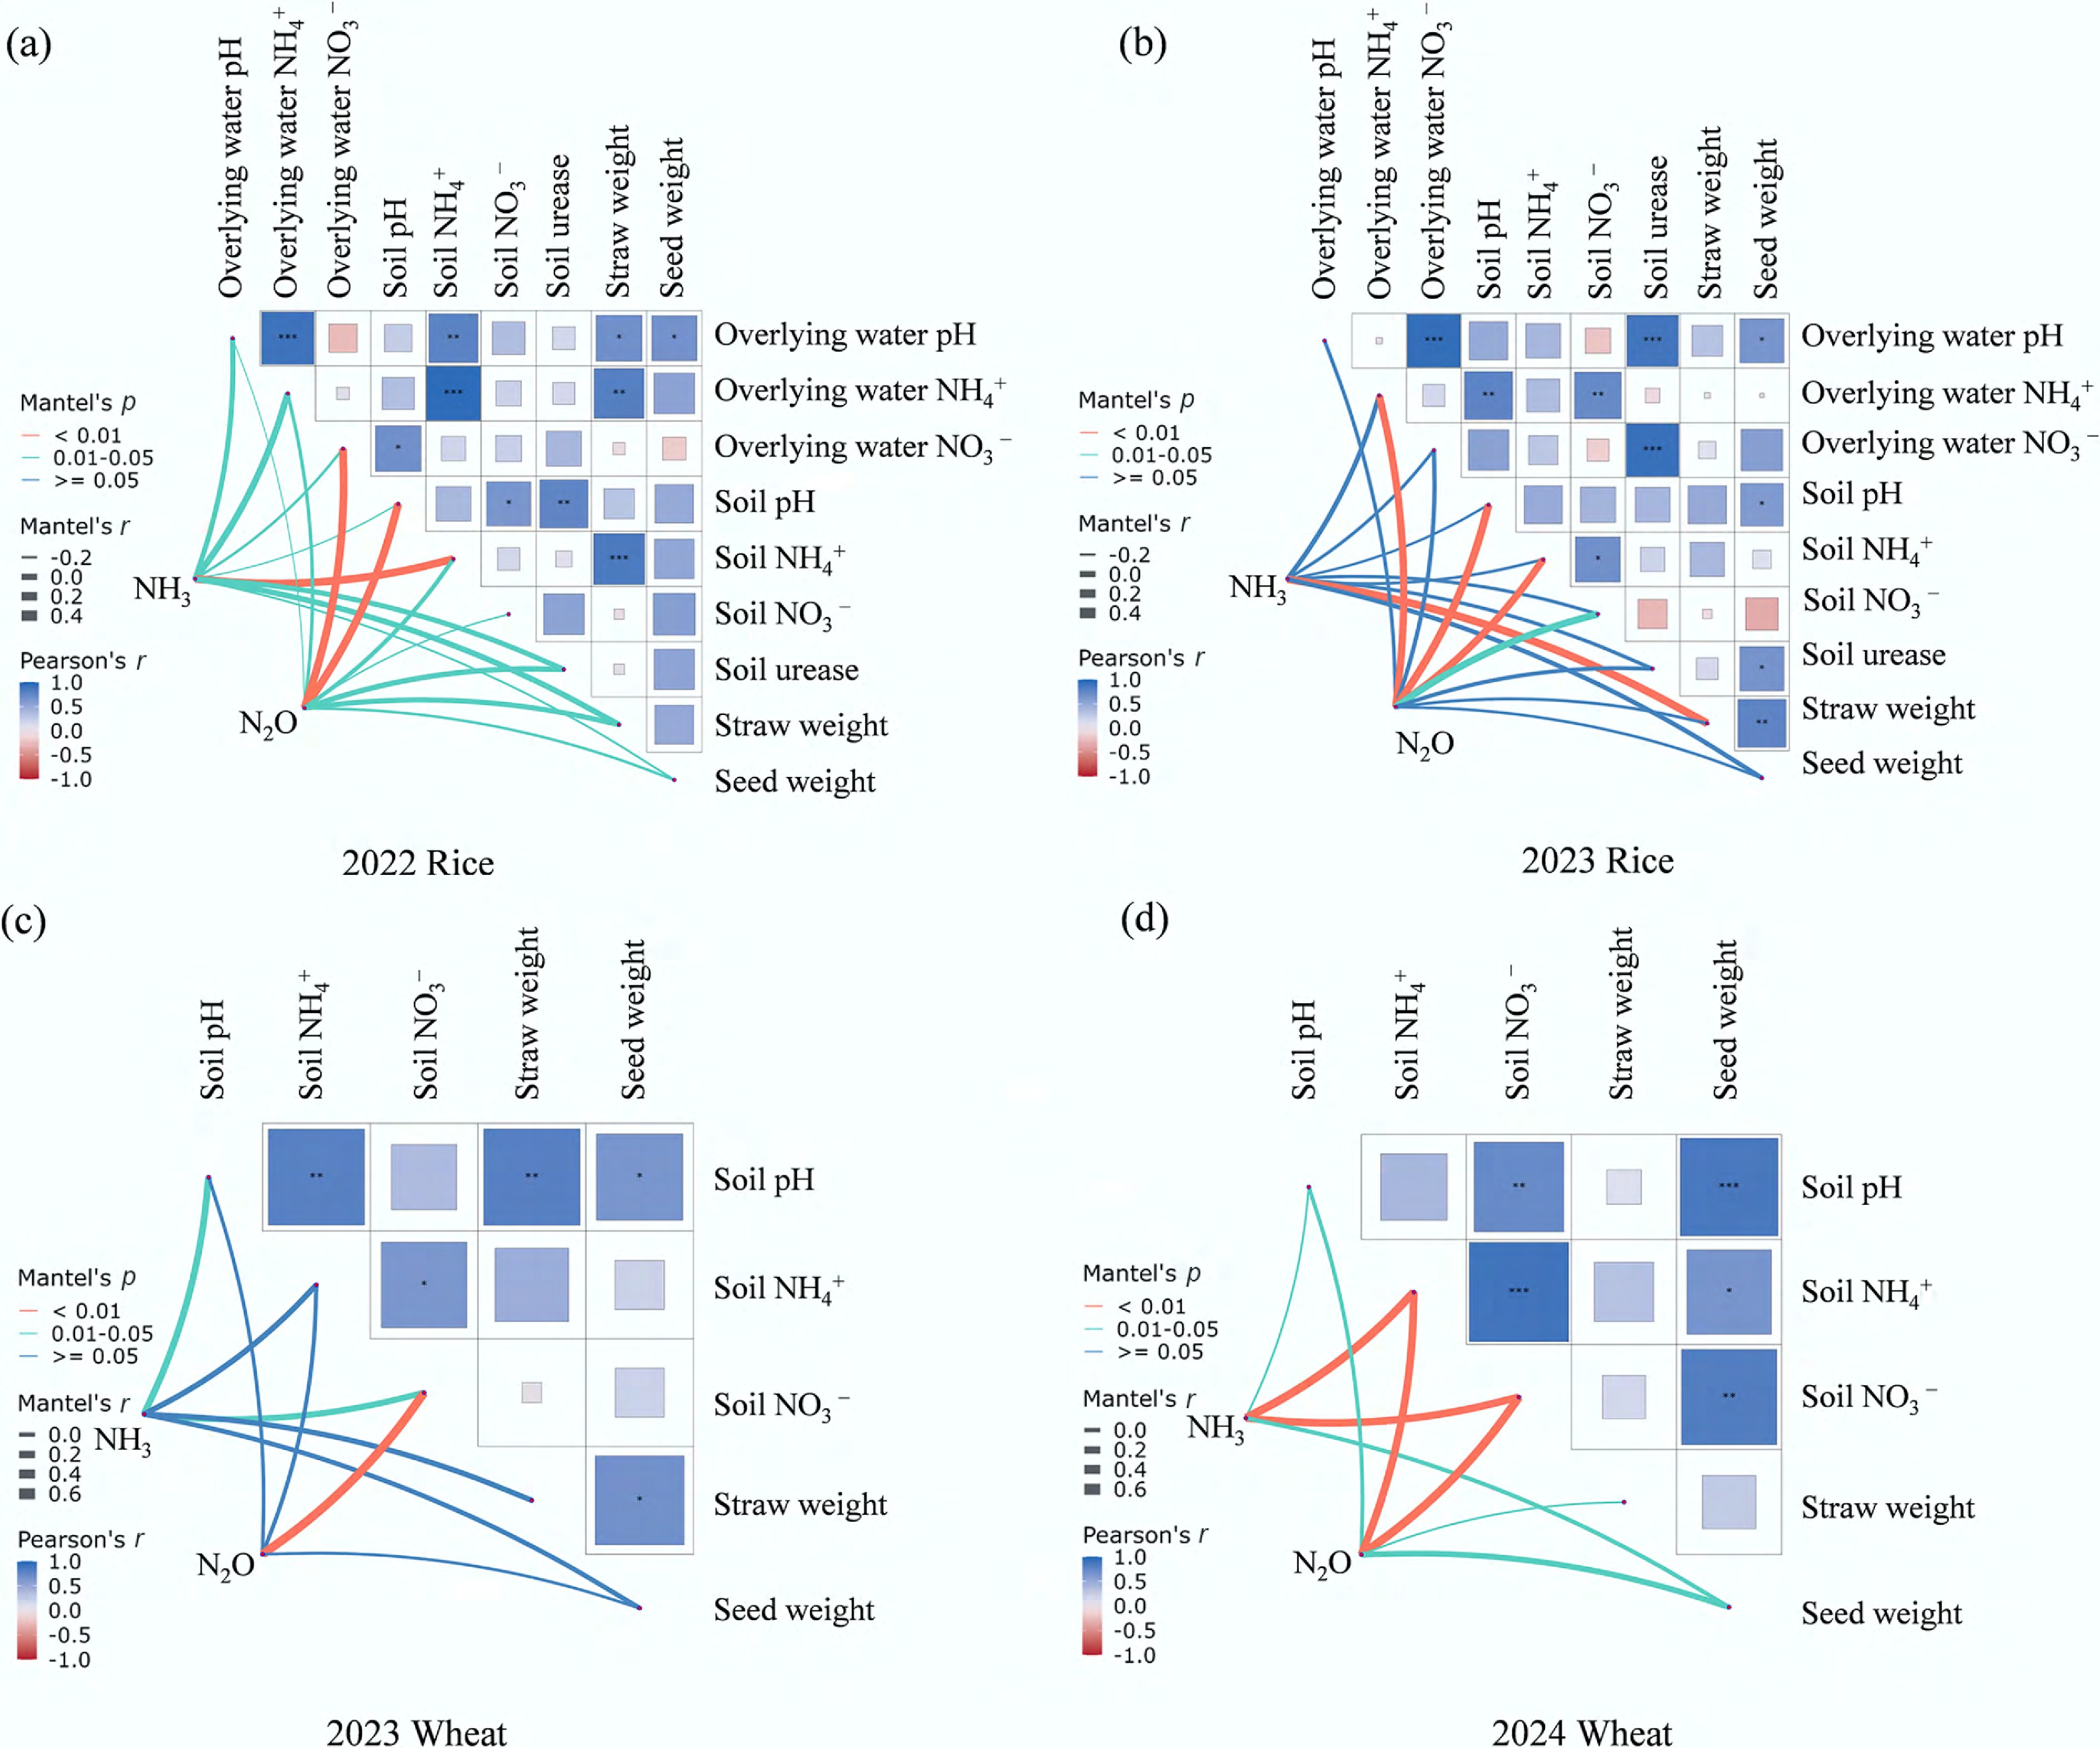
Figure 3.
Network heatmap showing NH3 and N2O emissions from the rice-wheat rotation (2022–2024) and their correlations with overlying water and soil chemical indicators. Color intensity indicates the strength and direction of correlations.
-
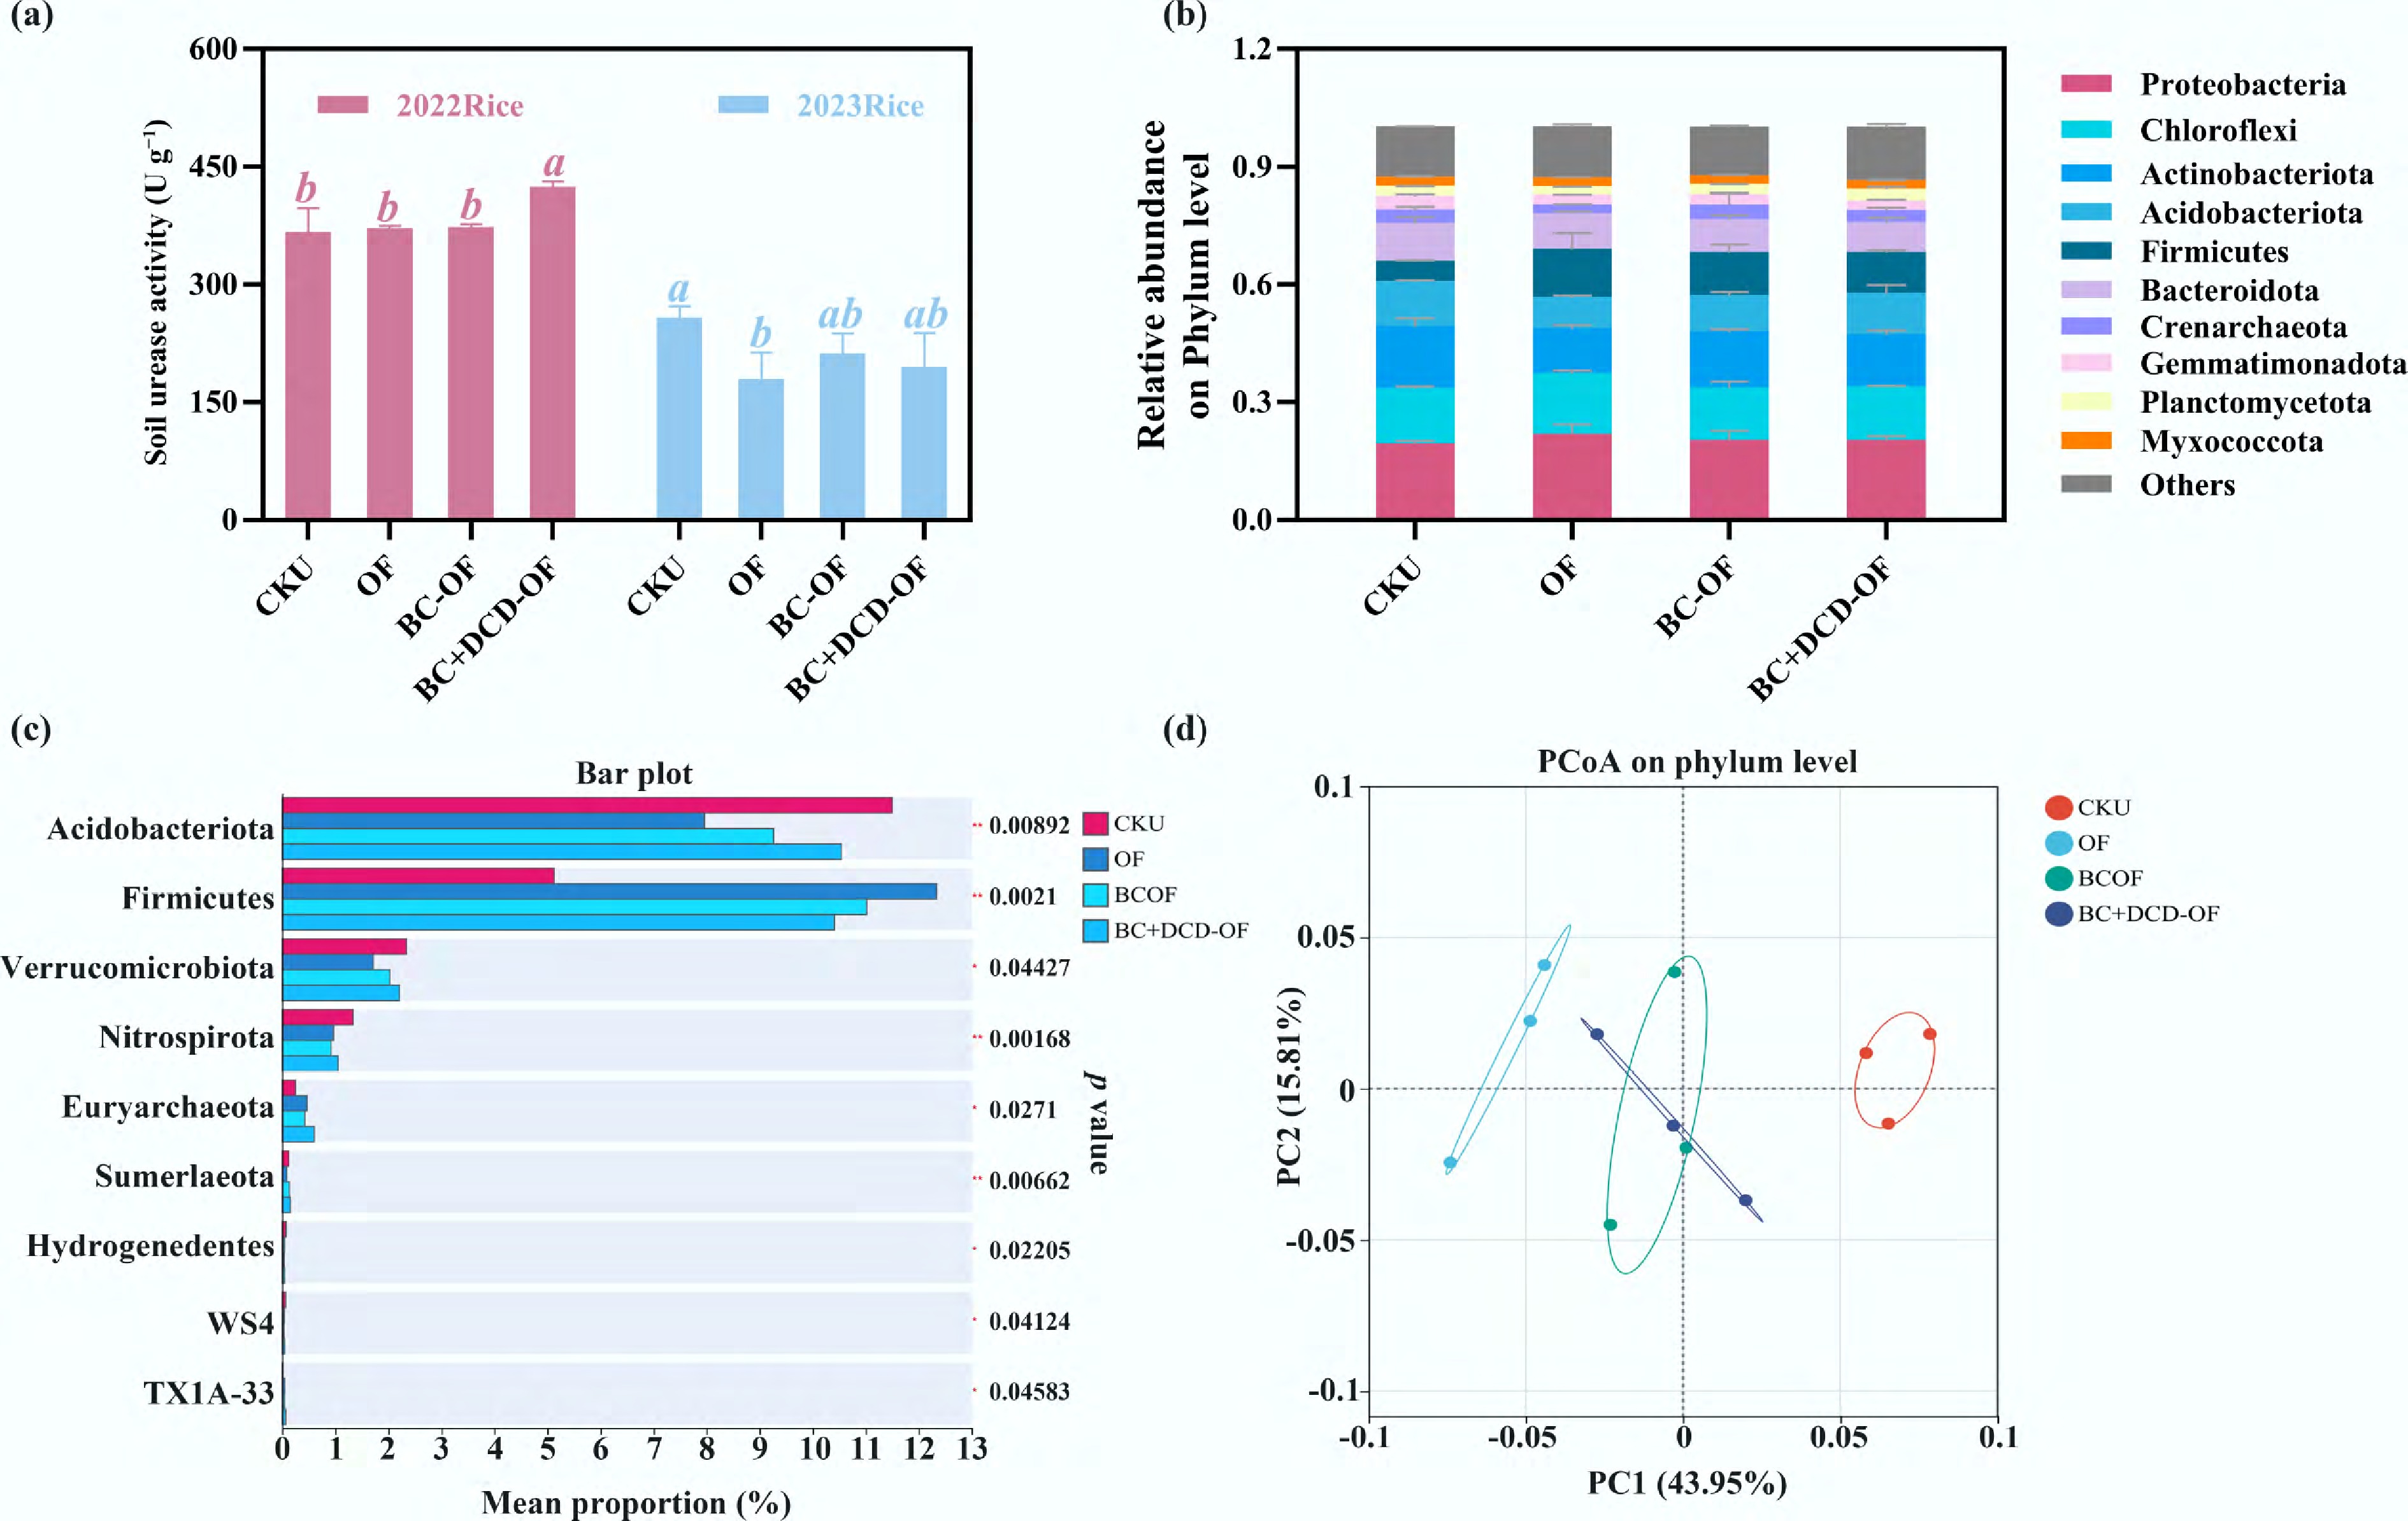
Figure 4.
(a) Soil urease activity during the rice-growing periods in 2022 and 2023. (b) Relative abundance of dominant bacterial phyla. (c) Significance testing of intergroup differences based on community composition. (d) Principal coordinates analysis (PCoA) of soil bacterial communities under different fertilization treatments. Data are presented as mean ± SD (n = 3). Different lowercase letters above the bars indicate significant differences among treatments at p < 0.05.
-
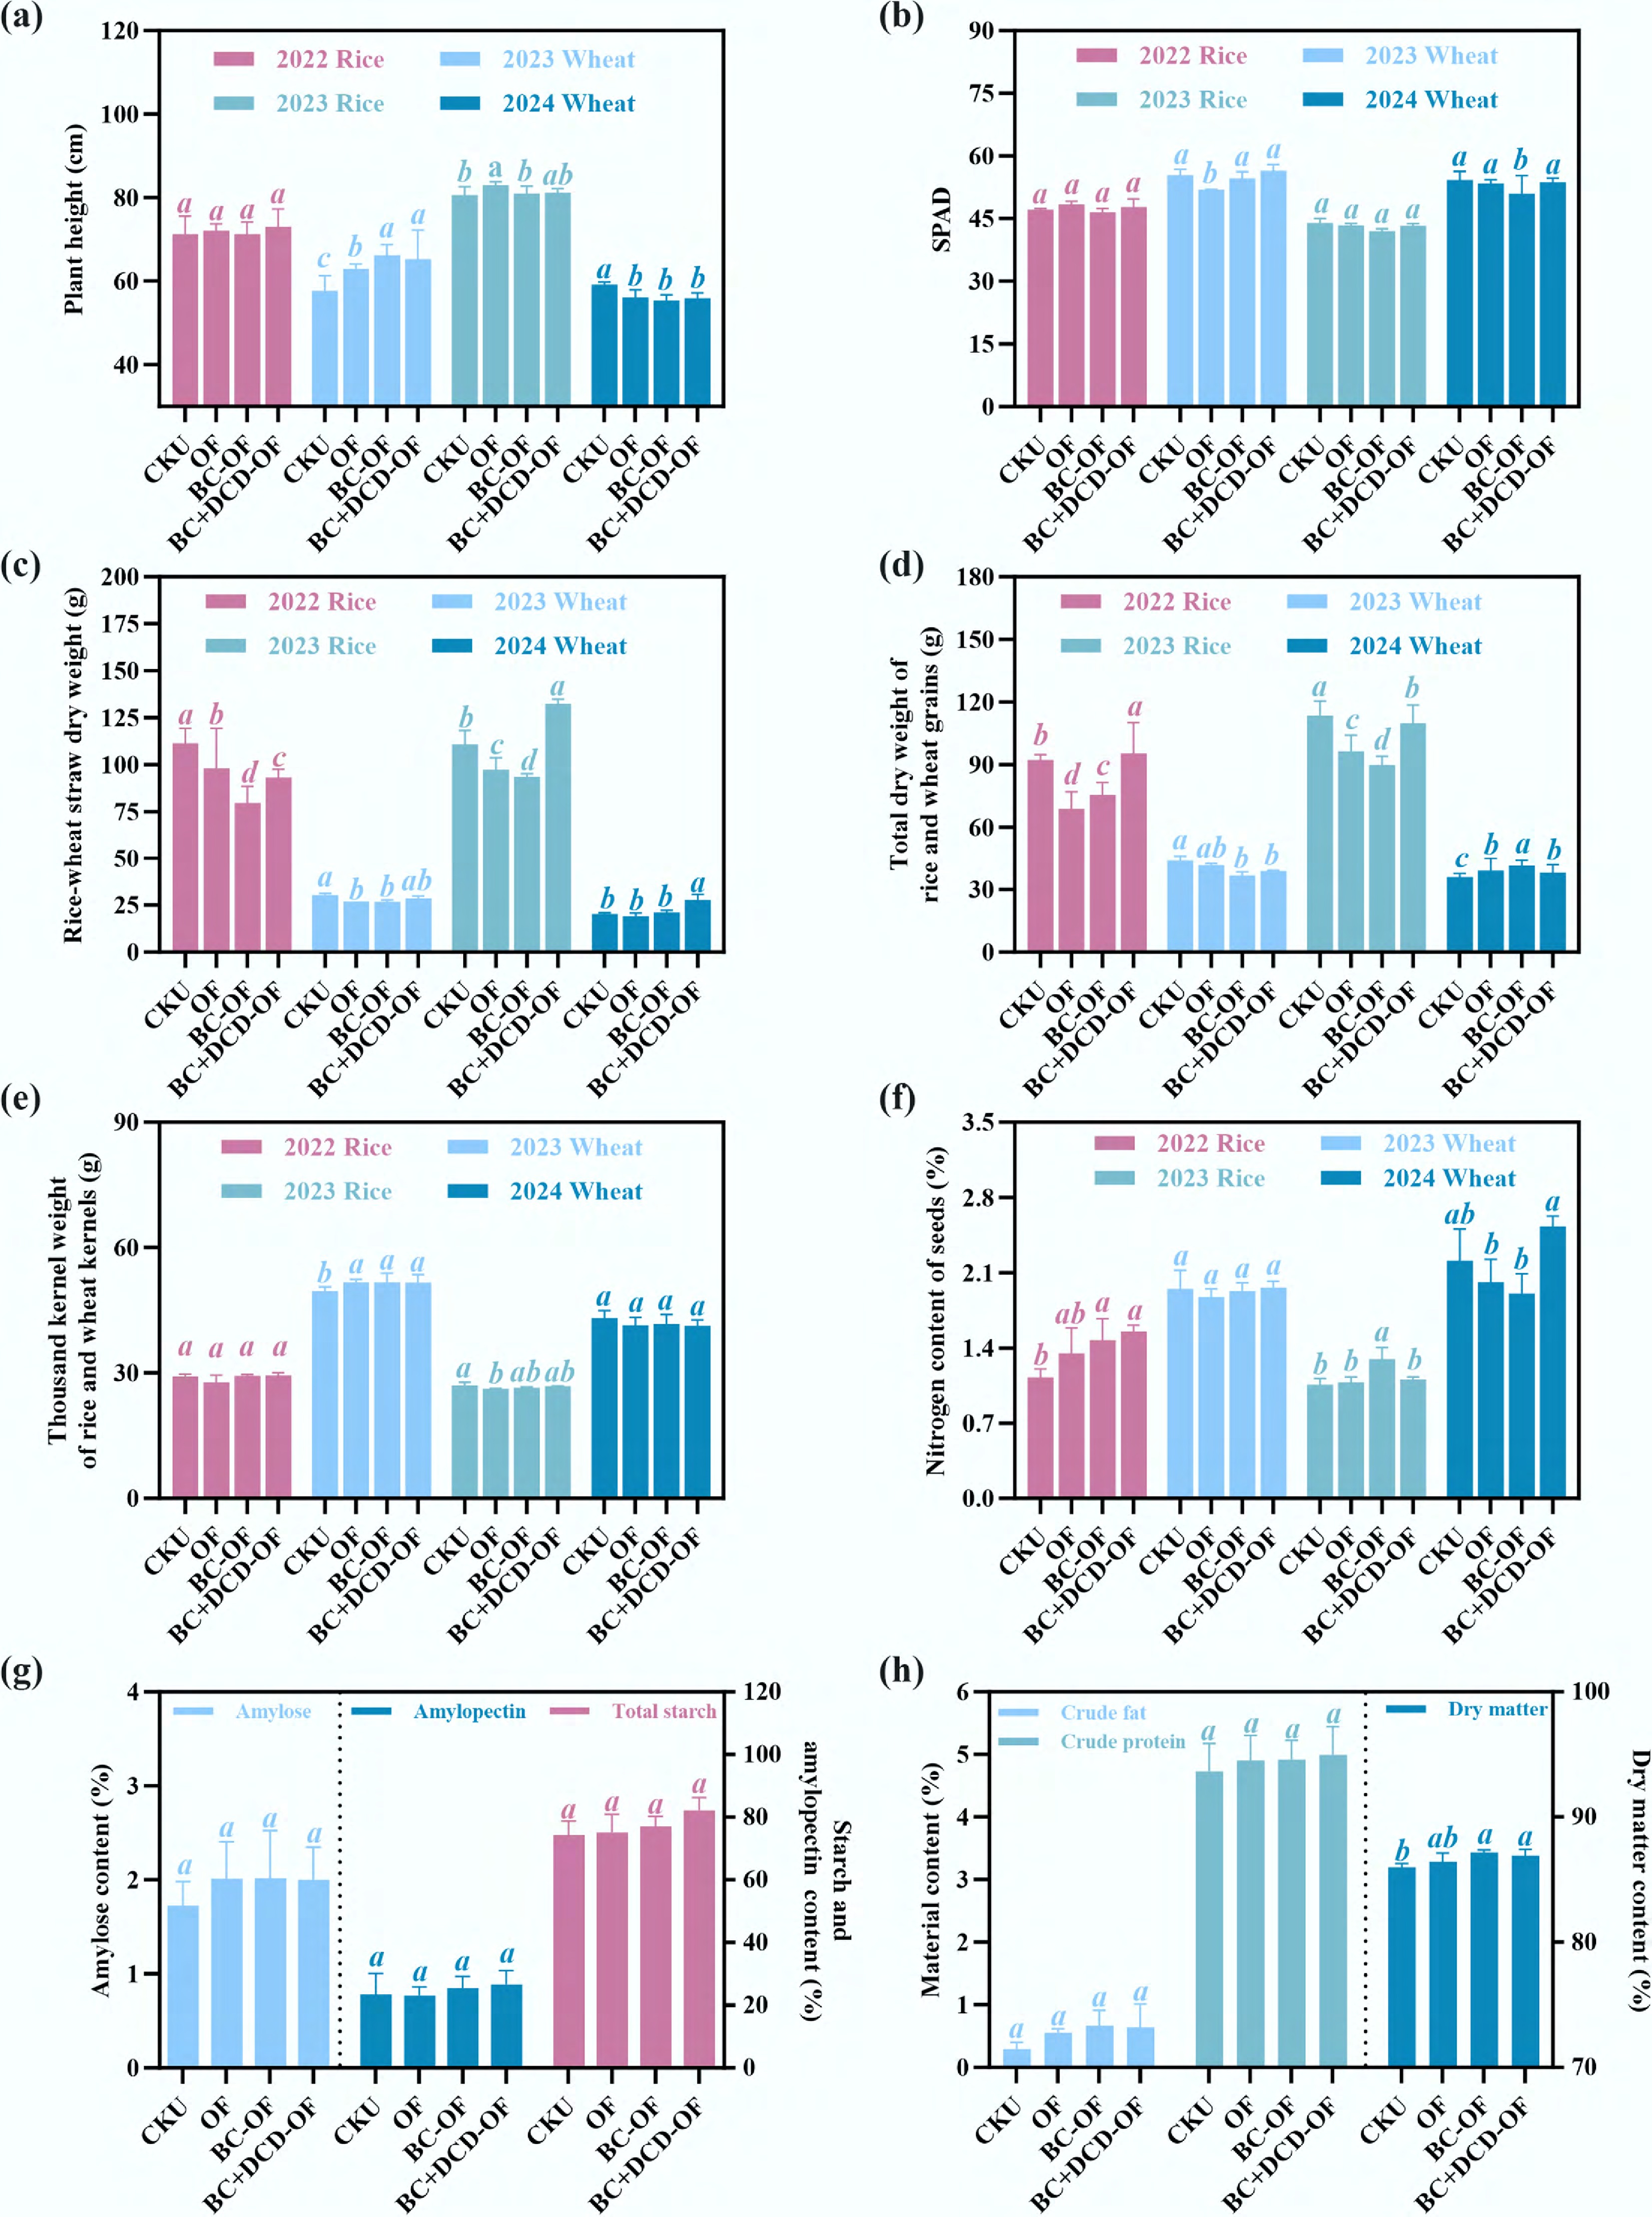
Figure 5.
(a) Plant height, (b) SPAD value of flag leaves, (c) straw dry weight, and (d) grain yield of rice and wheat across two rotations, as well as (e) thousand-kernel weight, (f) grain N content, (g) starch content, and (h) crude fat and protein contents of rice and wheat grains under different fertilization treatments. Data are presented as mean ± SD (n = 3). Different lowercase letters above the bars indicate significant differences among treatments at p < 0.05.
-
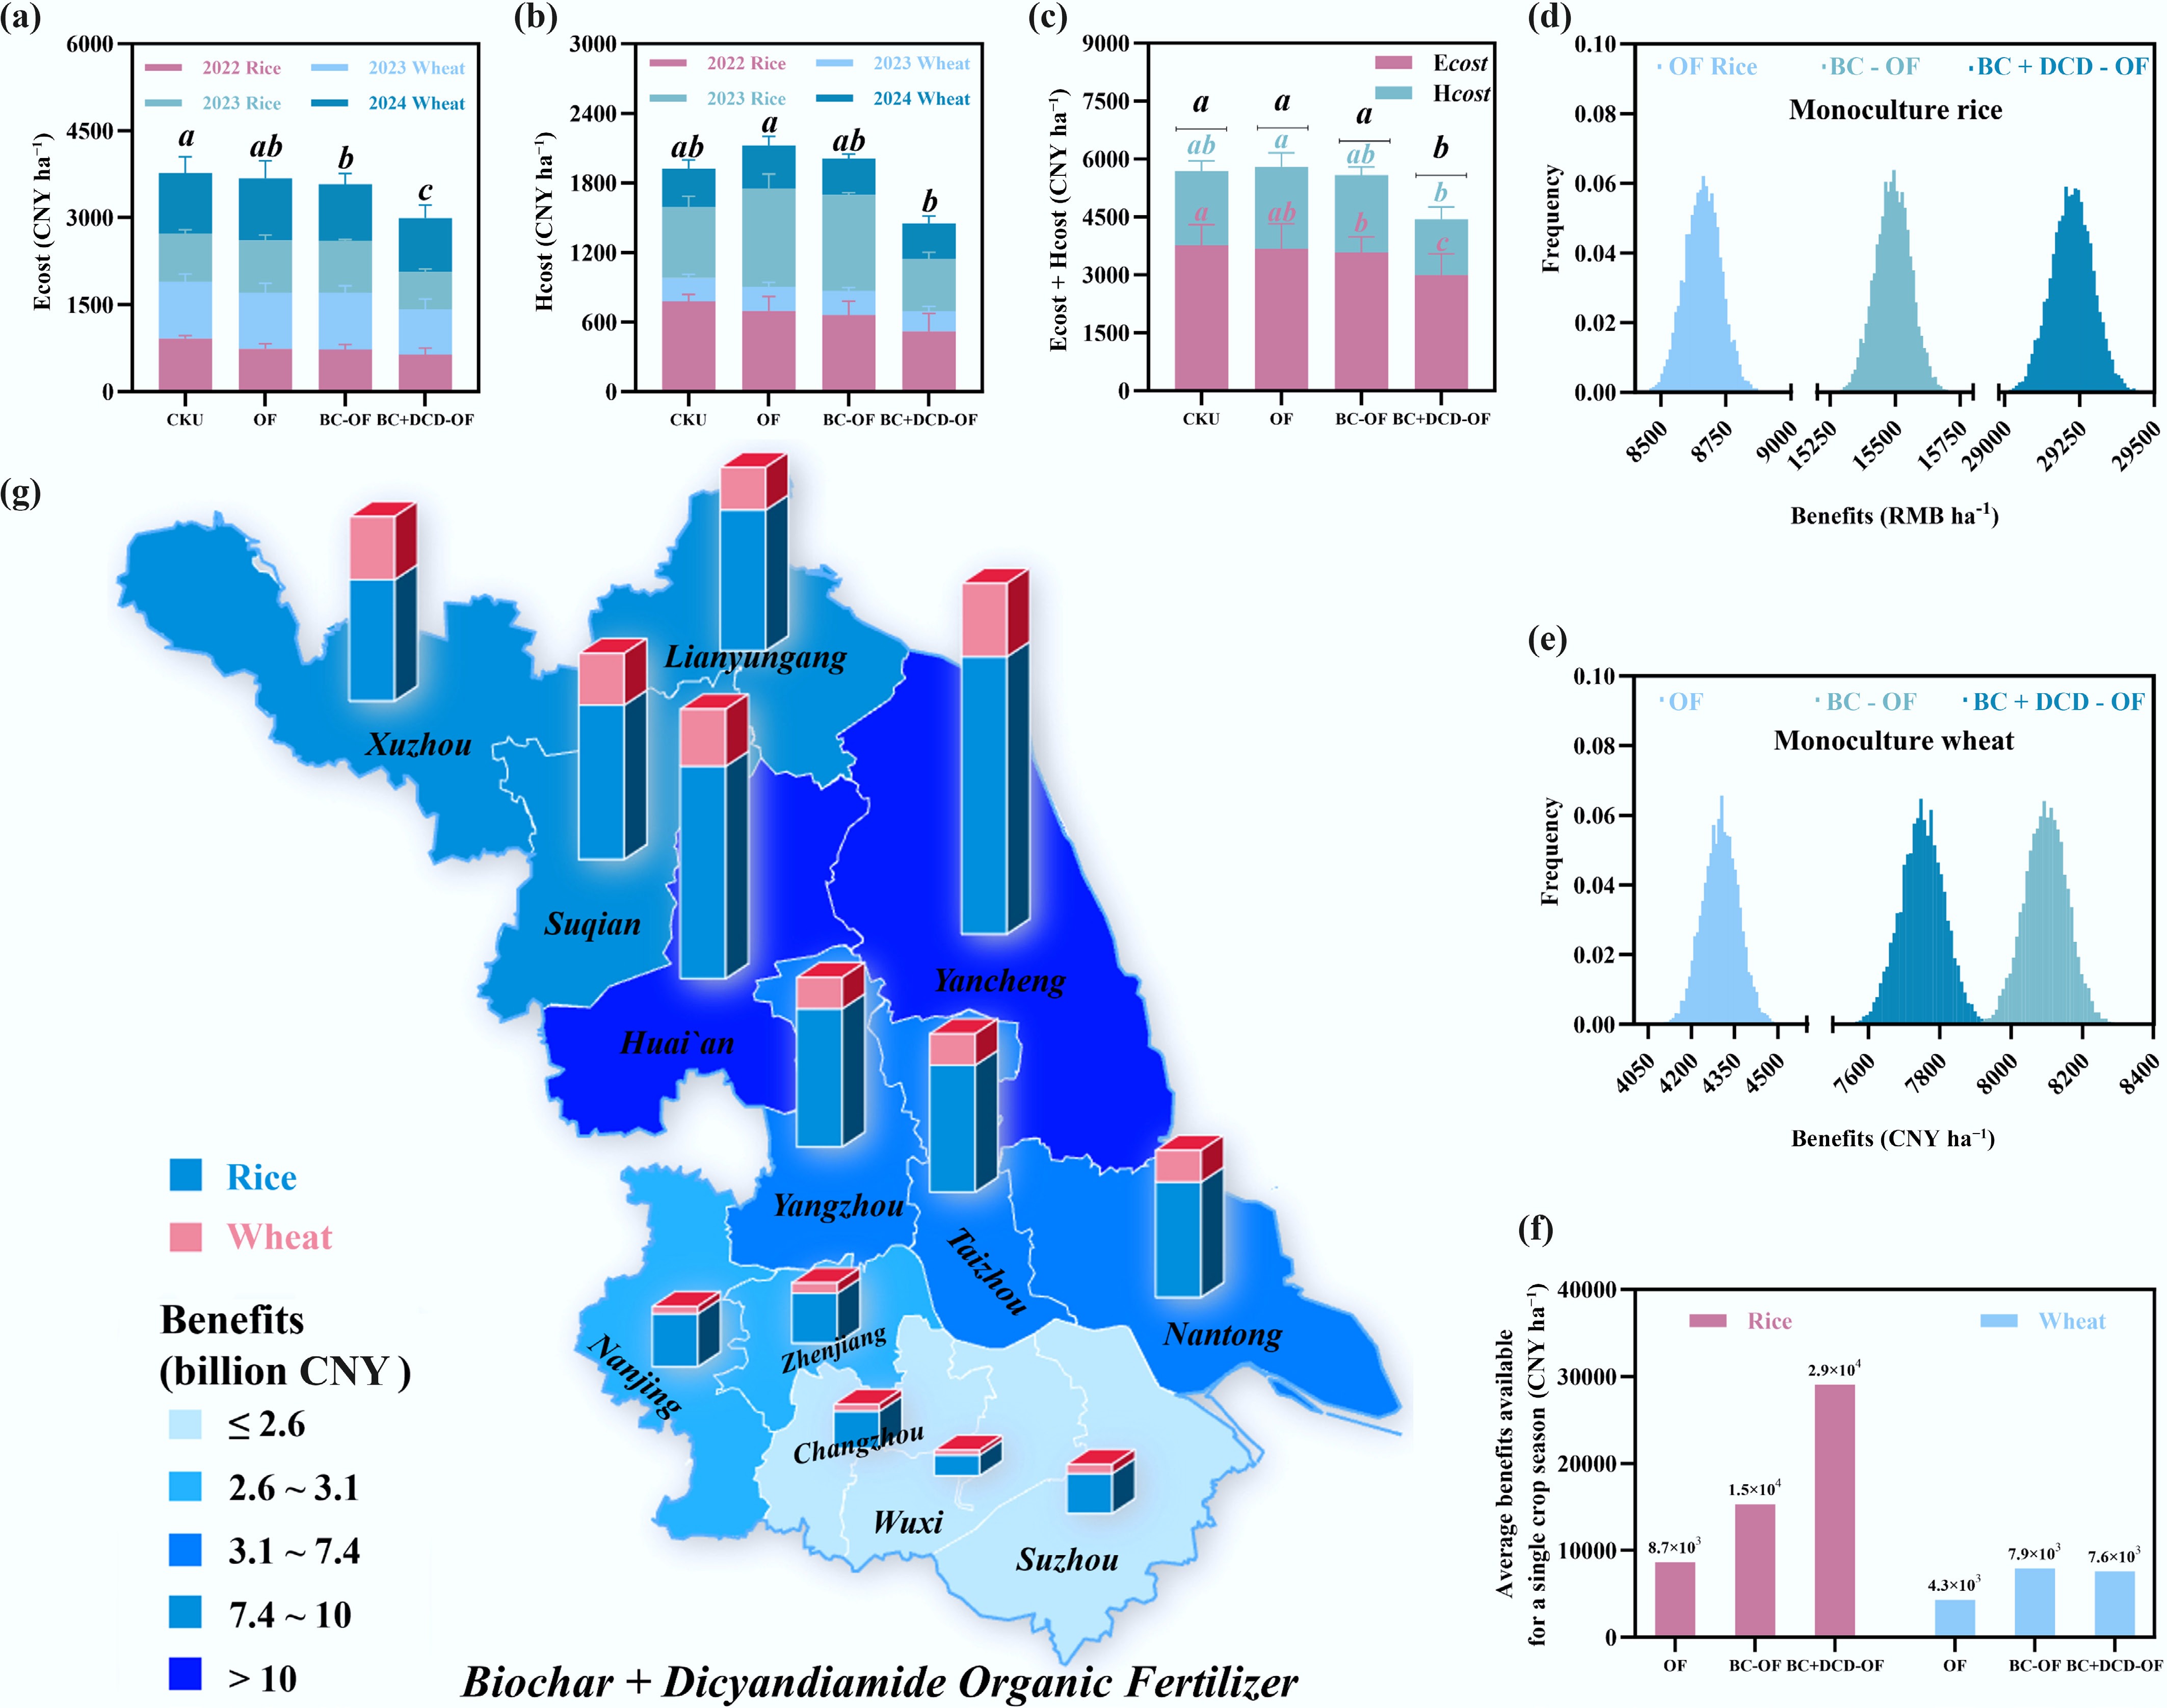
Figure 6.
Economic and ecological cost-benefit analysis under different fertilization treatments. Panels (a)–(c) show the total ecological cost (Ecost), health cost (Hcost), and combined cost (Ecost + Hcost), respectively. Panels (d) and (e) present the simulated potential economic benefits for single rice and wheat seasons, while panel (f) shows the simulated average potential economic benefits for the rice-wheat rotation. Panel (g) illustrates the potential total economic benefits of BC + DCD-amended organic fertilizer for 13 cities in Jiangsu Province, China. Data in panels (d)–(g) were obtained from 10,000 Monte Carlo simulations. Ecost represents the combined environmental hazards associated with nitrogen losses, including atmospheric pollution, water eutrophication, and soil acidification, while Hcost represents health hazards associated with different nitrogen forms generated through fertilizer application. Data are presented as mean ± SD (n = 3). Different lowercase letters above the bars indicate significant differences among treatments at p < 0.05.
Figures
(6)
Tables
(0)