-
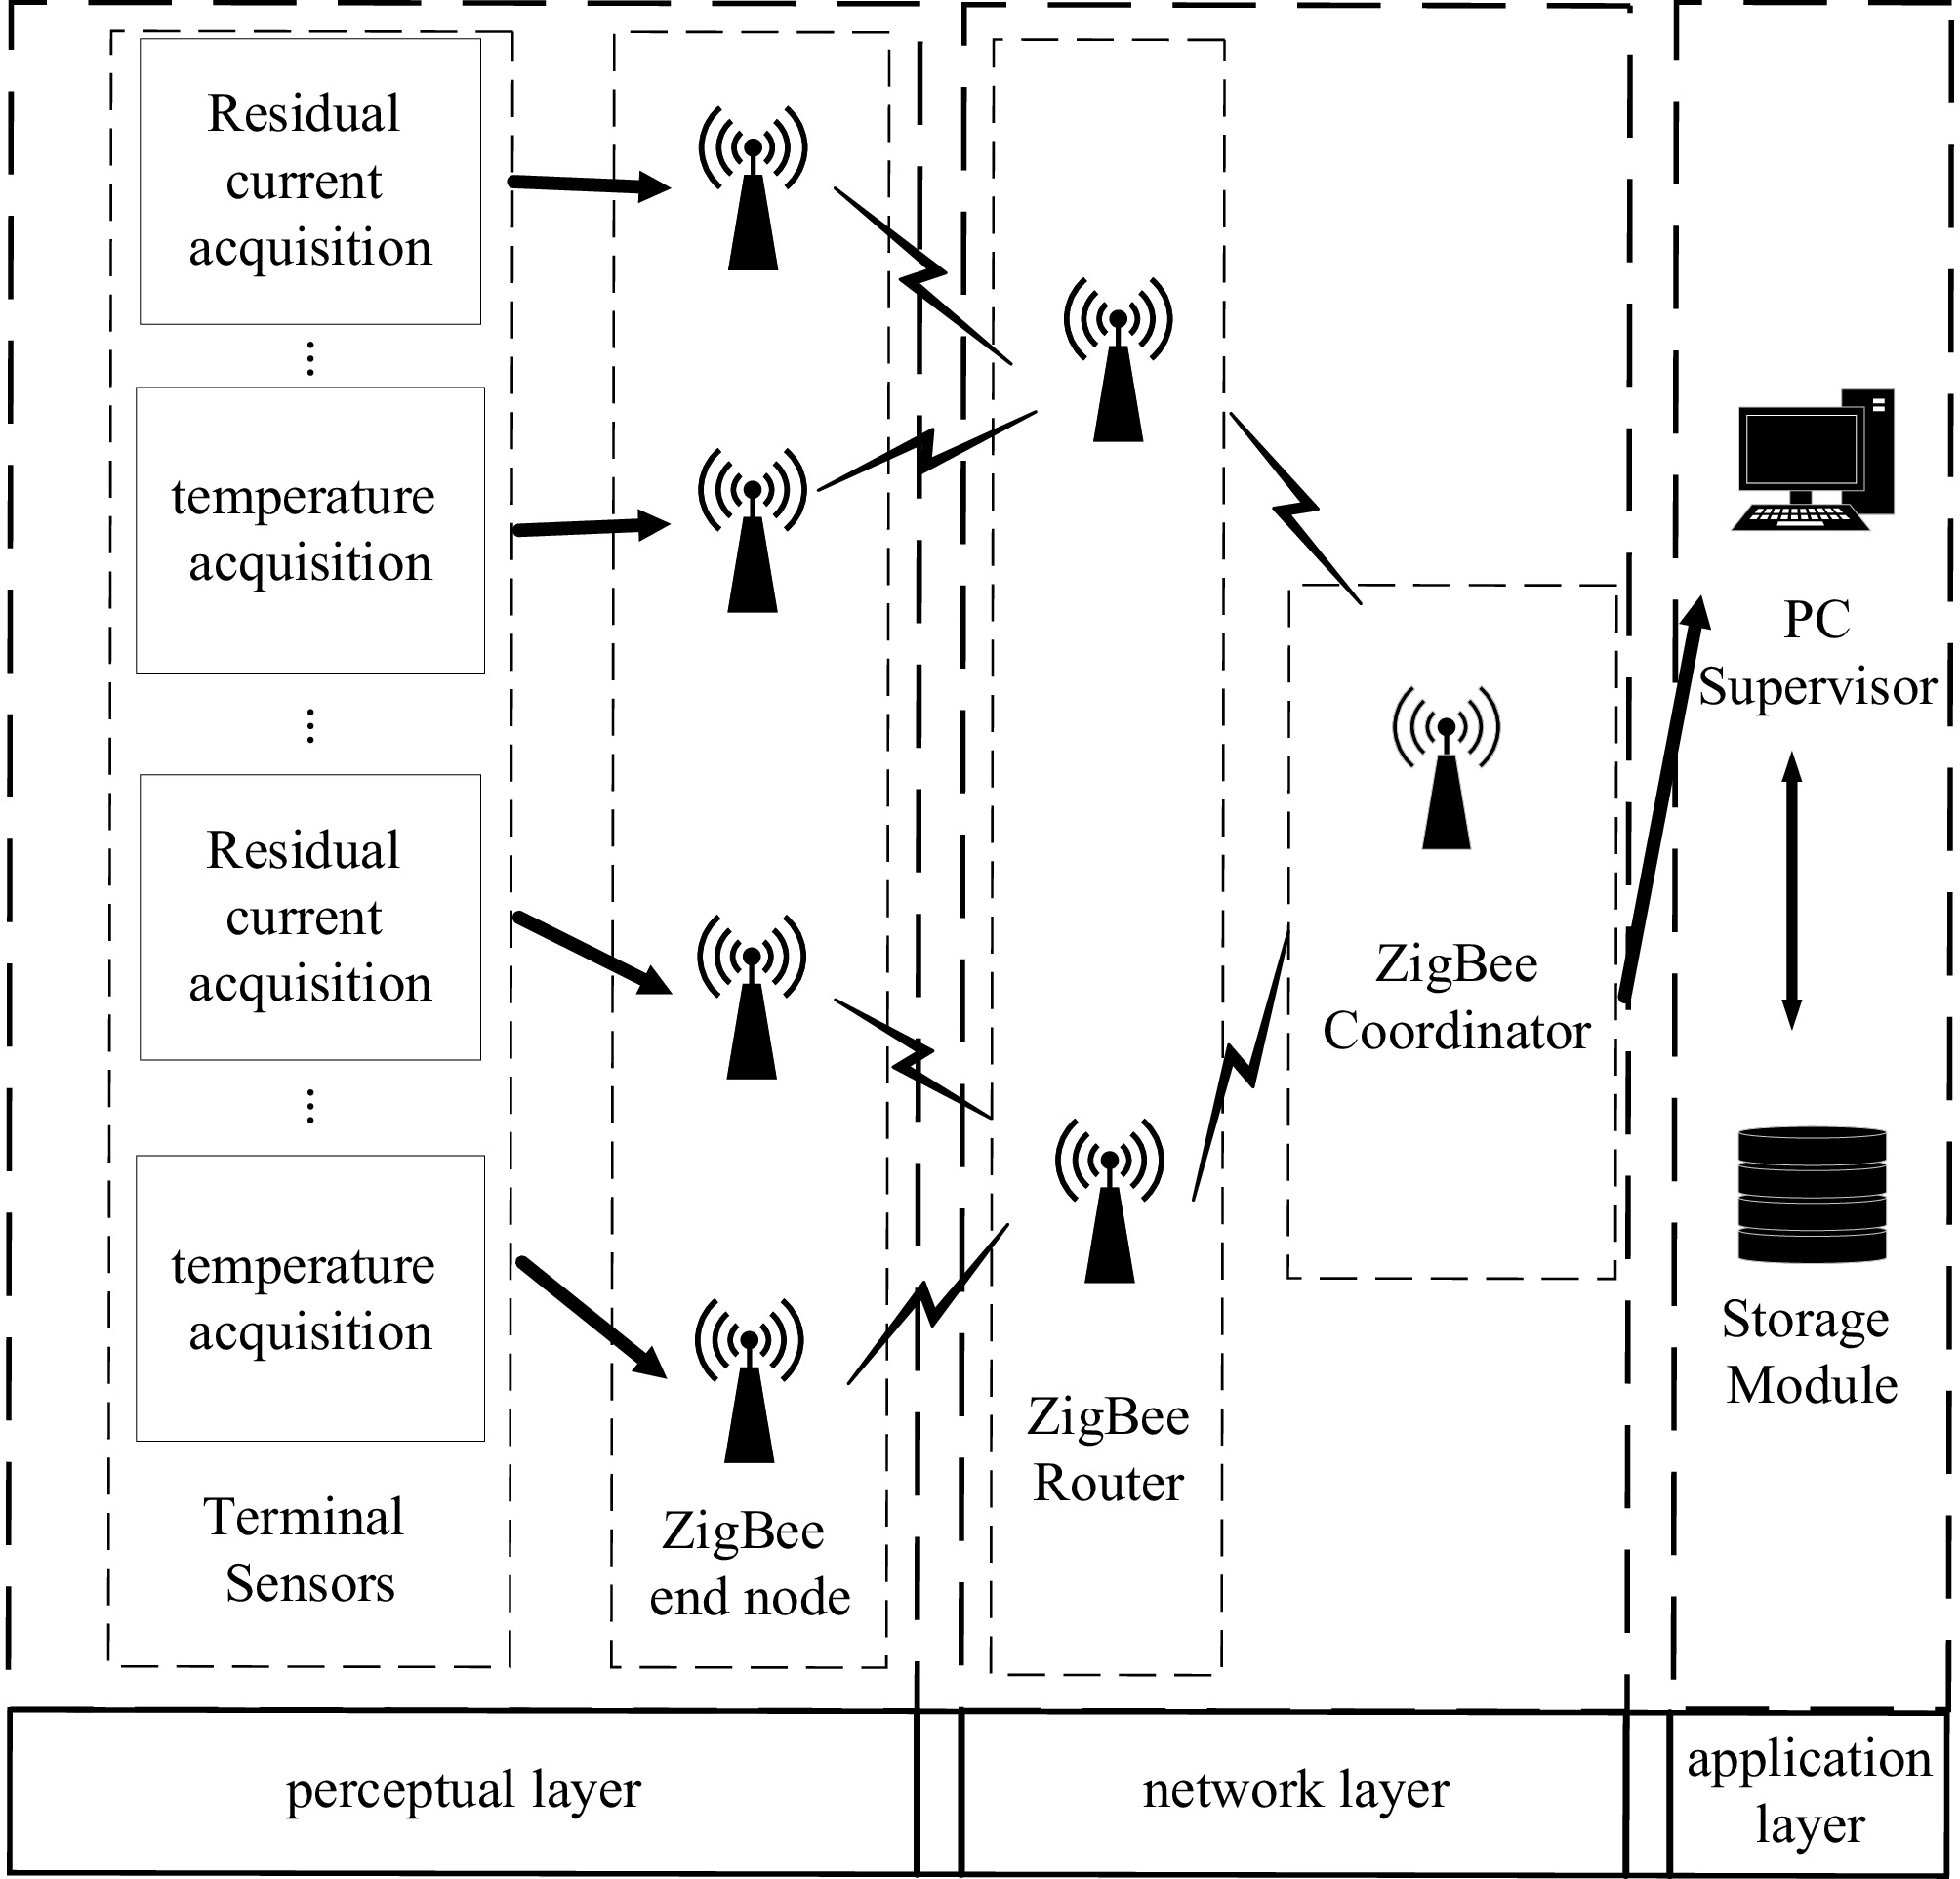
Figure 1.
System architecture diagram.
-
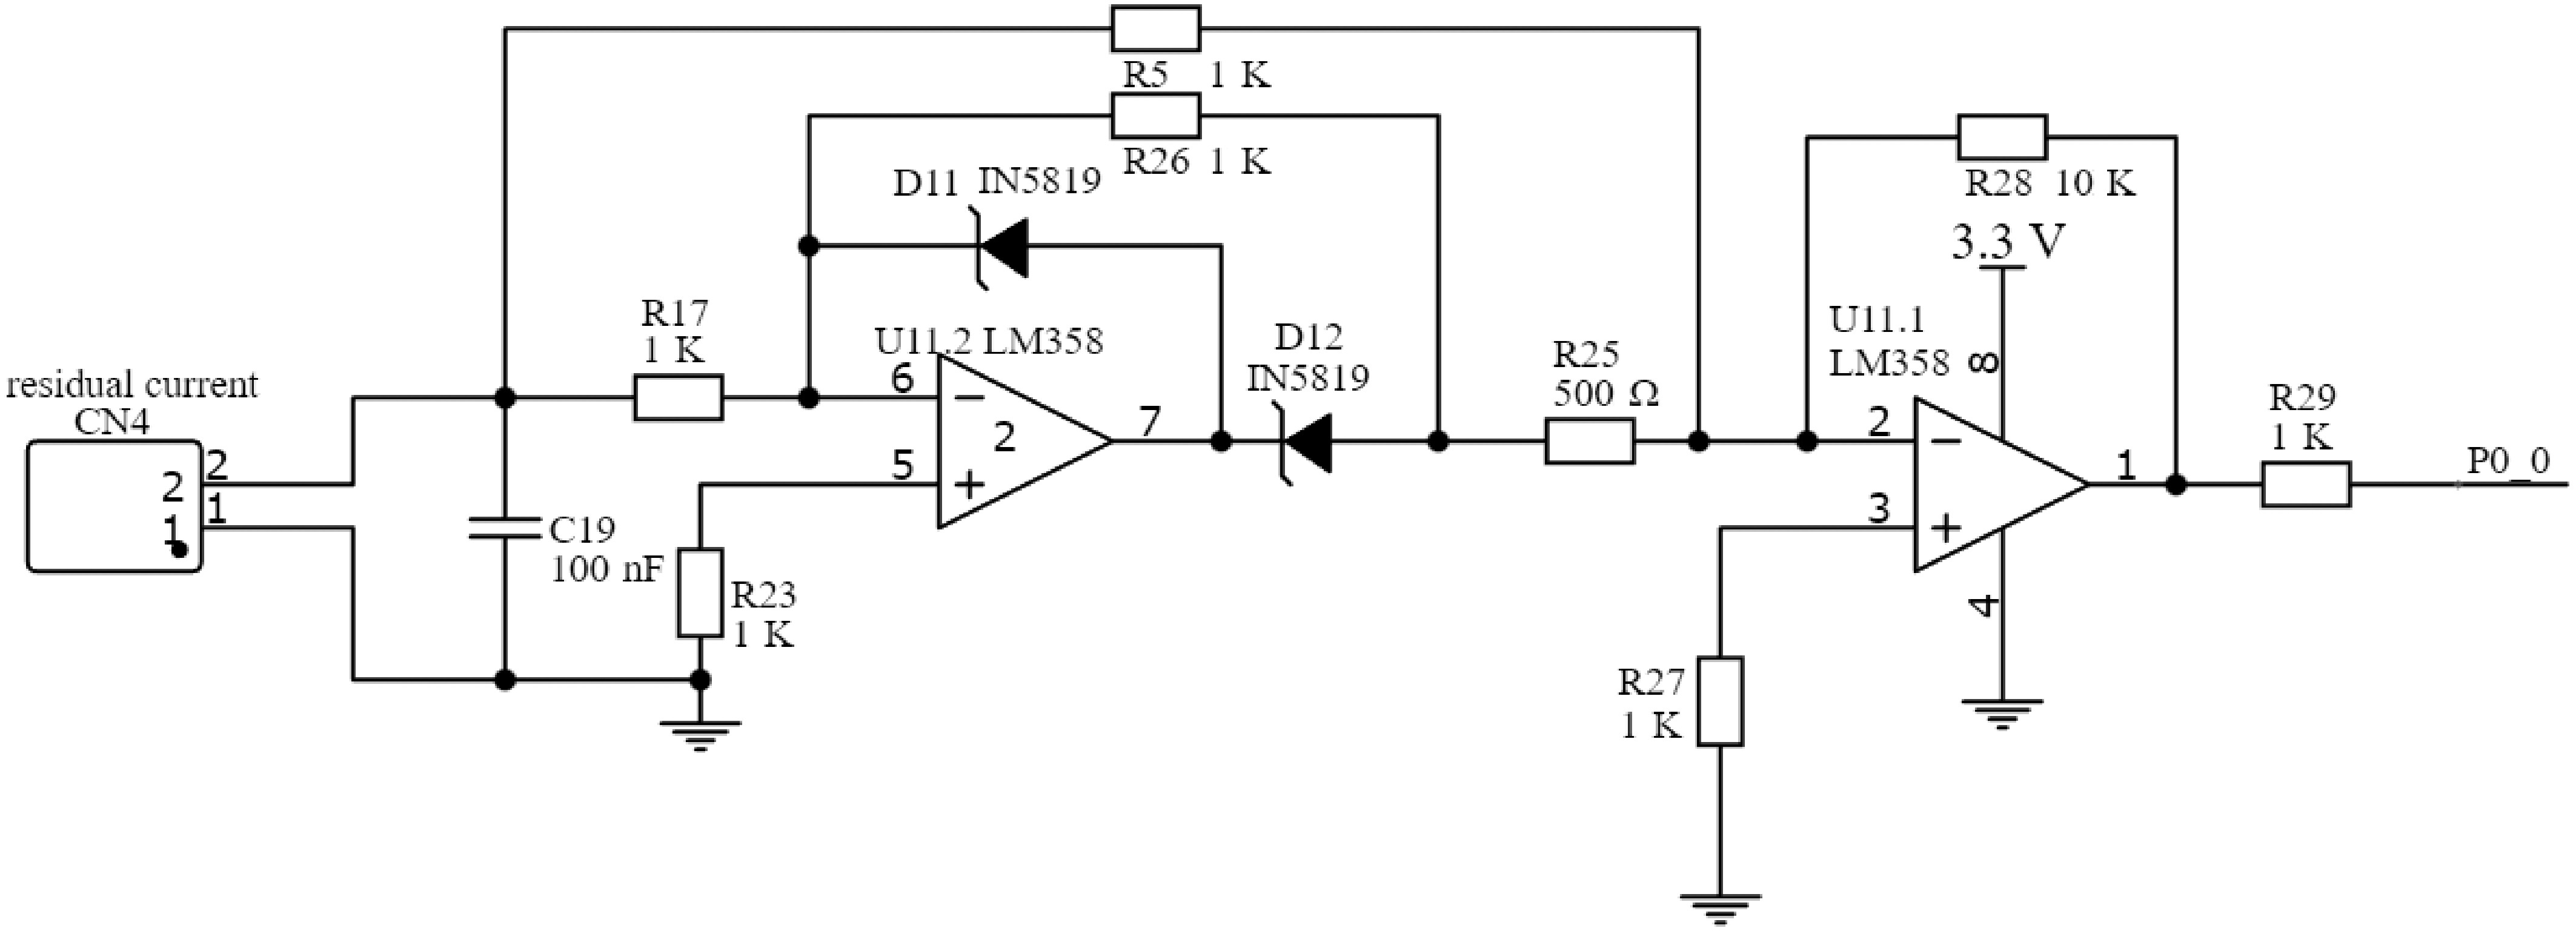
Figure 2.
Residual current detection circuit diagram.
-
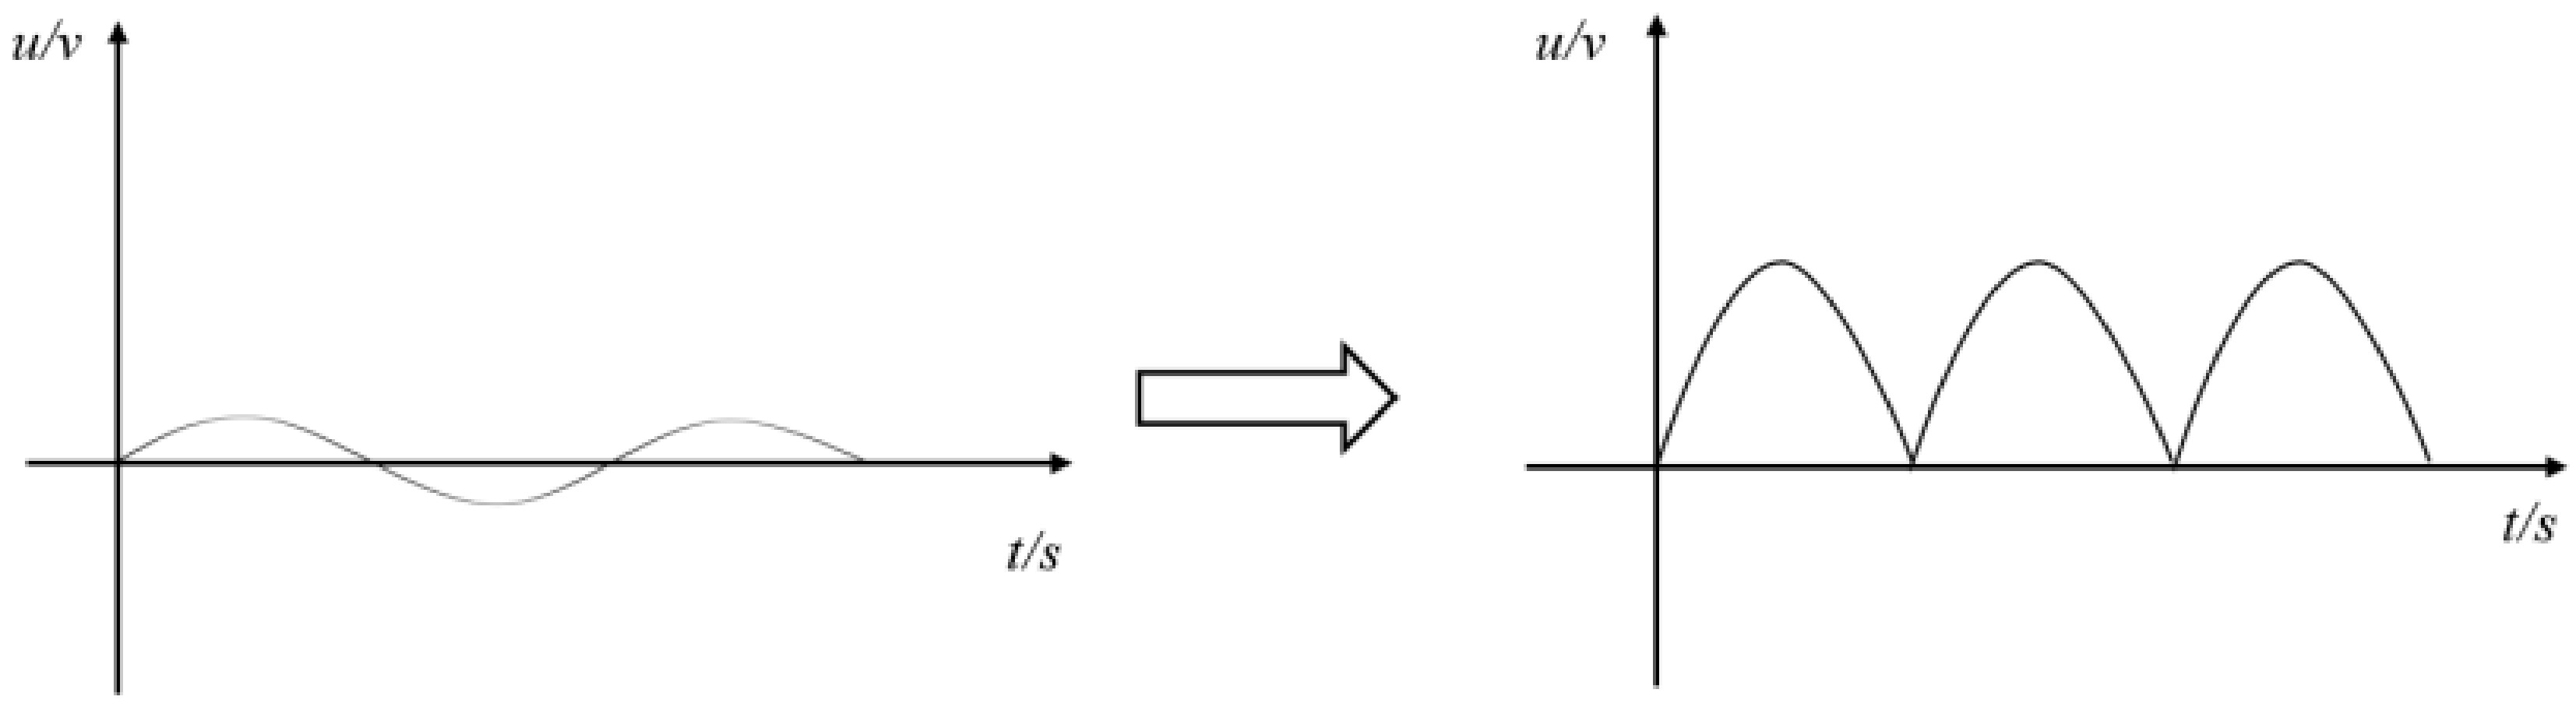
Figure 3.
Waveform before and after signal rectification.
-
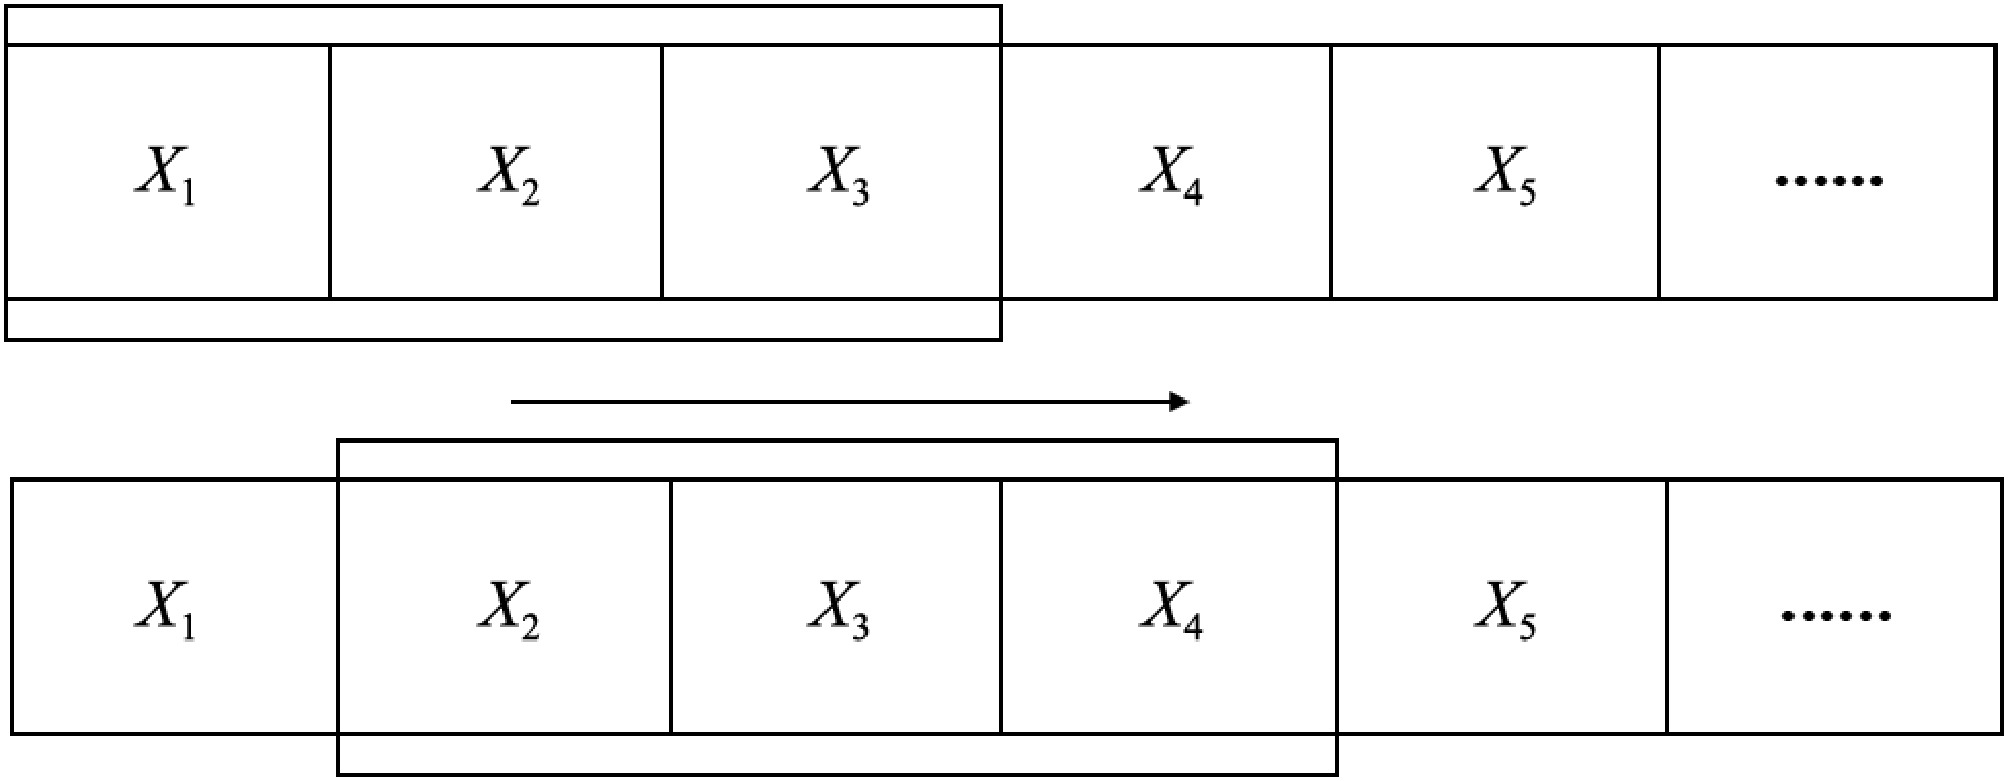
Figure 4.
Schematic diagram of sliding window algorithm.
-
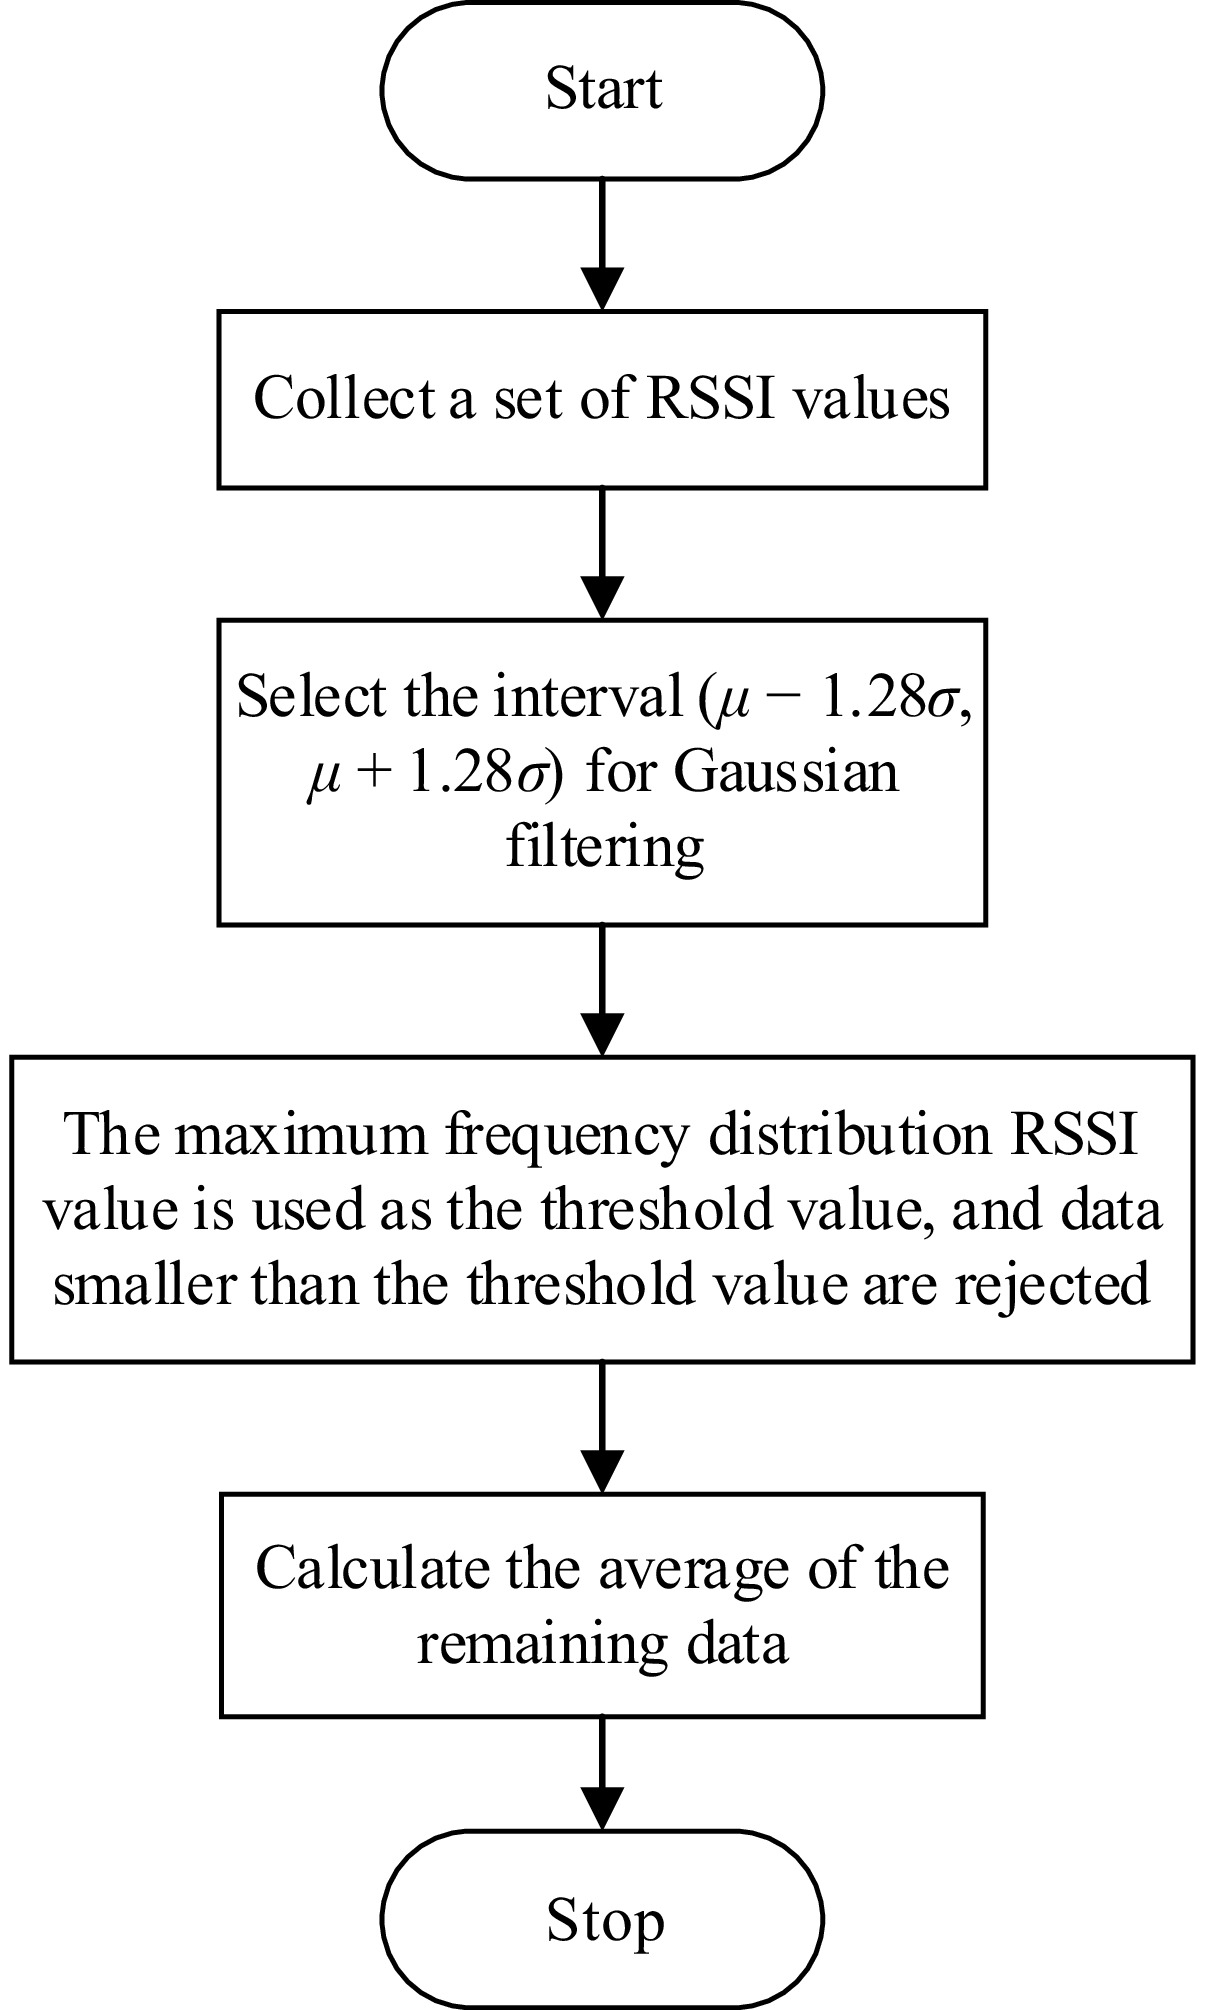
Figure 5.
Flowchart of improved Gaussian filtering method.
-
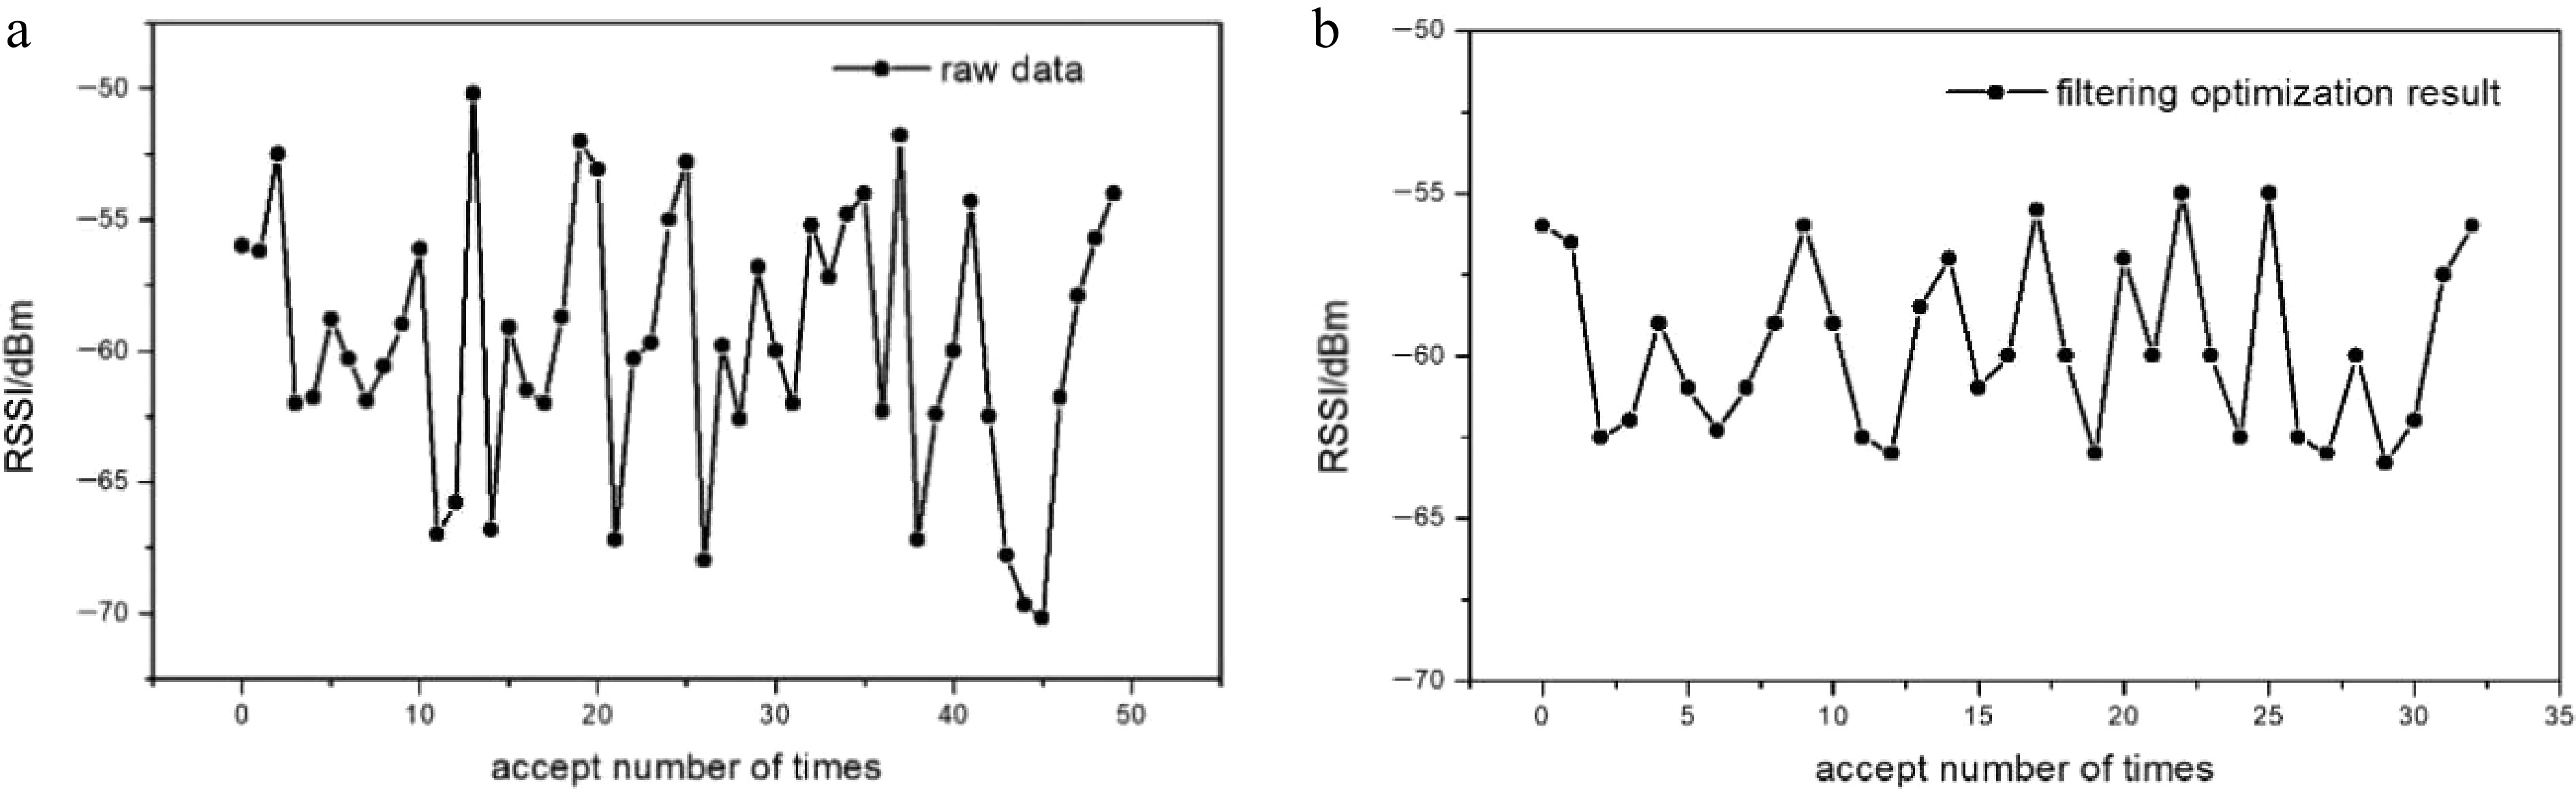
Figure 6.
Raw RSSI data and filtering optimization result.
-
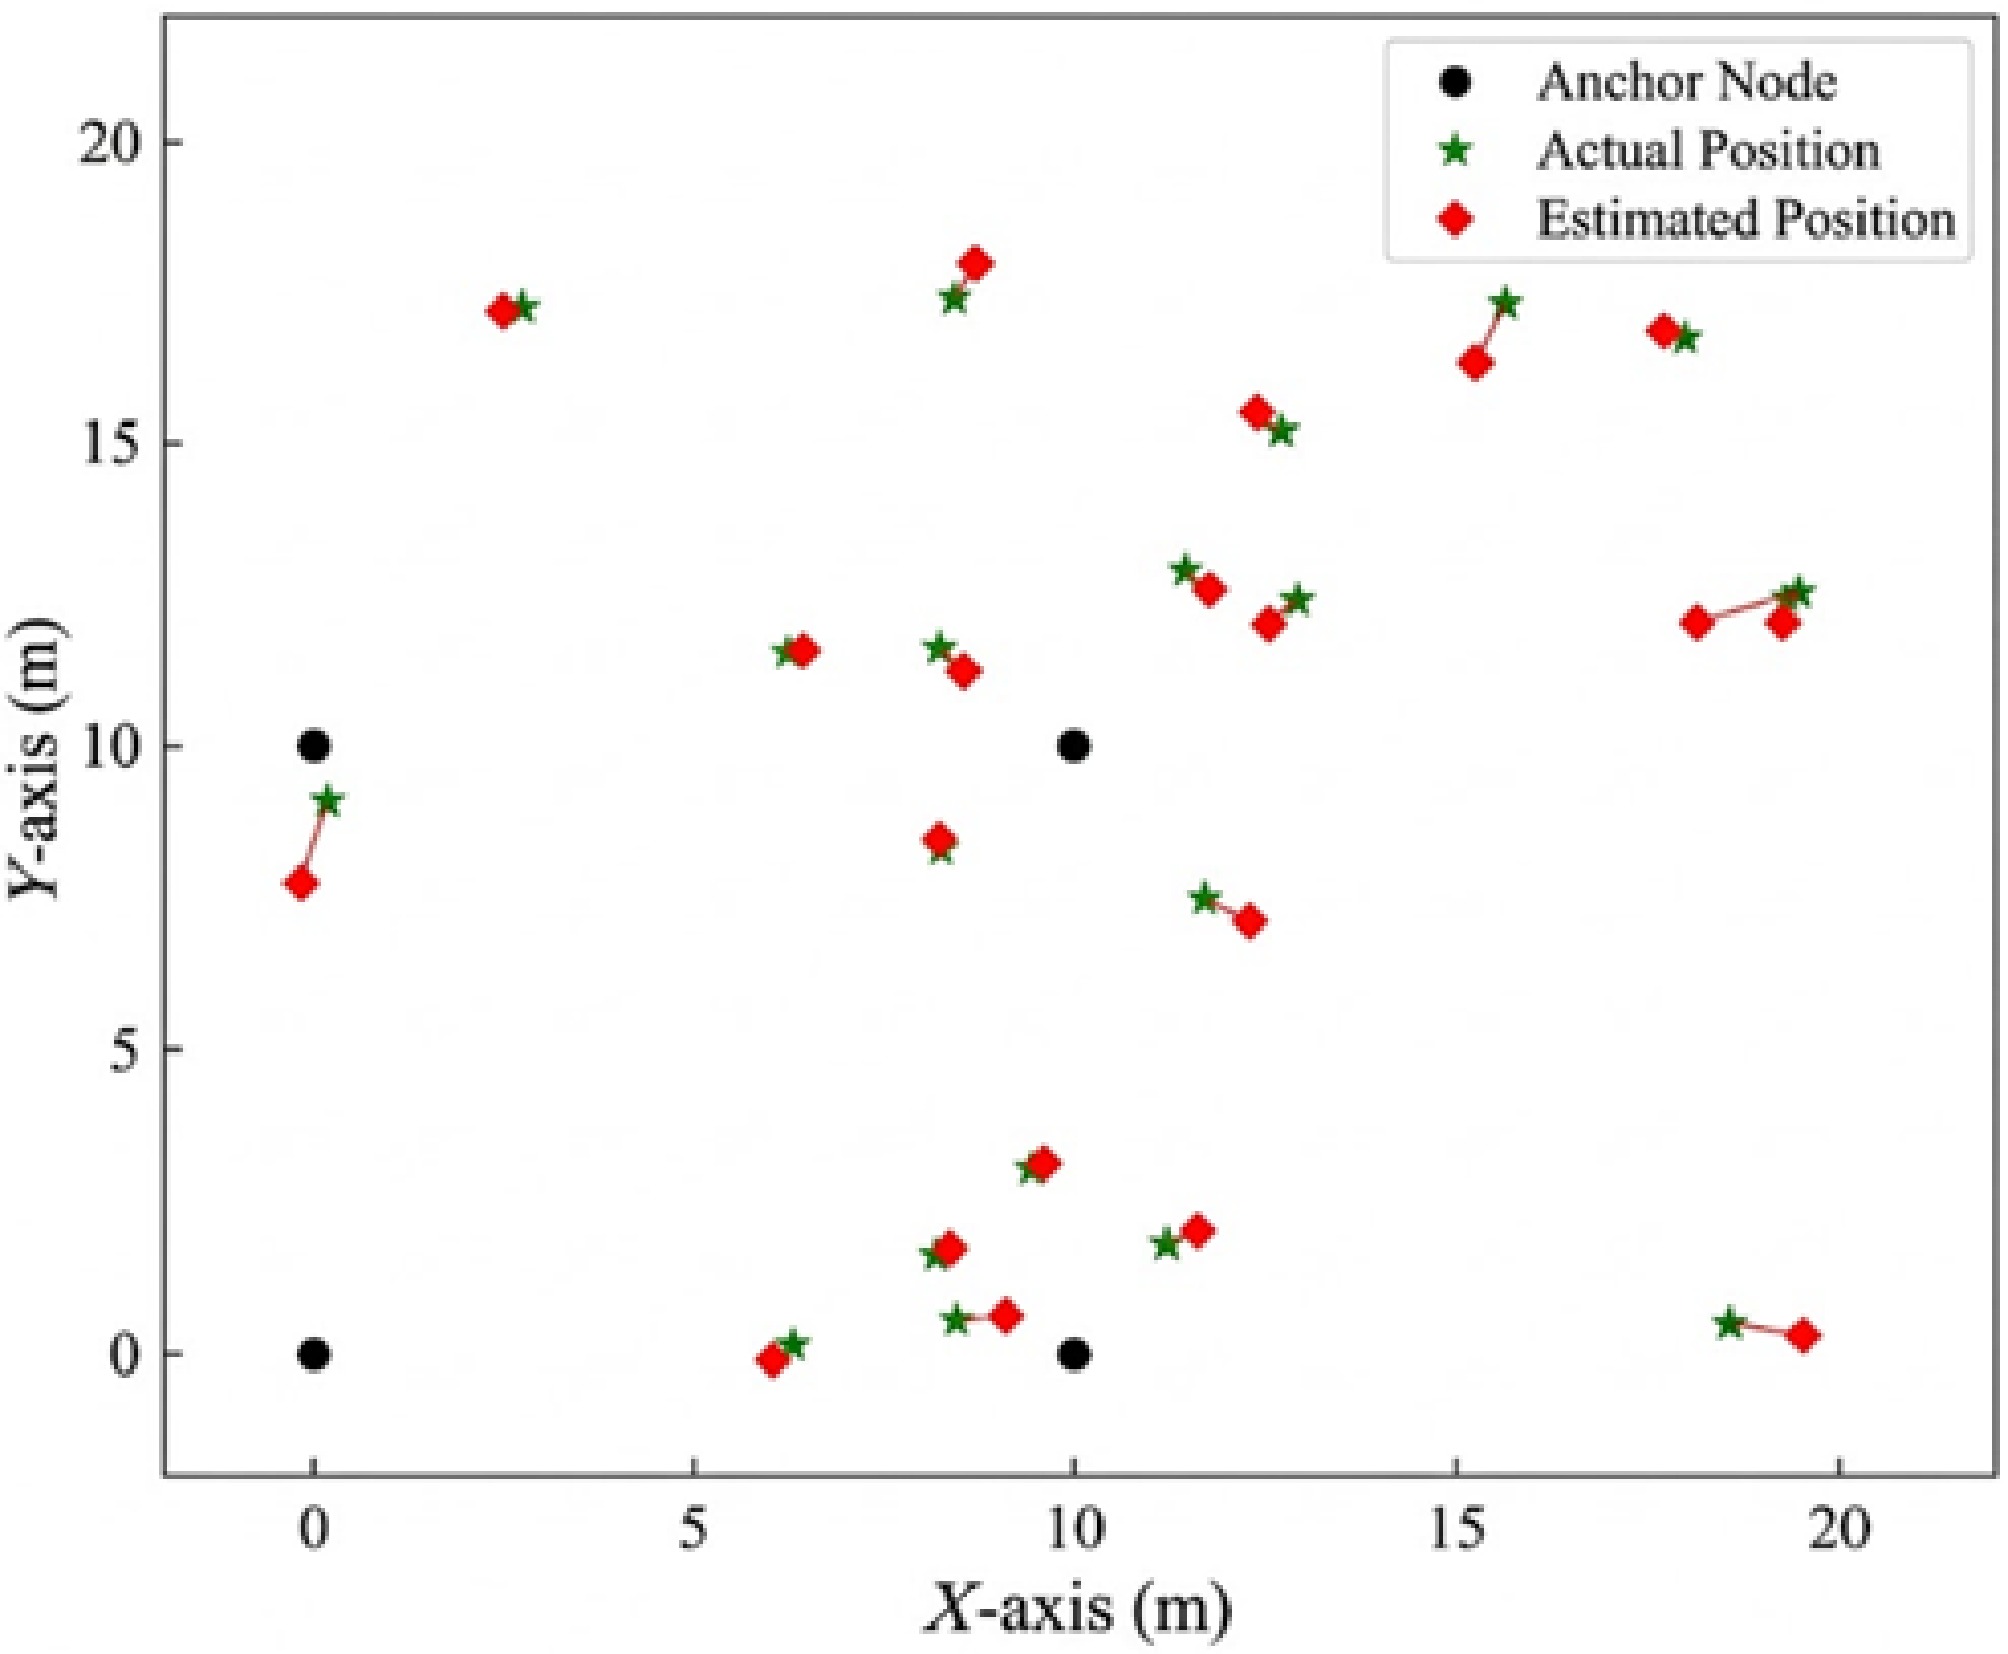
Figure 7.
Simulation results of positioning algorithm.
-
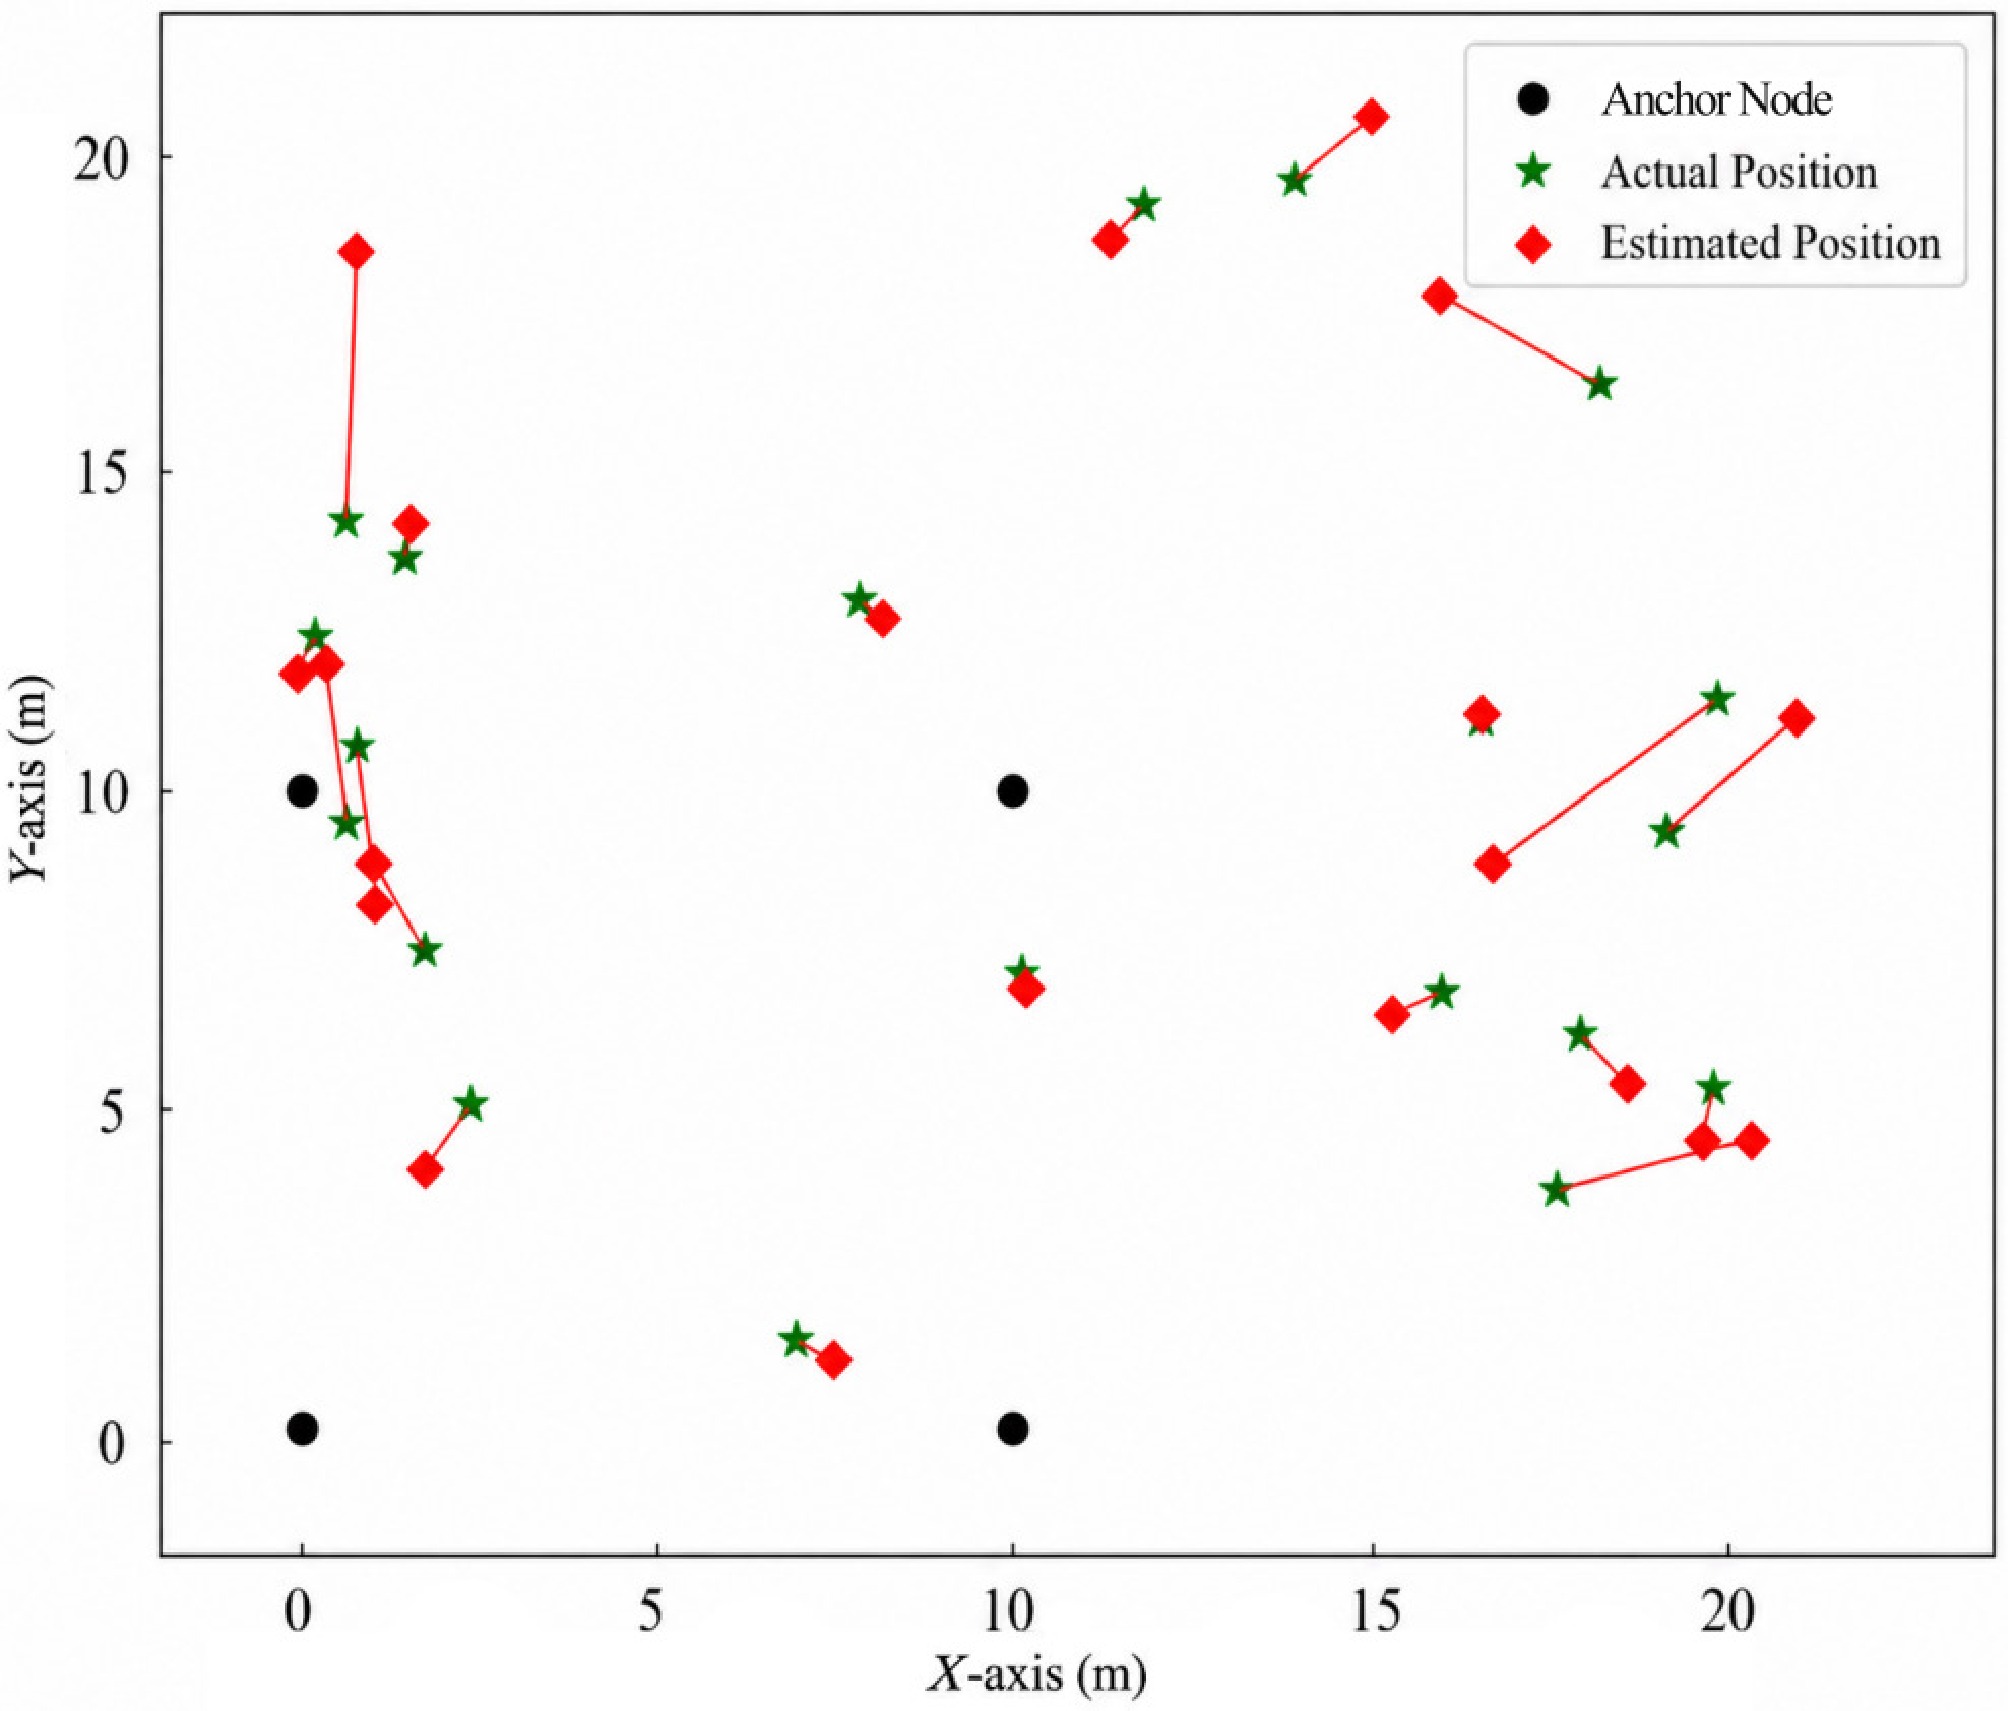
Figure 8.
Simulation results of maximum likelihood estimation method for localization.
-
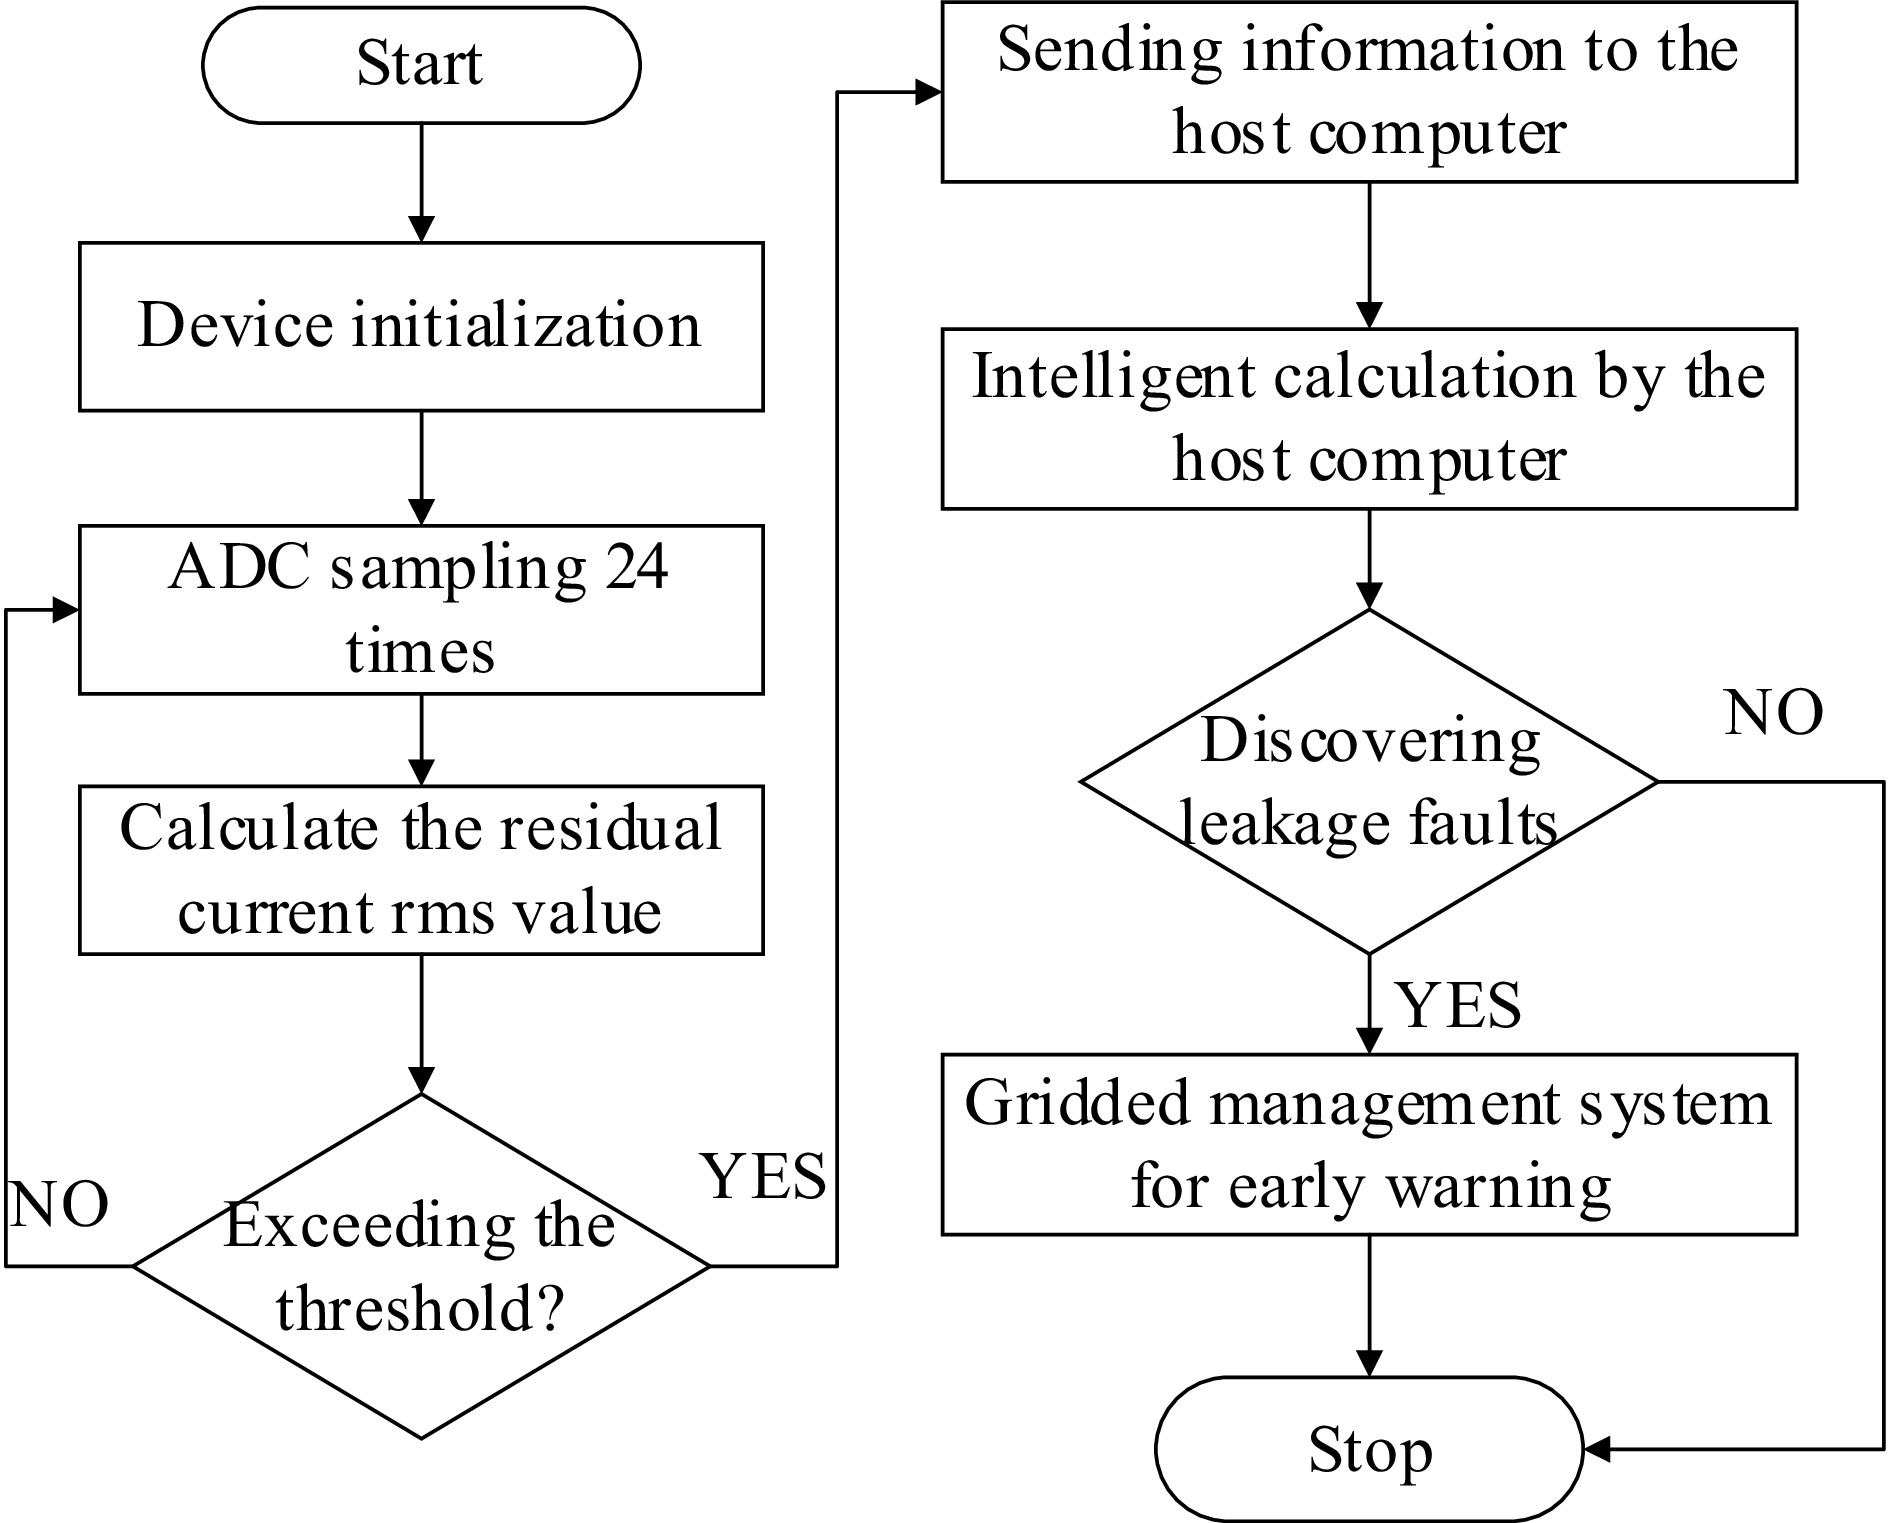
Figure 9.
Residual current detection flowchart.
-
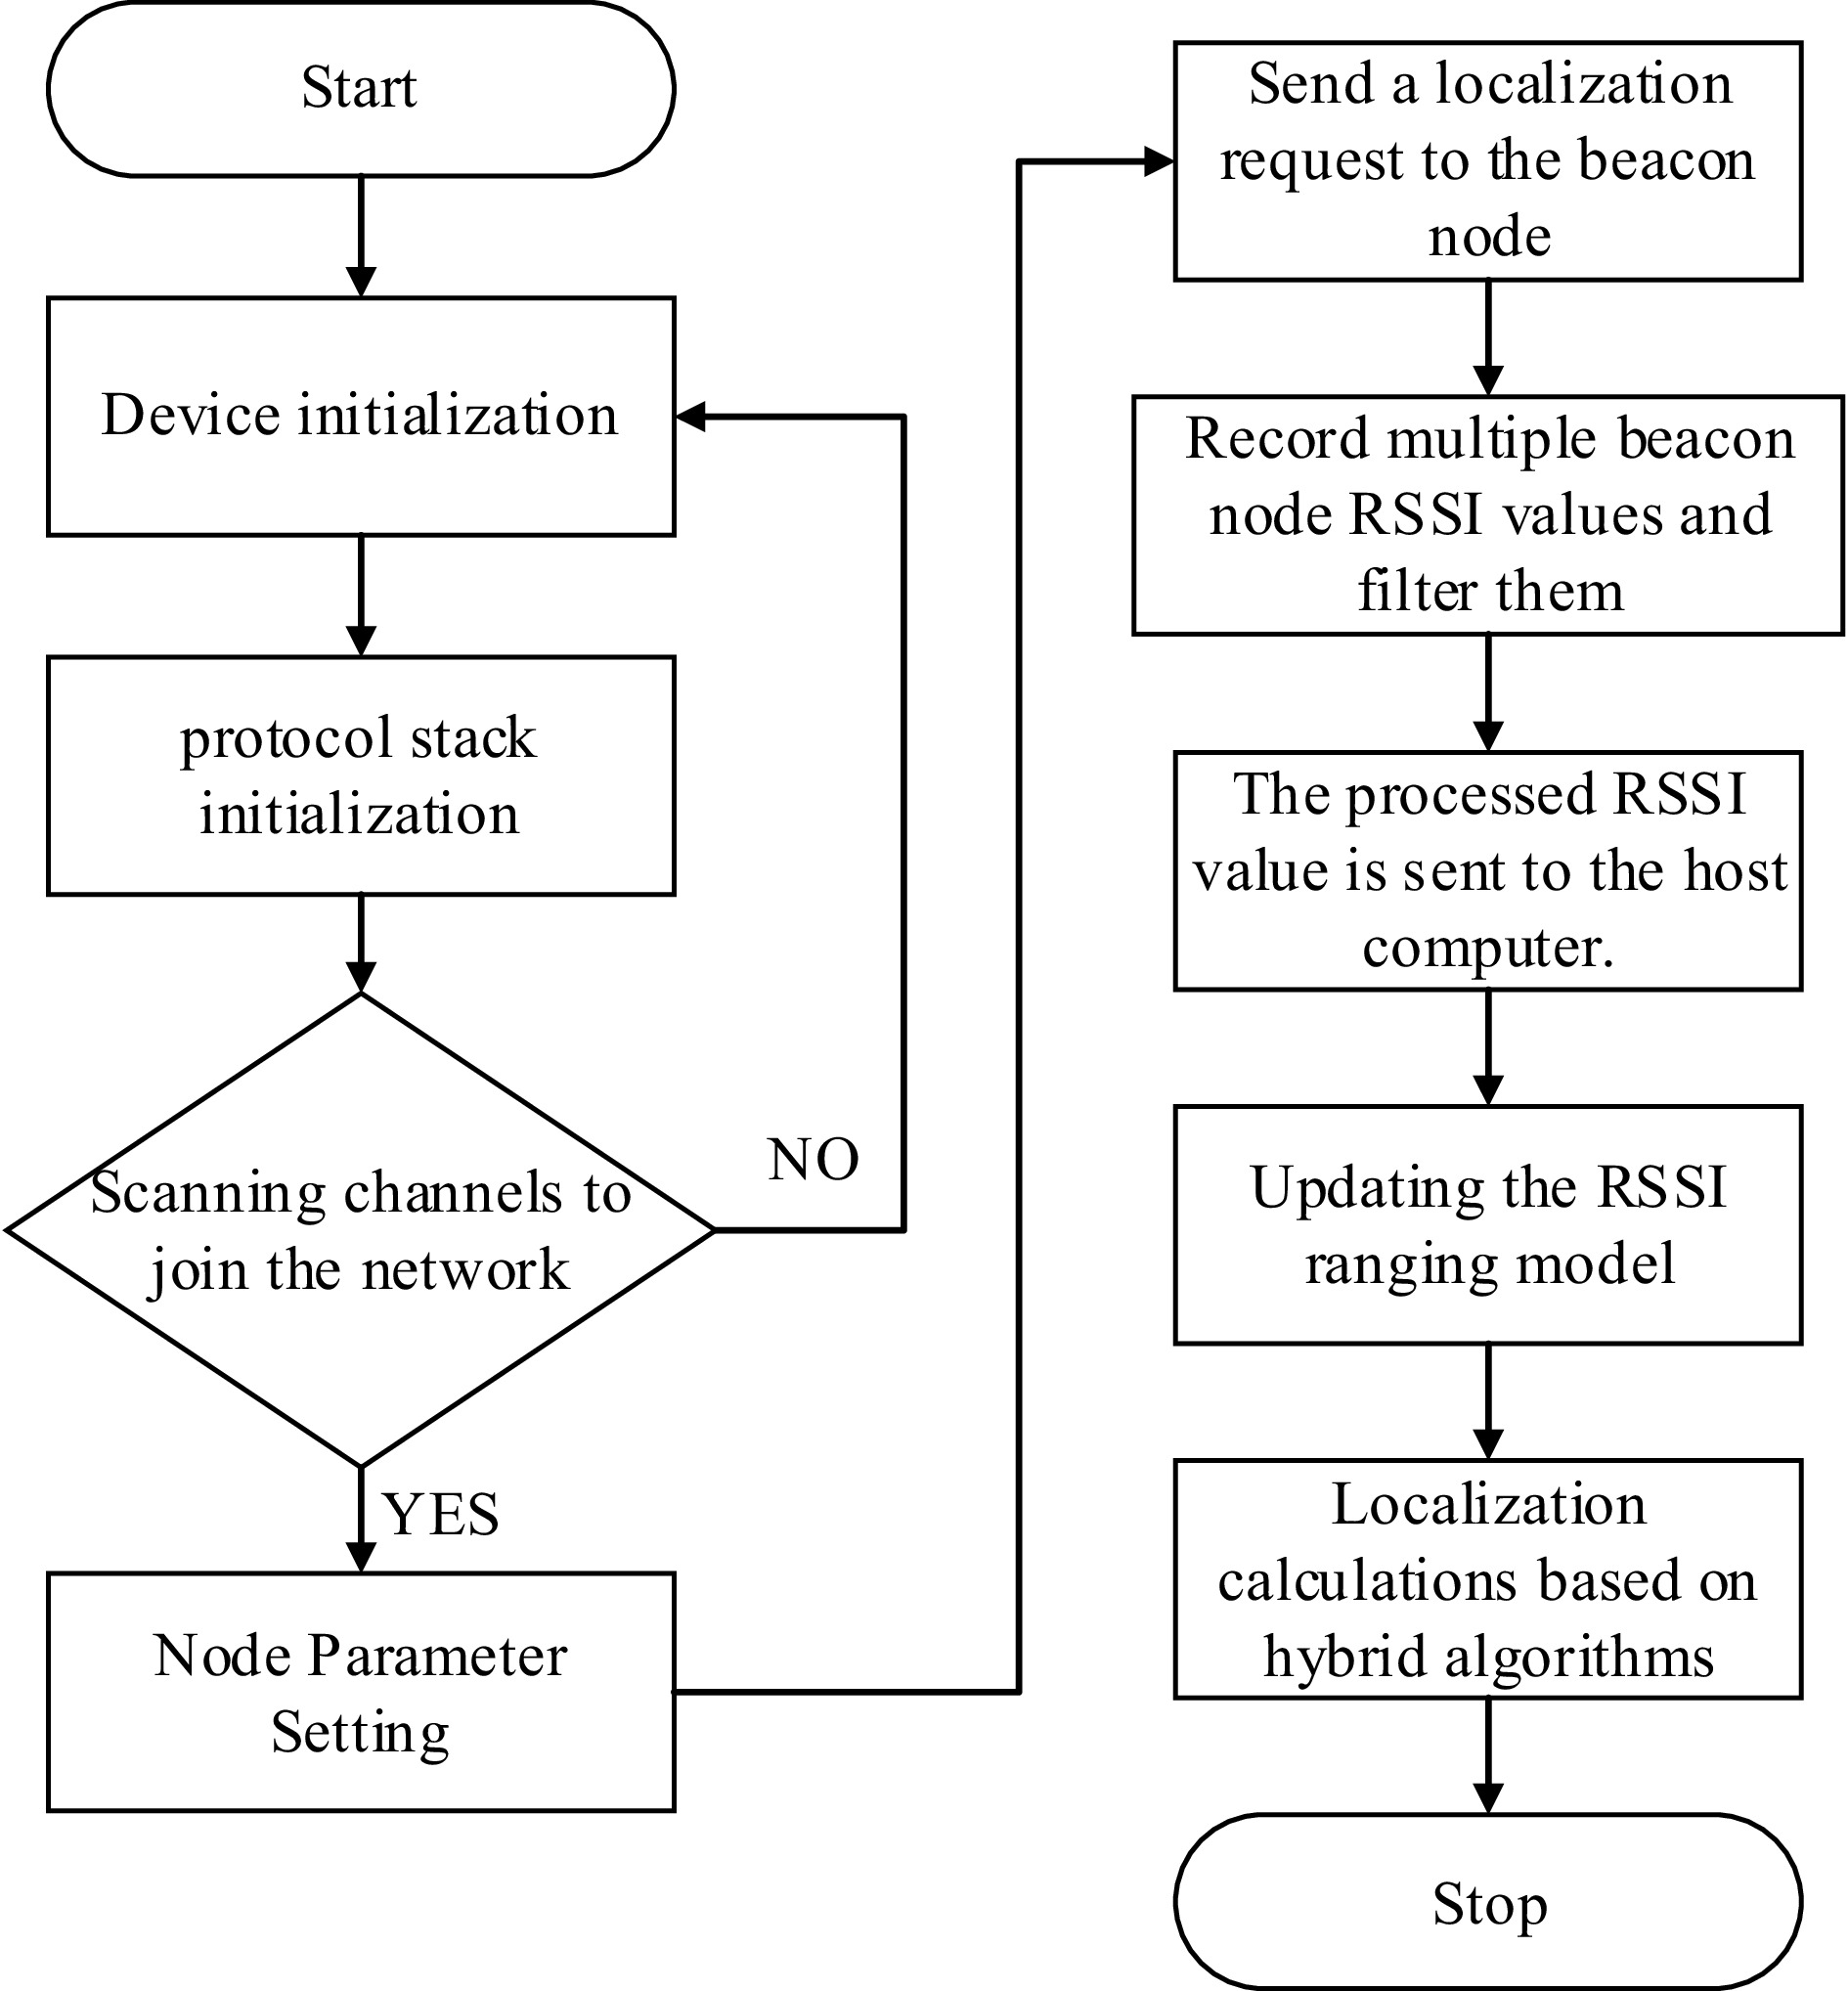
Figure 10.
Terminal node positioning flowchart.
-
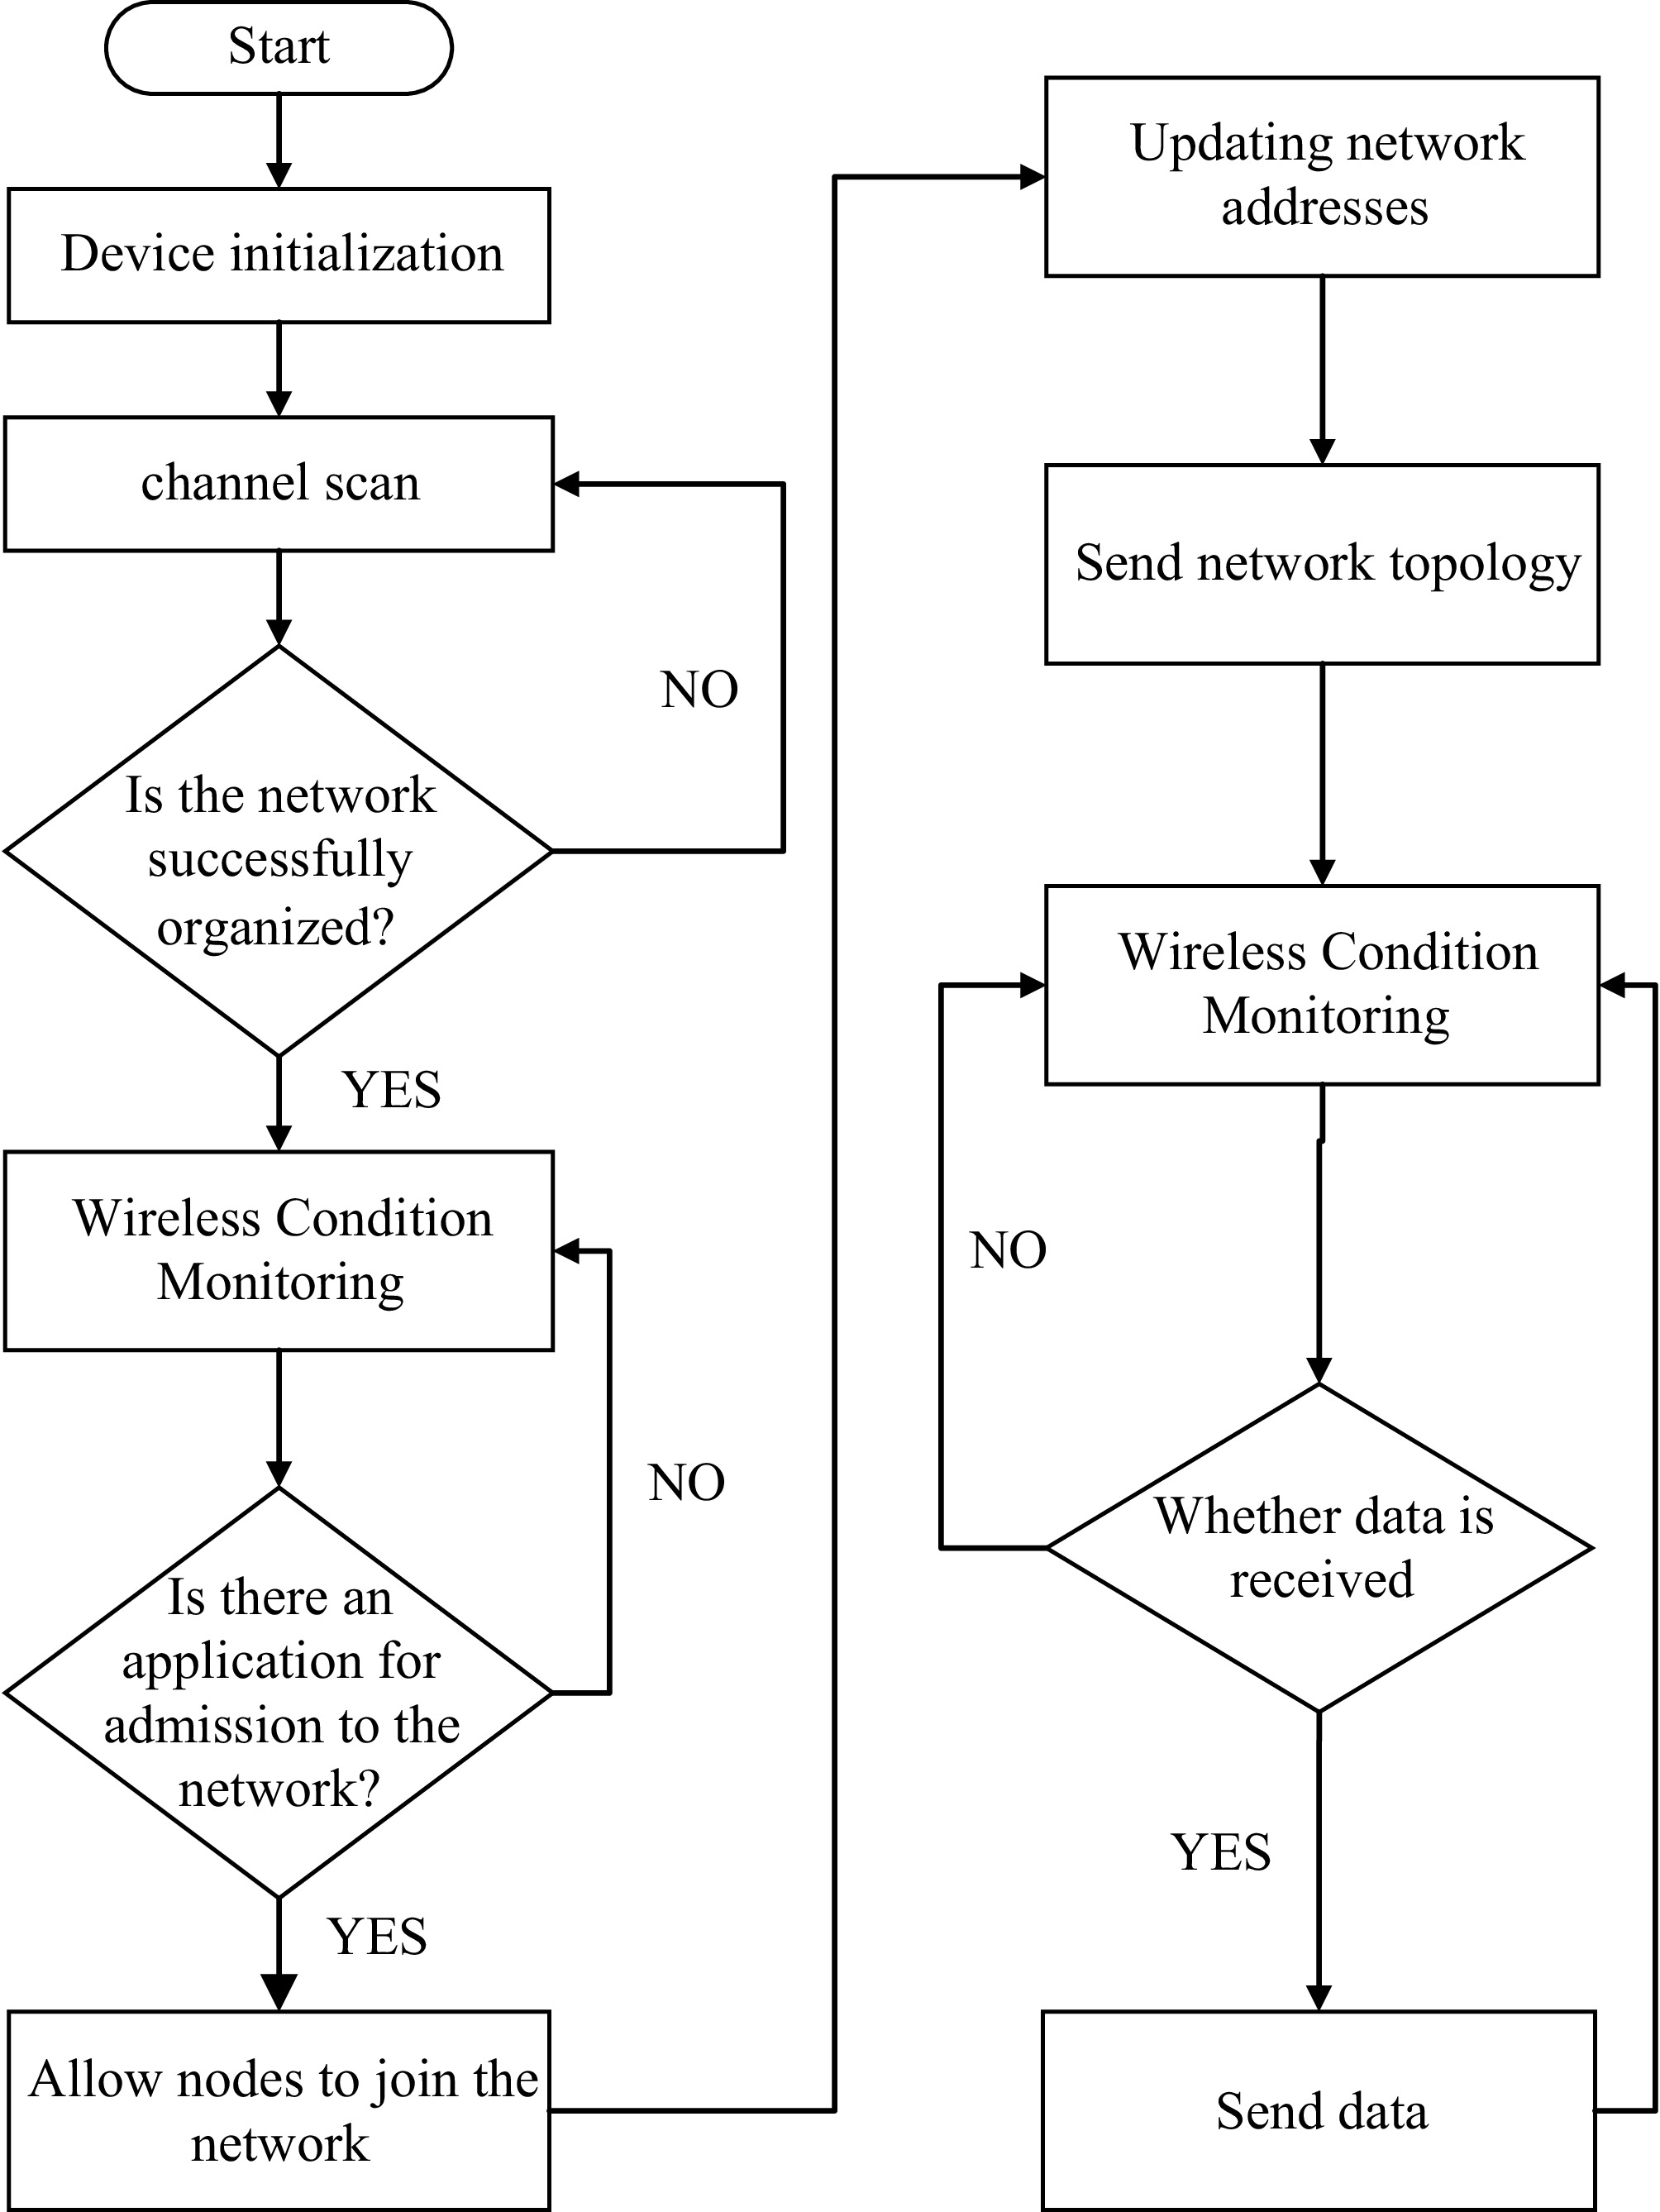
Figure 11.
Coordinator workflow diagram.
-
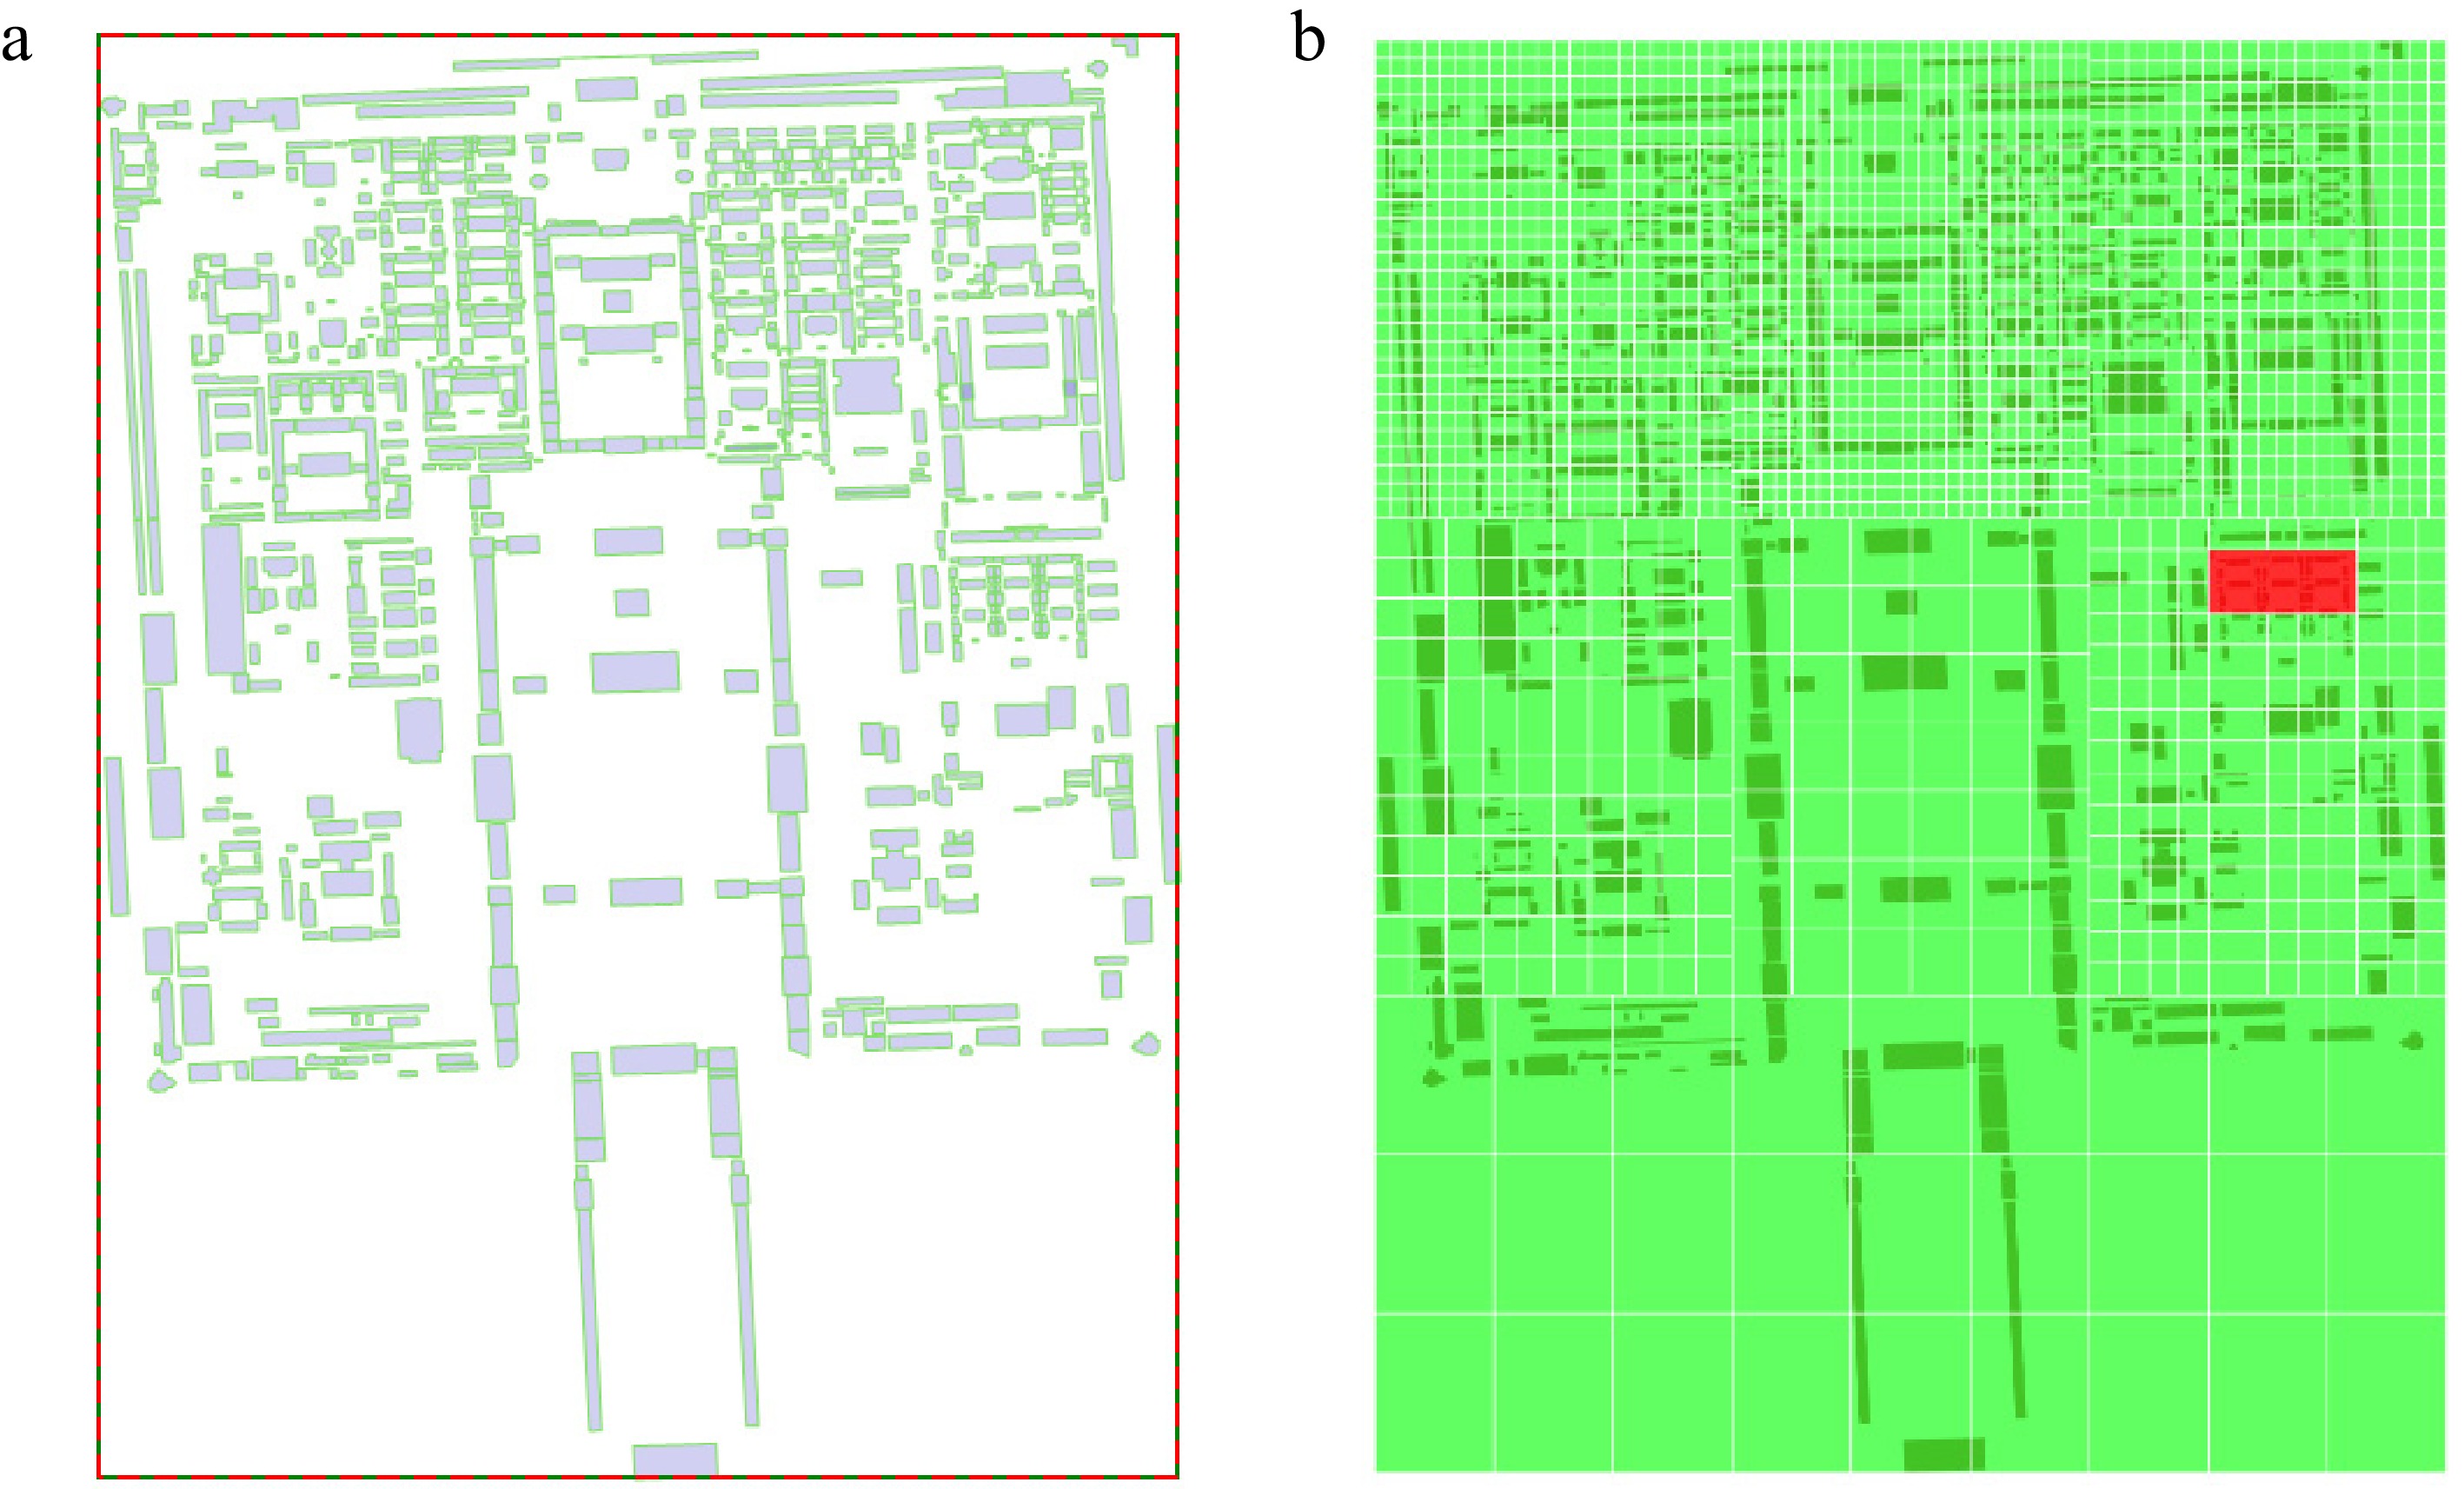
Figure 12.
Upper computer grid warning display.
-
Processing method Raw data Gaussian optimization Variance (m2) 5.9311 2.0426 SNR (dB) 26.25 30.88 Table 1.
Variance comparison table.
-
Beacon node spacing (m) Collection number of times 20 50 80 110 10 0.97 0.56 0.57 0.35 15 0.96 0.69 0.53 0.41 20 1.13 1.06 0.77 0.56 Table 2.
Positioning experiment errors under different positioning conditions.
Figures
(12)
Tables
(2)