-
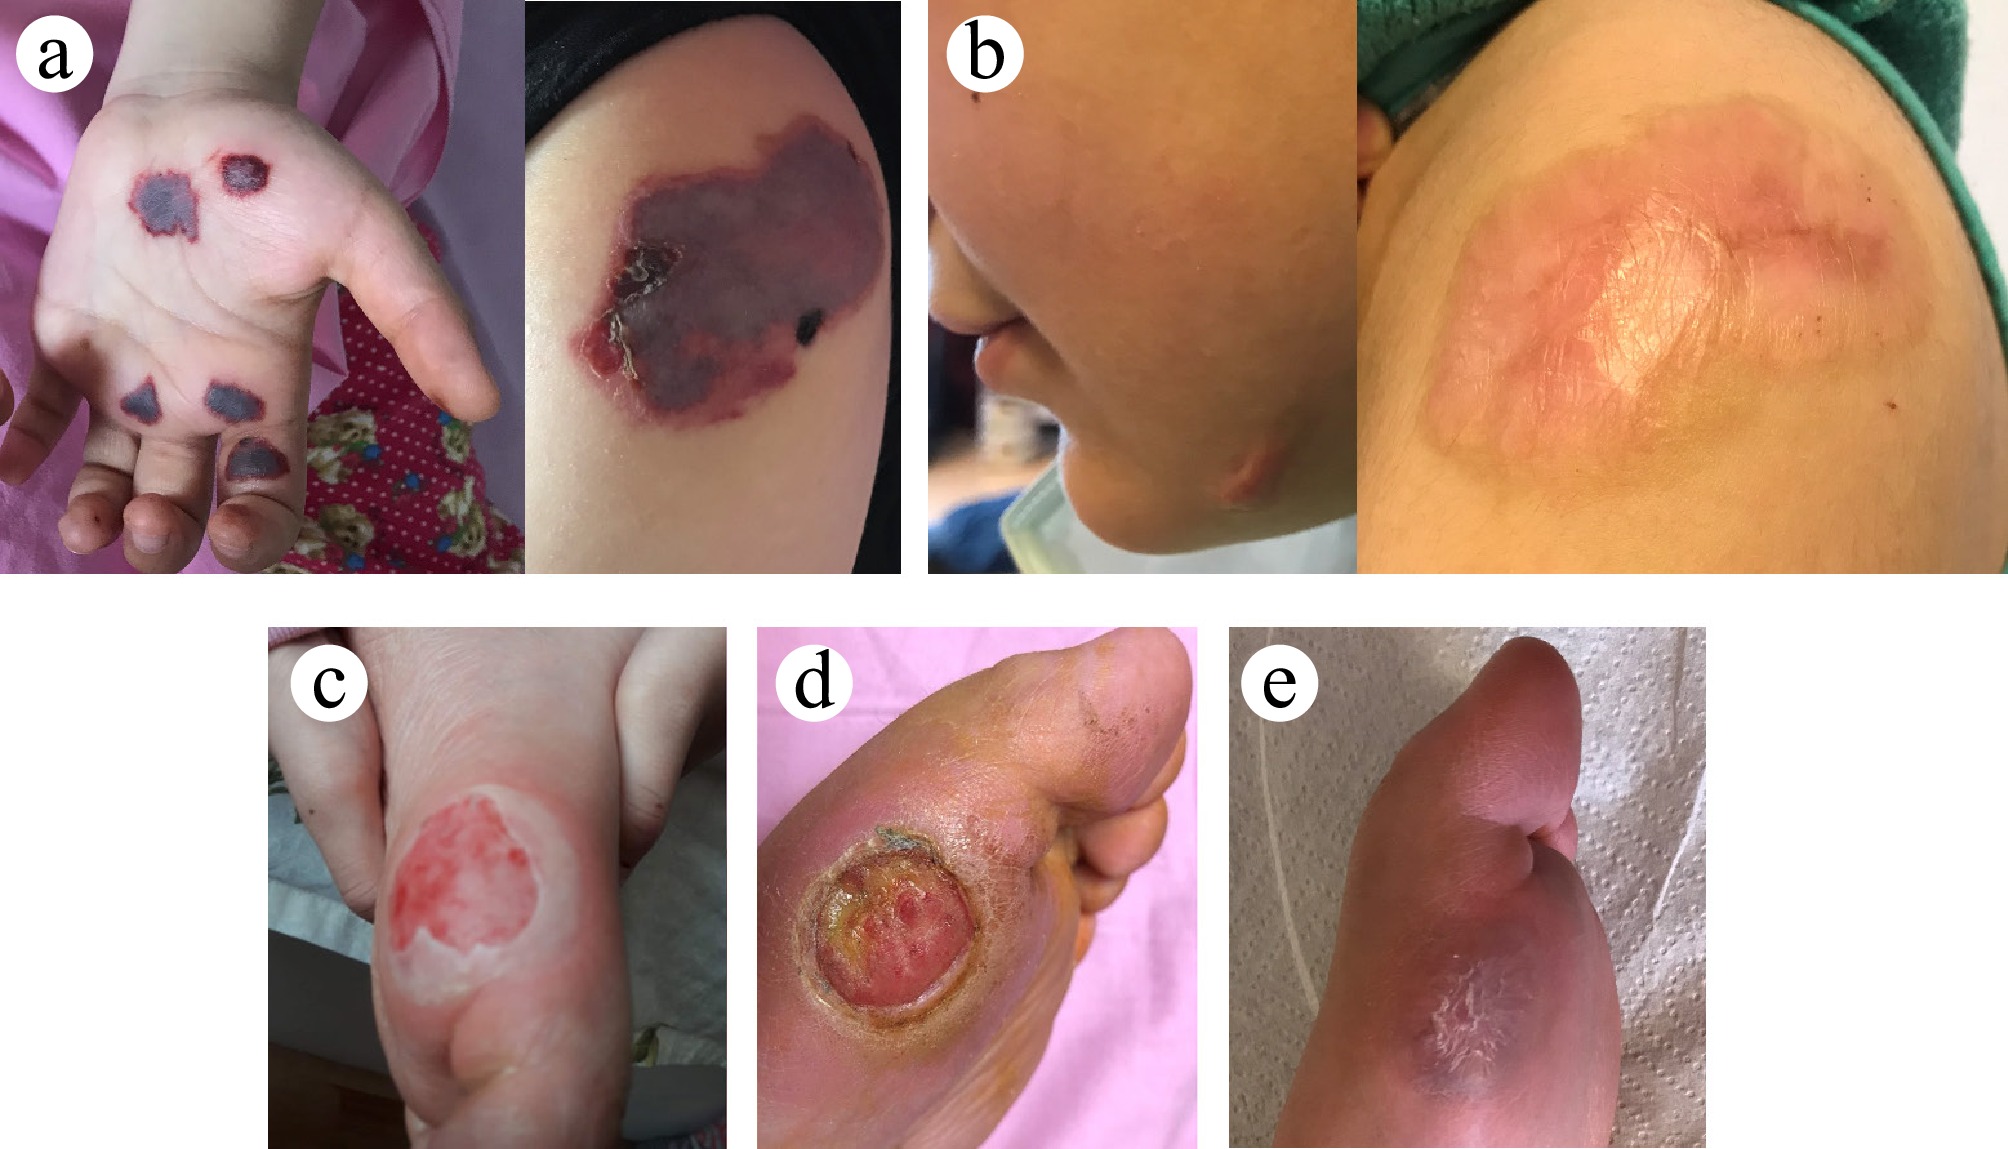
Figure 1.
(a) Purpuric lesions on the palm and left shoulder on admission. (b) Purpuric lesions on the chin and shoulder healing with atrophic scar tissue. (c) New bullous lesion on the left metatarsi one month after first admission. (d) Ulcerated foot lesion, three months after first admission. (e) Healed left metatarsi lesion.
-
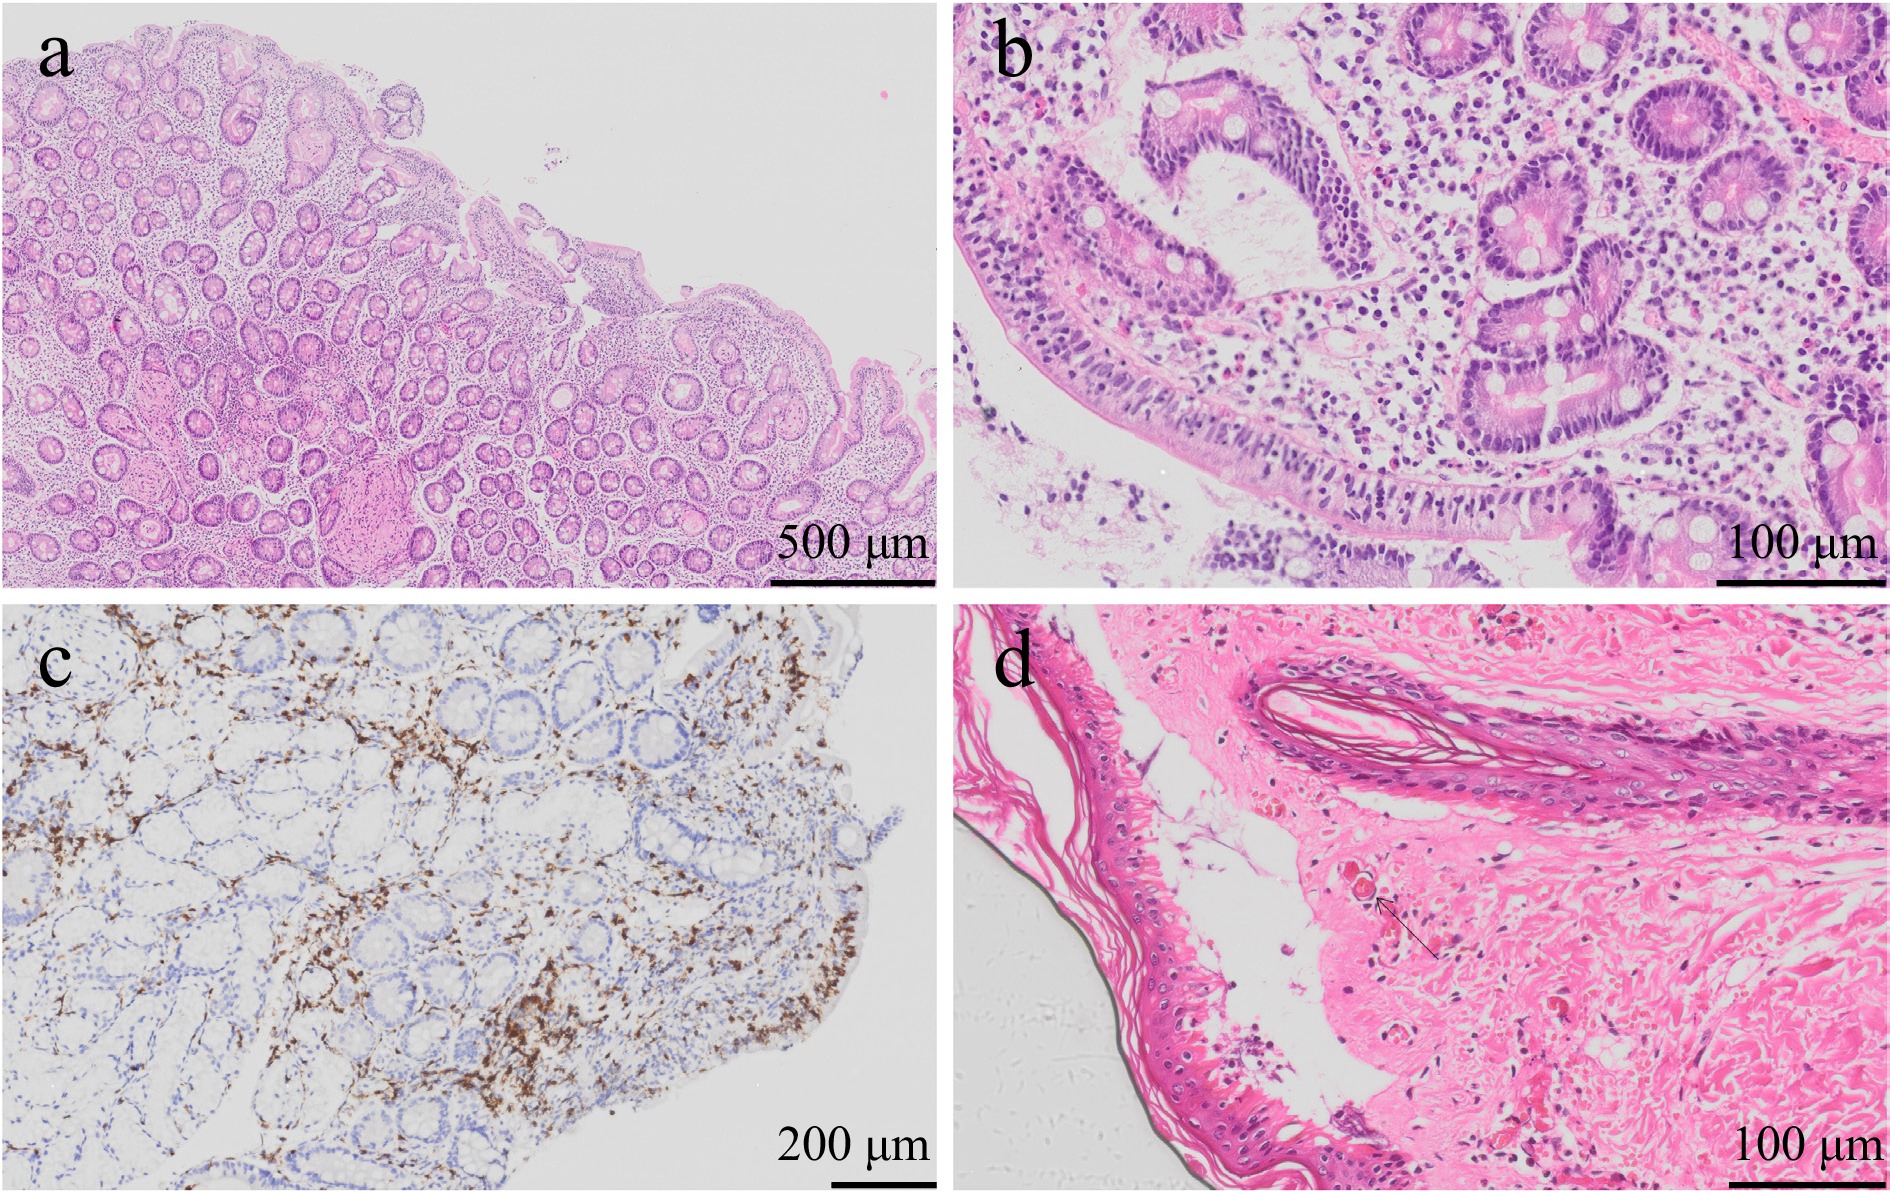
Figure 2.
(a) Villous atrophy and crypt hyperplasia in endoscopic bulbus biopsy (Hematoxylin and Eosin, scale bar: 500 µm). (b) Increased intraepithelial lymphocytes in endoscopic bulbus biopsy (Hematoxylin and Eosin, scale bar: 100 µm). (c) Increased intraepithelial lymphocytes evaluated with CD3 immunohistochemistry (scale bar: 200 µm). (d) Skin biopsy with fibrin thrombi in dermal capillary vessels (Hematoxylin and Eosin, scale bar: 100 µm).
-
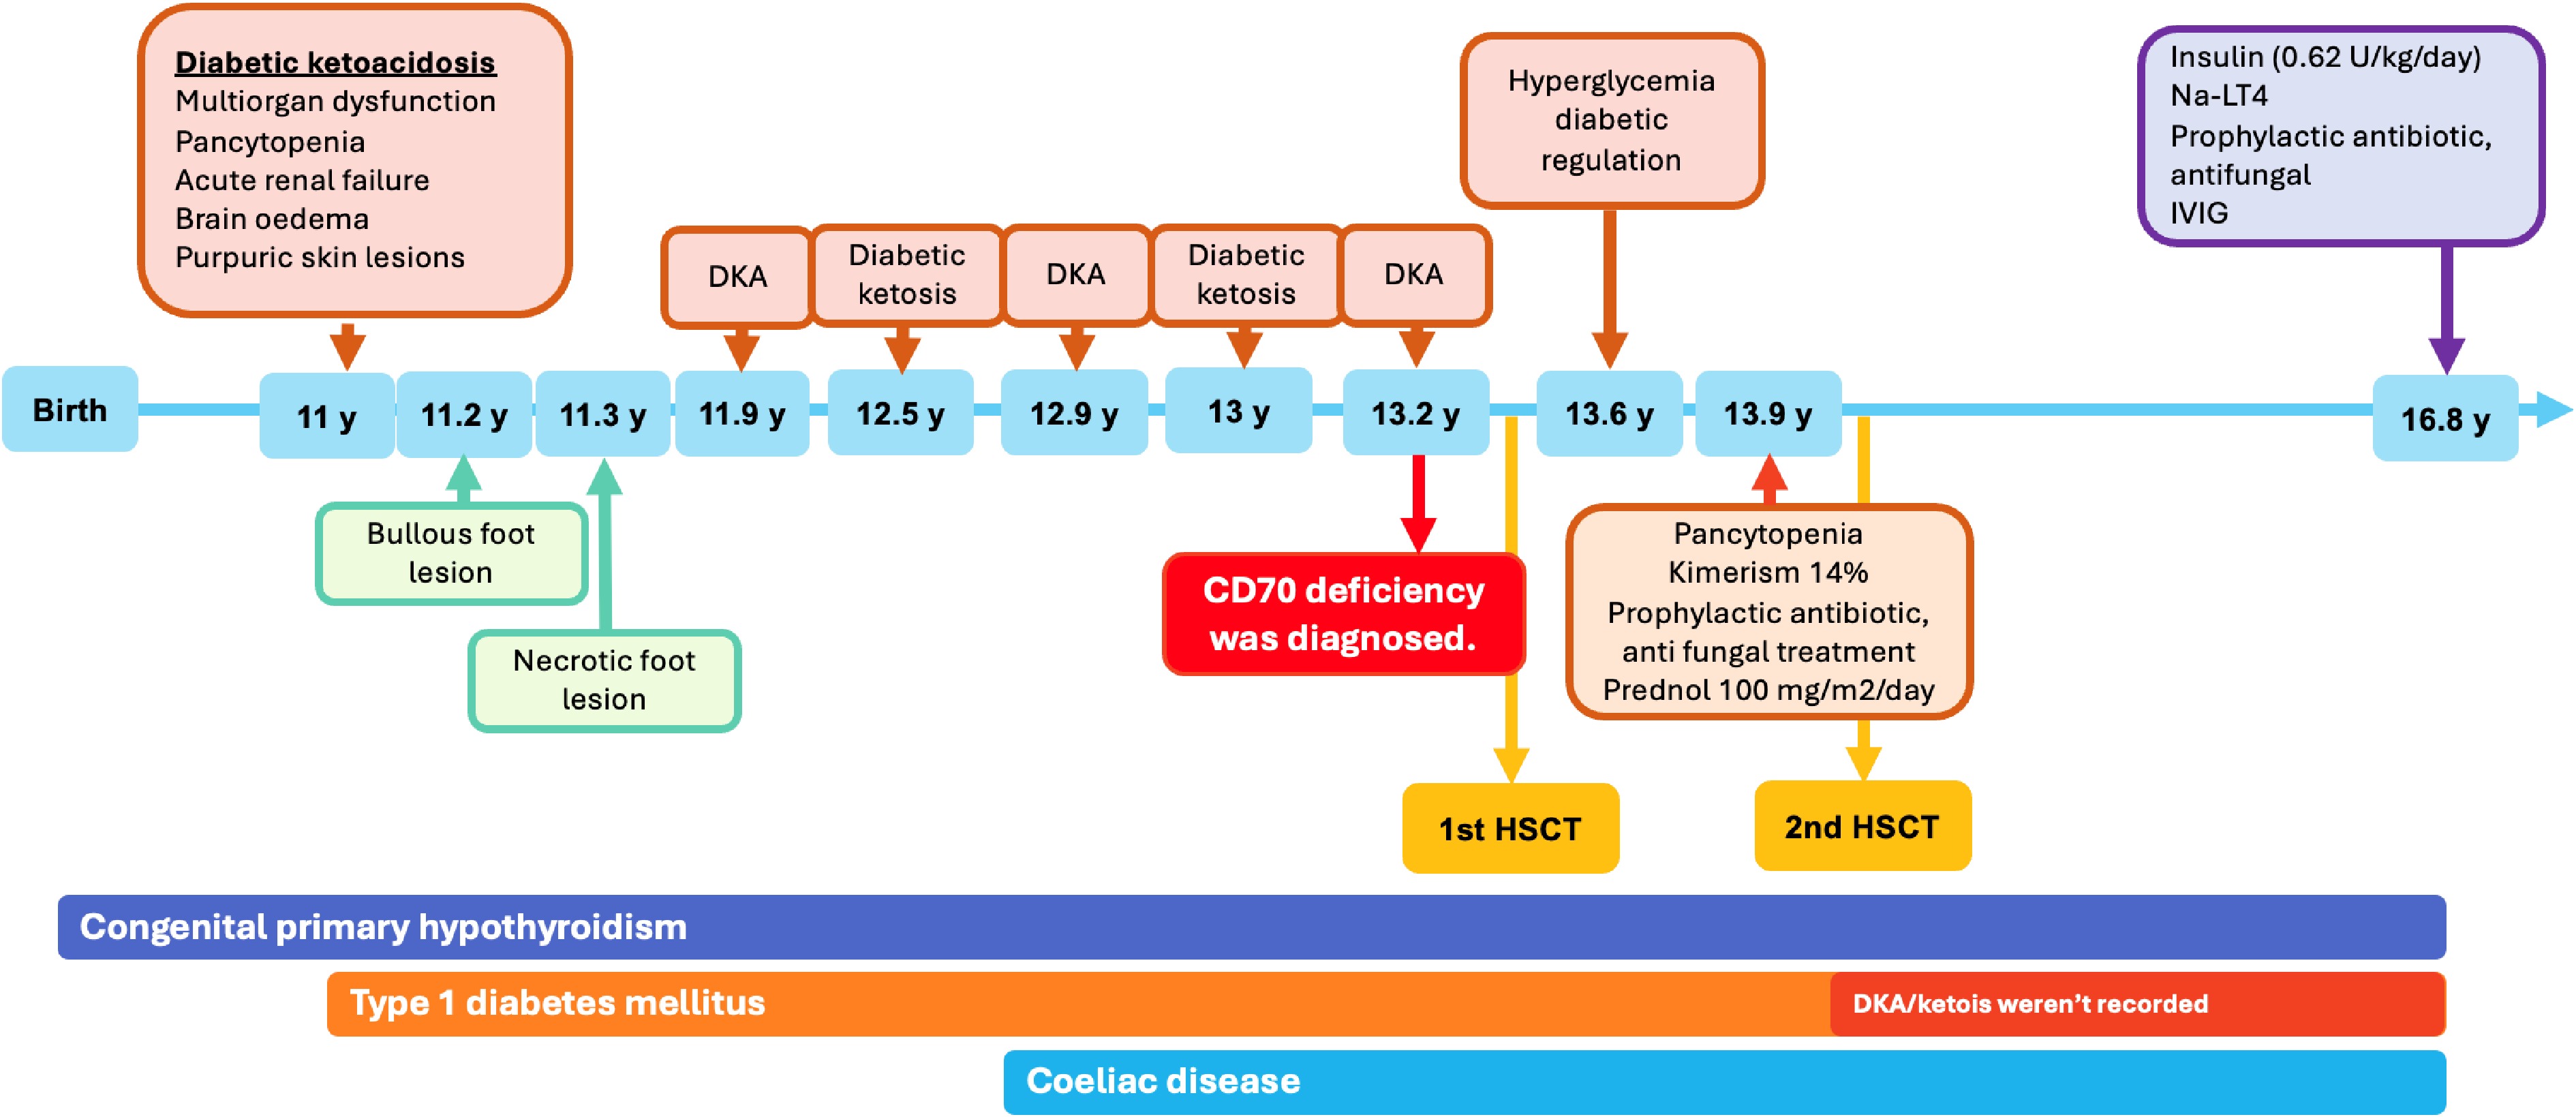
Figure 3.
Timeline for the course of symptoms in CD70 deficiency. DKA: diabetic ketoacidosis, HSCT: hematopoietic stem cell transplantation, IVIG: intravenous immunoglobulin, y: years, Na-LT4: Na-levothyroxine.
-
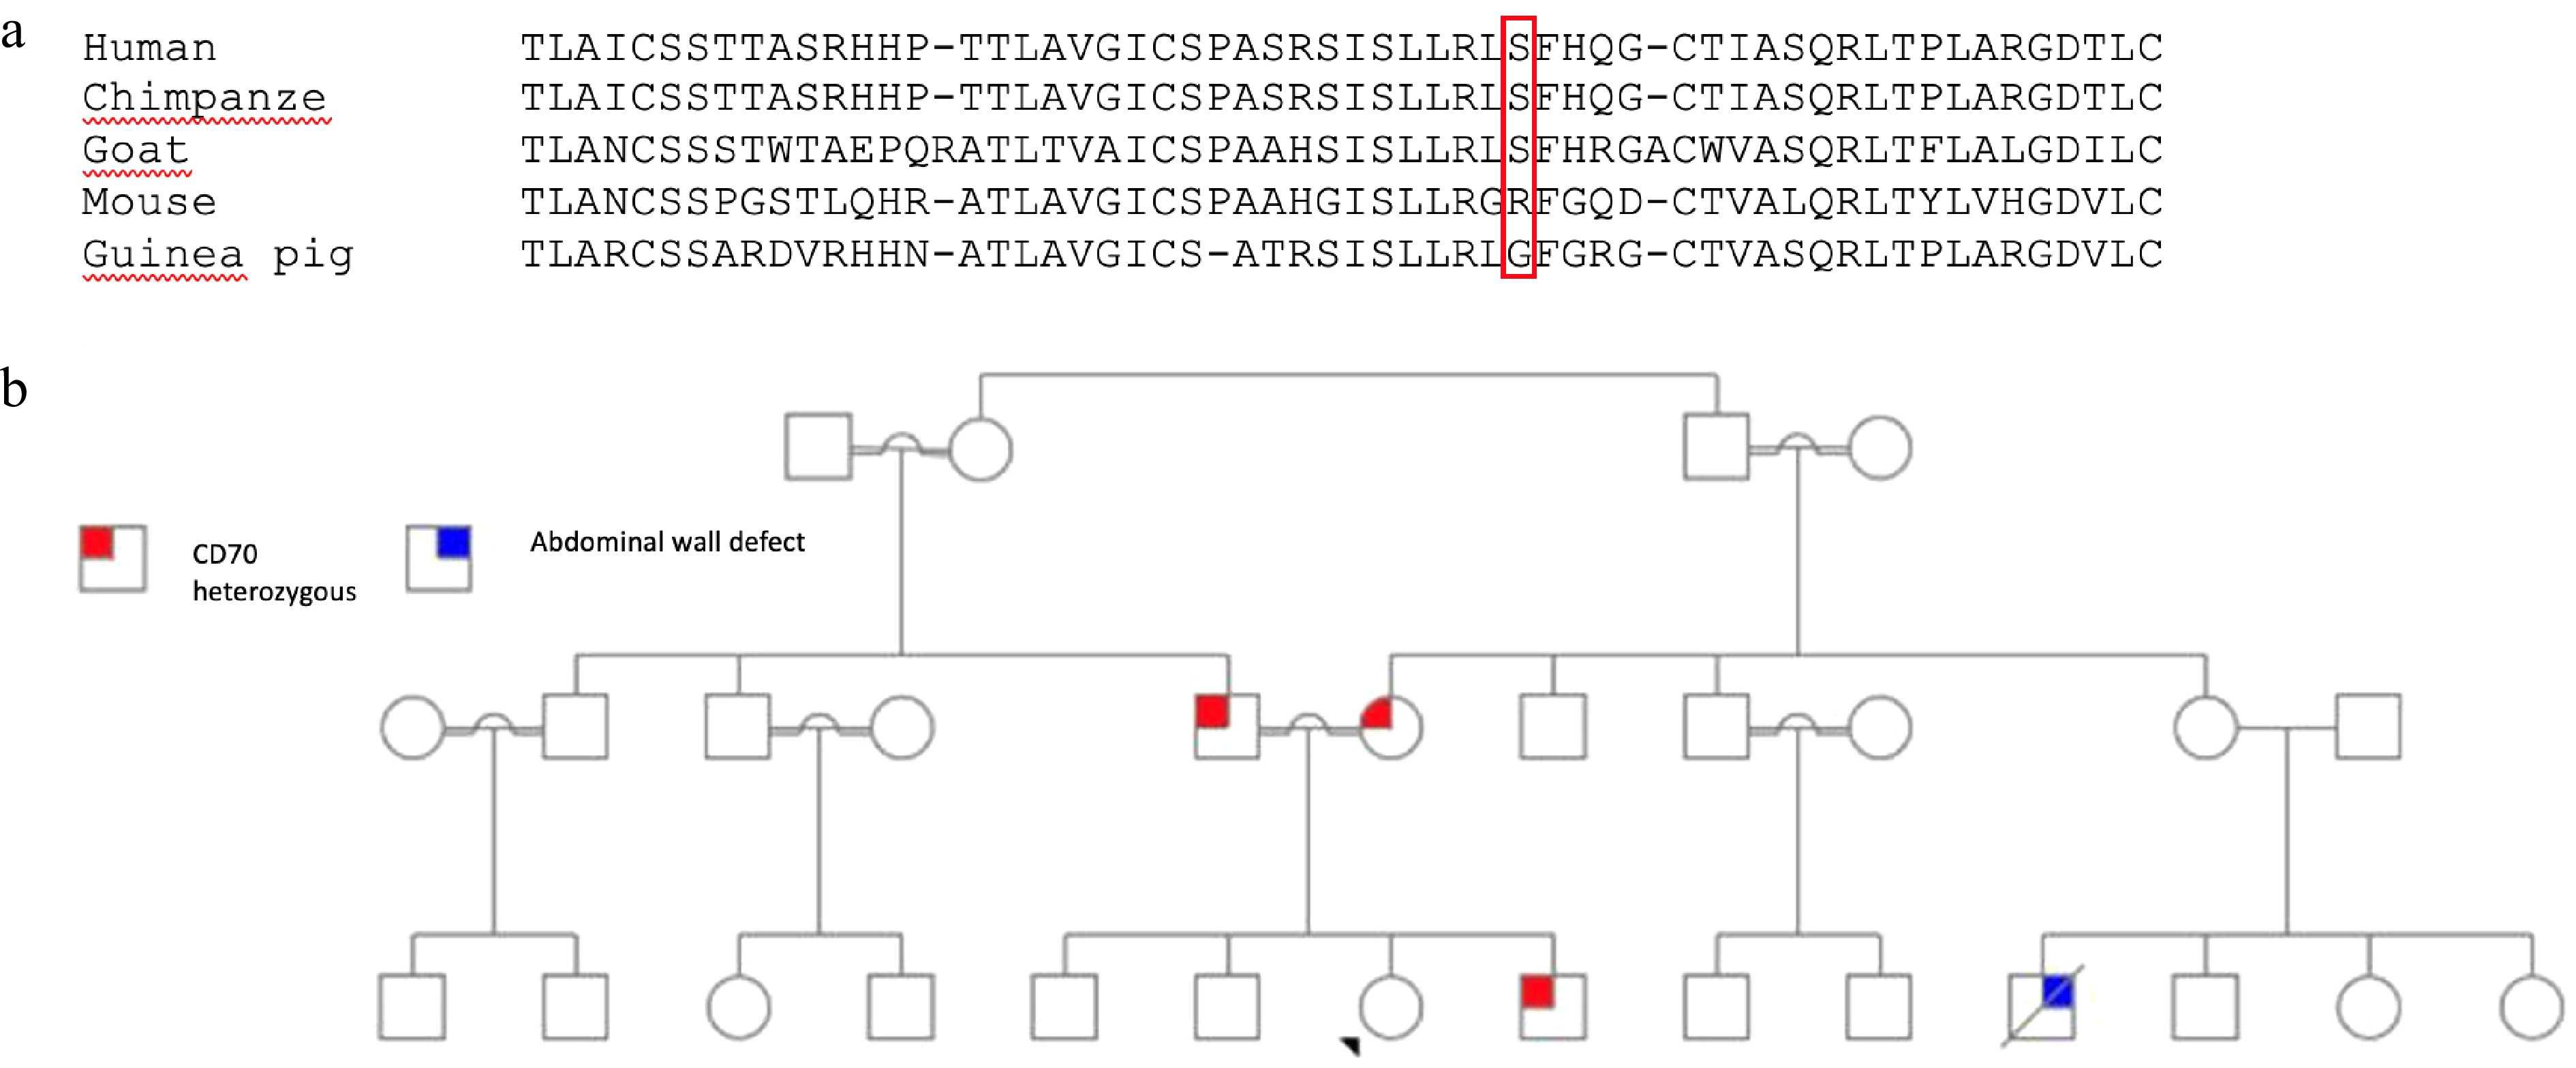
Figure 4.
(a) Multiple sequence alignment of CD70 orthologs from five species (human, chimpanzee, goat, mouse, and guinea pig) generated using Clustal W (v2.1). Position p.S146 in the human sequence is indicated by a red rectangle. (b) Pedigree of the proband. Parents and the 11-year-old brother are heterozygous carriers of the mutation.
-
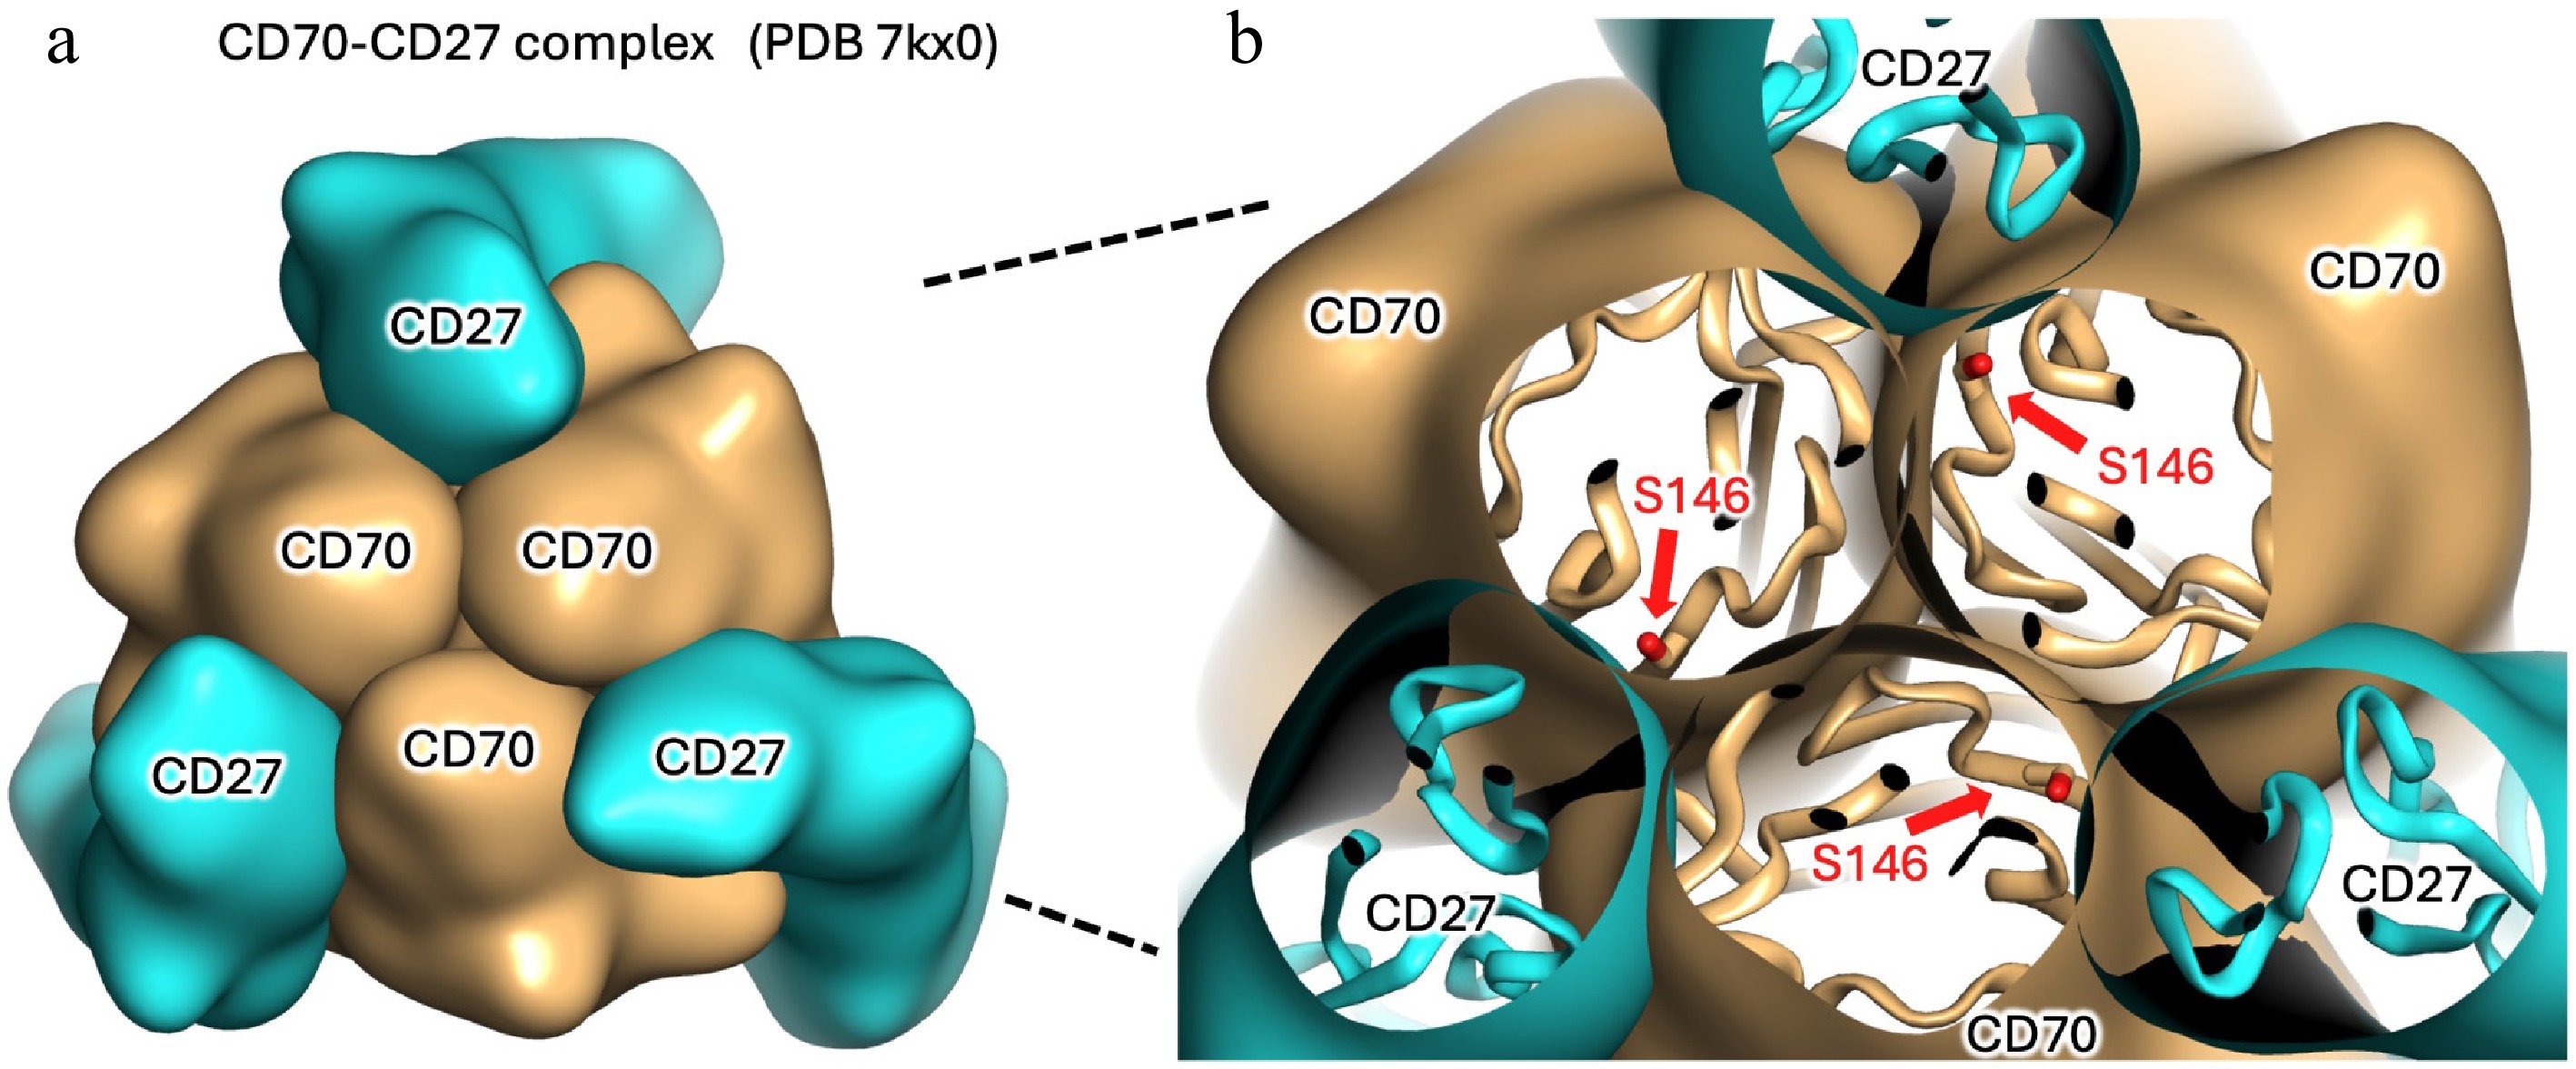
Figure 5.
Structural depiction of the CD70-CD27 complex. (a) Smoothed surface representation showing a trimer of CD70 molecules (tan surfaces, as might be projected from the exterior of an antigen-presenting cell), bound along protomer interfaces by three molecules of CD27 (cyan surfaces, as might be projected from the surface of an adjacent T-cell). (b) Cut-away section revealing polypeptide folds (ribbons) and residue S146 of CD70 shown as sticks. S146 is located at the surface of each CD70 protomer, adjacent to the CD27 binding site. The image was generated using Pymol using coordinates from Protein Data Bank entry 7kx0[18].
-
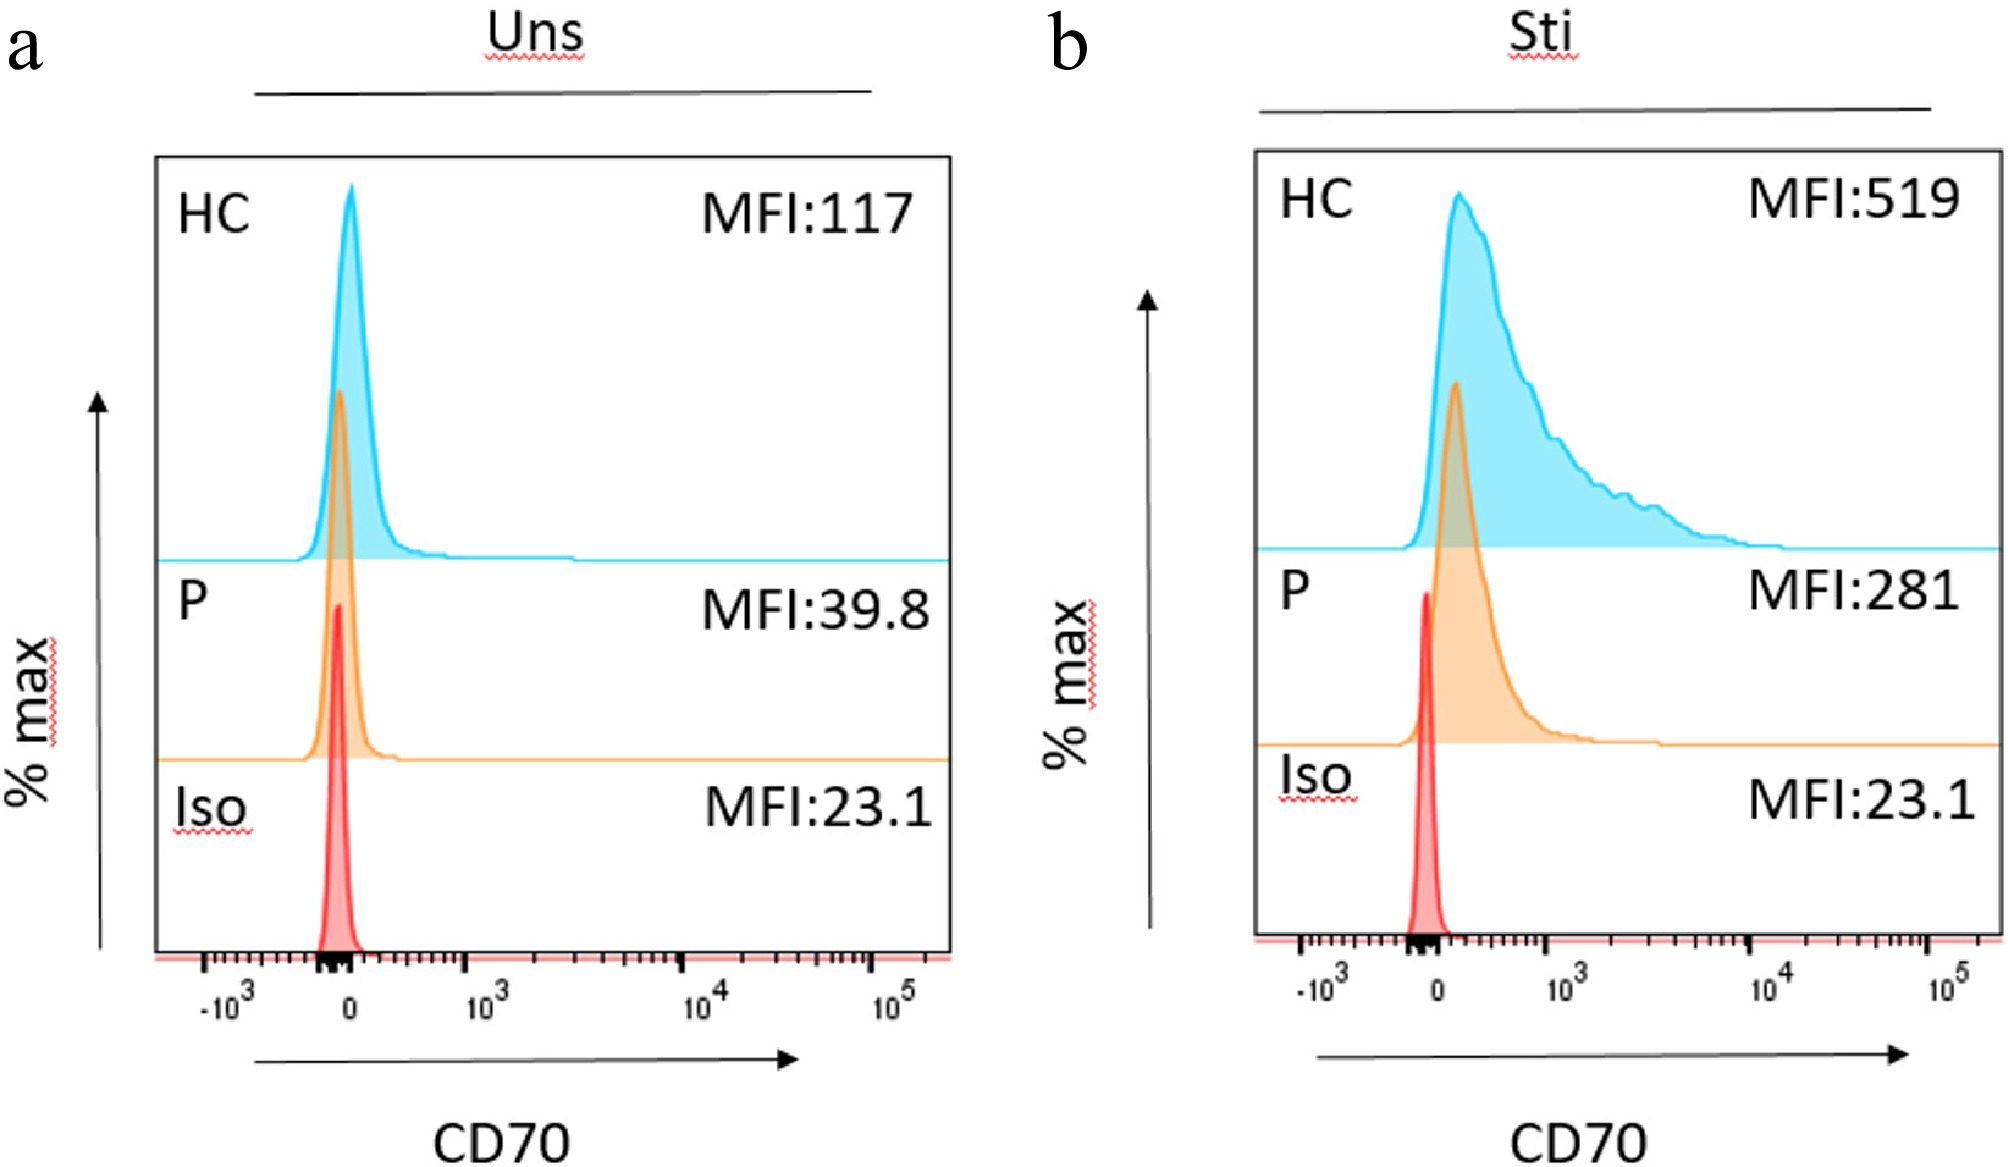
Figure 6.
Flow cytometric CD70 expression in unstimulated (uns) and stimulated (sti) cells. Histograms show CD70 expression in healthy control (HC, blue), patient (P, orange), and isotype control (Iso, red). (a) Unstimulated condition: CD70 expression was minimal in the patient and control, with lower median fluorescence intensity (MFI) in the patient (MFI = 39.8) compared to the healthy control (MFI = 117). (b) Following stimulation with phytohemaglutinin (PHA) and interleukin (IL)-2, CD70 expression was markedly induced, with higher MFI values observed in healthy control (MFI = 519) relative to patient (MFI = 281). These findings indicate impaired upregulation of CD70 in the patient cells upon activation compared to control.
-
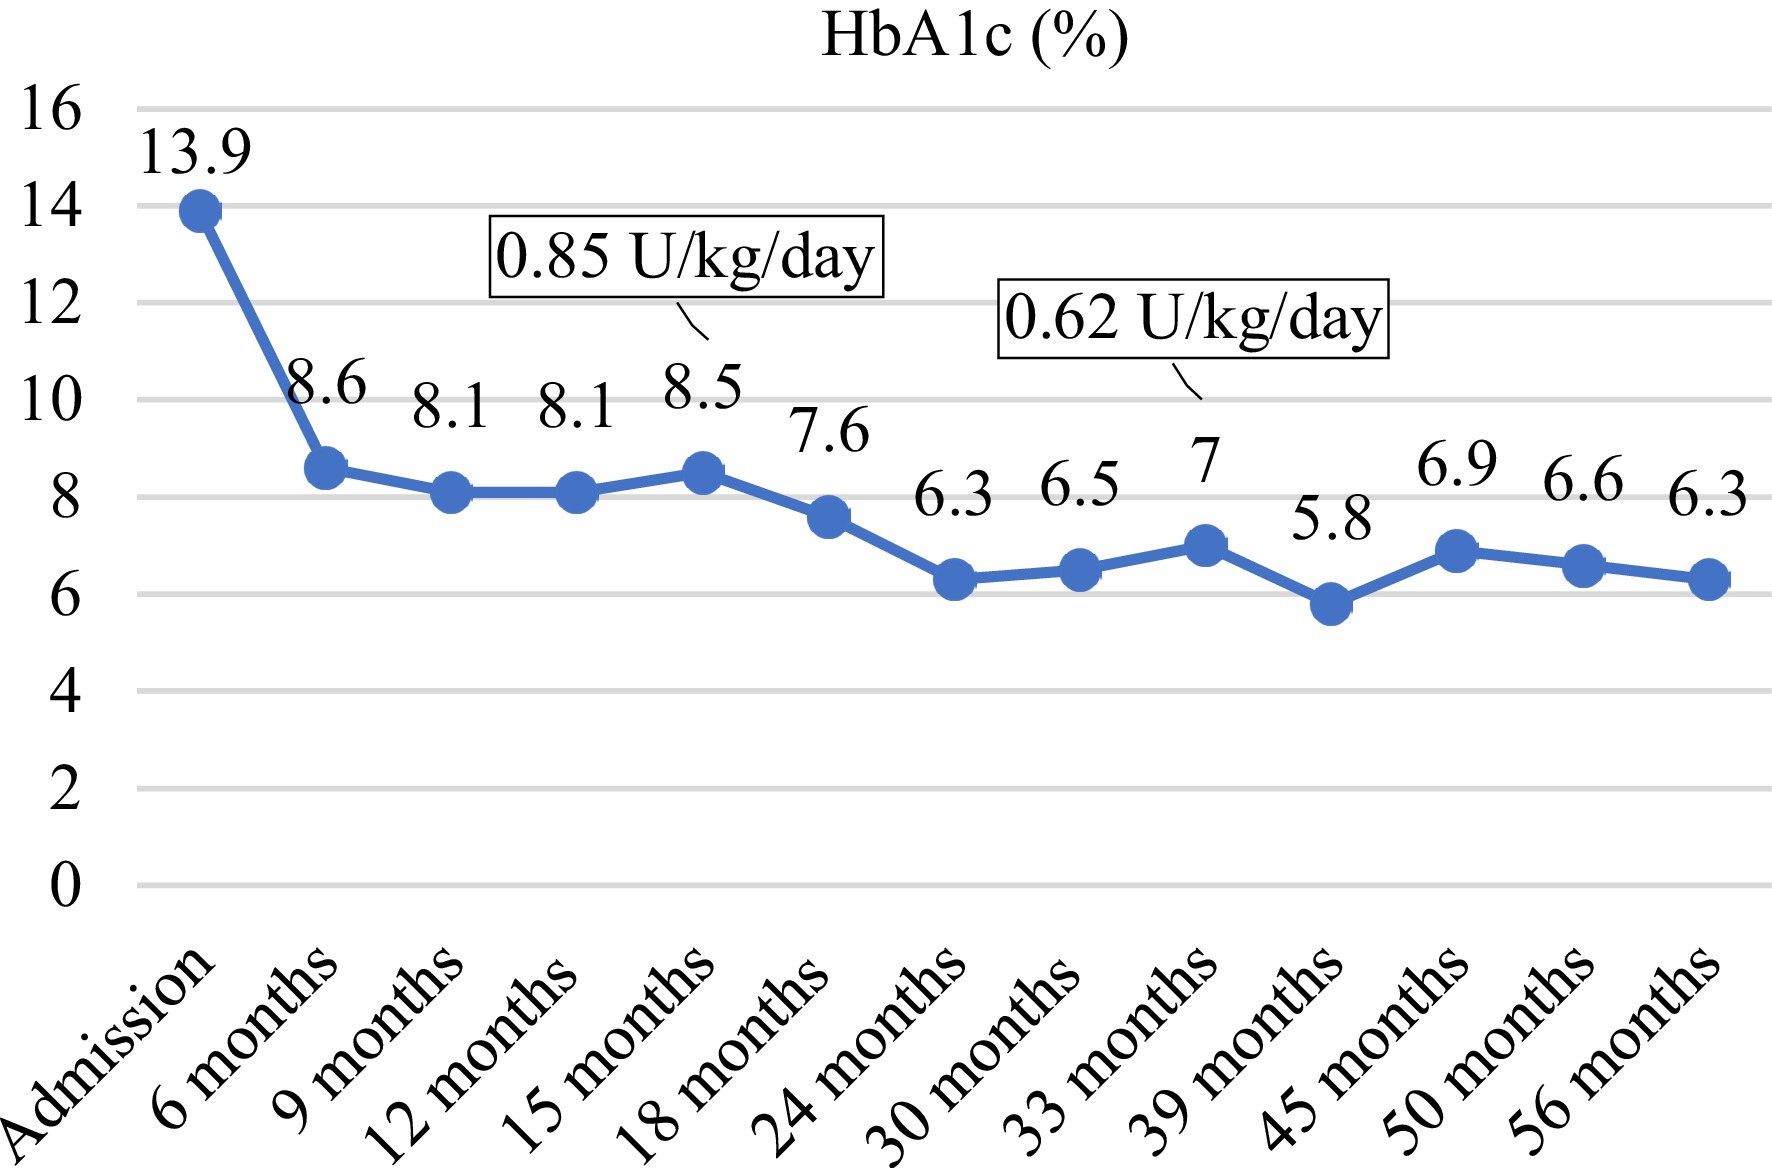
Figure 7.
Change in HbA1c. Months denote time spent following the first admission. The first HSCT was performed at 18 months, and the second HSCT was performed at 24 months.
-
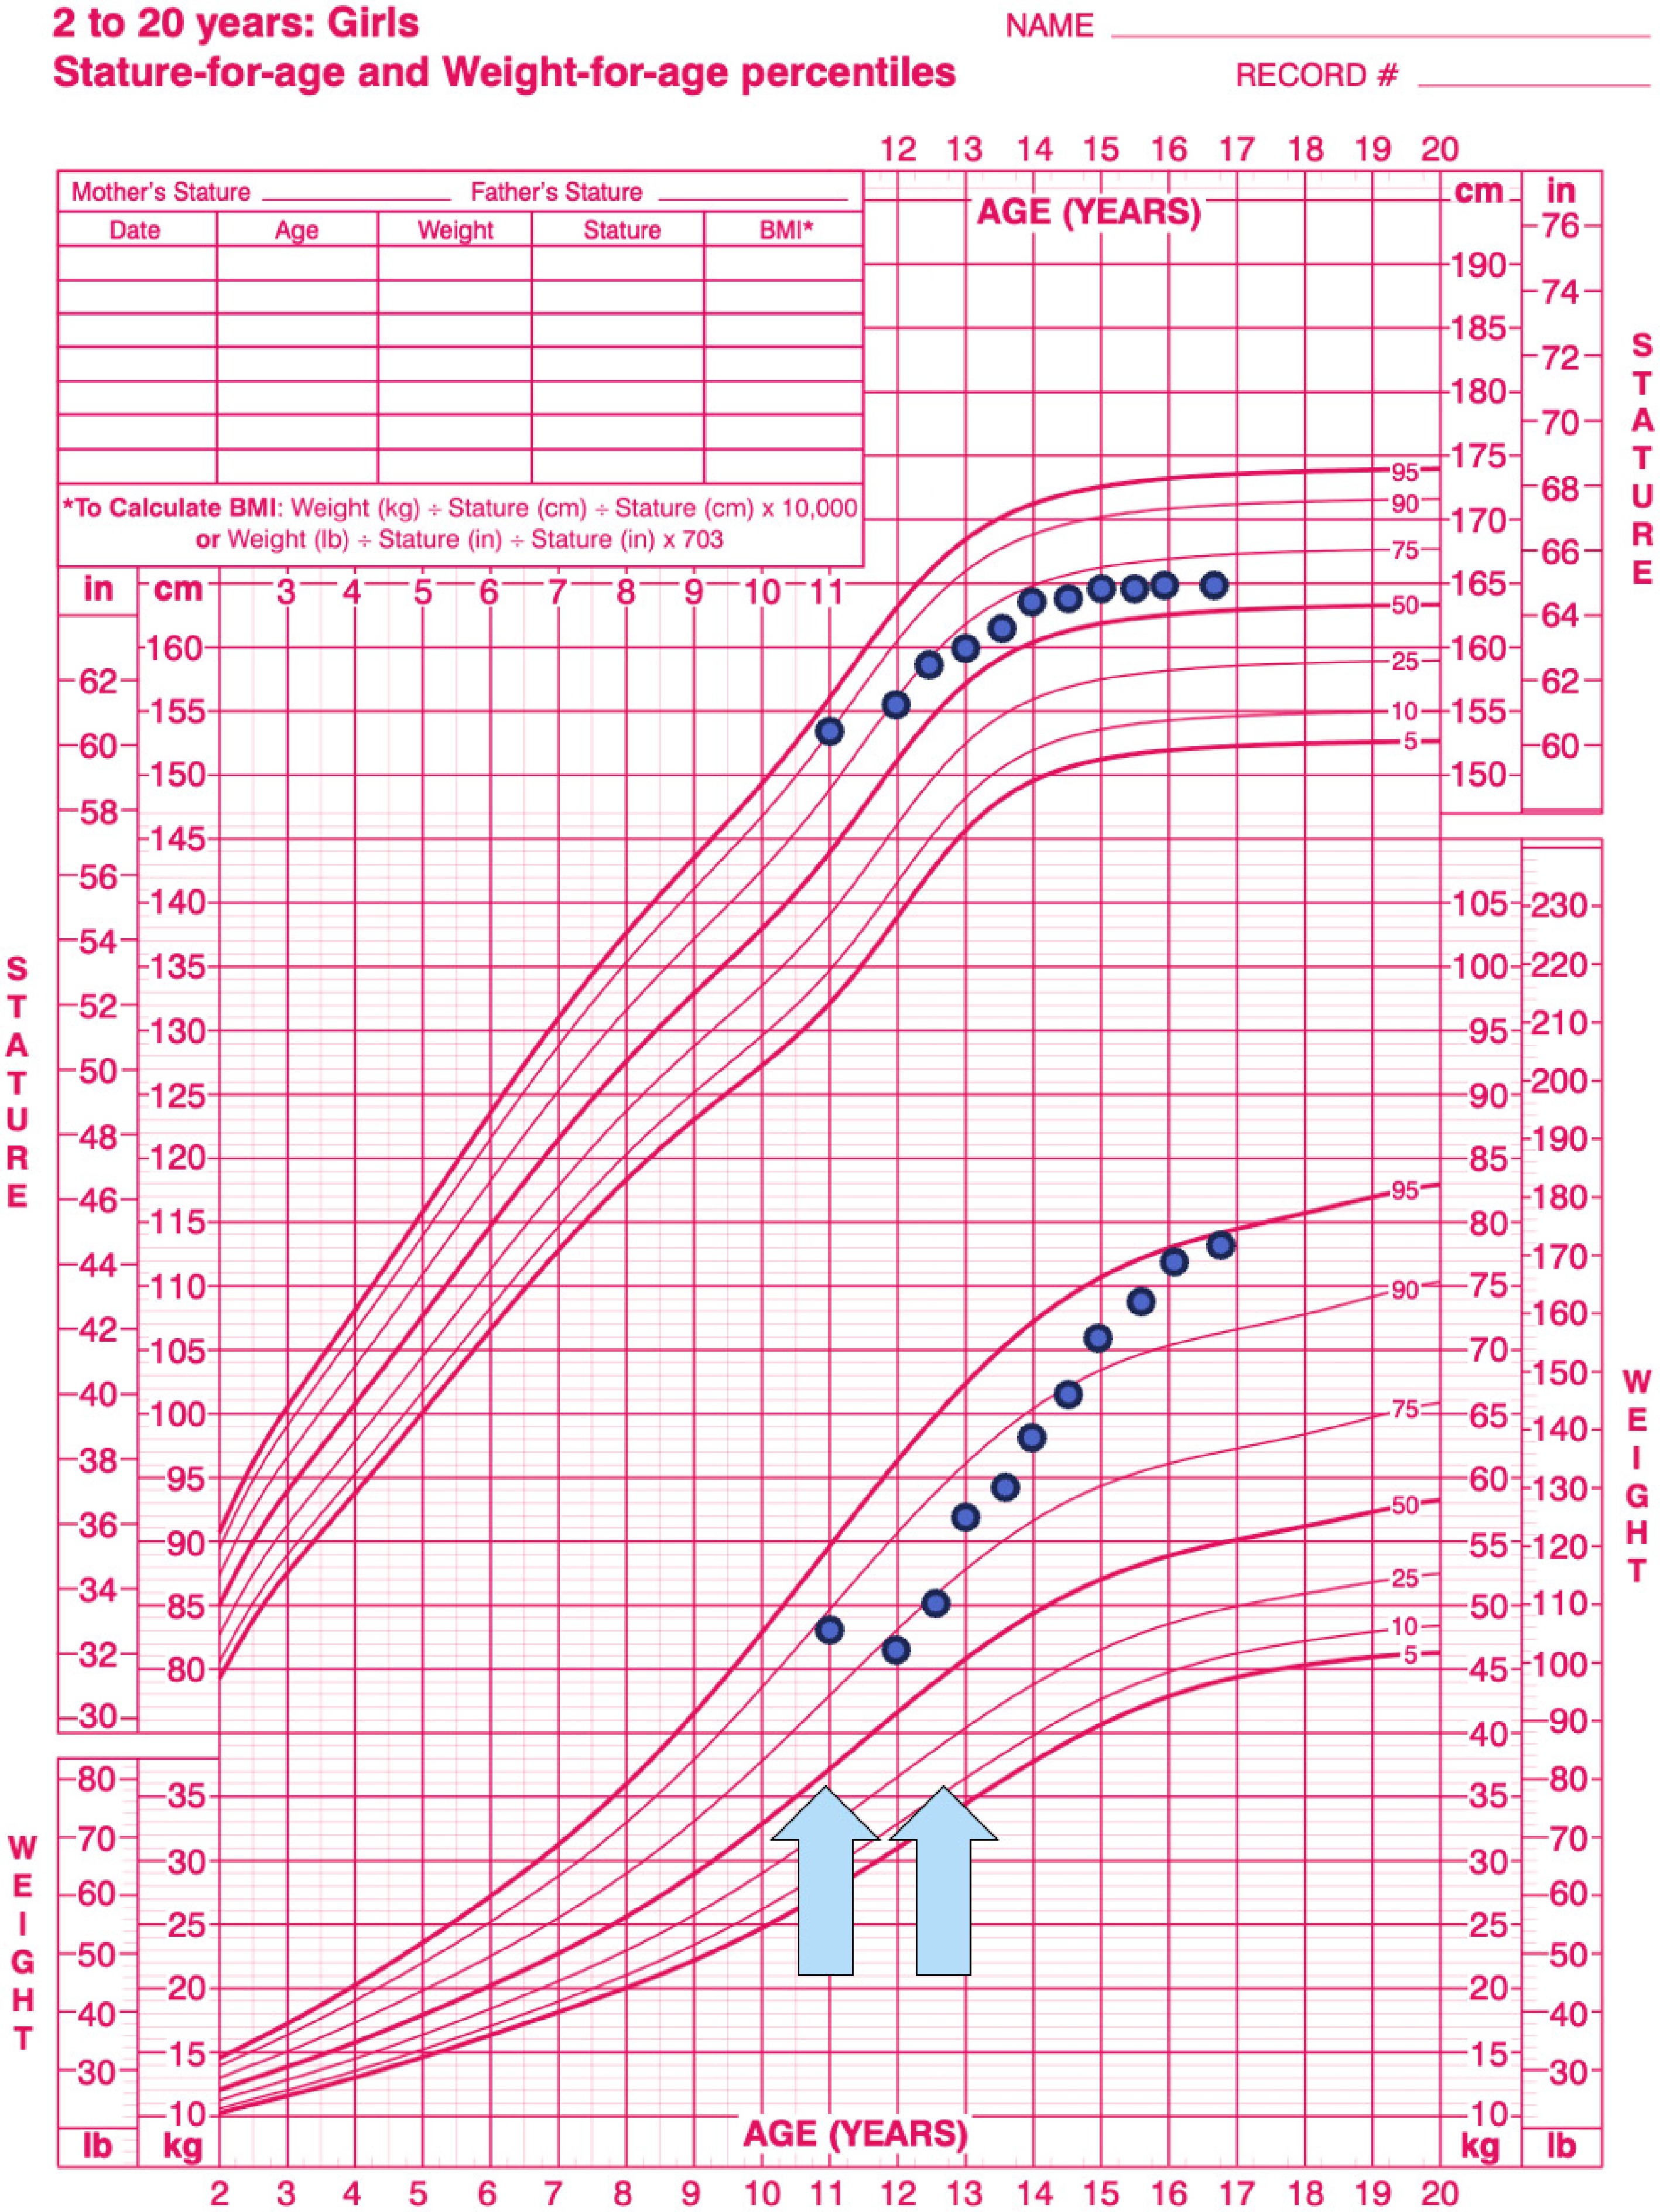
Figure 8.
Shows the growth chart of the case with CD70 deficiency. The first arrow depicts her presentation with severe diabetic ketoacidosis, and the second arrow depicts the diagnosis of coeliac disease.
-
On admission Last clinical visit Hemoglobin (gr/dl) (11.5–15.5) 10.9 12.2 Leucocyte (103/μL) (5,000–13,000) 3,400 4,300 Trombocyte (103/μL) (180,000–400,000) 28,000 210,000 ALT (U/L) (< 39) 120 23 AST (U/L) (< 51) 449 40 Blood urea nitrogen (mg/dL) (5–18) 29 9.3 Uric acid (mg/dL) (2.6–6) 8.9 4.3 Creatinine (mg/dL) (0.3–0.8) 2.6 0.5 Sodium (mEq/L) (135–145) 141 139 Potassium (mEq/L) (3.4–4.7) 3.1 4.5 Calcium (mg/dL) (8.8–10.8) 9.4 9.8 Phosphate (mg/dL) (3.2–5.7) 2.8 4.1 Creatine kinase (U/L) (< 145) 51,142 NA Coagulation parameters INR (0.8–1.2) 1.5 1.1 aPTT (sn) (22.5–32) 36.2 22.1 Fibrinogen (mg/dL) (180–350) 193 421 d-dimer (mg/L) (0–0.55) 6.6 0.19 Blood gas pH 6.8 7.38 HCO3 (mmol/L) 6.2 23.5 pCO2 (mmHg) 27.9 40.5 Urine sample Density (1,003–1,030) 1,019 Protein (Negative) 2+ Blood (Negative) 2+ Glucose (Negative) 4+ Ketone (Negative) 3+ Endocrine evaluation Blood glucose (mg/dl) (70–100) > 500 148 Insulin (μIU/ml) 1.5 NA c-peptide (ng/mL) 1.13 0.1 HbA1c (%) (3.5–5.8) 13.6 6.3 Anti-GAD65 (U/mL) (< 1) 1.85 0.1 Anti-IA-2 (IU/L) (< 1) 17.99 0.01 ACTH (pg/mL) (0–46) 692 NA Cortisol (μg/dL) (6.7–22.6) 39.58 NA TSH (mIU/mL) (0.4–5.3) 1.5 4.8 FT4 (pmol/L) (7.8–13.7) 12.9 11.3 Anti-TPO (IU/mL) (0–9) 0.3 3.1 Anti-Tg (IU/mL) (0–4) 0.9 0.9 IgA (mg/dL) (67–433) 147 140 TTg IgA (RU/mL) (0–20) 18 Negative Table 1.
Laboratory evaluation on admission and on the last clinical visit (laboratory normative data are provided in parentheses).
-
On admission (11 year 3 months) One year after HSCT 33 months after HSCT Leukocytes (cells/mm3) 4,700 (4,500–13,500) 5,290 (4,500–13,500) 5,820 (4,500–13,500) Absolute lymphocyte count (cells/mm3) 2,600 (1,500–5,000) 2,650 (1,500–5,000) 3,140 (1,500–5,000) Absolute neutophil count (cells/mm3) 1,700 (1,800–8,000) 2,210 (1,800–8,000) 2,220 (1,800–8,000) Serum immunoglobulin[14] IgG (mg/dL) 988 (835–2,094) 1,090* 1,260* IgA (mg/dL) 147 (67–433) 28.3 (100−447) 29.7 (100−447) IgM (mg/dL) 168 (47−484) 219 (75−448) 119 (75−448) Antibody response Isohemaglutinins Anti-A 1/256 NA NA Anti-B Negative NA NA Anti HBs (mIU/mL) 20.44 NA 367.3 Lymphocyte subsets[15] CD3 (%) 68(60−76) 79 (56−84) 70 (56−84) CD4 (%) 32(31−47) 25 (31−52) 28 (31−52) CD8 (%) 31(18−35) 49 (18−35) 38 (18−35) CD16+56 (%) 7(4−17) 2 (3−22) 2 (3−22) CD19 (%) 23(13−27) 18 (6−23) 28 (6−23) CD45RA (%) 57(46−77) NA NA CD45RO (%) 31(20−46) NA NA TCR Alpha-Beta (%) 67 NA NA TCR Gamma-Delta (%) 4 NA NA TCR Alpha-Beta + CD4-CD8− 8 4 2 B cell subsets[16] CD20+ (%) 13 NA 21 Memory (CD19+CD27+) (%) 12.7 (13.3−47.9) NA 12.3 (13.3−47.9) Switched-memory(CD19+CD27+IgD−) (%) 10.5 (4.6−18.2) NA 7.4 (4.6−18.2) Marginal zone (CD19+CD27+IGD+) (%) 2.2 (4.6−18.2) NA 4.9 (4.6−18.2) Naive (CD19+CD27−IGD+) (%) 82.9 (51.3−82.5) NA 84.4 (51.3−82.5) Activated (CD19+CD38−CD21low) (%) 1.1 (2.7−8.7) NA 0.3 (2.7−8.7) Plasmablast (CD19+CD38+high IgM−) (%) 0.3 (0.6−6.5) NA 1 (0.6−6.5) Transitional (CD19+CD38+high IgMhigh) (%) 1.1(1.4−13) NA 2.8 (1.4−13) T cell subsets[17] CD4+ cell rate (%) 35 (29−59) NA 27 (29−59) Naive TH (CD4+CCR7+CD45RA+) (%) 77.4 (57.1−84.9) NA 55.5 (57.1−84.9) Central memory TH (CD4+CCR7+CD45RA−) (%) 4.7 (11.3−26.7) NA 0.4 (11.3−26.7) Effector memory TH (CD4+CCR7−CD45RA−) (%) 5.5 (3.3−15.2) NA 2.6 (3.3−15.2) TEMRA (CD4+CCR7−CD45RA+) (%) 12.2 (0.4−2.6) NA 41.4 (0.4−2.6) RTE (CD4+CD31+CD45RA+) (%) 57 (31−81)) NA 37 (31−81) CD8+ cell rate (%) 35 (19−29) NA 46 (19−29) Naive TC (CD8+CCR7+CD45RA+) (%) 34.5 (28.4−80.6) NA 19.8 (28.4−80.6) Central memory TC (CD8+CCR7+CD45RA−) (%) 0.3 (1.0−4.5) NA 0.1 (1.0−4.5) Effector memory TC (CD8+CCR7− CD45RA−) (%) 9.8 (6.2−29.3) NA 0.4 (6.2−29.3) TEMRA (CD8+CCR7−CD45RA+) (%) 55.2 (9.1−49.1) NA 79.6 (9.1−49.1) Complements C3 Complement (mg/dl) 90.2 174 NA C4 Complement (mg/dl) 19.3 36 NA *After IVIG replacement Table 2.
Laboratory examination obtained from a peripheral blood sample on admission, one year, and 33 months after HSCT.
Figures
(8)
Tables
(2)