-
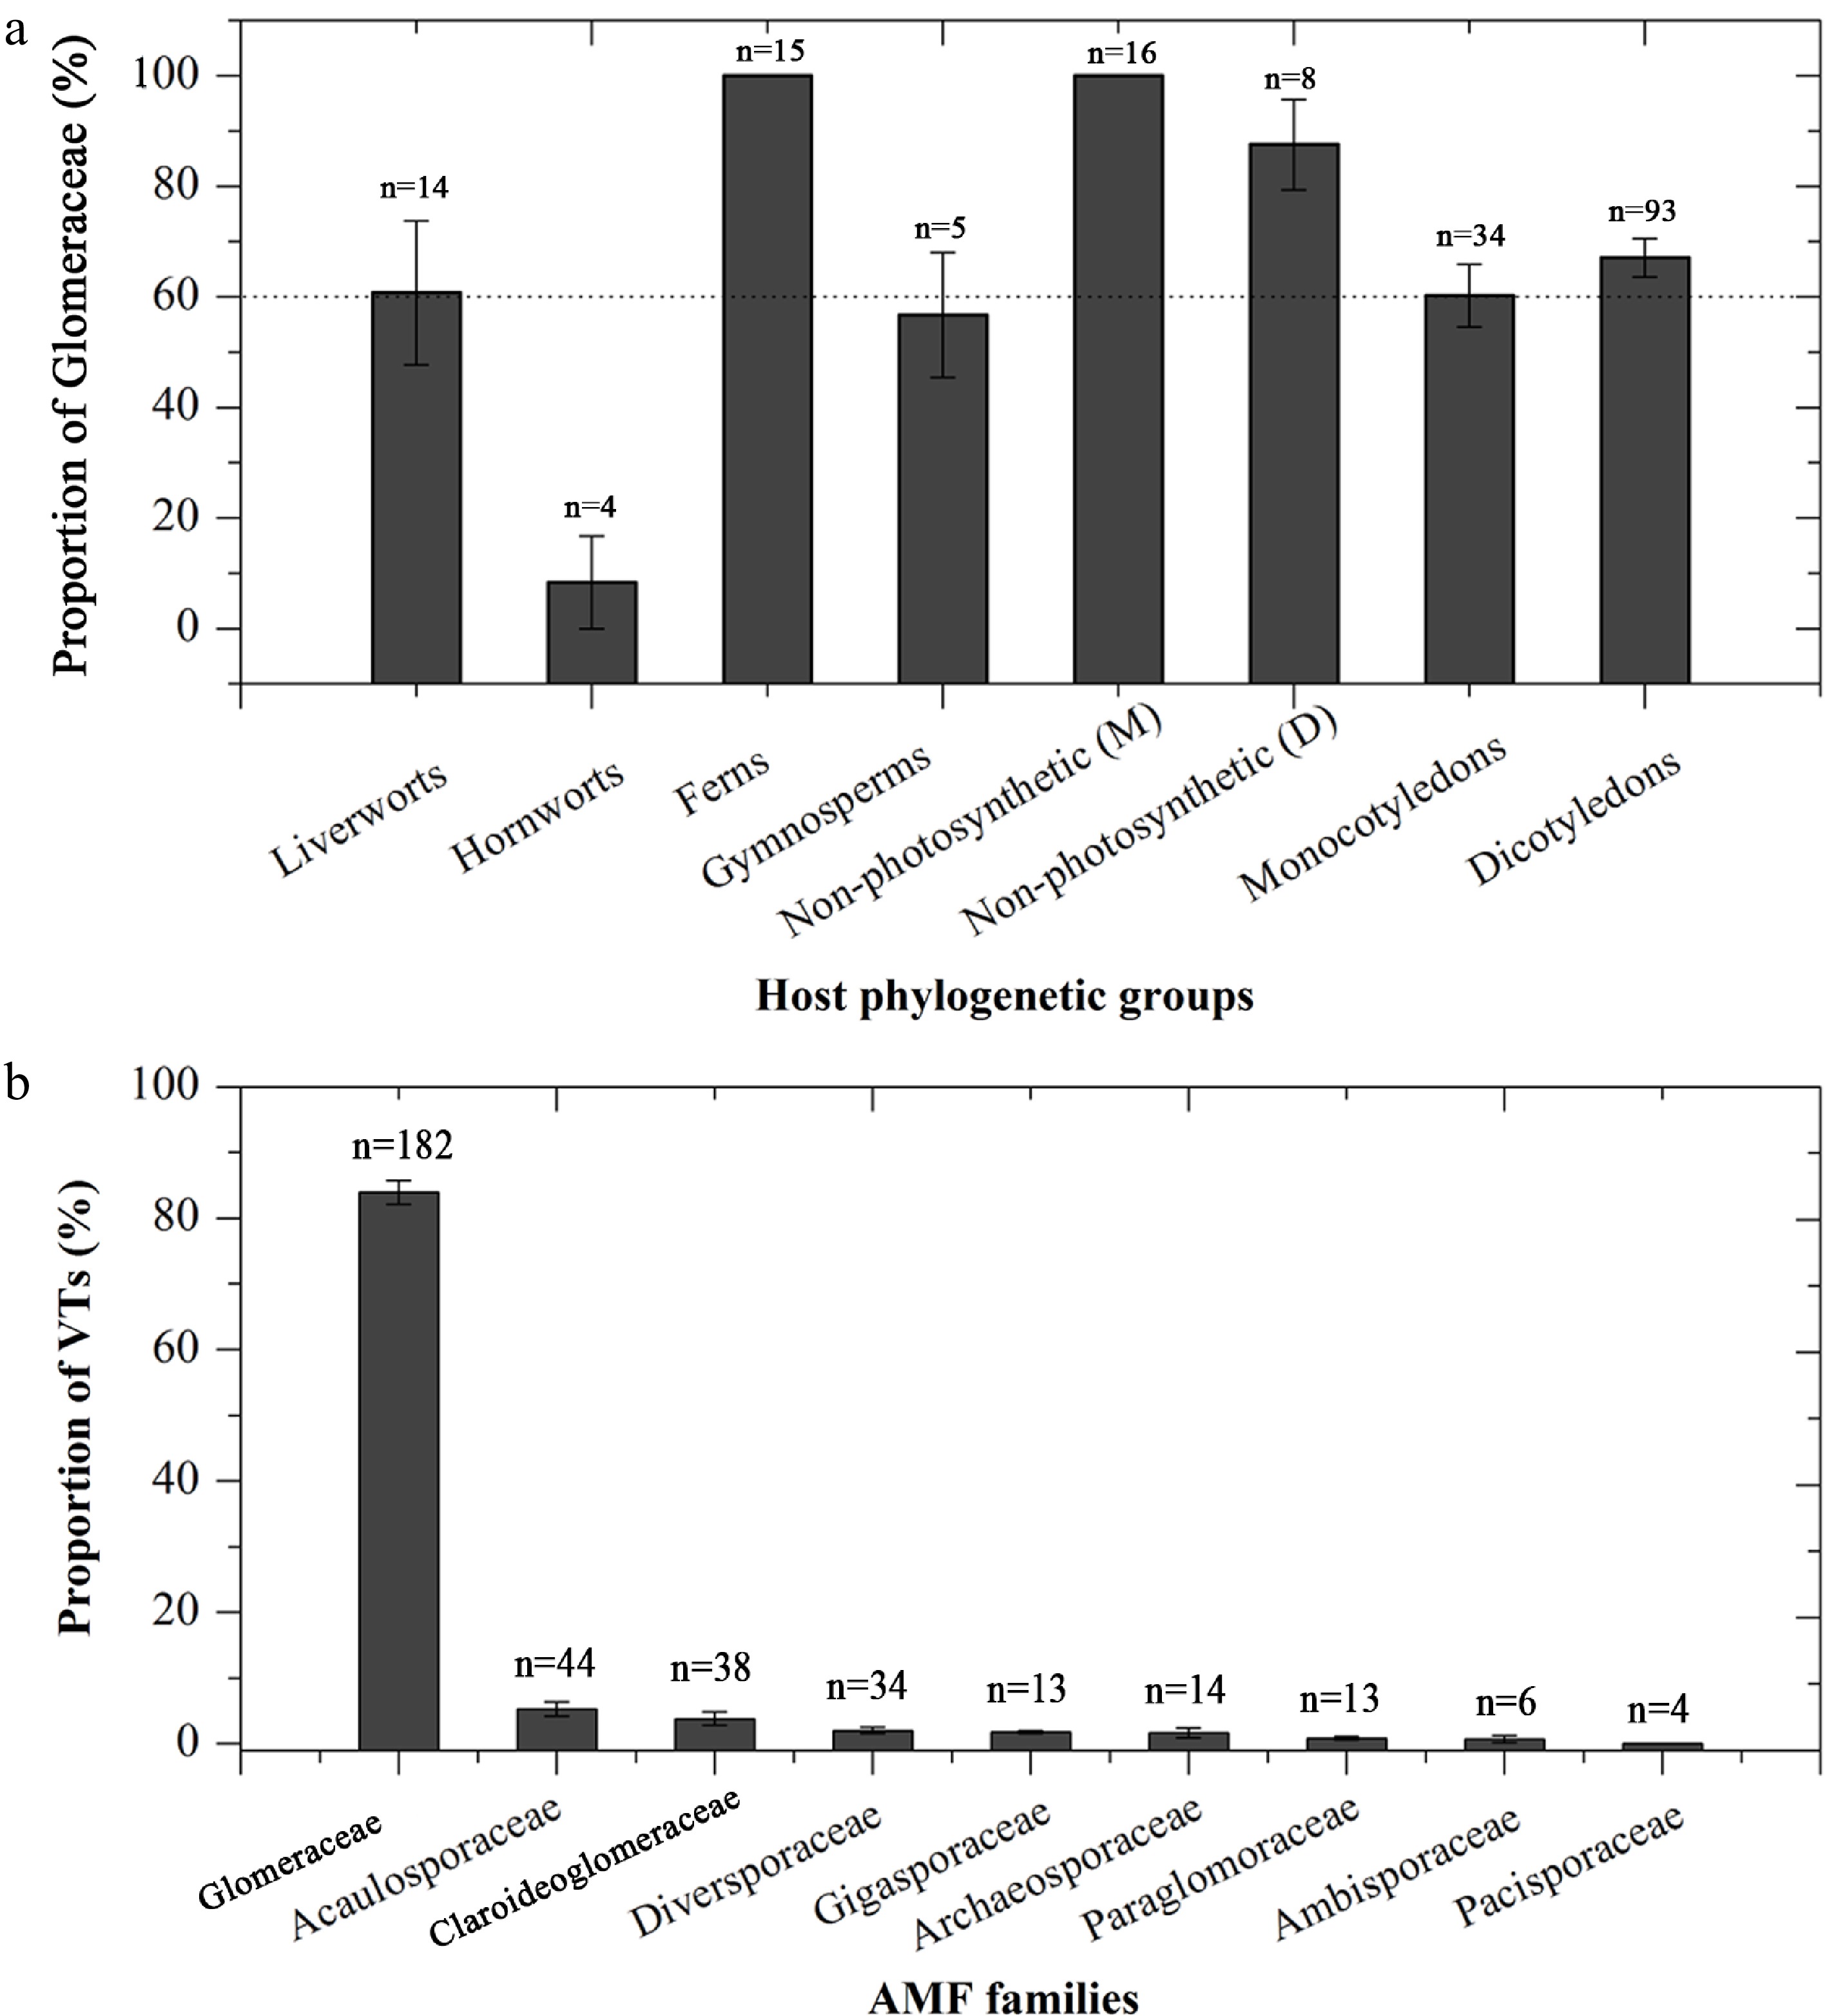
Figure 1.
(a) The conservatism of Glomeraceae among different plant phylogenetic groups, and (b) the average proportion of virtual taxa (VT) at different AMF families in roots from 188 plant species based on the MaarjAM database. Data are presented as mean ± SE.
-
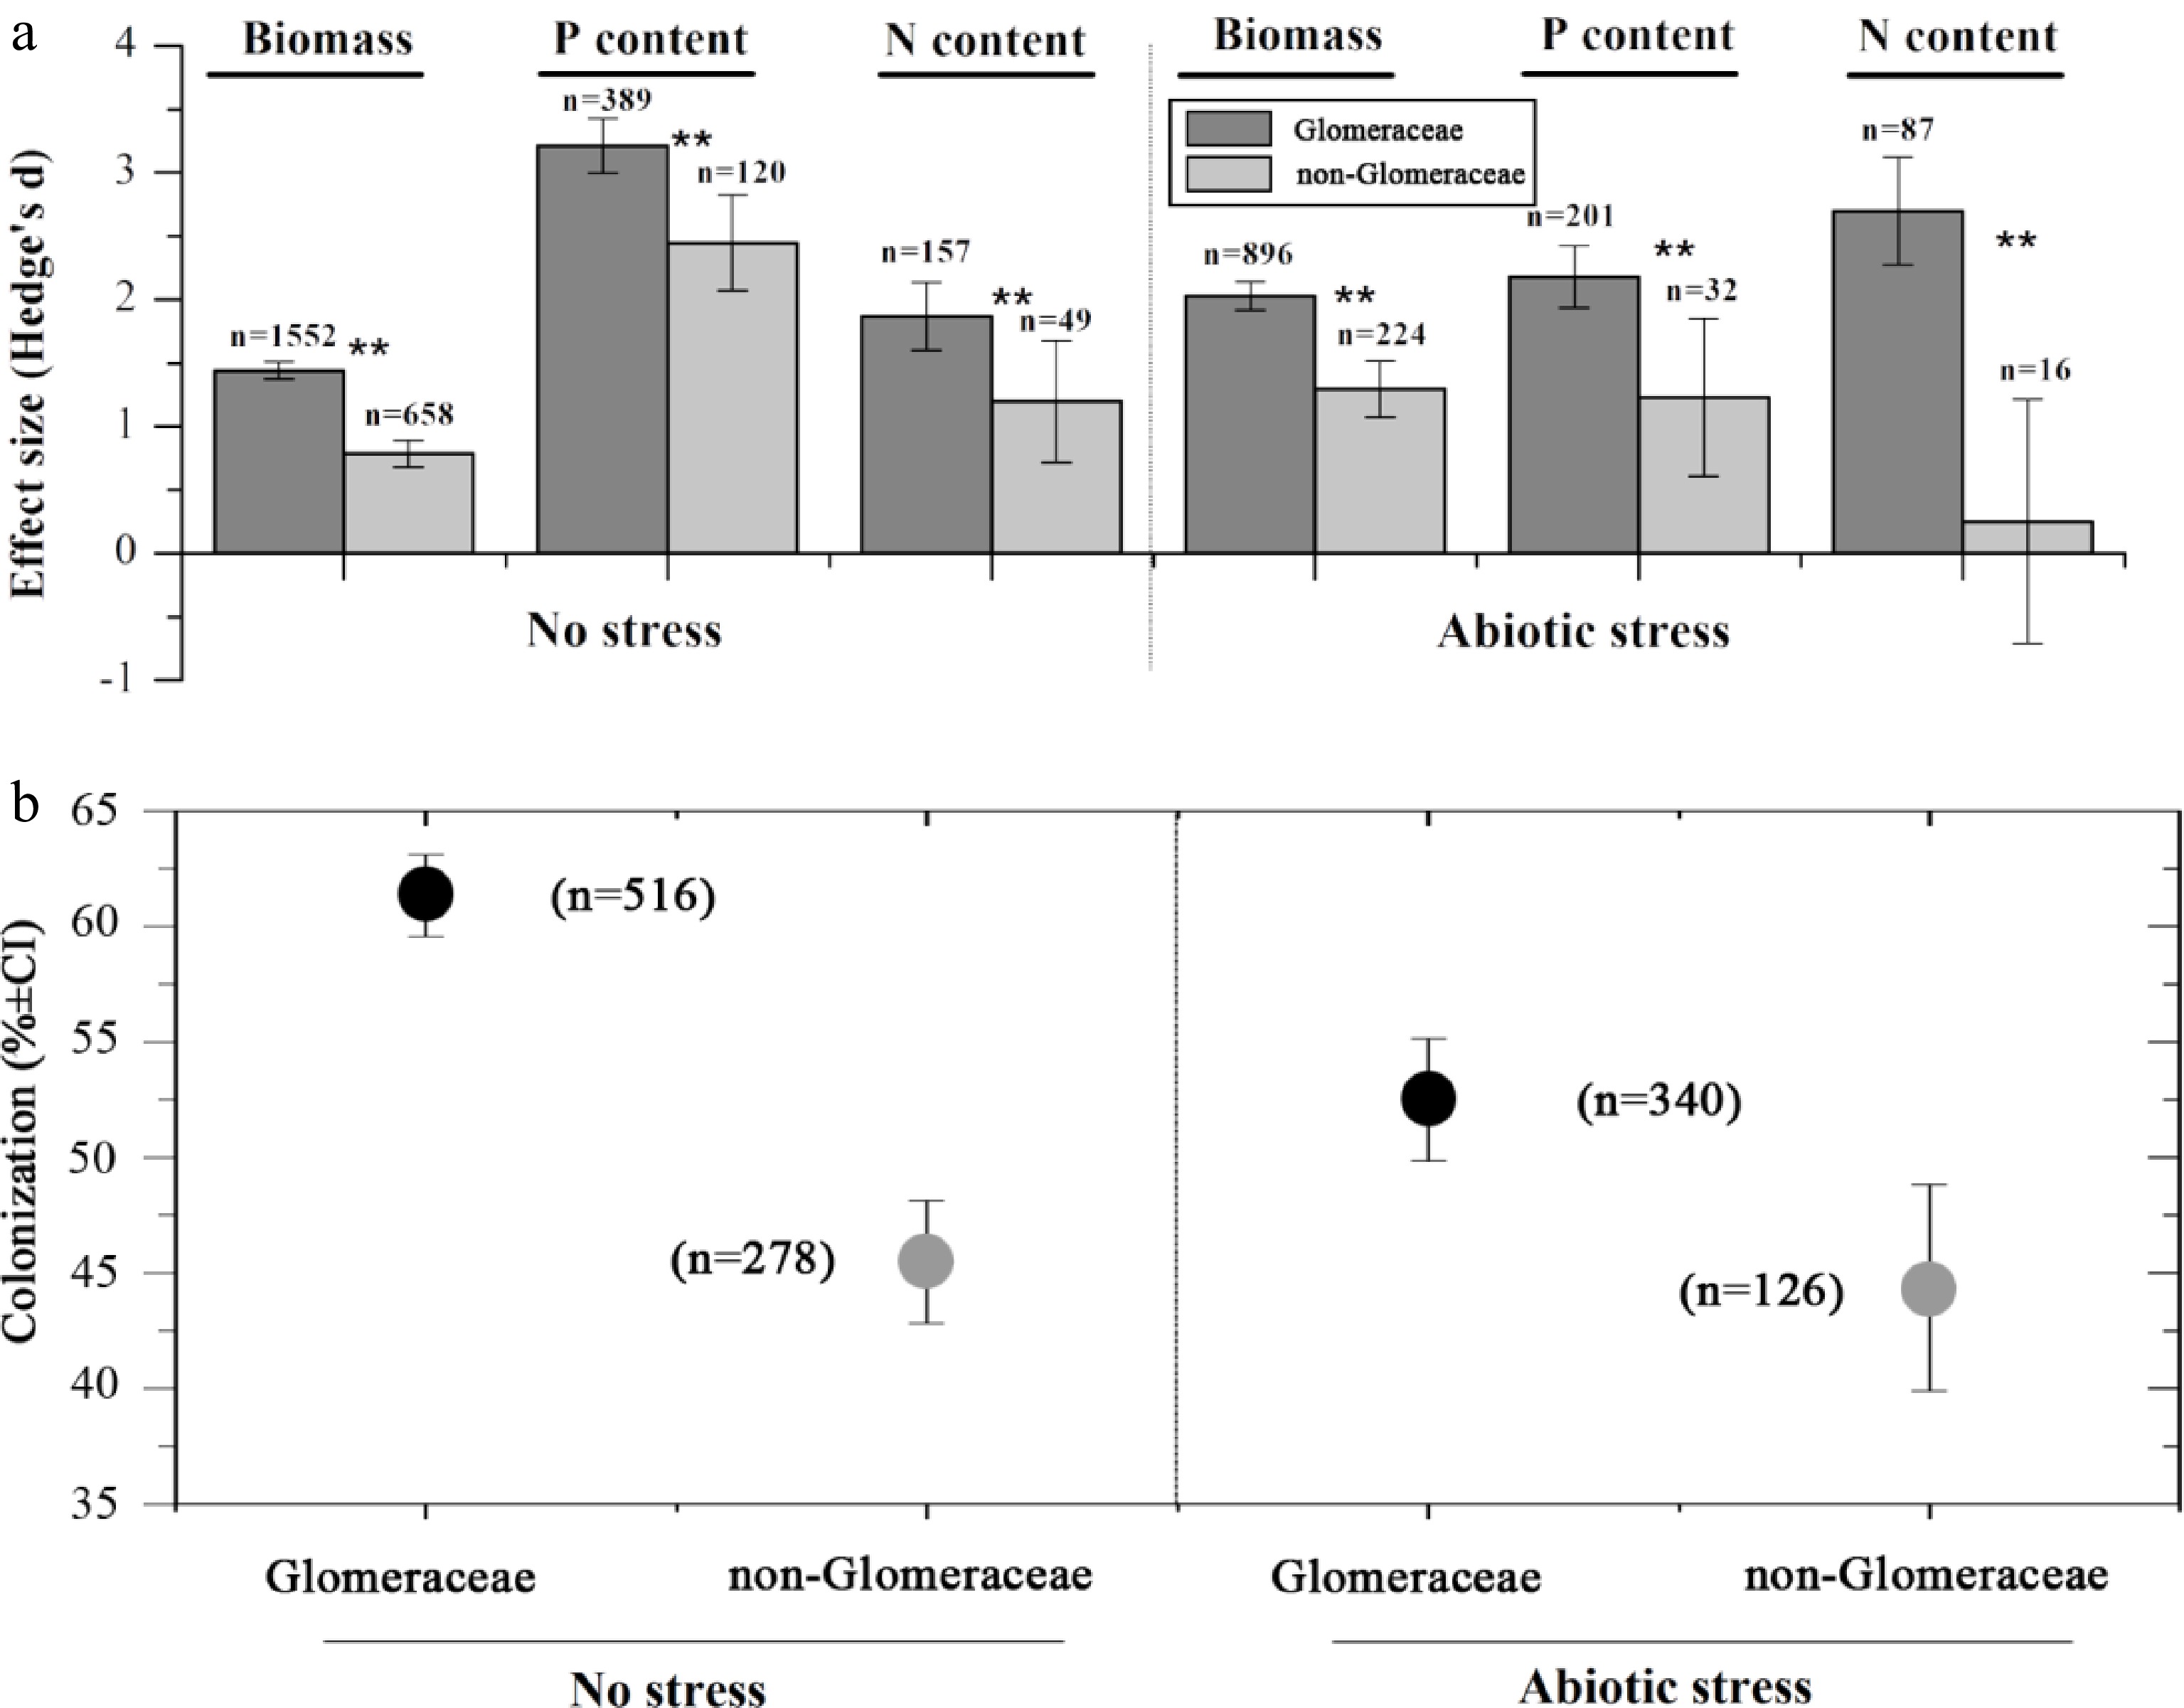
Figure 2.
Symbiotic functioning.
-
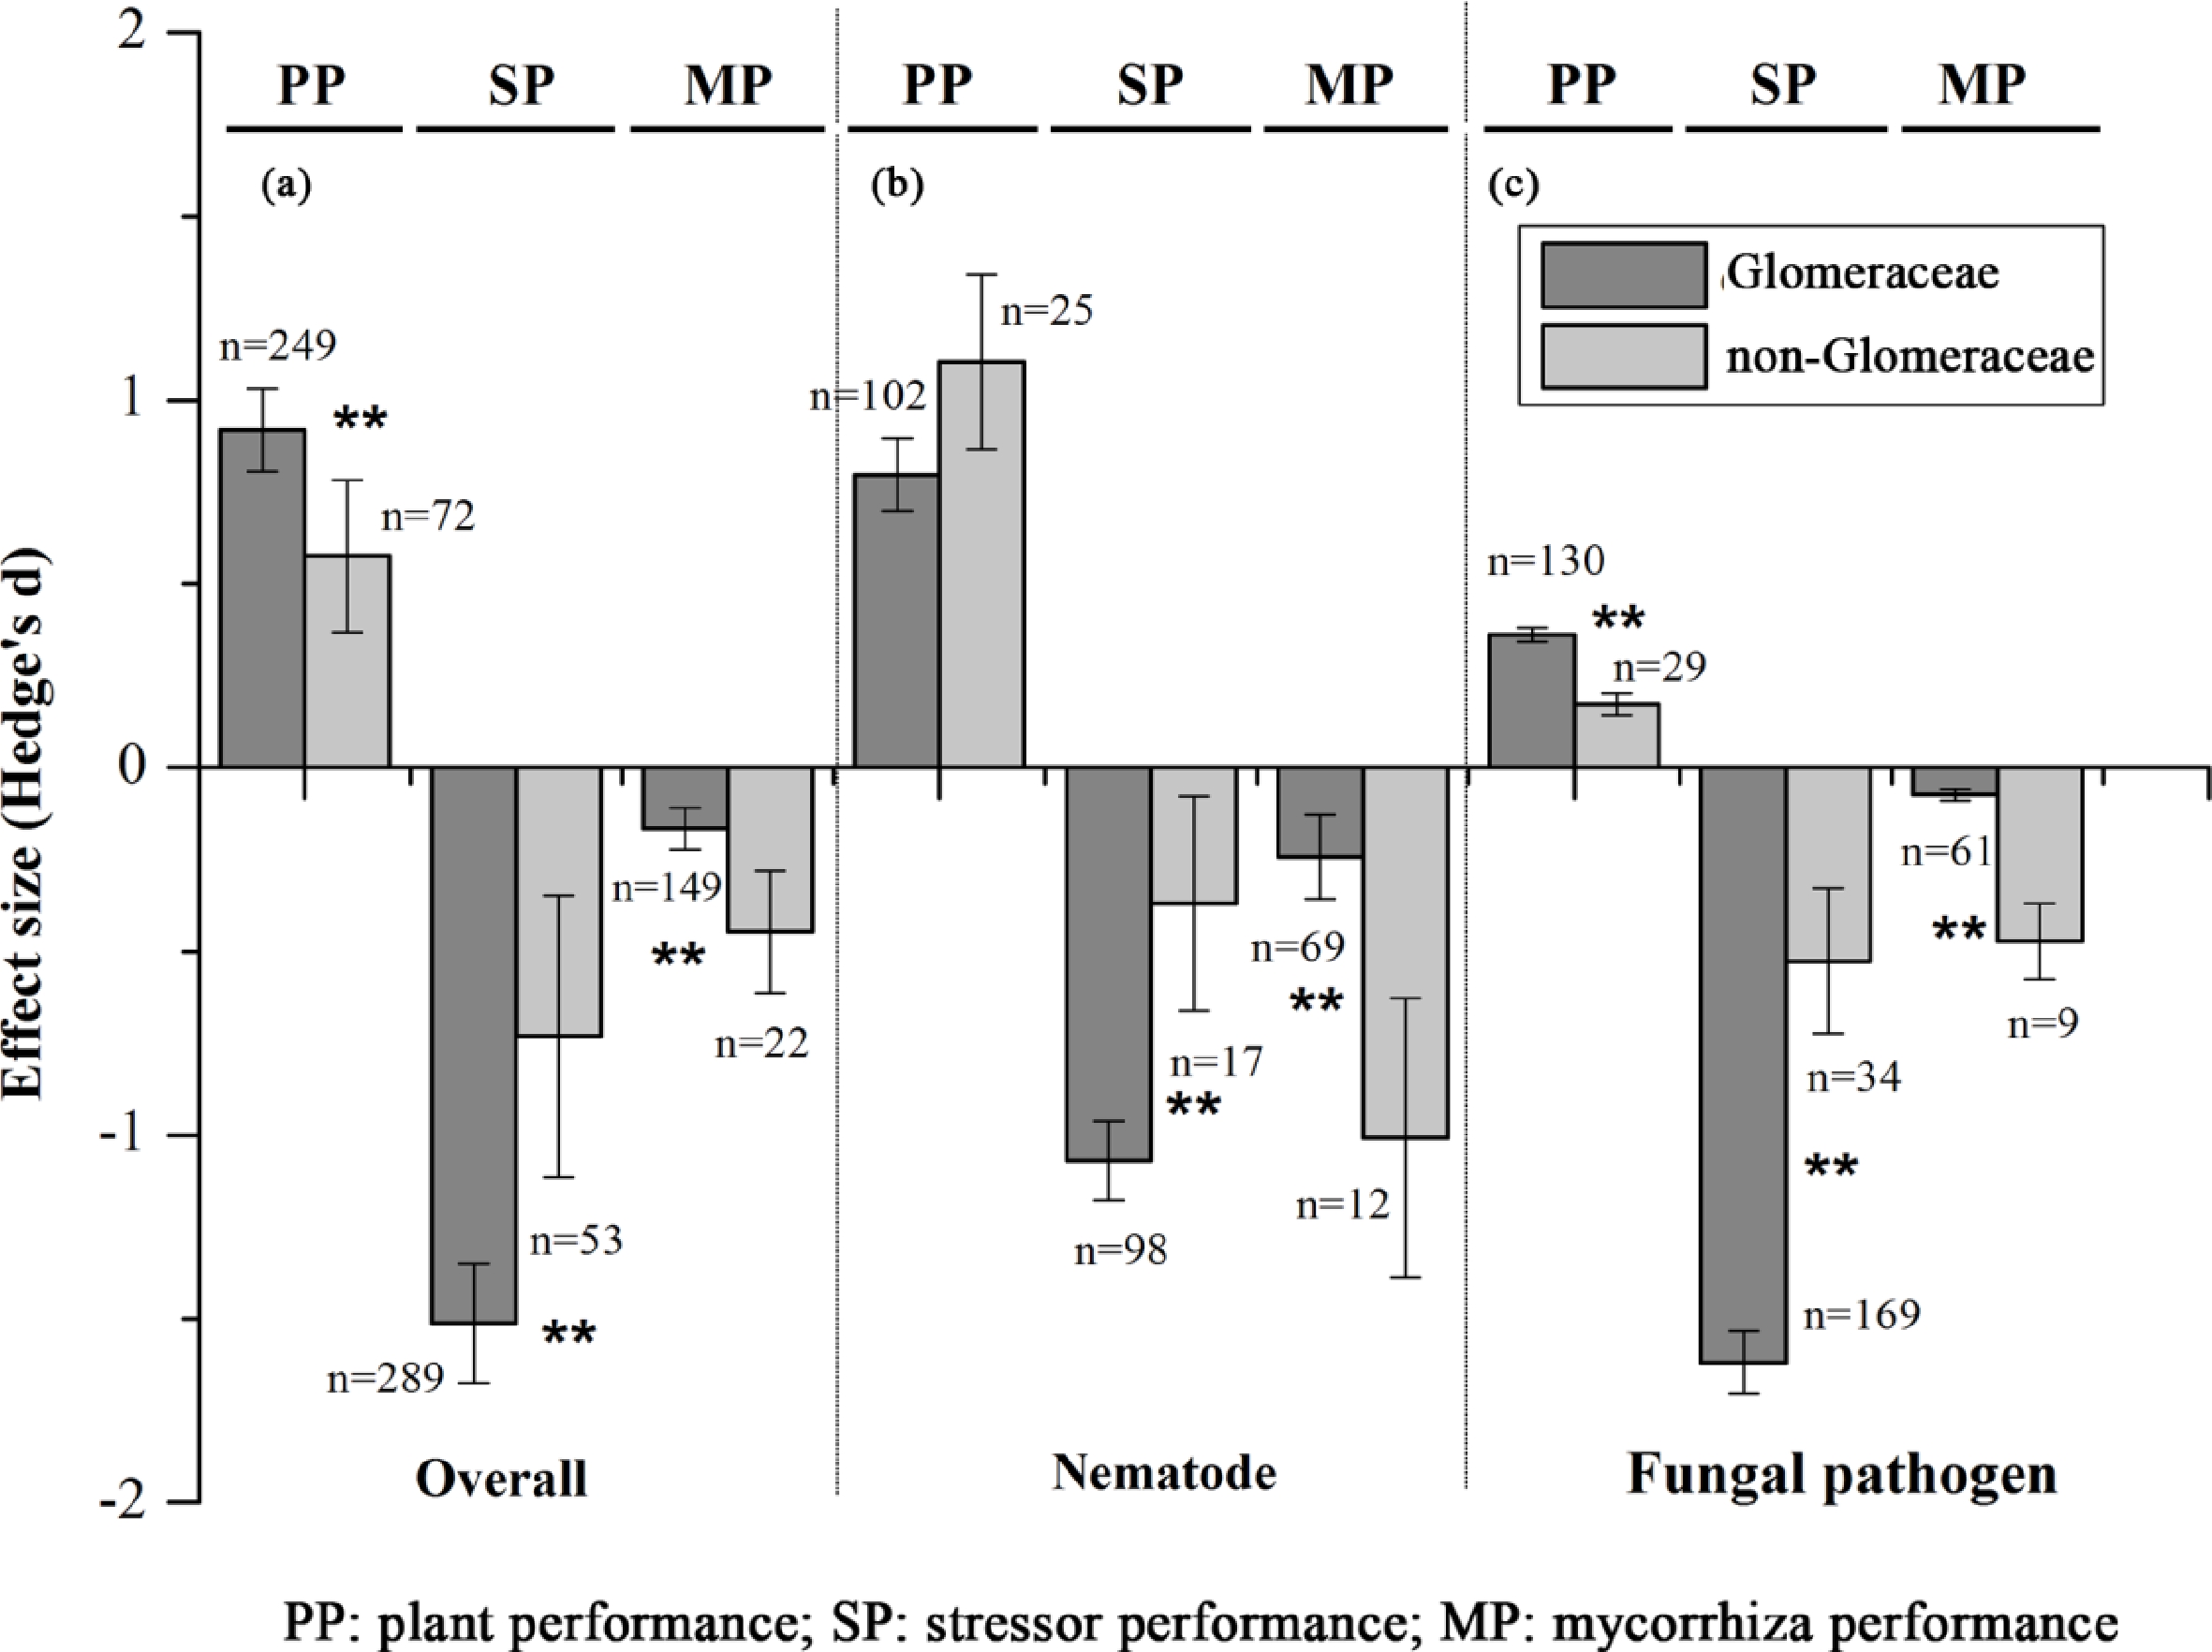
Figure 3.
Symbiotic functioning of Glomeraceae and non-Glomeraceae at biotic stress.
-
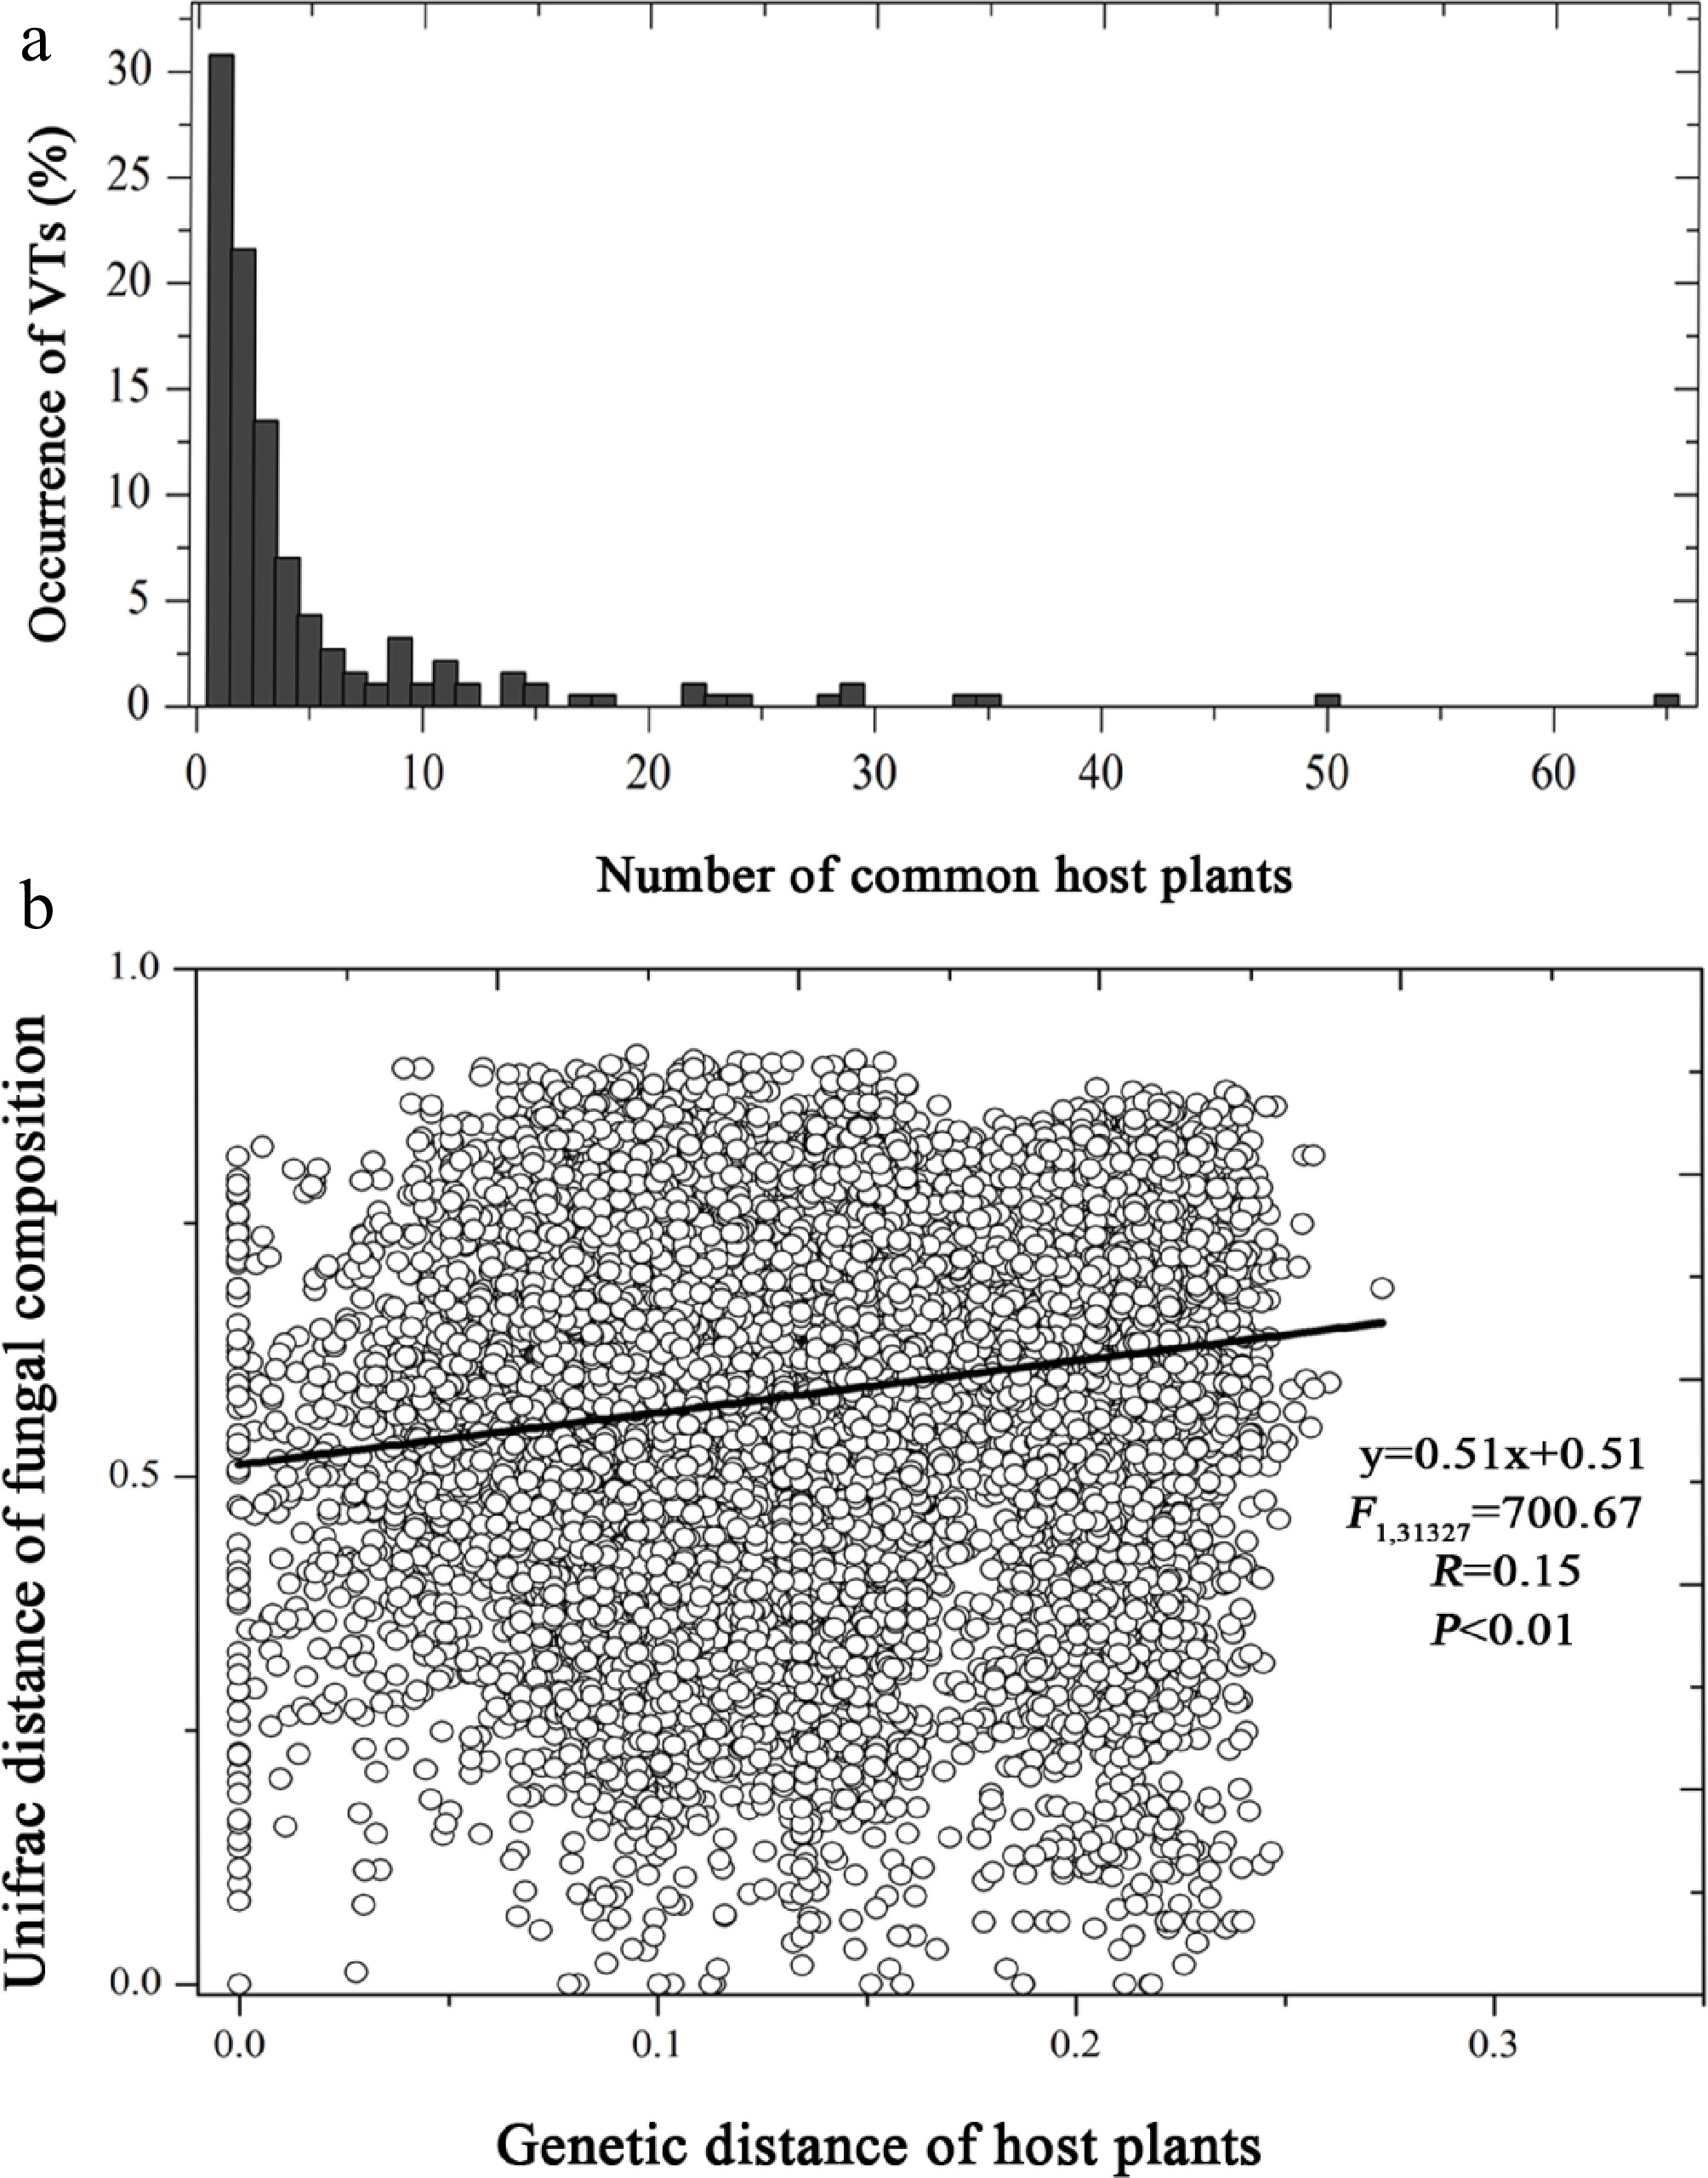
Figure 4.
(a) Host range of taxa in Glomeraceae family, and (b) the relationship of Glomeraceae fungal composition dissimilarity against genetic distance of host plants.
-
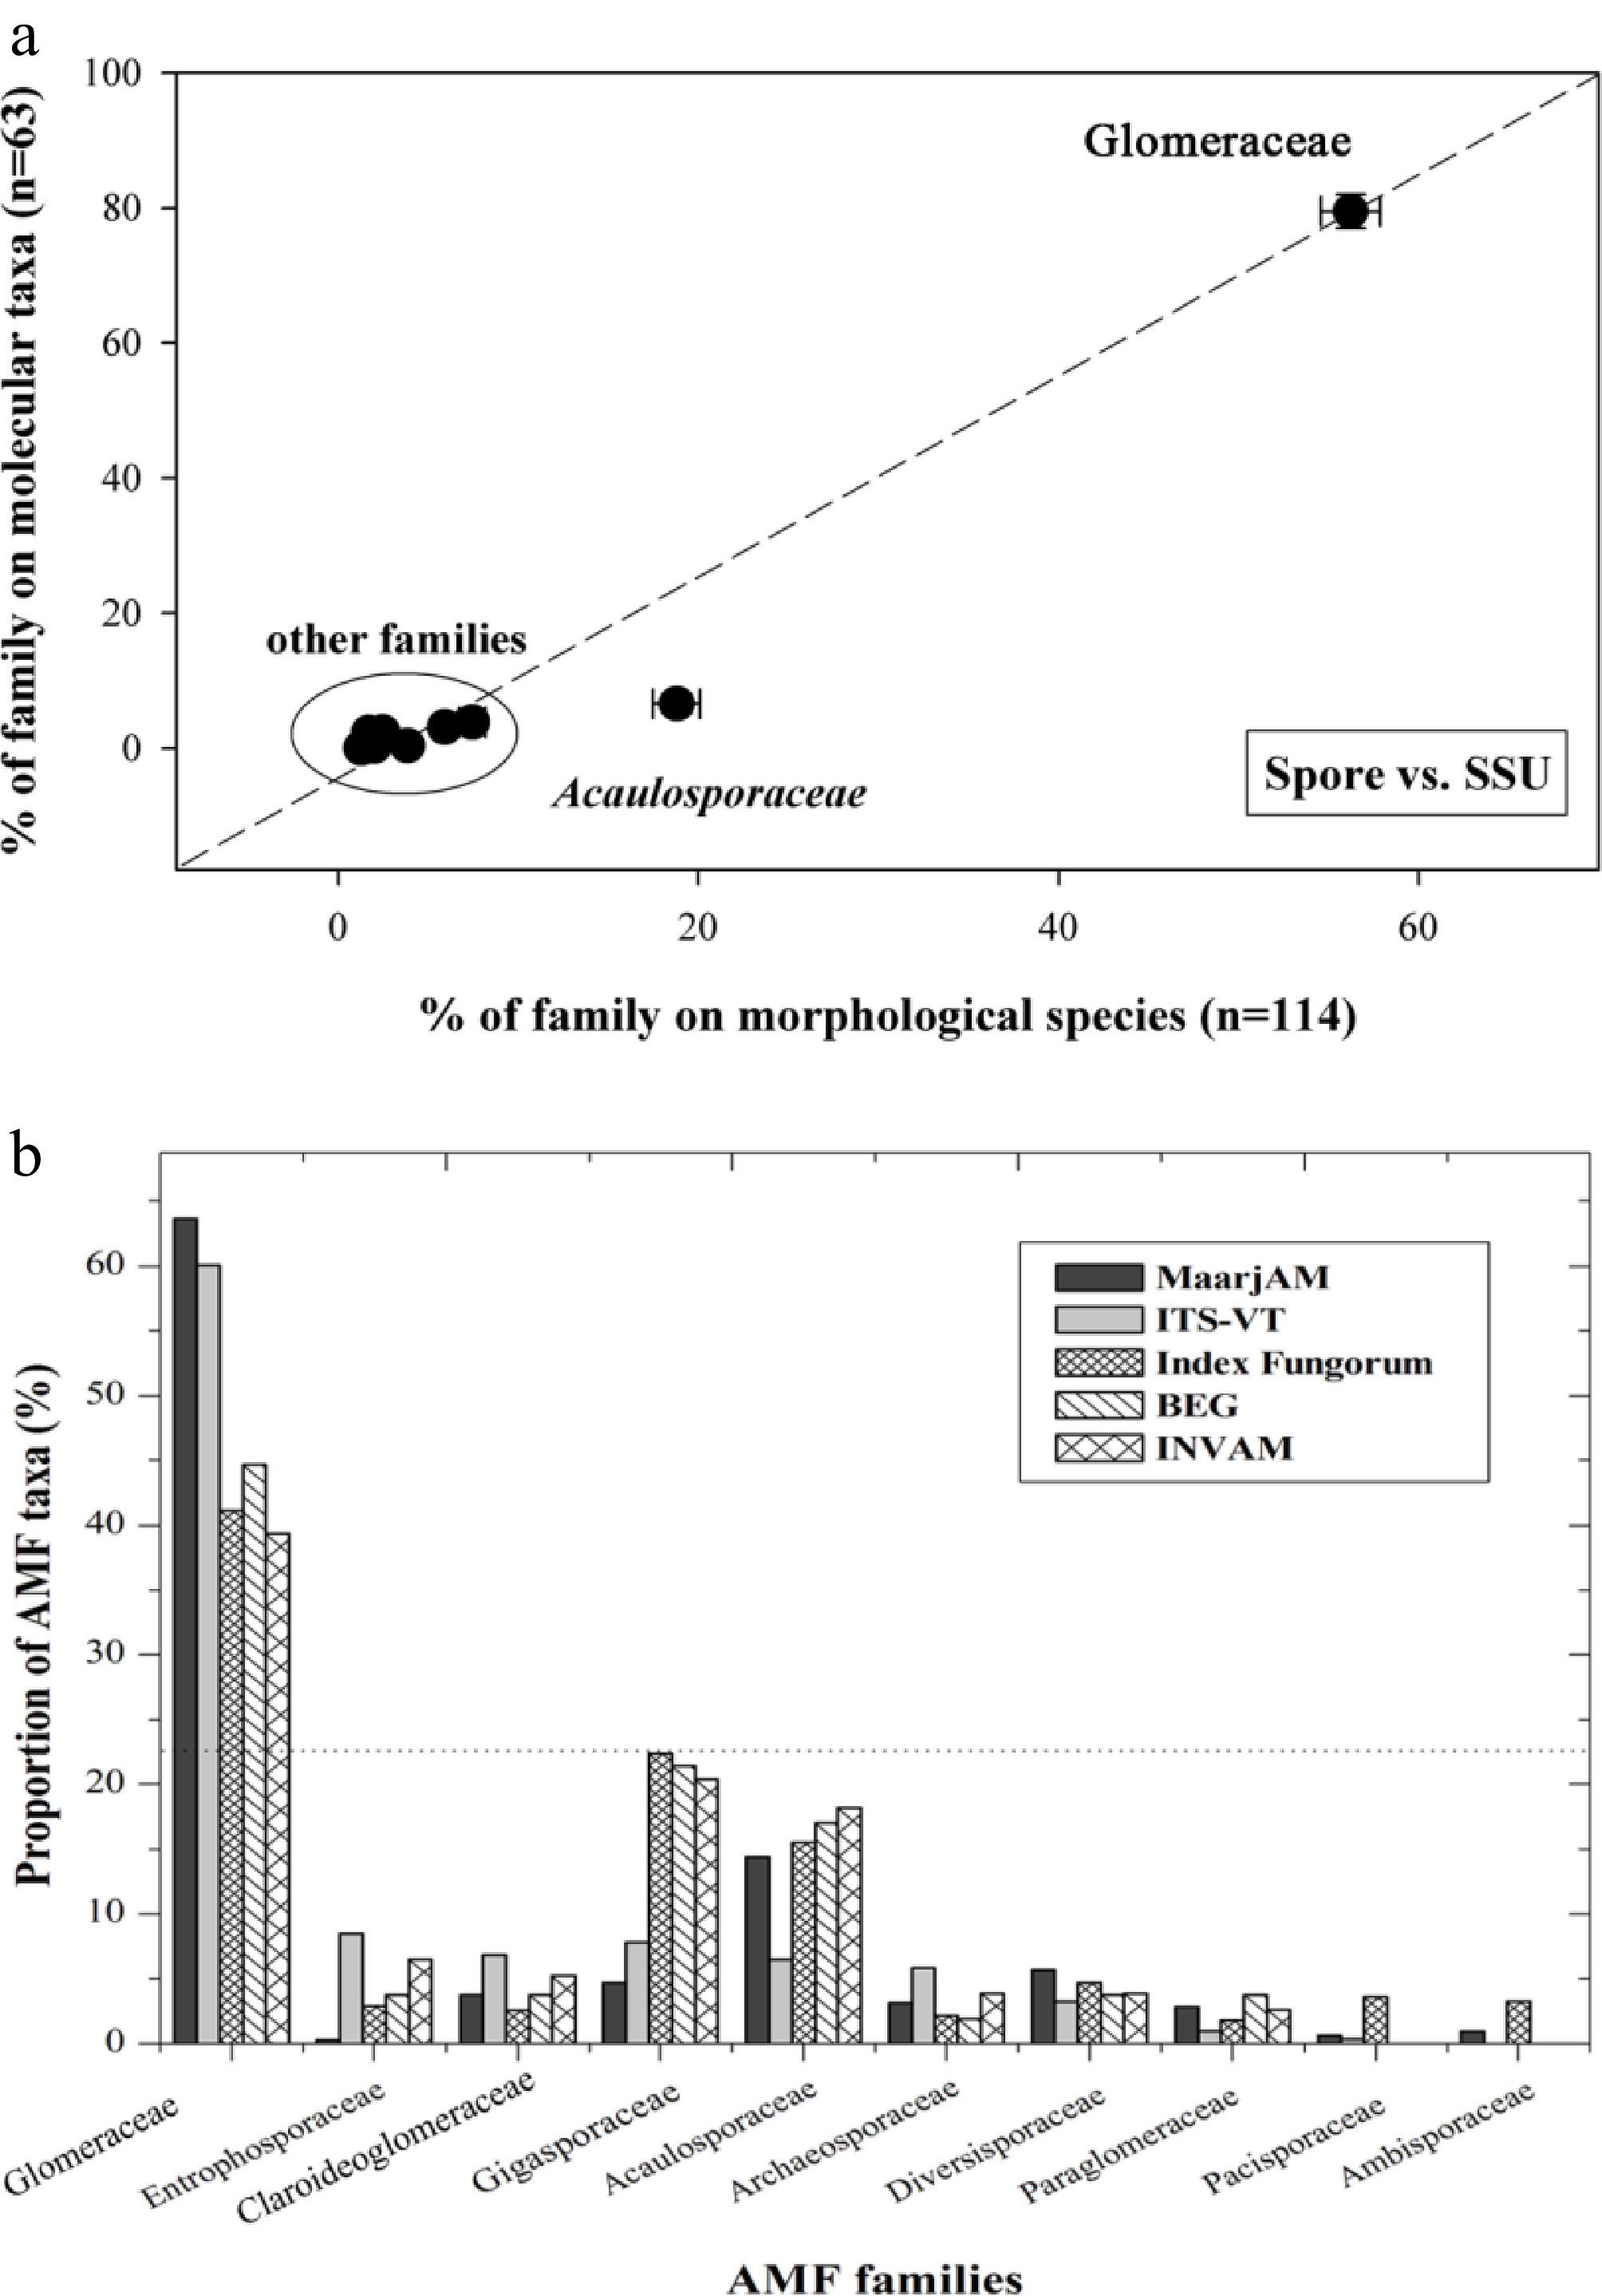
Figure 5.
AMF diversity at family level in natural communities.
-
AMF family Stem
ageCrown
ageTaxa
number§Relative extinction Rate = 0 Rate = 0.9 Acaulospraceae 250 230 46 0.0067 0.0030 Ambisporaceae 470 400 3 0.0010 0.0002 Archaeosporaceae 400 180 10 0.0025 0.0007 Claroideoglomeraceae 430 68 12 0.0025 0.0007 Diversporaceae 250 89 18 0.0050 0.0017 Gigasporaceae 340 240 15 0.0035 0.0011 Glomeraceae 300 230 203 0.0077 0.0044 Paraglomeraceae 450 89 9 0.0021 0.0006 § The taxa number data are based on VTs defined with SSU sequences from the MaarjAM database on May 22nd, 2012[26]. Table 1.
Net diversification rate of AMF families based on SSU gene.
Figures
(5)
Tables
(1)