-
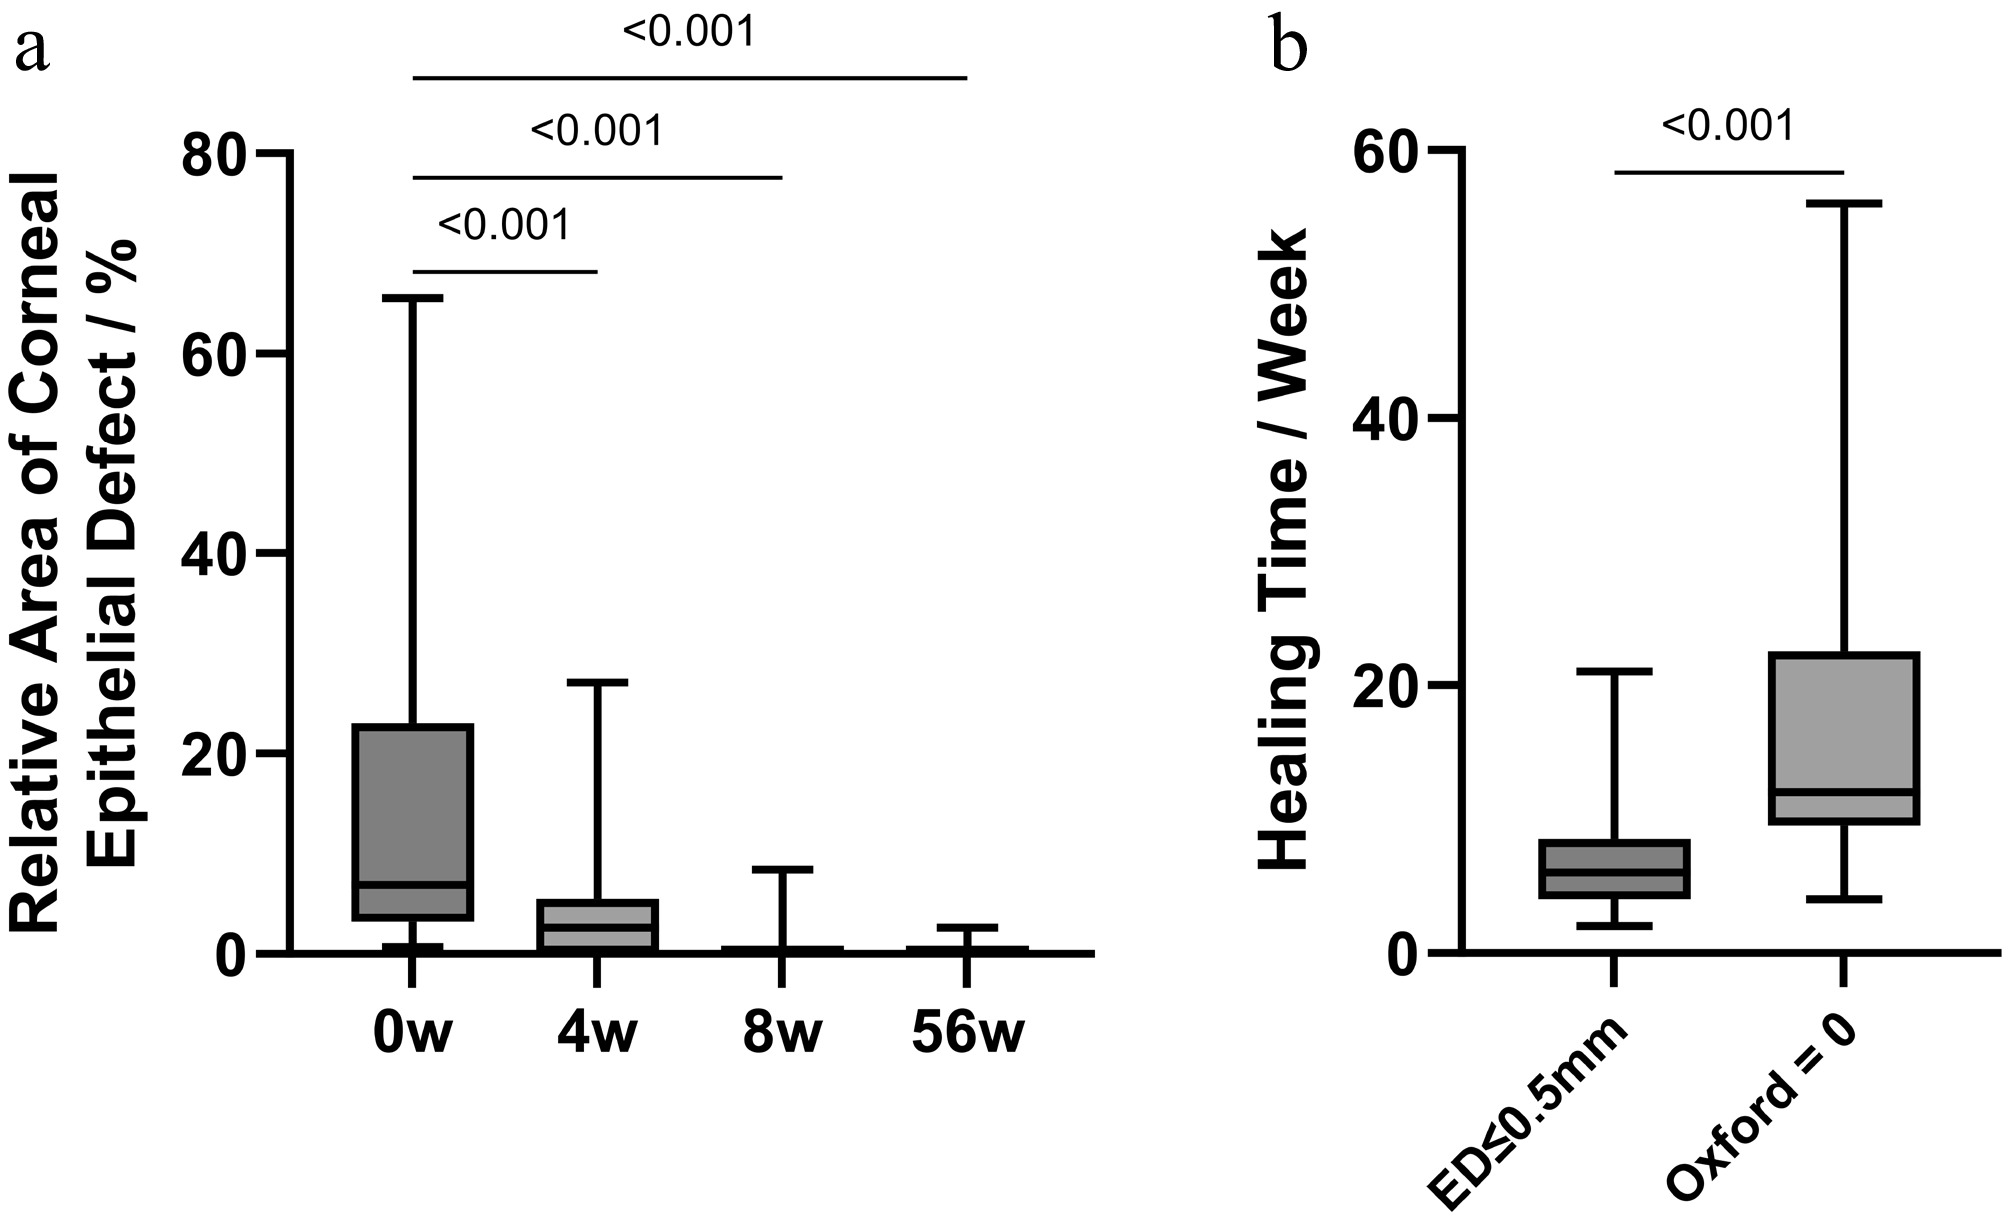
Figure 1.
(a) Changes in the relative area of corneal epithelial defects (epithelial defect area/corneal area) at different follow-up time points. (b) Time to achieve clinical healing (epithelial defect diameter ≤ 0.5 mm) and Oxford score = 0 (complete healing). Data are presented as the median and IQR. Statistical analysis was performed using the Wilcoxon signed-rank test; n = 21.
-
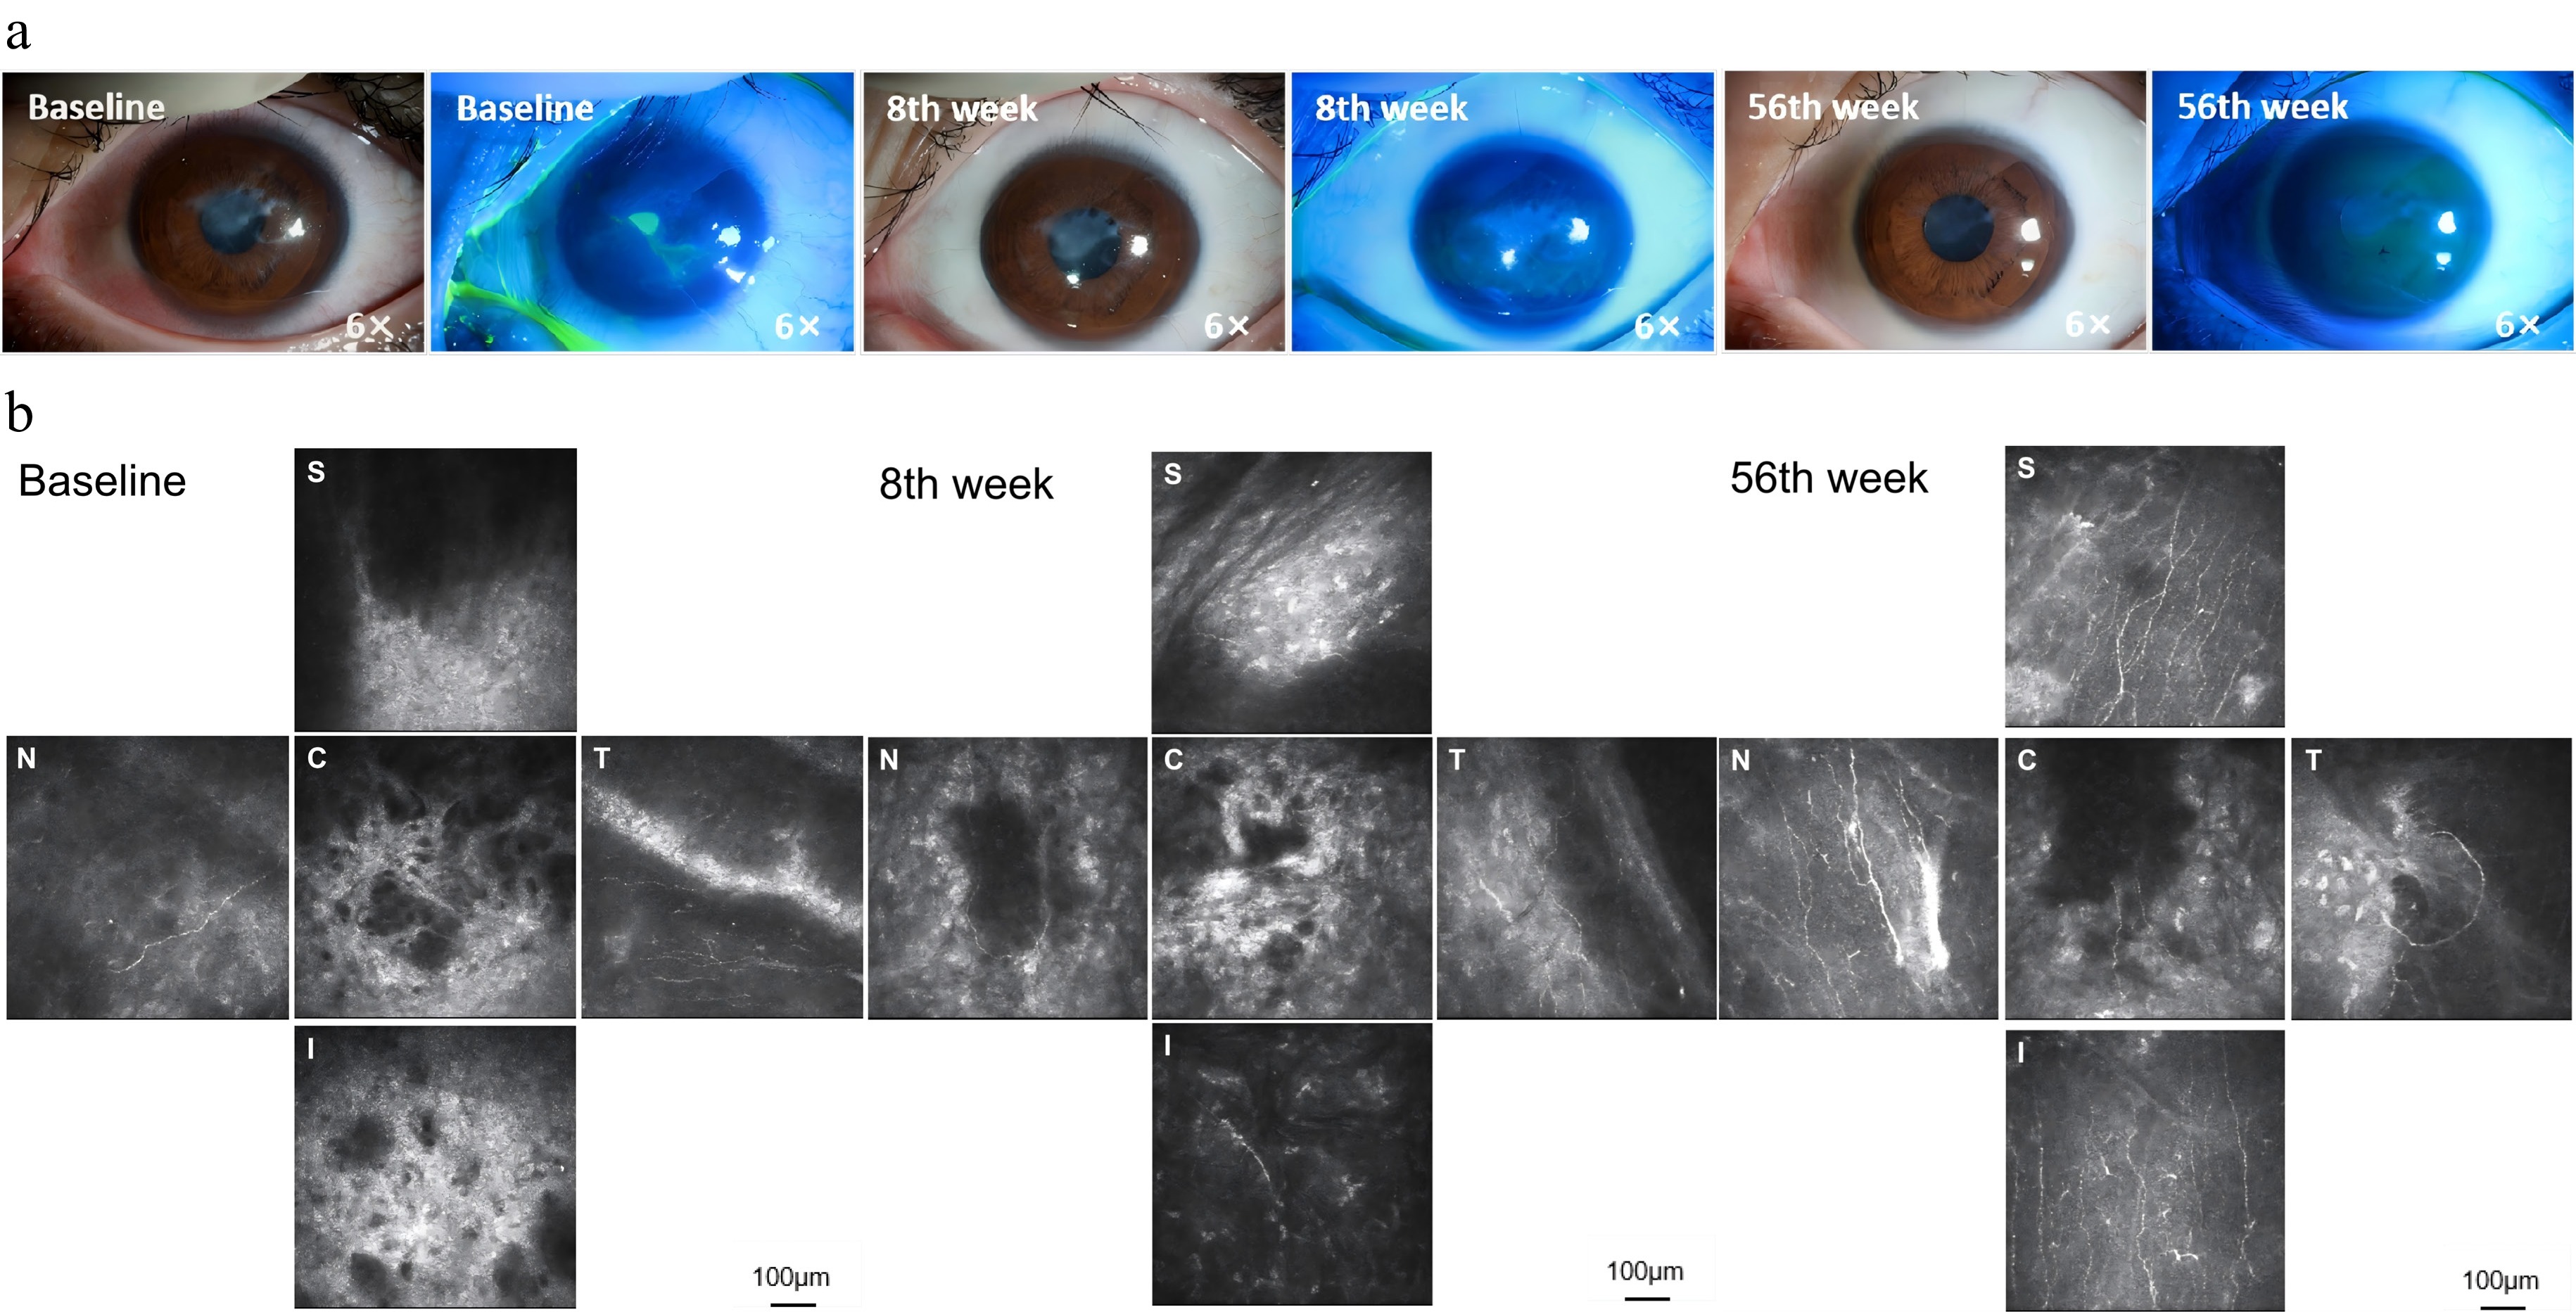
Figure 2.
Representative images of corneal epithelial healing and nerve regeneration in a patient with a history of LASIK refractive surgery. (a) External eye photographs at baseline, Week 8, and Week 56 (magnification: 6×). (b) In vivo confocal microscopy (IVCM) images at baseline, Week 8, and Week 56, showing corneal nerves' distribution in different regions. C: central cornea; S: superior cornea; I: inferior cornea; N: nasal cornea; T: temporal cornea. Scale bar: 100 μm.
-
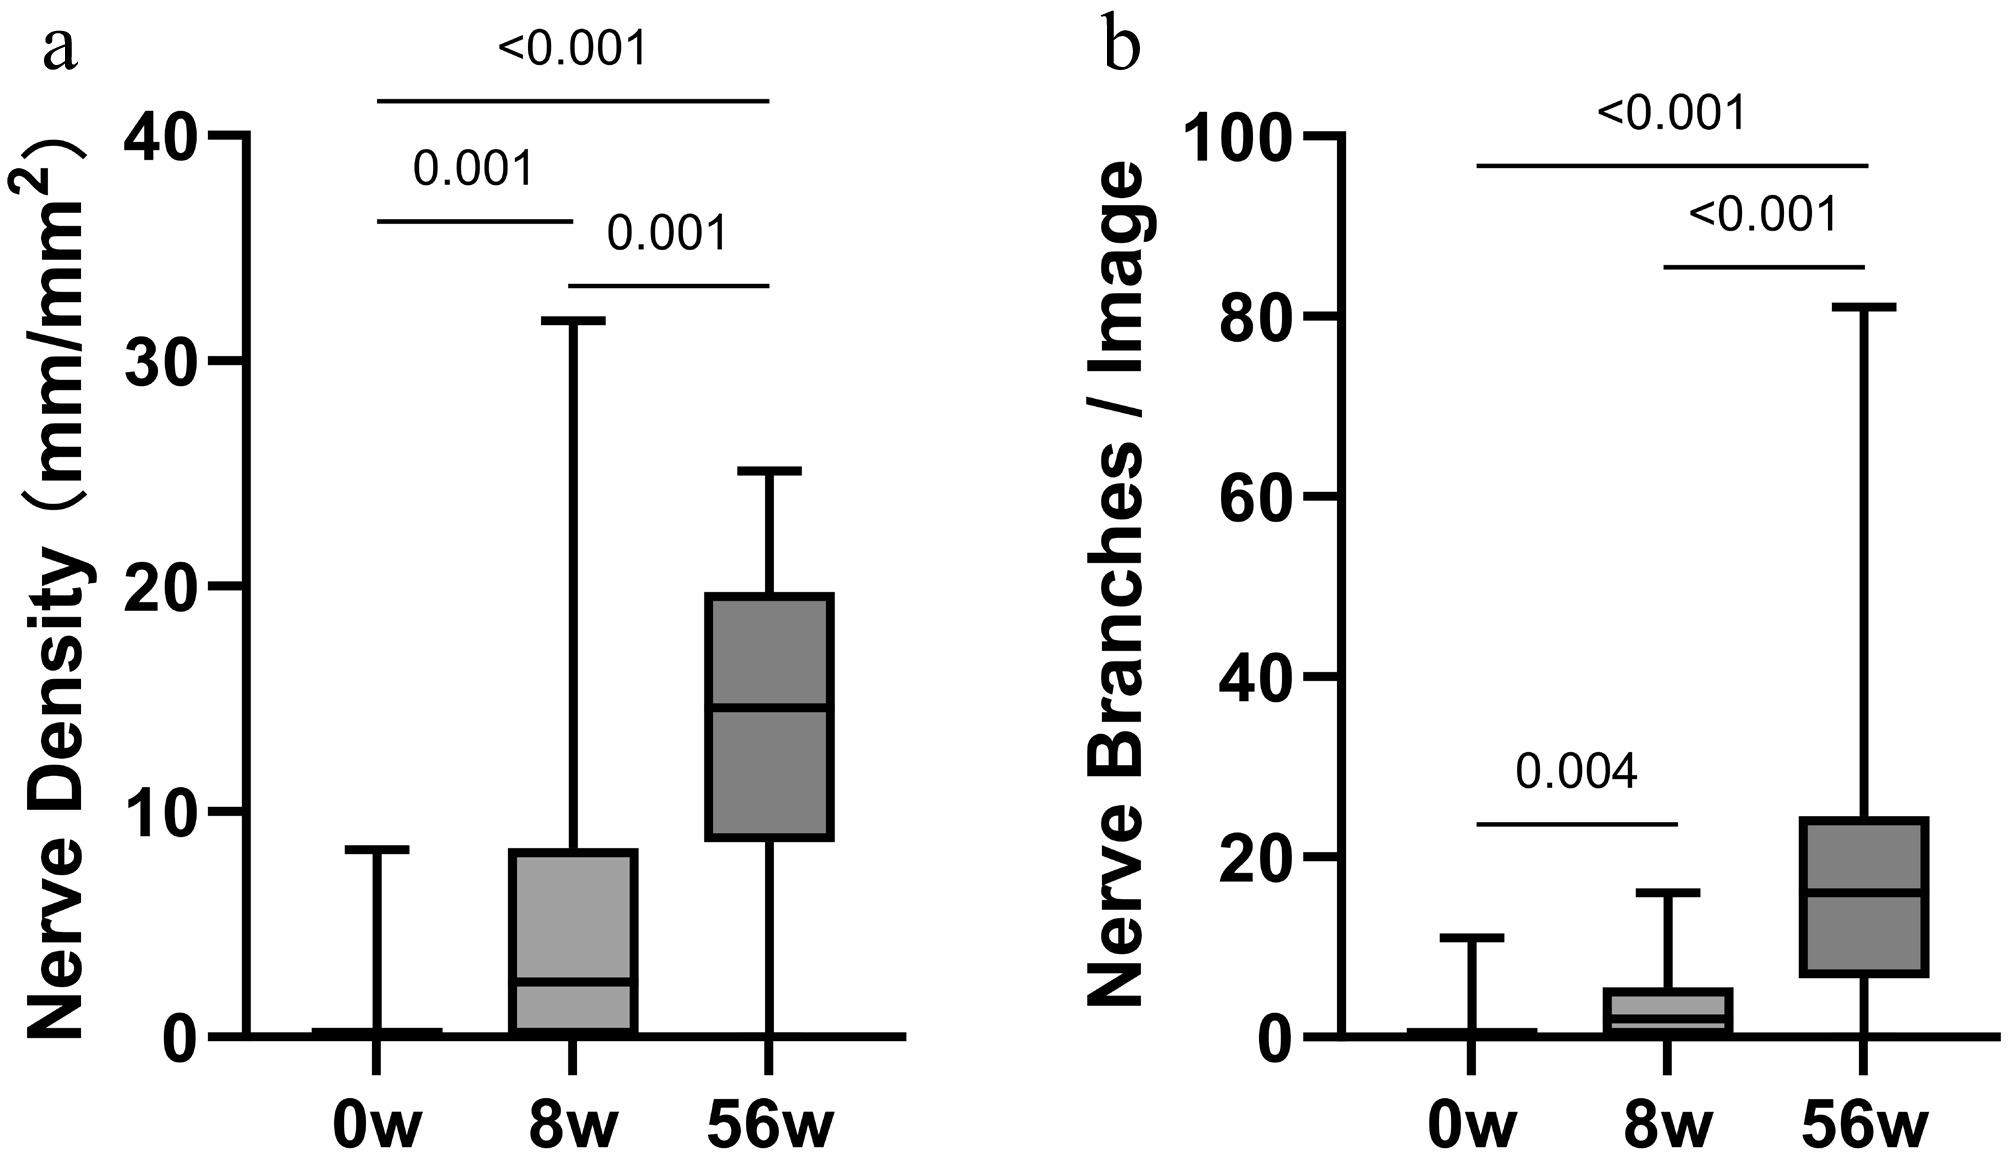
Figure 3.
Changes in corneal subbasal nerve parameters during follow-up. (a) Corneal nerve fiber density (mm/mm2) at baseline, Week 8, and Week 56. (b) Corneal nerve branch count per image at baseline, Week 8, and Week 56. Data are presented as the median and IQR. Friedman's test was used for overall comparison, followed by Wilcoxon's signed-rank test for pairwise comparisons; n = 21.
-
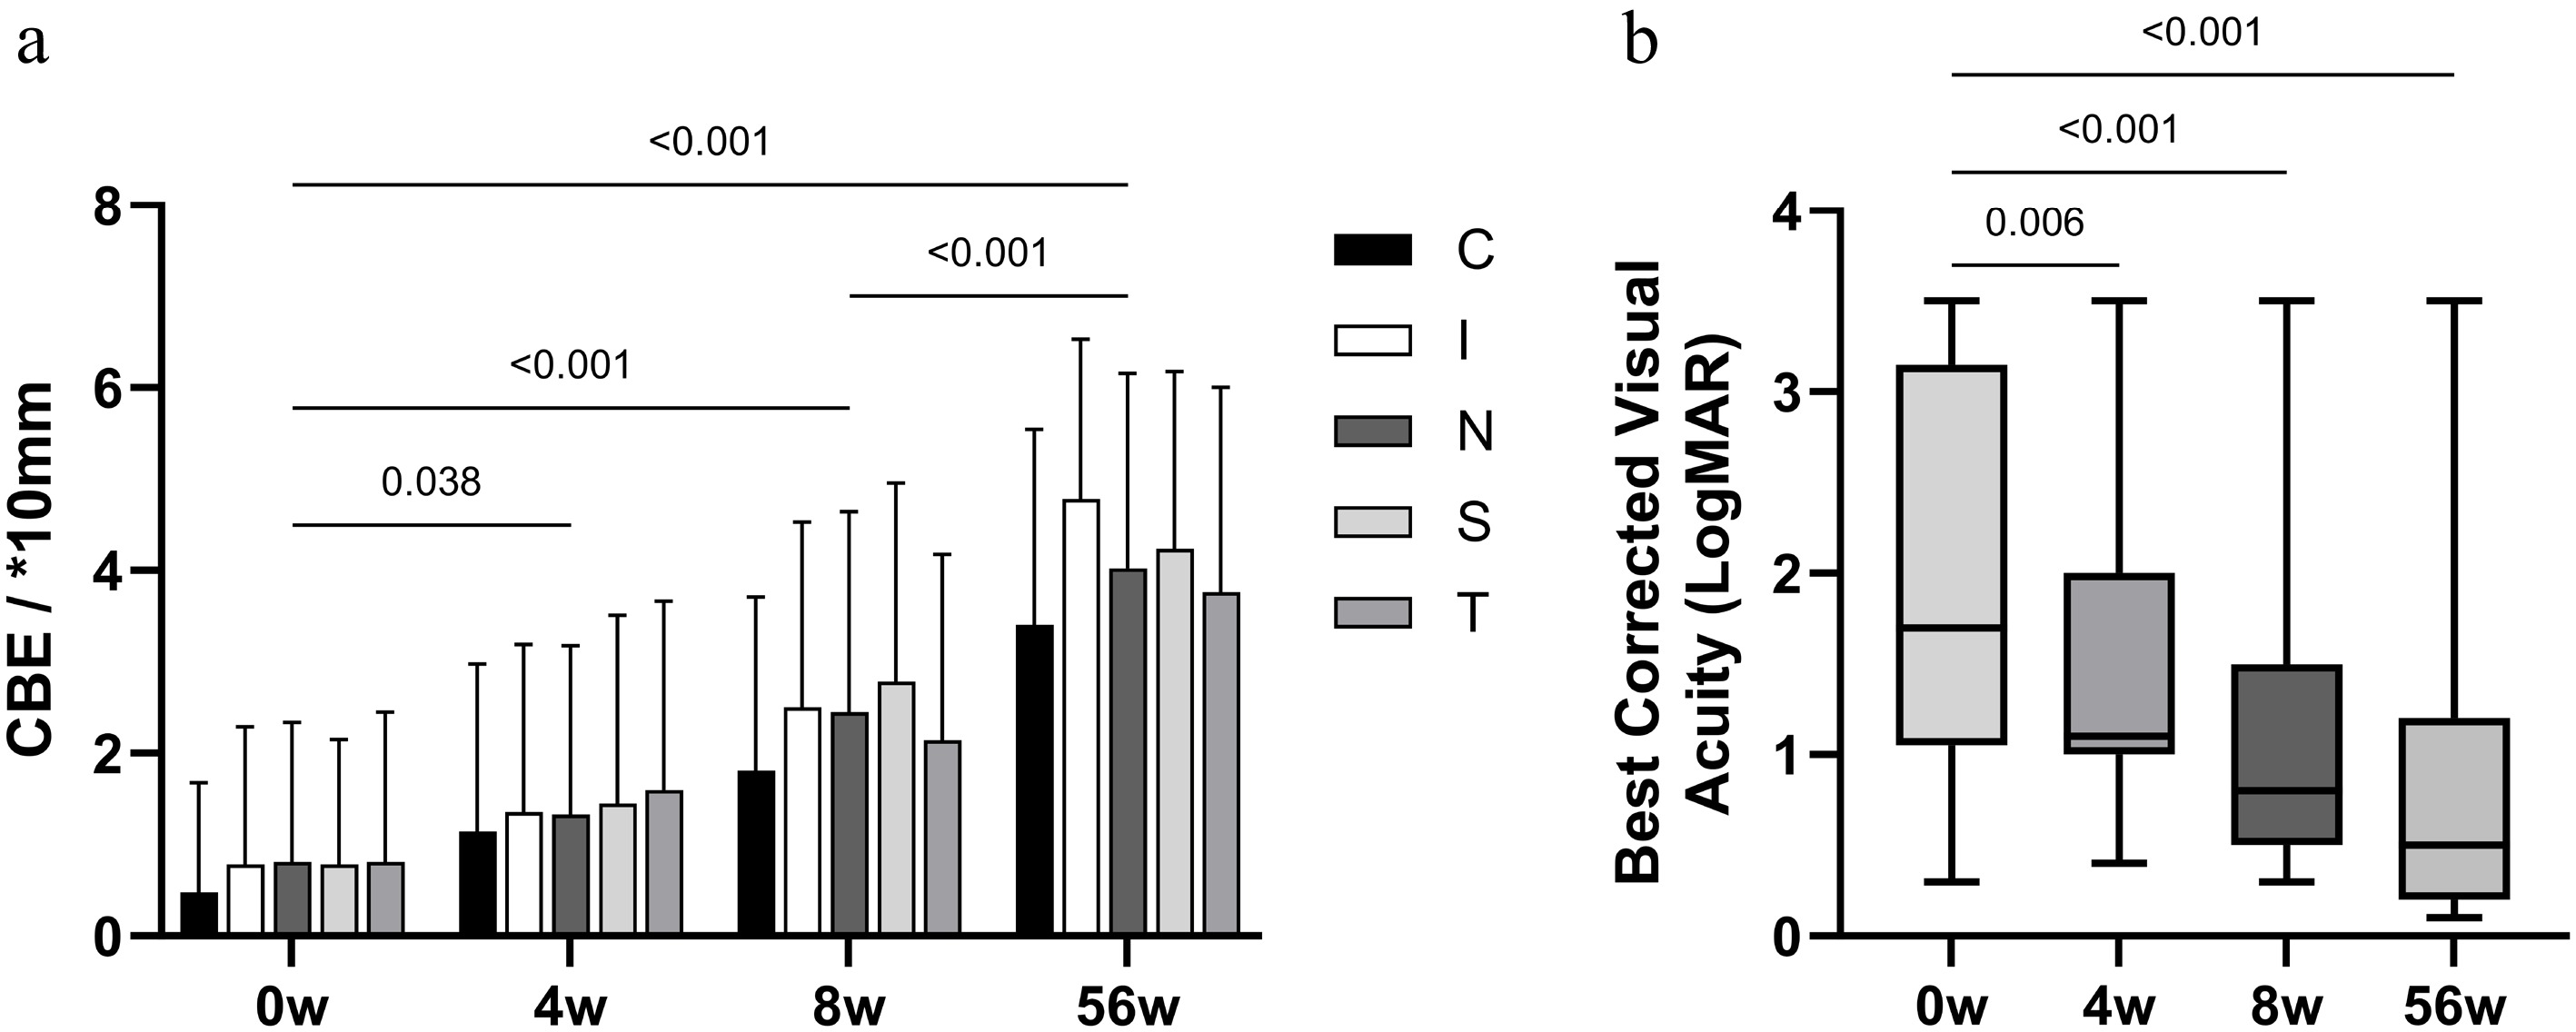
Figure 4.
Changes in corneal sensory and visual function during follow-up. (a) Corneal sensitivity (measured by Cochet–Bonnet esthesiometry, CBE) in the central, superior, inferior, nasal, and temporal cornea at baseline, Week 4, Week 8, and Week 56. C: central; S: superior; I: inferior; N: nasal; T: temporal. (b) Best corrected visual acuity (BCVA, LogMAR) at baseline, Week 4, Week 8, and Week 56. Data are presented as the mean ± SD or median and IQR. Statistical analysis was performed using repeated-measures ANOVA or Friedman's test with post hoc correction; n = 21.
-
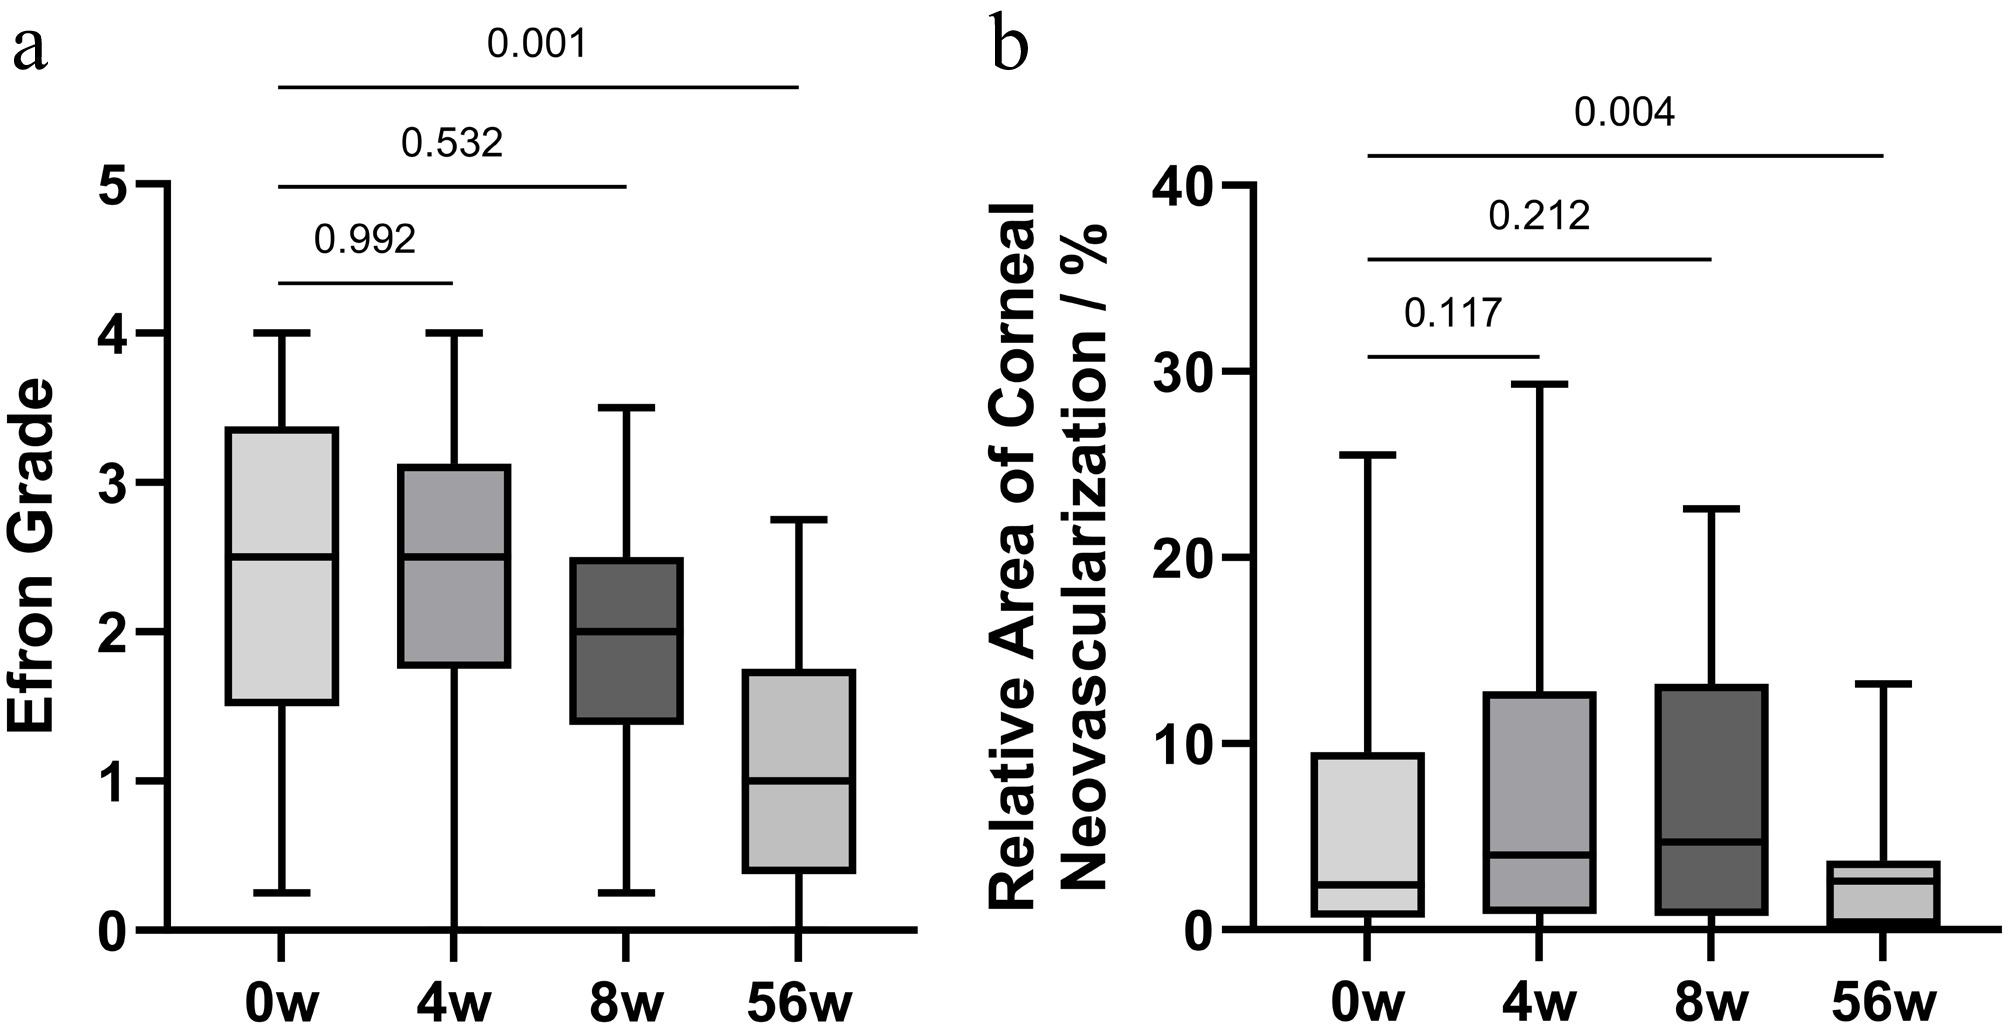
Figure 5.
Changes in ocular safety indicators during follow-up. (a) Efron ocular hyperemia grade at baseline, Week 4, Week 8, and Week 56. (b) Relative area of corneal neovascularization at baseline, Week 4, Week 8, and Week 56. Data are presented as the mean ± SD or median and IQR. Statistical analysis was performed using one-way ANOVA or Wilcoxon's signed-rank test; n = 21.
Figures
(5)
Tables
(0)