-
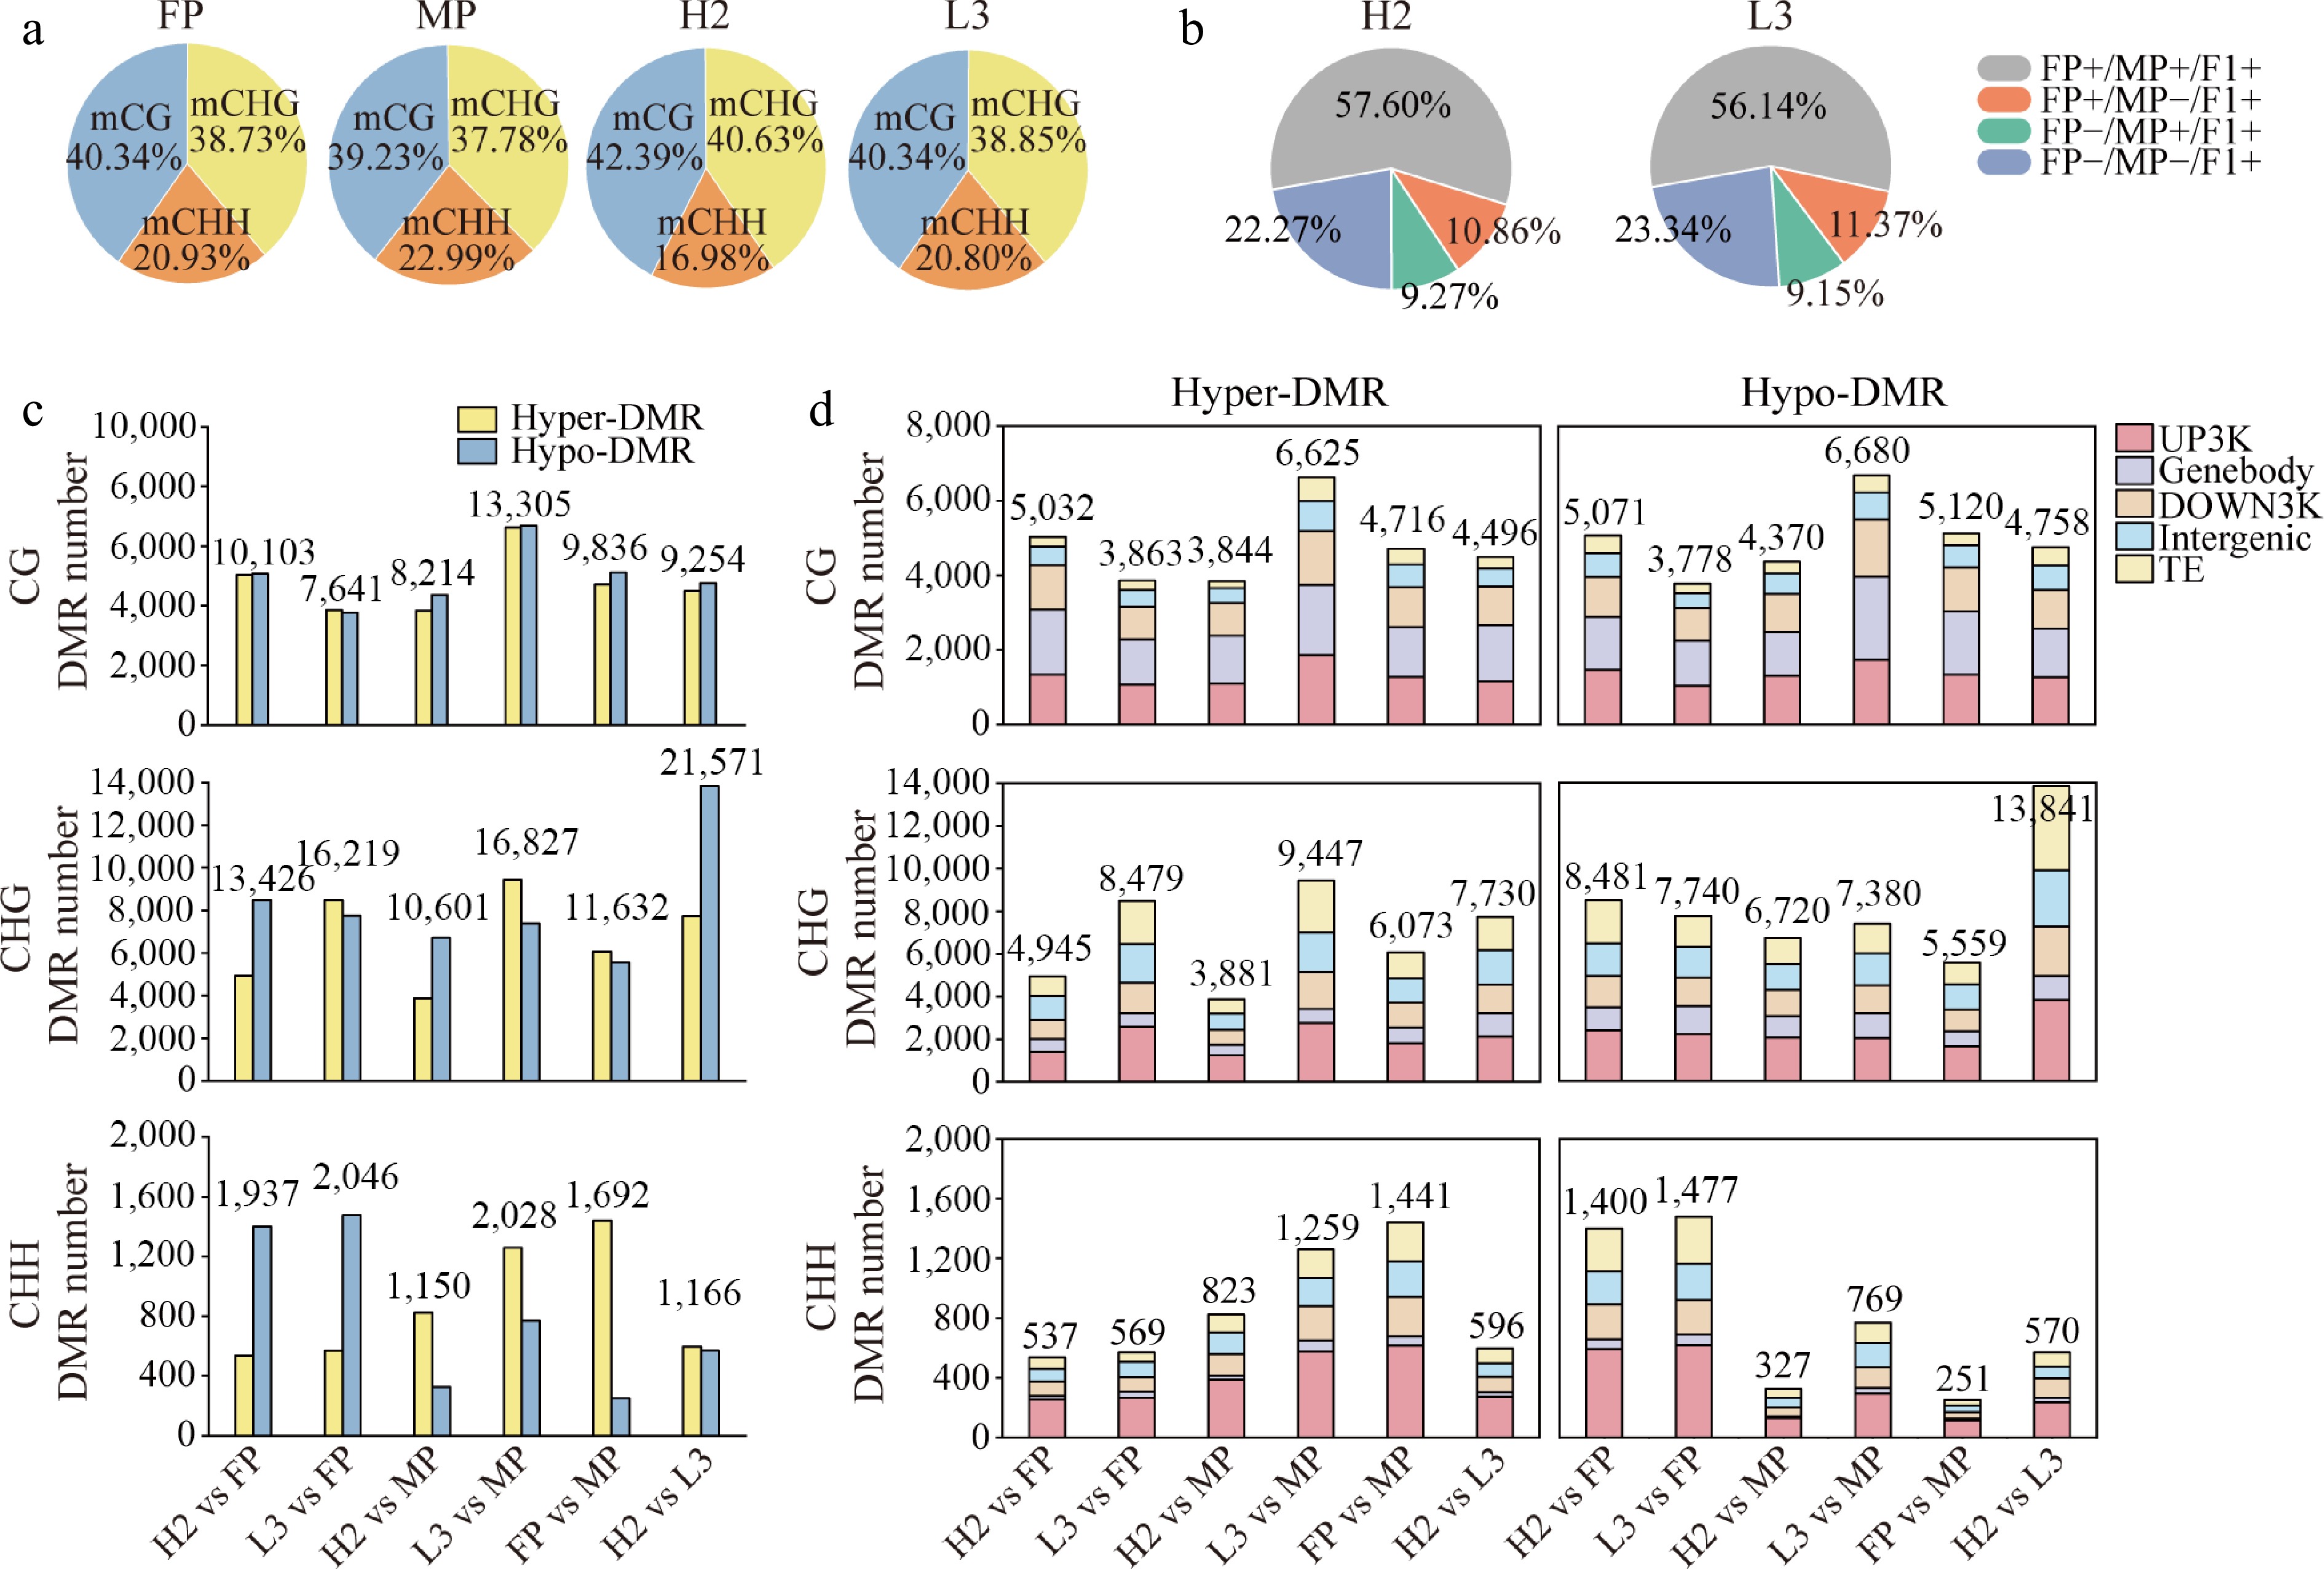
Figure 1.
Distribution of genome-wide methylation and differentially methylated regions (DMRs) among genomic regions in parents and hybrids. (a) Percentage of reads mapping to different methylation sites. (b) Contribution of parental methylation sites to hybrid methylation sites. (c) Number of hyper-DMRs (hypermethylated regions) and hypo-DMRs (hypomethylated regions) in different comparison groups. (d) Distribution of hyper- and hypo-DMRs across various genomic regions in different comparison groups. UP3Kb: gene upstream 3Kb; Genebody: gene body; DOWN3Kb: gene downstream 3Kb; Intergenic: intergenic region; TE: transposable element.
-
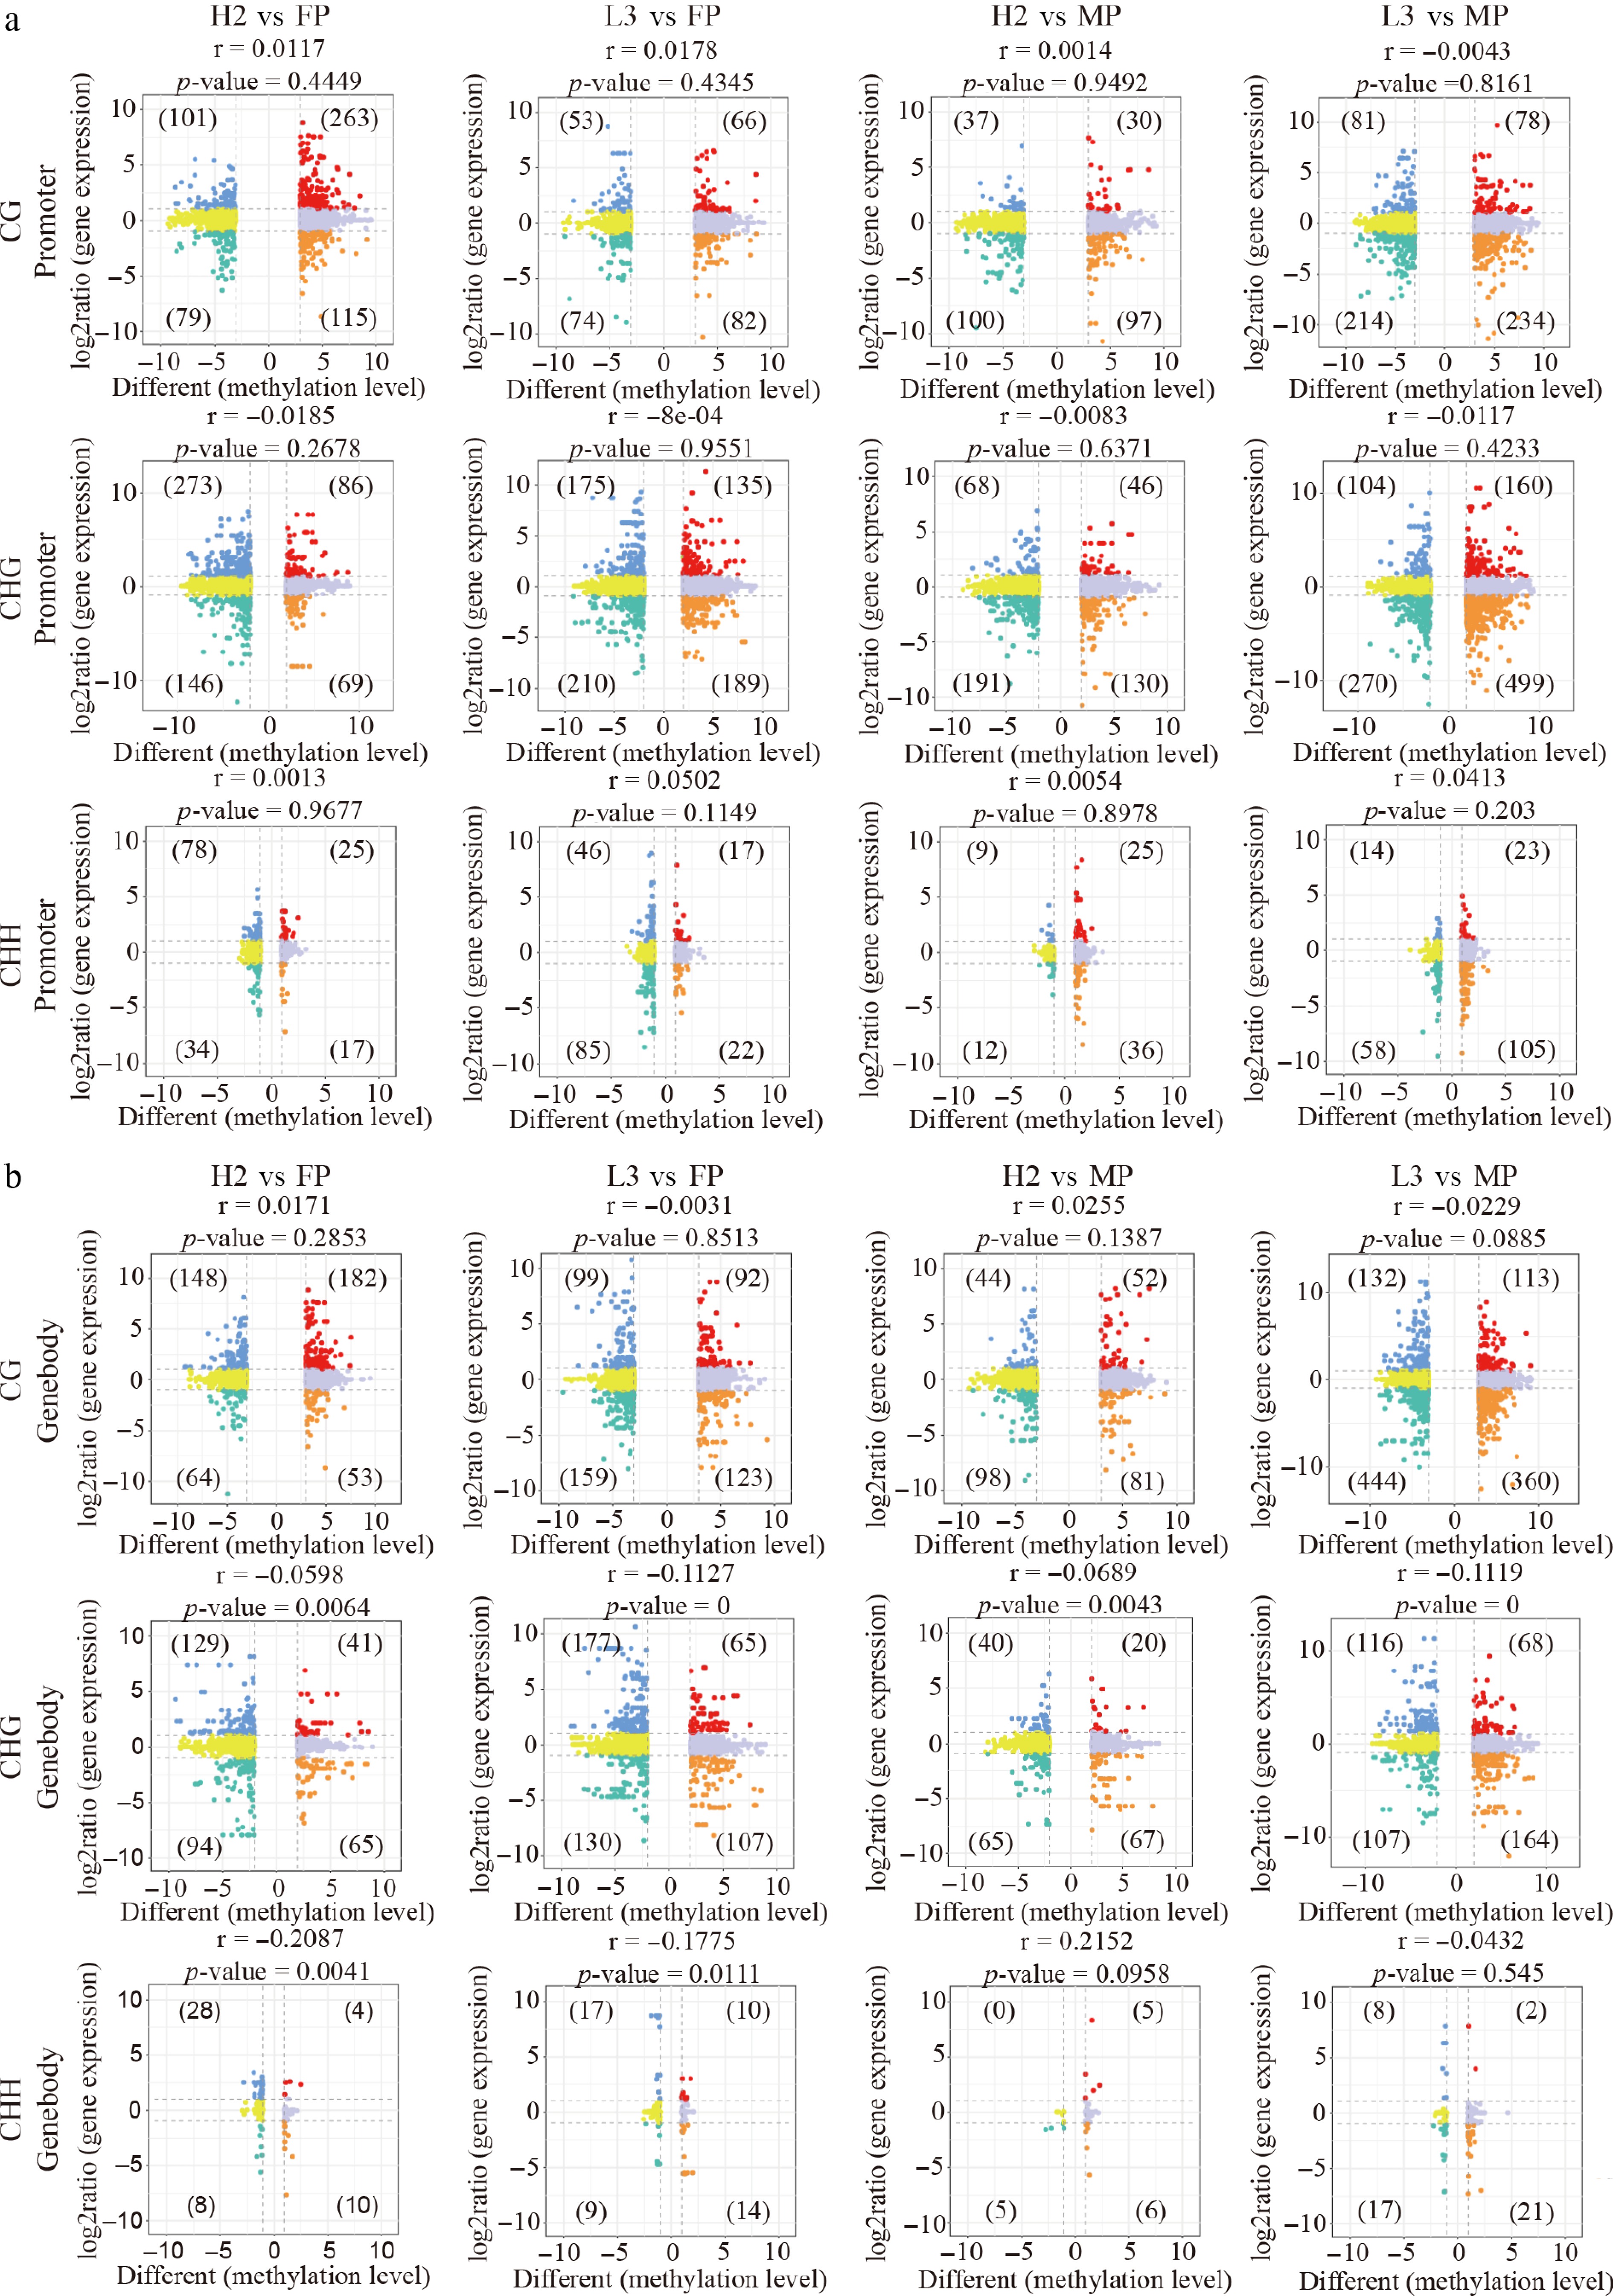
Figure 2.
Correlation between gene expression and methylation levels of differentially methylated regions (DMRs) between hybrids and parents in parental similarly methylated regions (SMRs). (a) Nine-quadrant plot illustrating the relationship between gene expression and DMR methylation levels in the promoter region. (b) Nine-quadrant plot displaying the correlation between gene expression and DMR methylation levels in the genebody region.
-
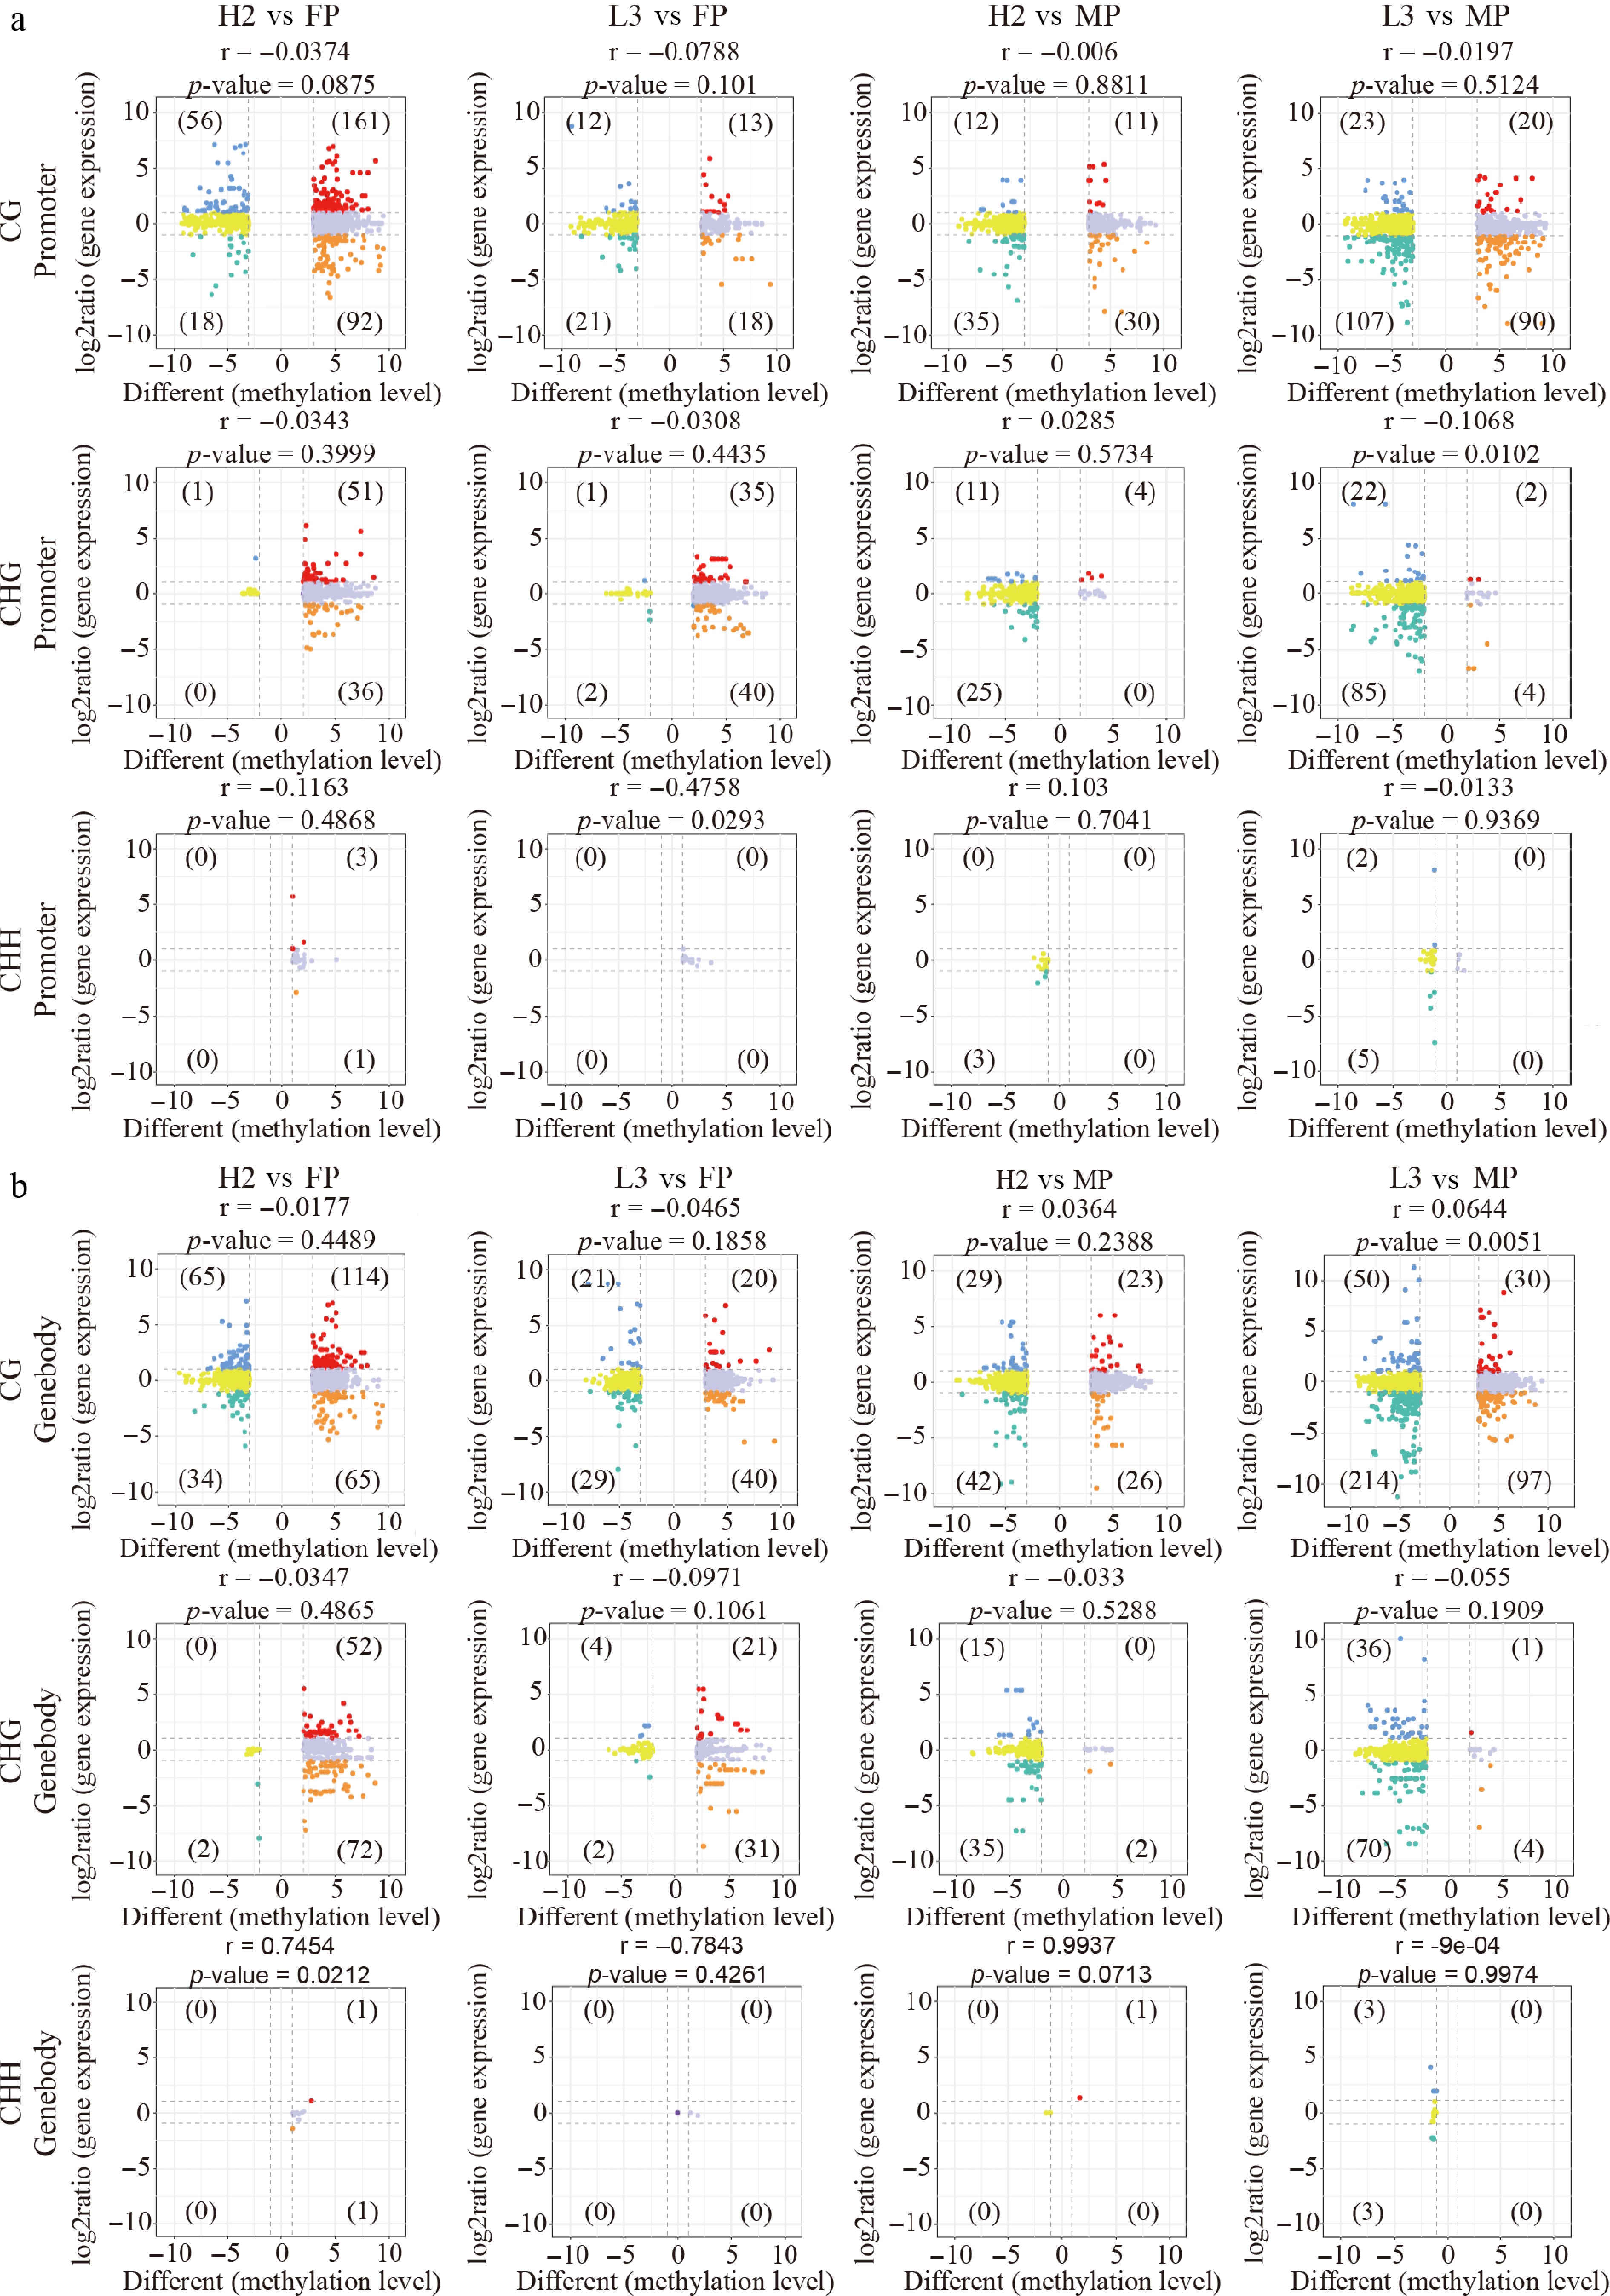
Figure 3.
Correlation between gene expression and methylation level of differentially methylated regions (DMRs) between hybrids and parents in parental DMRs. (a) Nine-quadrant plot illustrating the relationship between gene expression and DMR methylation levels in the promoter region. (b) Nine-quadrant plot displaying the correlation between gene expression and DMR methylation levels in the genebody region.
-
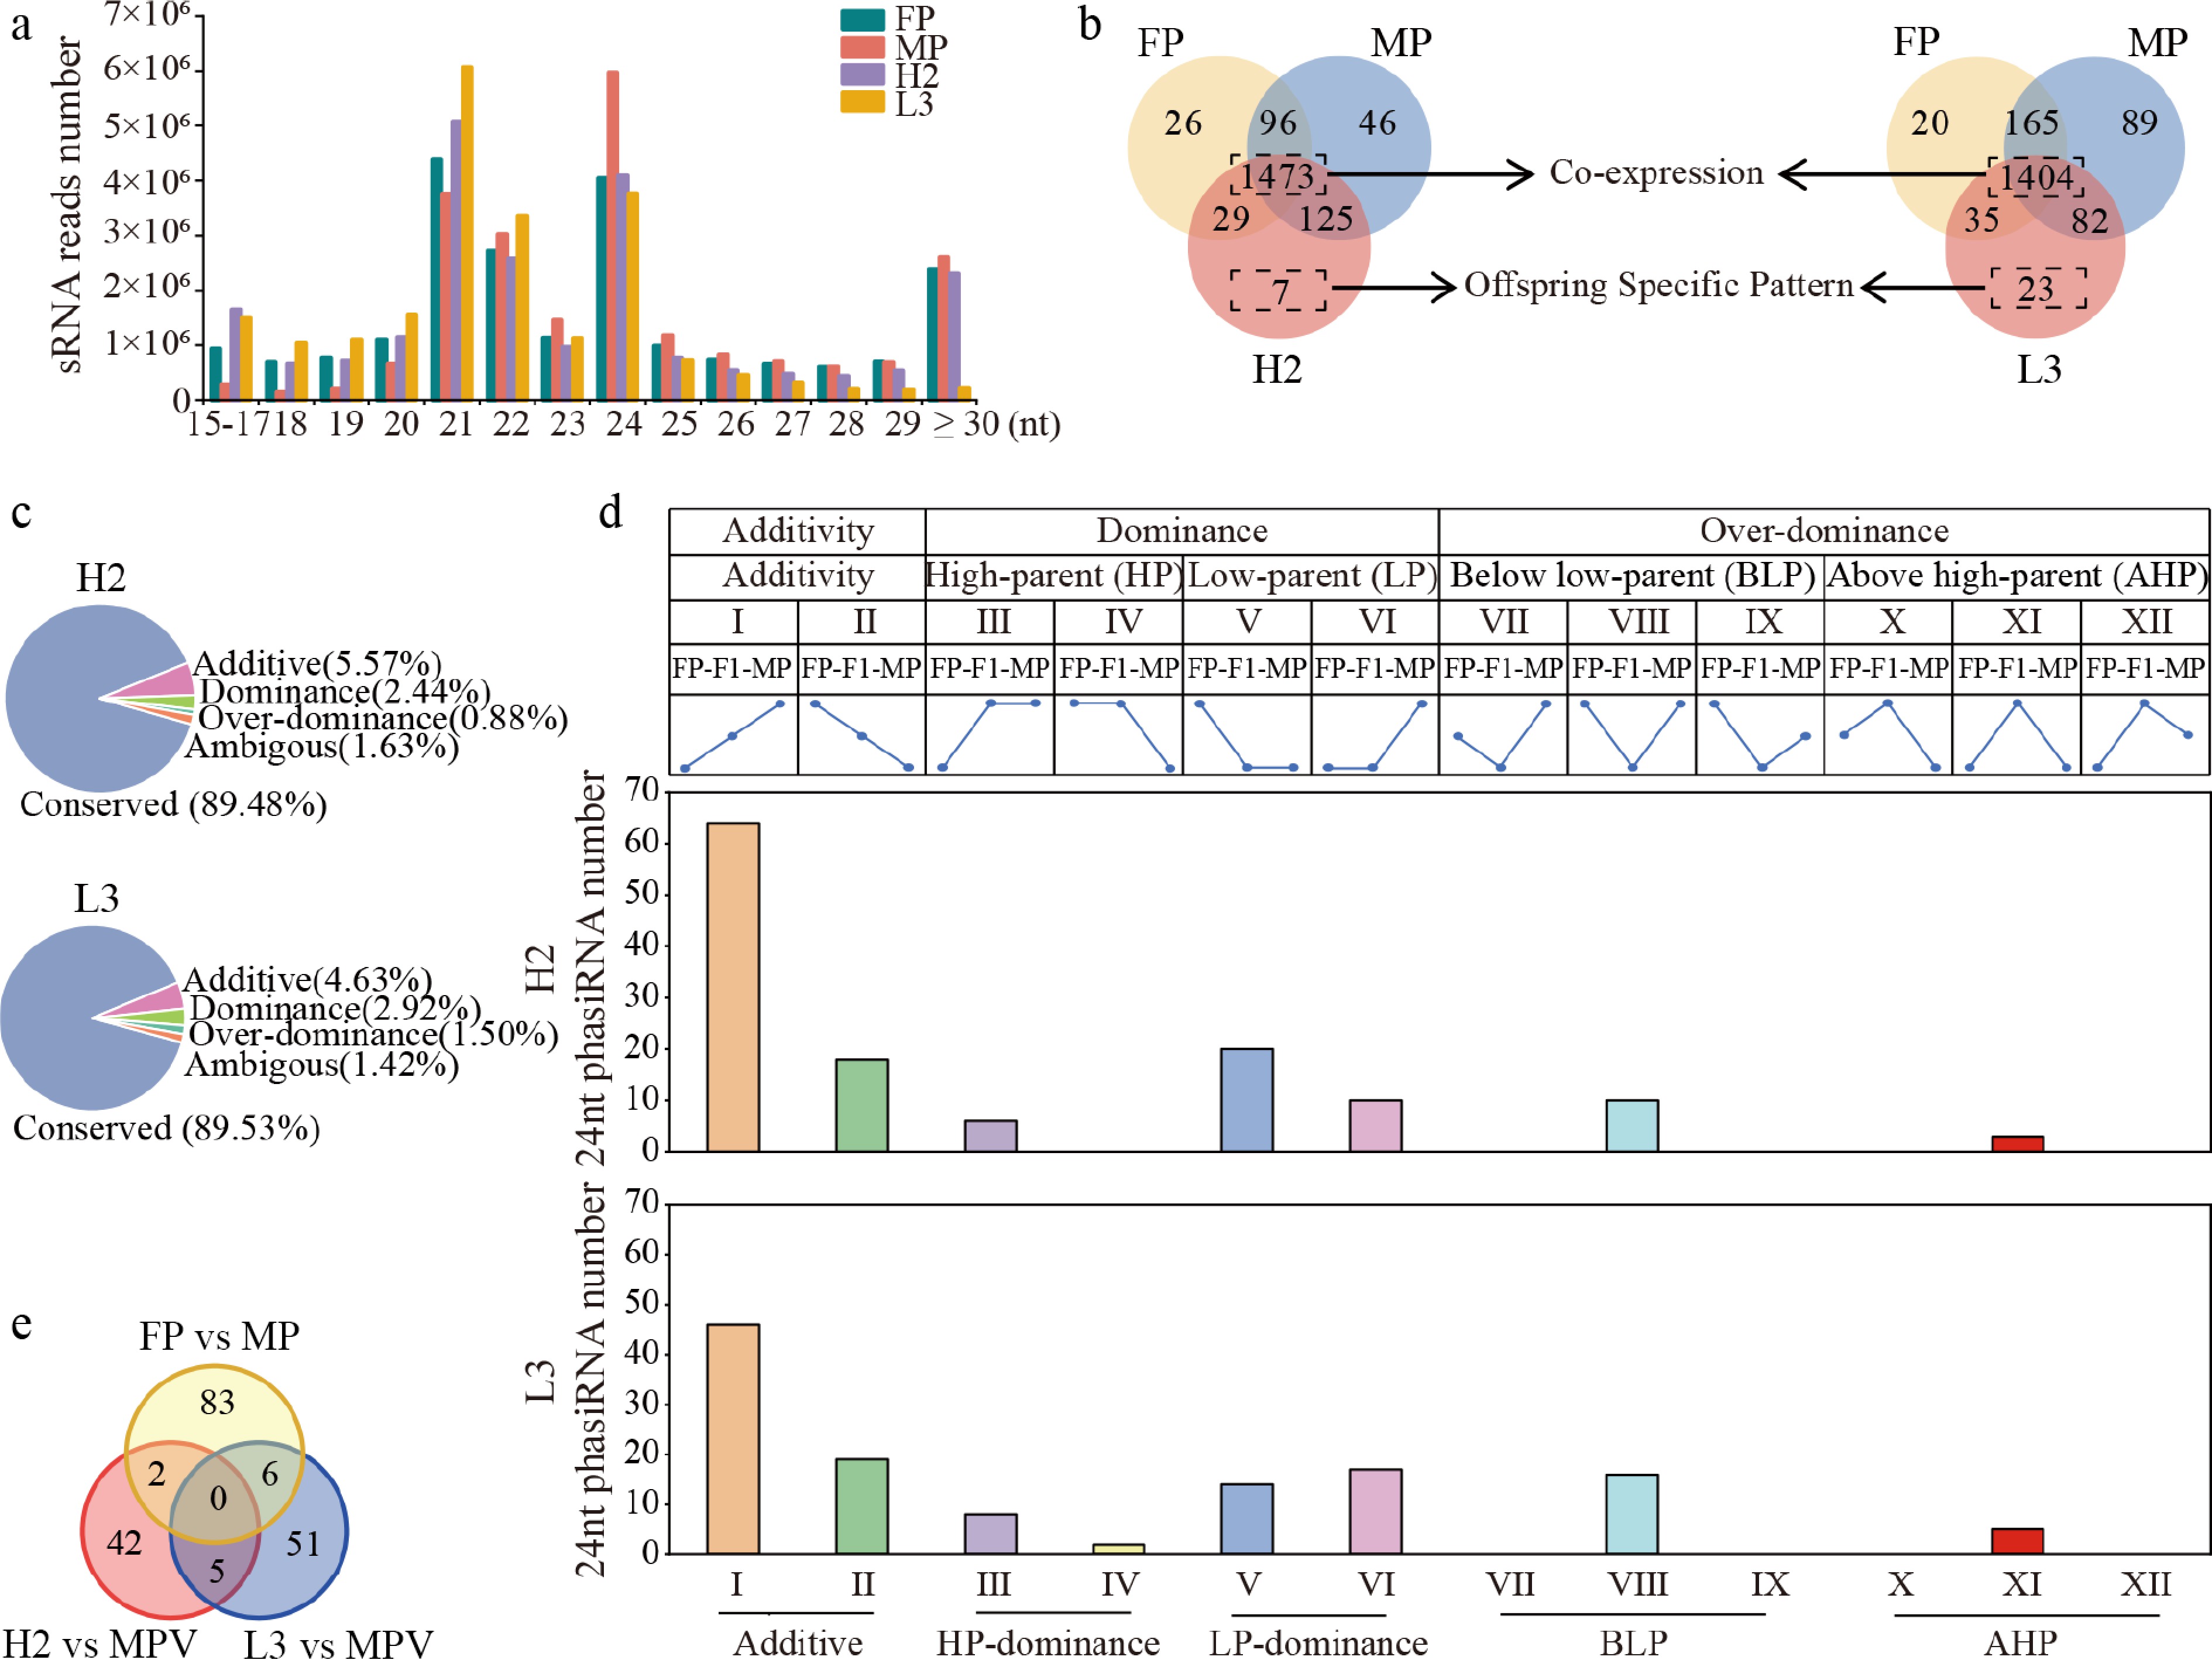
Figure 4.
Overview of sRNA distribution and 24-nt phasiRNA expression patterns in F1 hybrids and parents. (a) Distribution of sRNA reads across lengths in parents and hybrids. (b) Venn diagram of 24-nt phasiRNAs expressed in hybrids and parents. (c) Inheritance pattern of 24-nt phasiRNAs in F1 hybrids. 'Conserved Expression' refers to expression patterns with no significant differences between parents, or hybrids and parents. Other patterns include additive, dominance, and overdominance expression. (d) Number of 12 expression patterns of unstable expressed 24-nt phasiRNAs in F1 hybrids. HP: expression resembling the high-parent expression levels. LP: expression resembling the low-parent expression levels. BLP: expression was significantly reduced compared to the low-expression parent (false discovery rate [FDR] < 0.05). AHP: expression significantly increased compared to high-parent (FDR < 0.05). (e) Venn diagram of non-additive 24-nt phasiRNAs in hybrids with different growth potentials vs differentially expressed 24-nt phasiRNAs among parents.
-
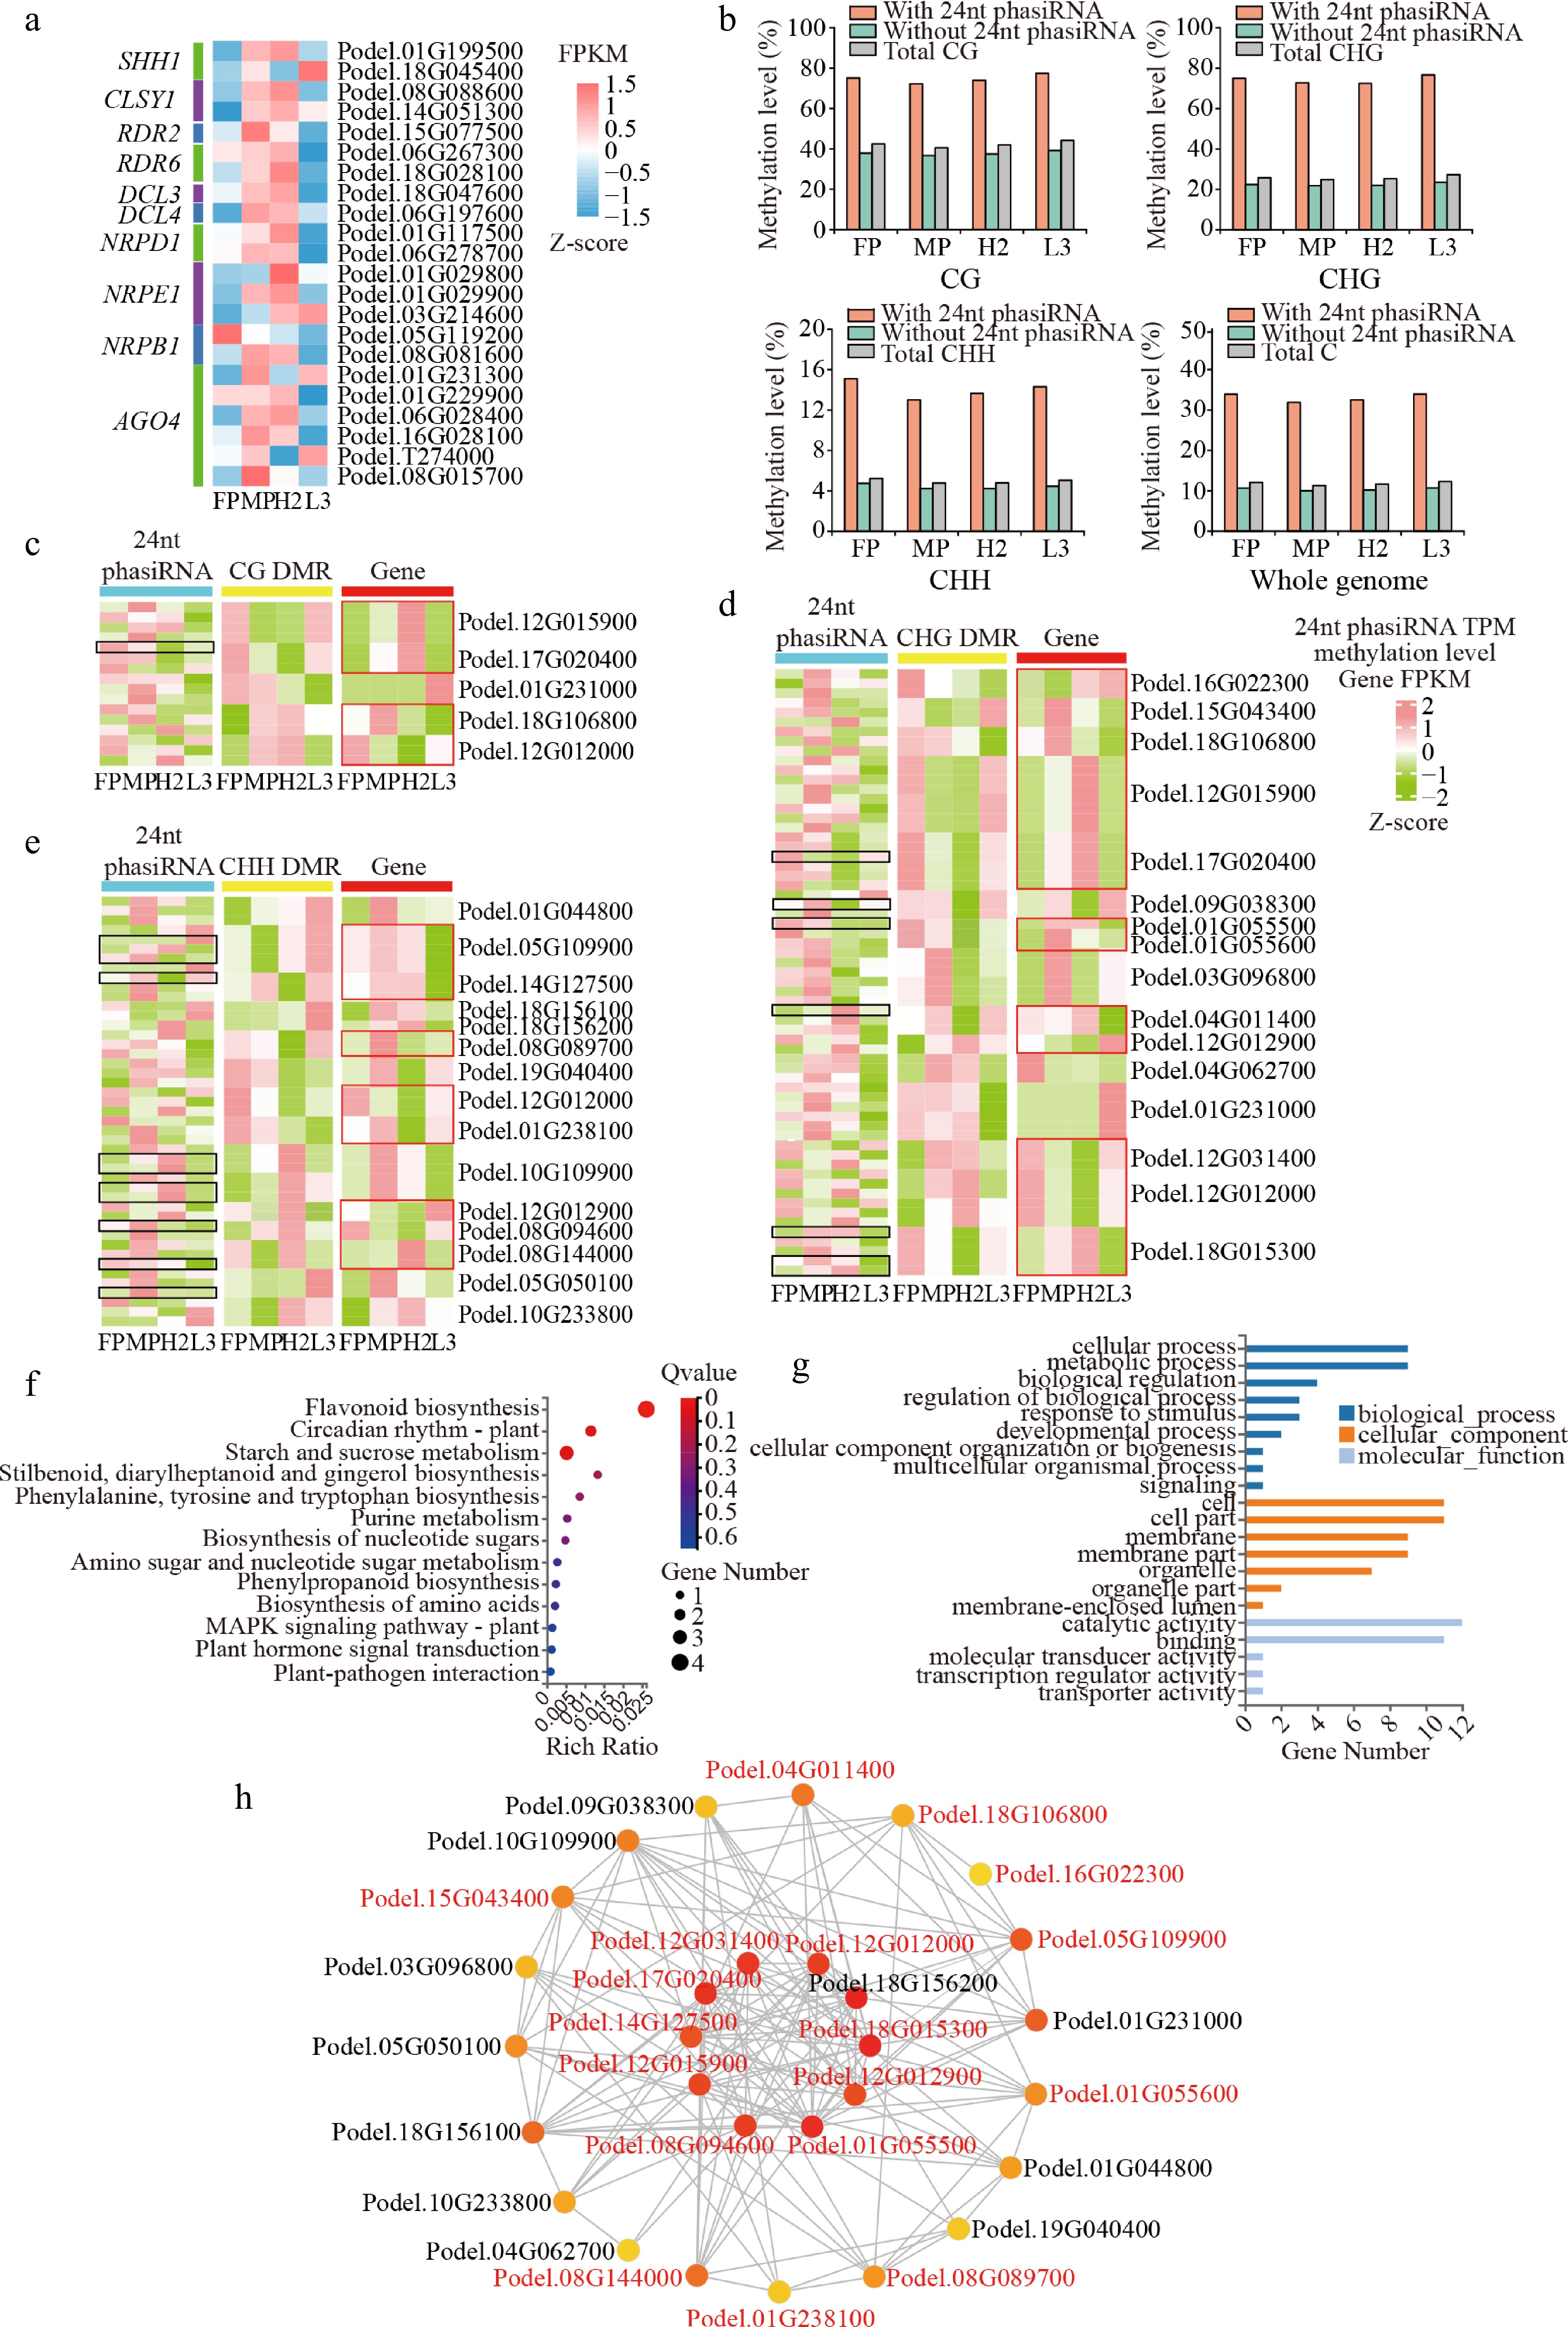
Figure 5.
Relationship of 24-nt phasiRNA, DNA methylation, and gene expression in hybrids. (a) Heatmap of gene expression involved in 24-nt phasiRNA biosynthesis. (b) Methylation level of 24-nt phasiRNA region on chromosome. (c)−(e) Heatmaps of 24-nt phasiRNA expression levels (TPM); (c) CG, (d) CHG, and (e) CHH DMR methylation levels and differentially methylated gene expression levels (FPKM). The black box represents non-additive 24-nt phasiRNA, while the red box represents non-additive genes. (f) KEGG pathway enrichment, and (g) GO annotation of genes associated with 24-nt phasiRNA and DNA methylation. (h) Co-expression network for genes, with red-colored genes representing non-additive DEGs.
-
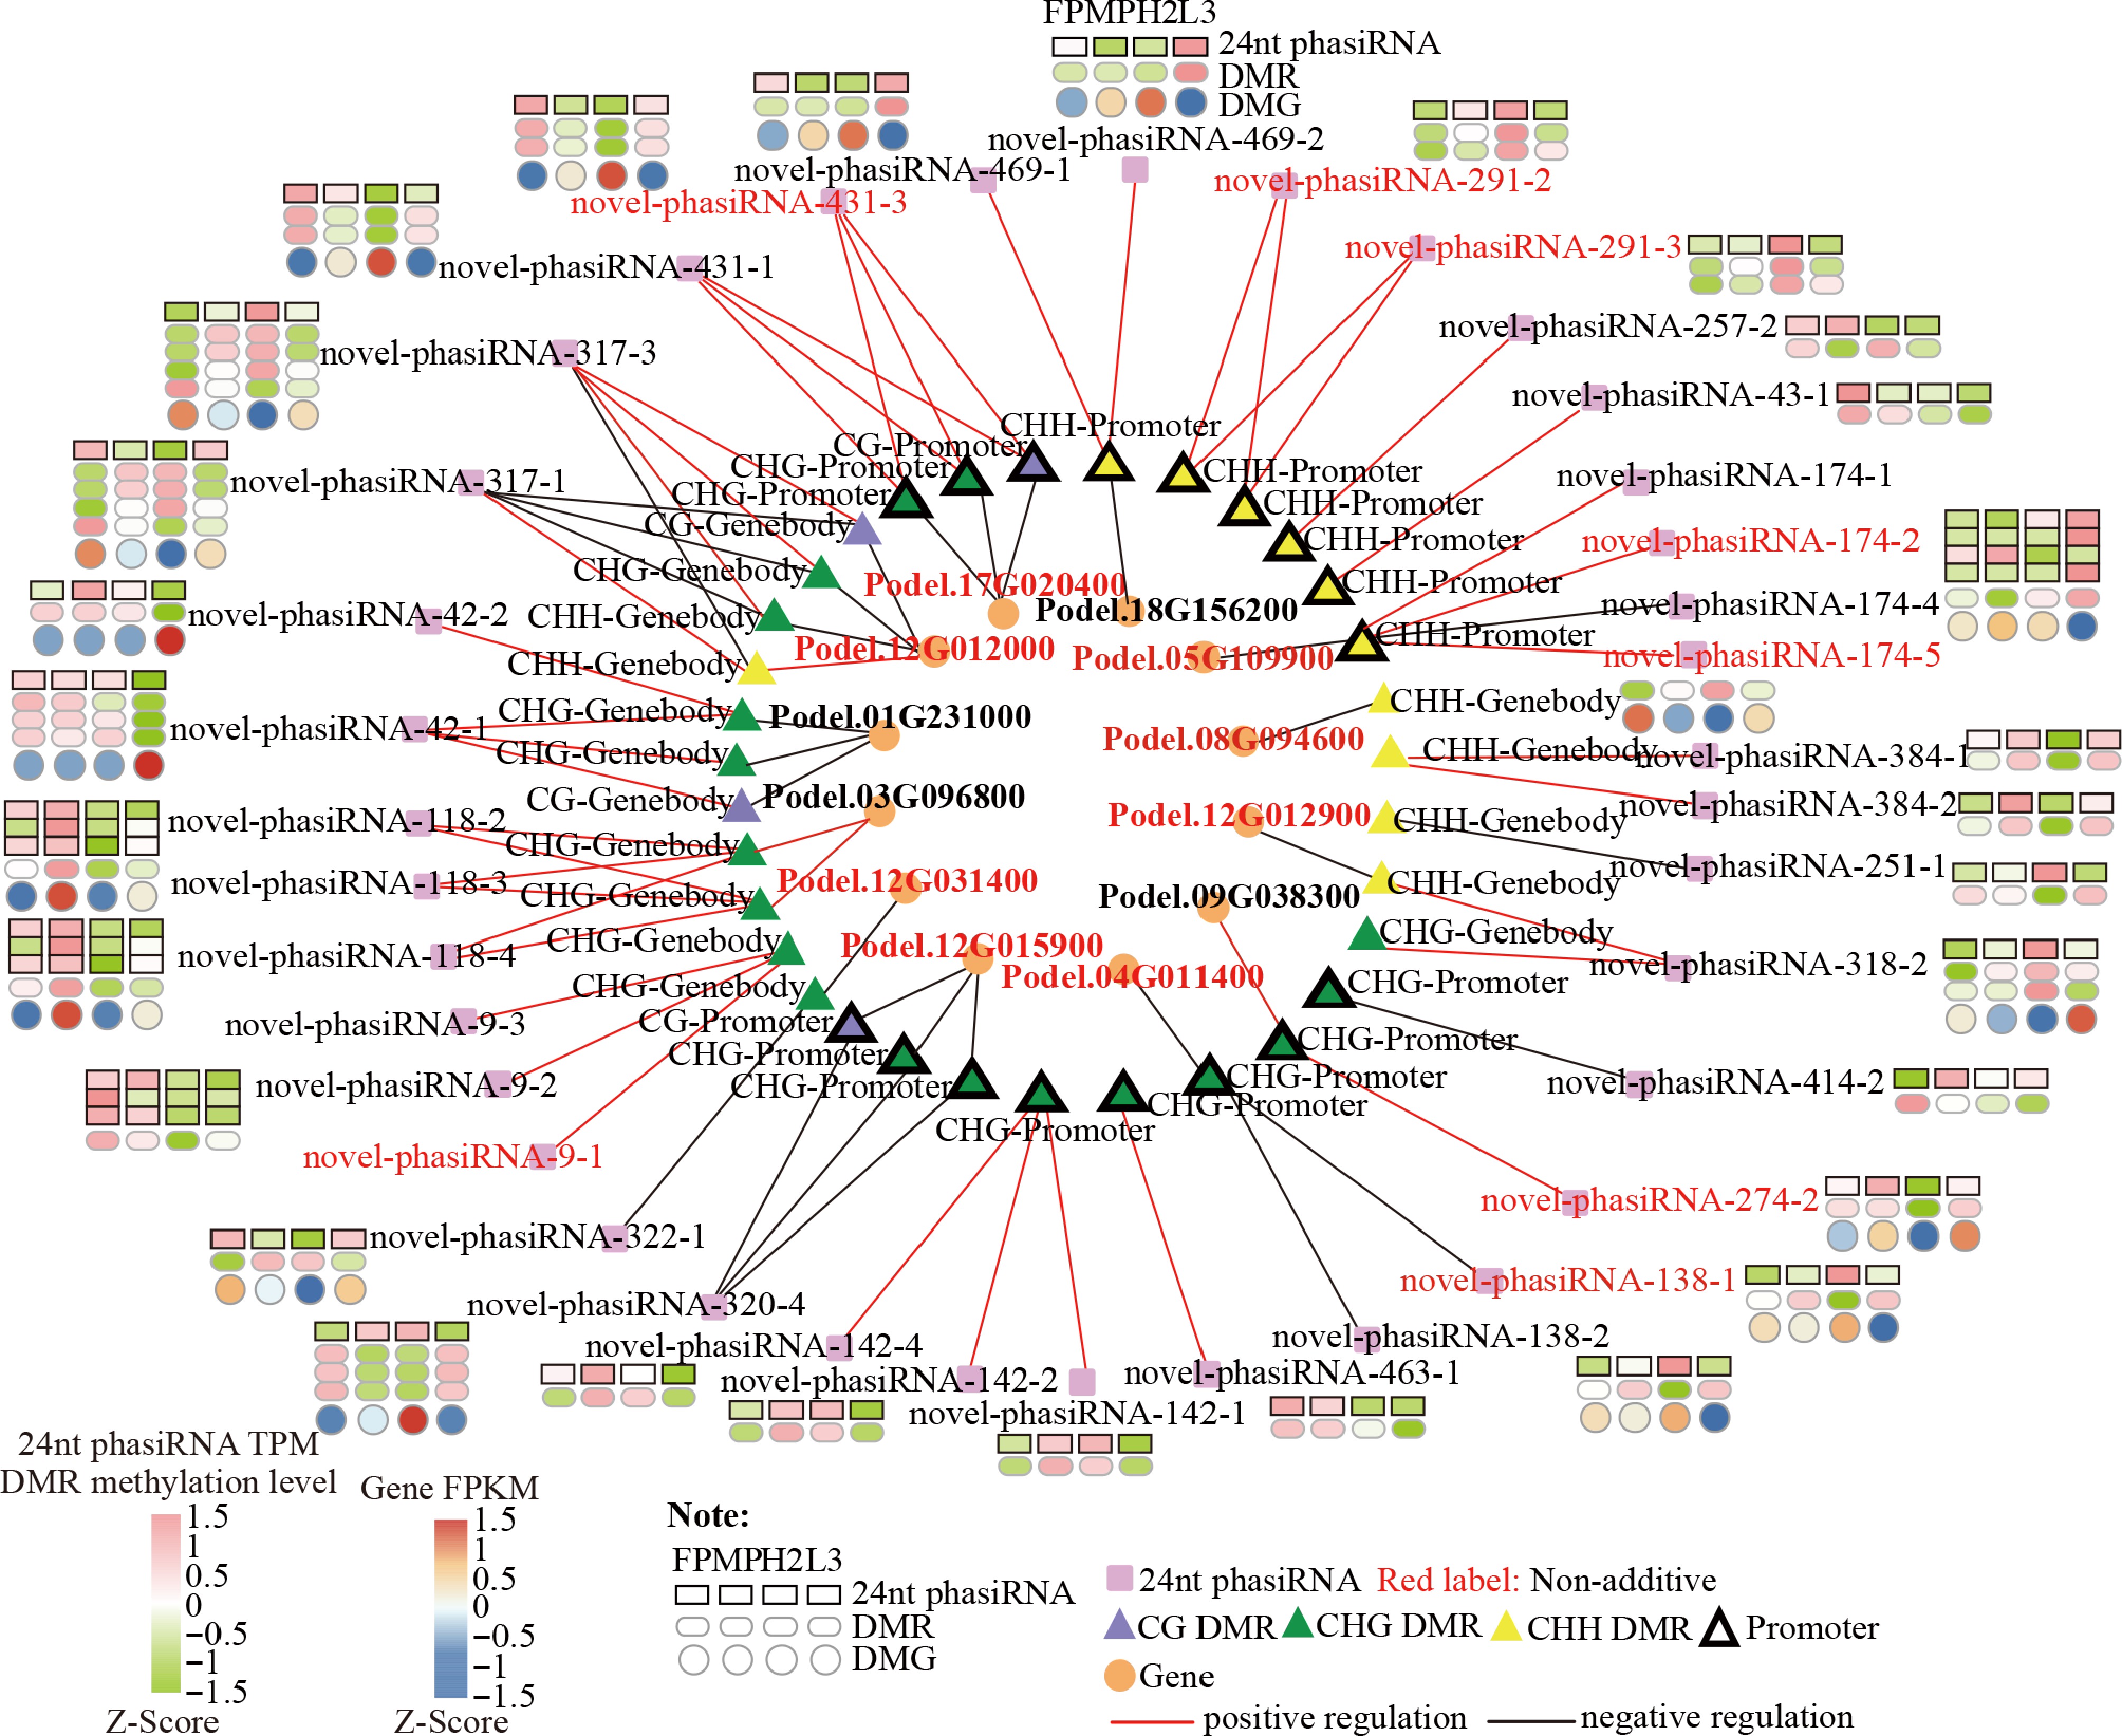
Figure 6.
Candidate 24-nt phasiRNA-DMR-gene network showing significant associations among 24-nt phasiRNA abundance, DMR methylation, and gene expression. Red-colored genes are non-additive DEGs.
-
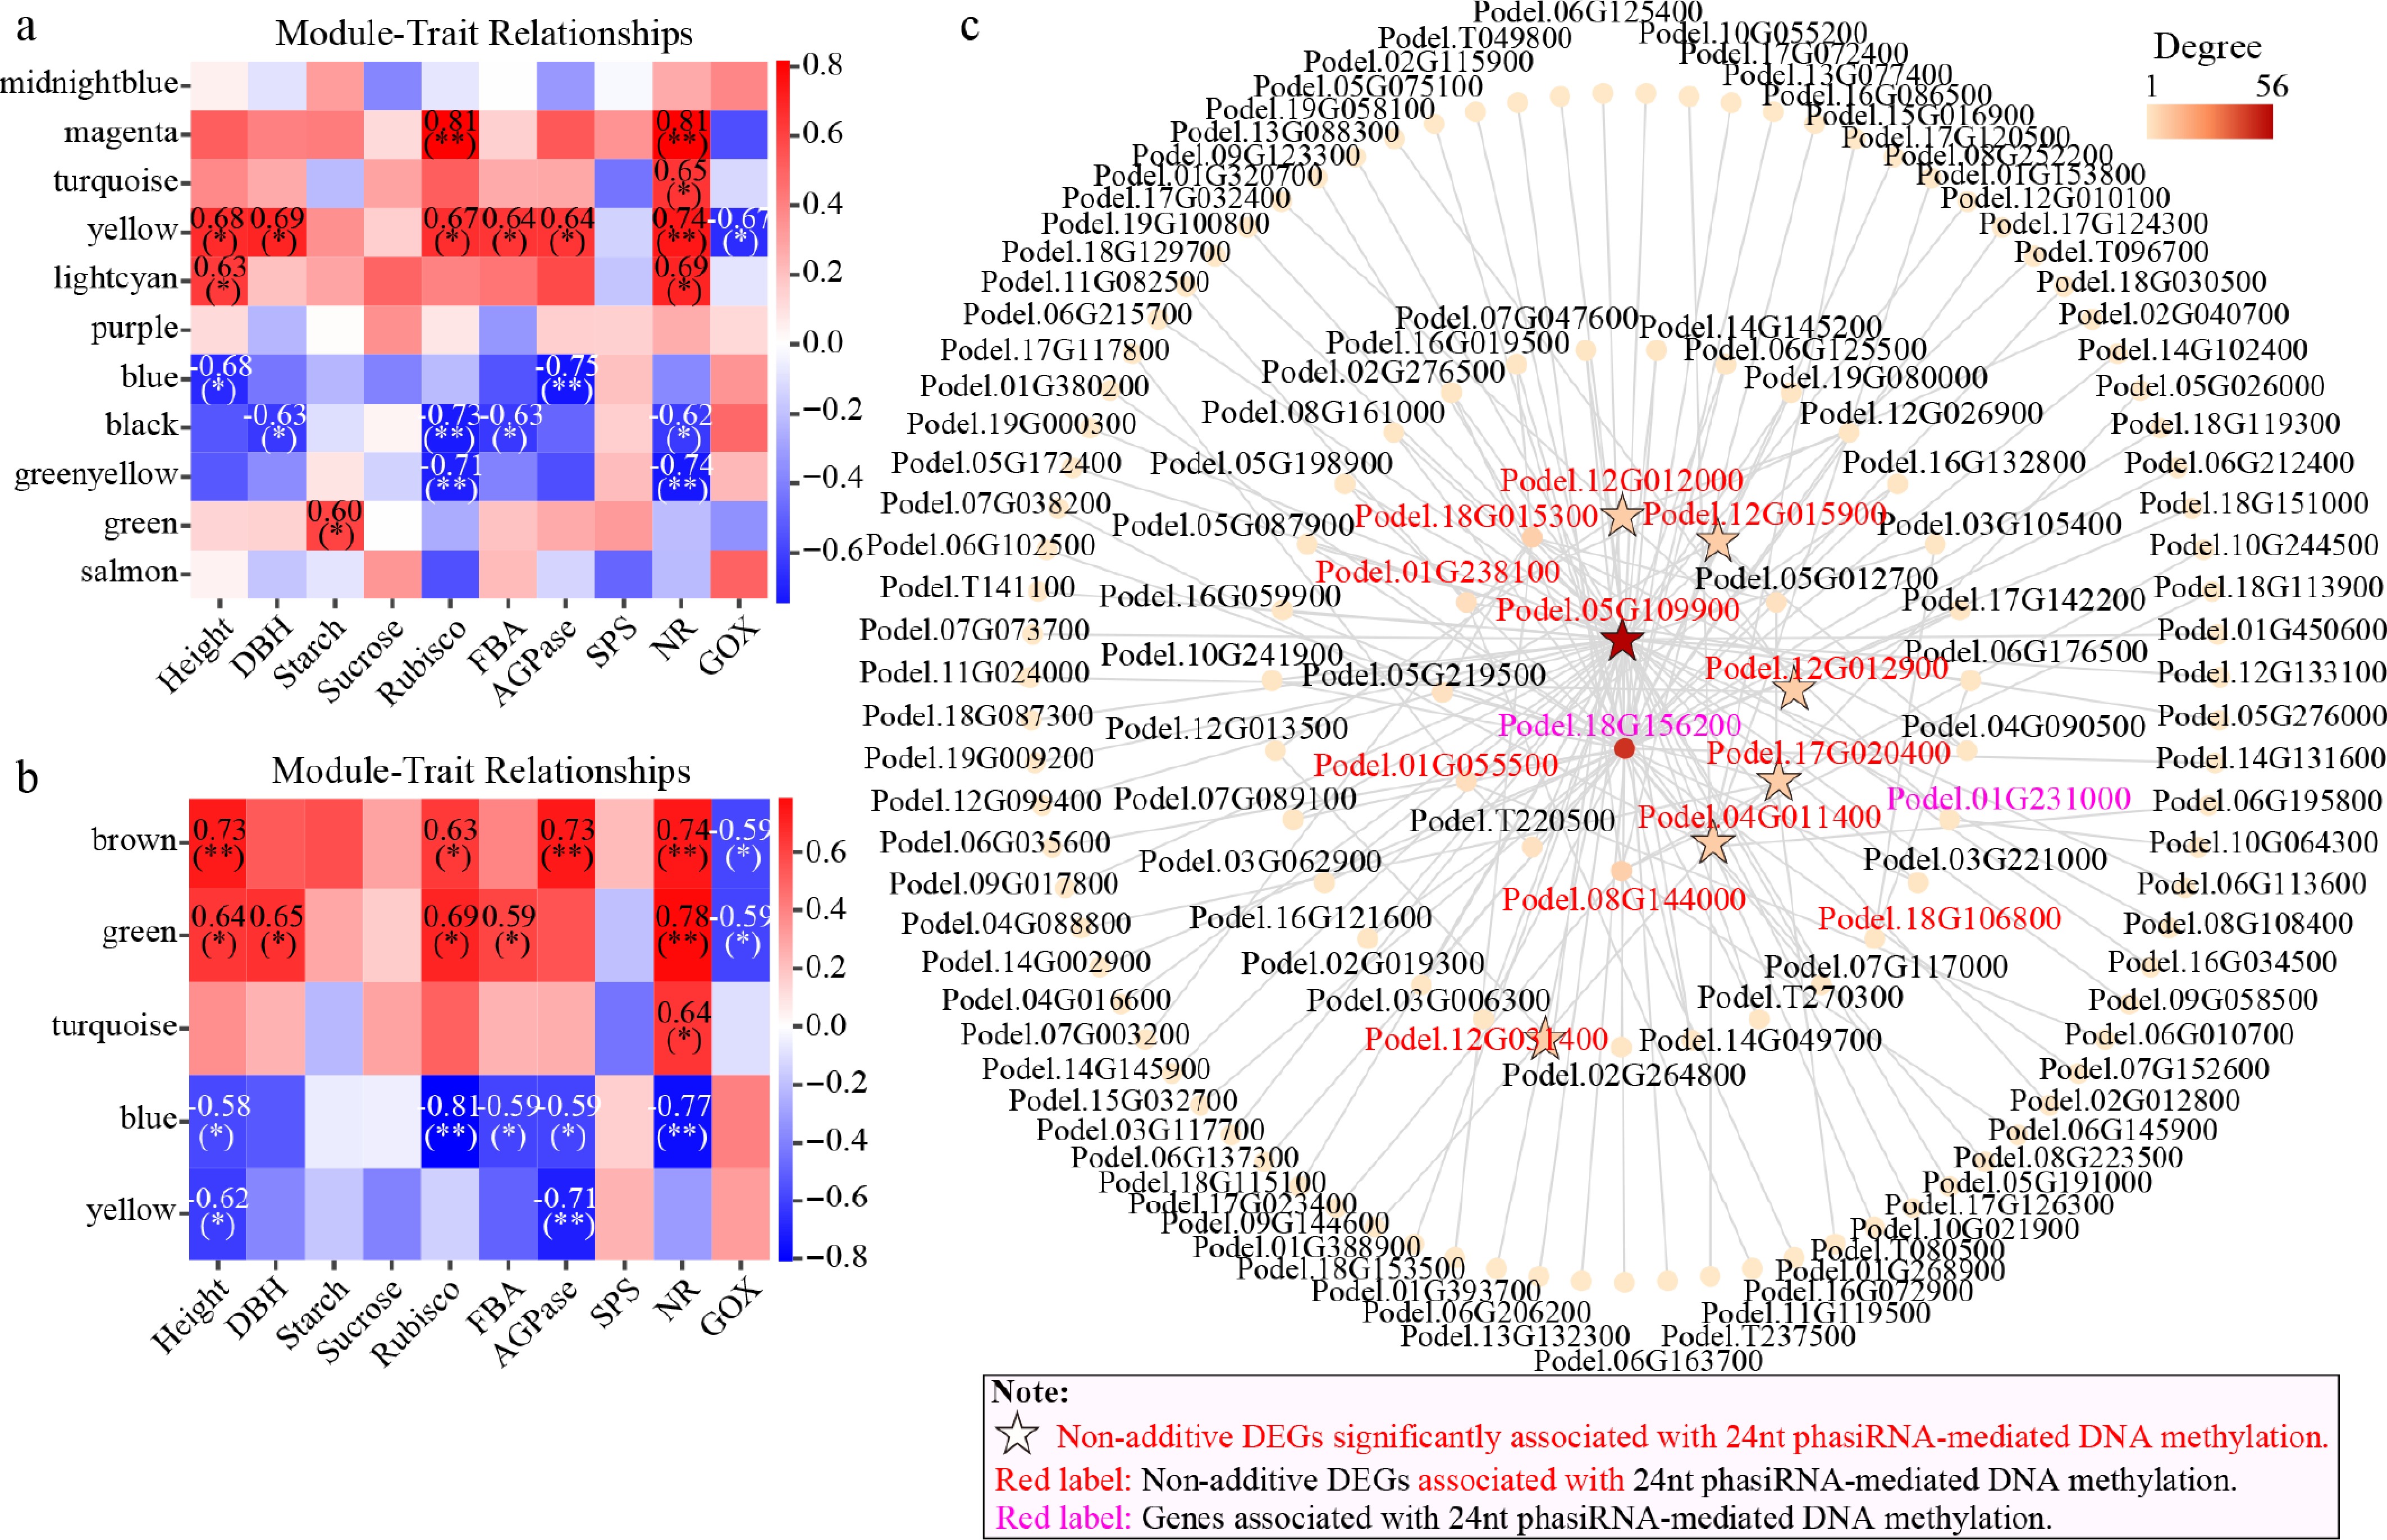
Figure 7.
Weighted gene co-expression network analysis (WGCNA) of growth phenotype and biochemical traits correlated with DMGs. (a) Correlation between traits and modules in WGCNA for parental SMRs. (b) Correlation between traits and modules in WGCNA in parental DMRs. (c) Co-expression network diagram for key genes from the eight modules with genes correlated with 24-nt phasiRNA-associated DNA methylation.
Figures
(7)
Tables
(0)