-
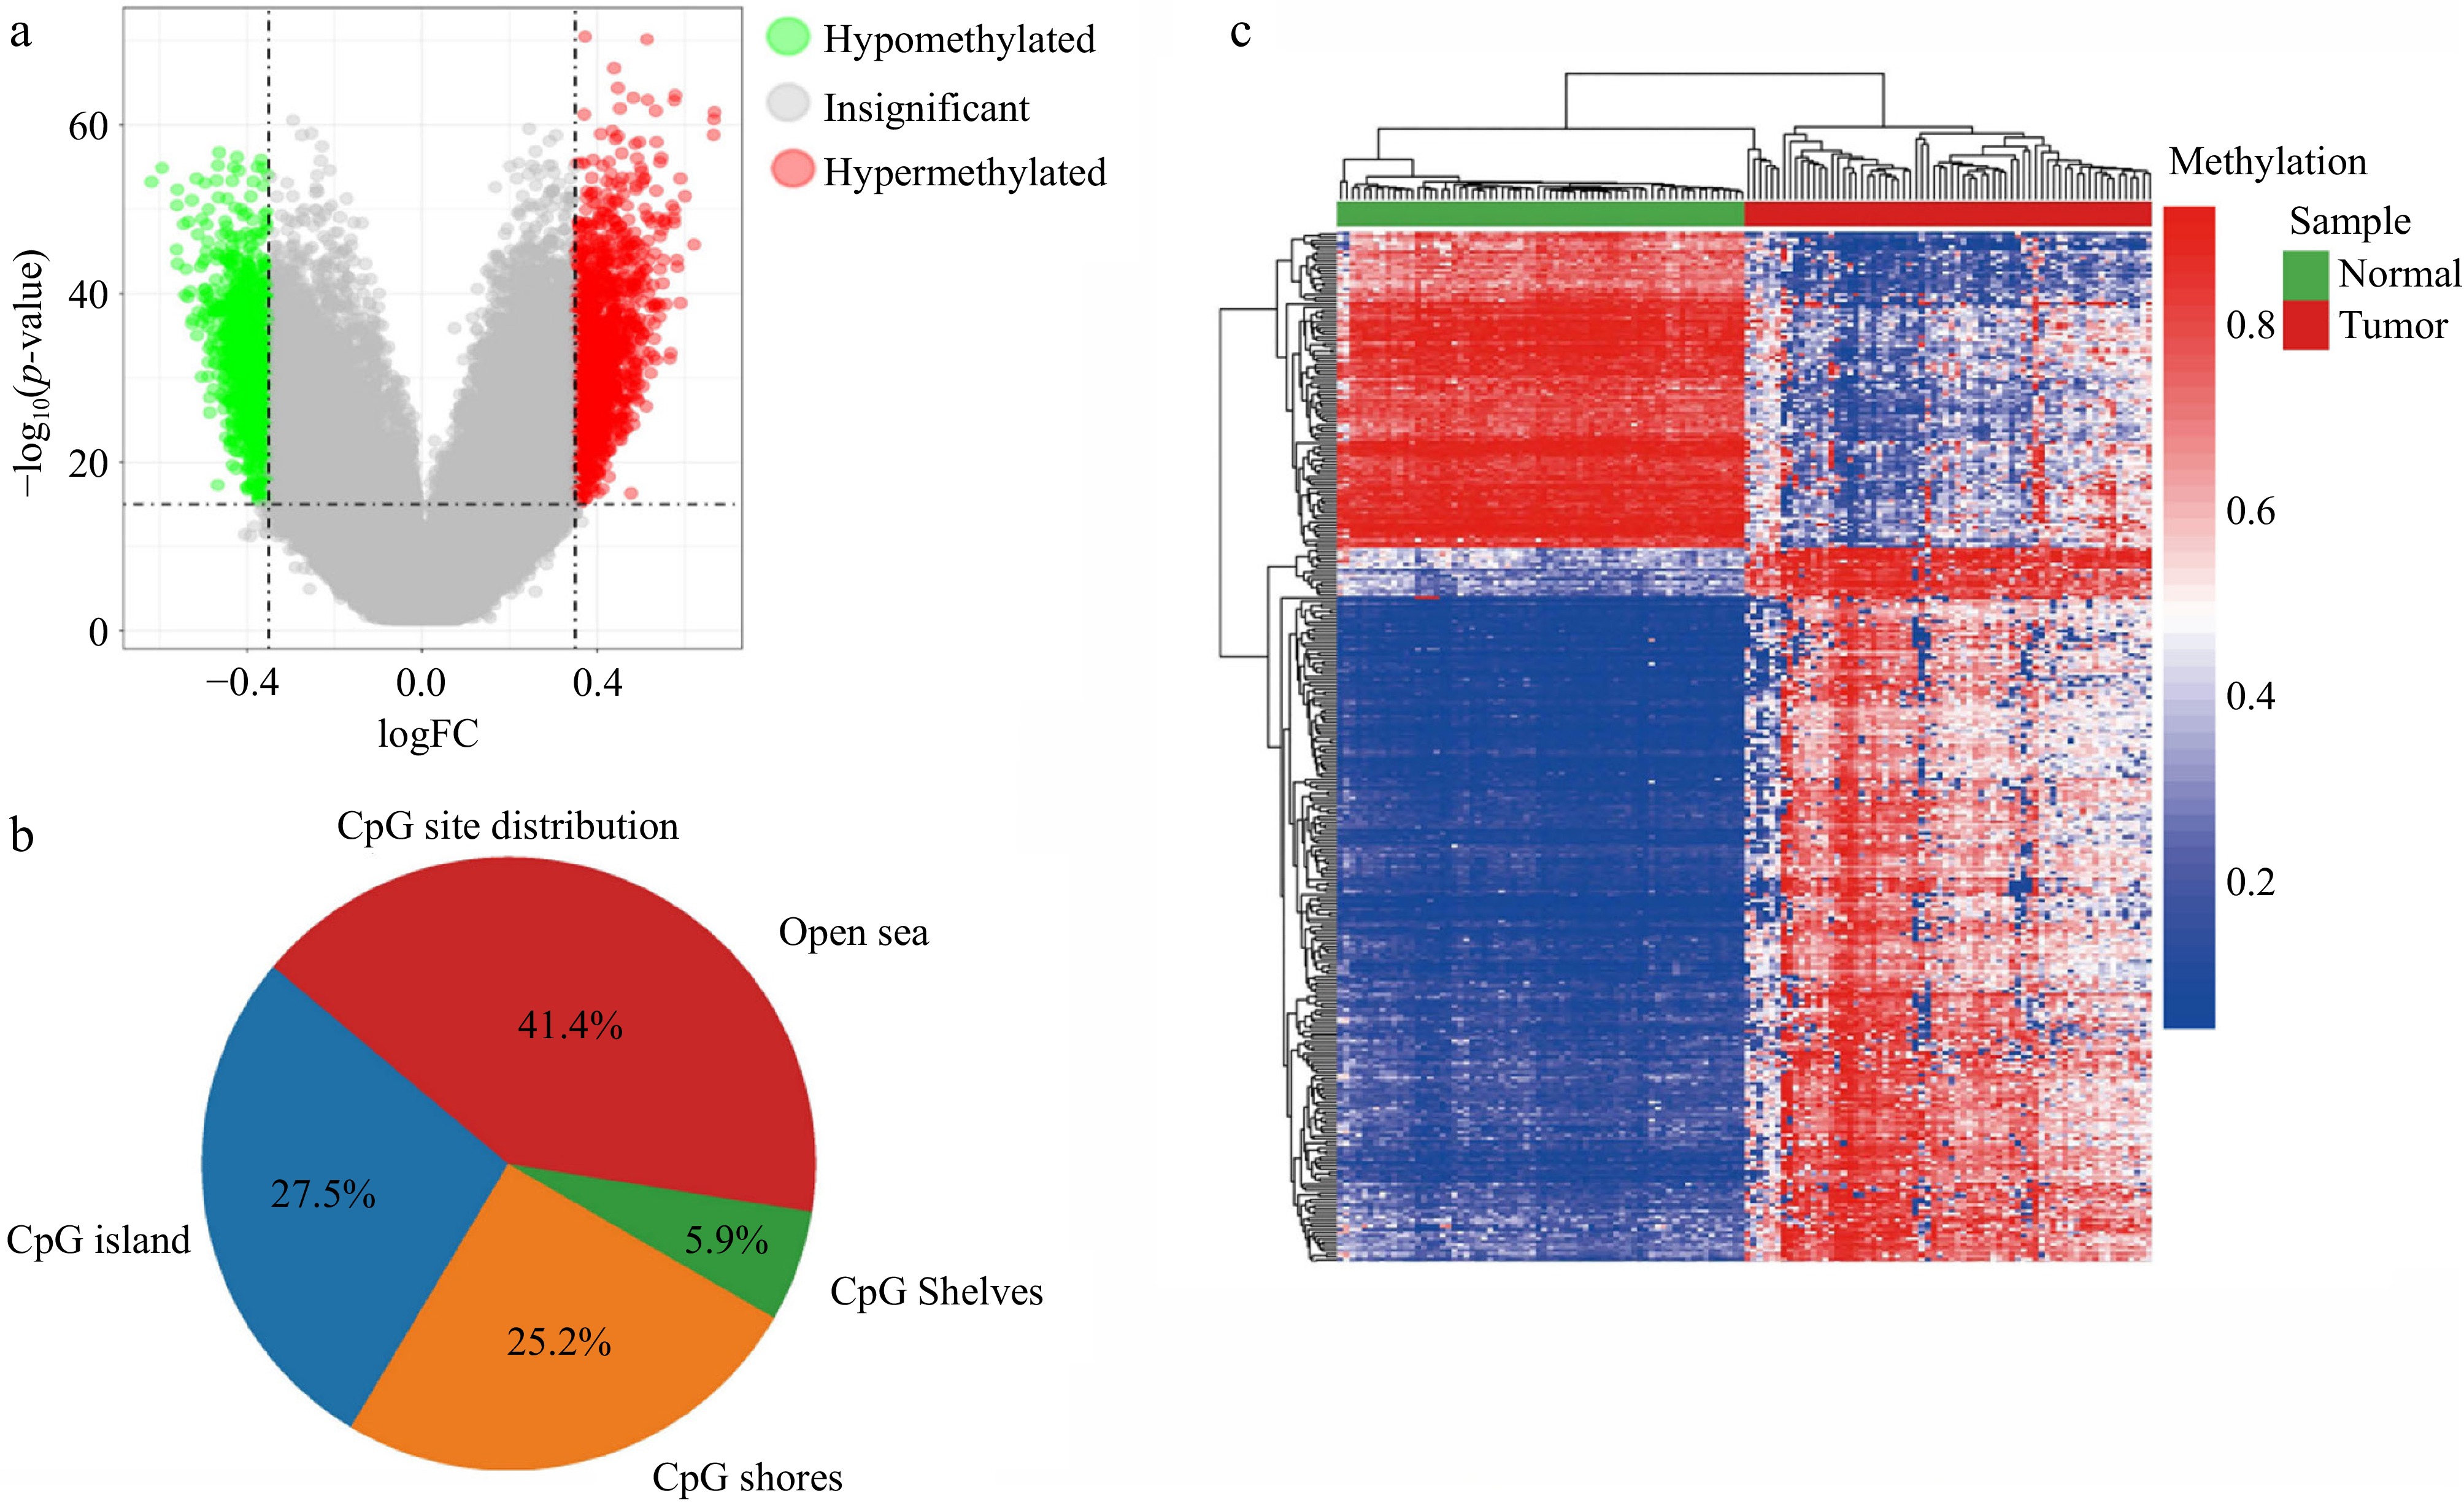
Figure 1.
Selection of methylation markers. (a) Display of the pronounced differences in methylation levels between lung cancer (LC) samples and corresponding healthy paraneoplastic tissues. (b) The distribution of the LC-specific methylation sites. (c) Heatmap visualization depicting the prevalence of hypomethylated and hypermethylated DMPs contrasting lung cancerous with paraneoplastic healthy tissues.
-
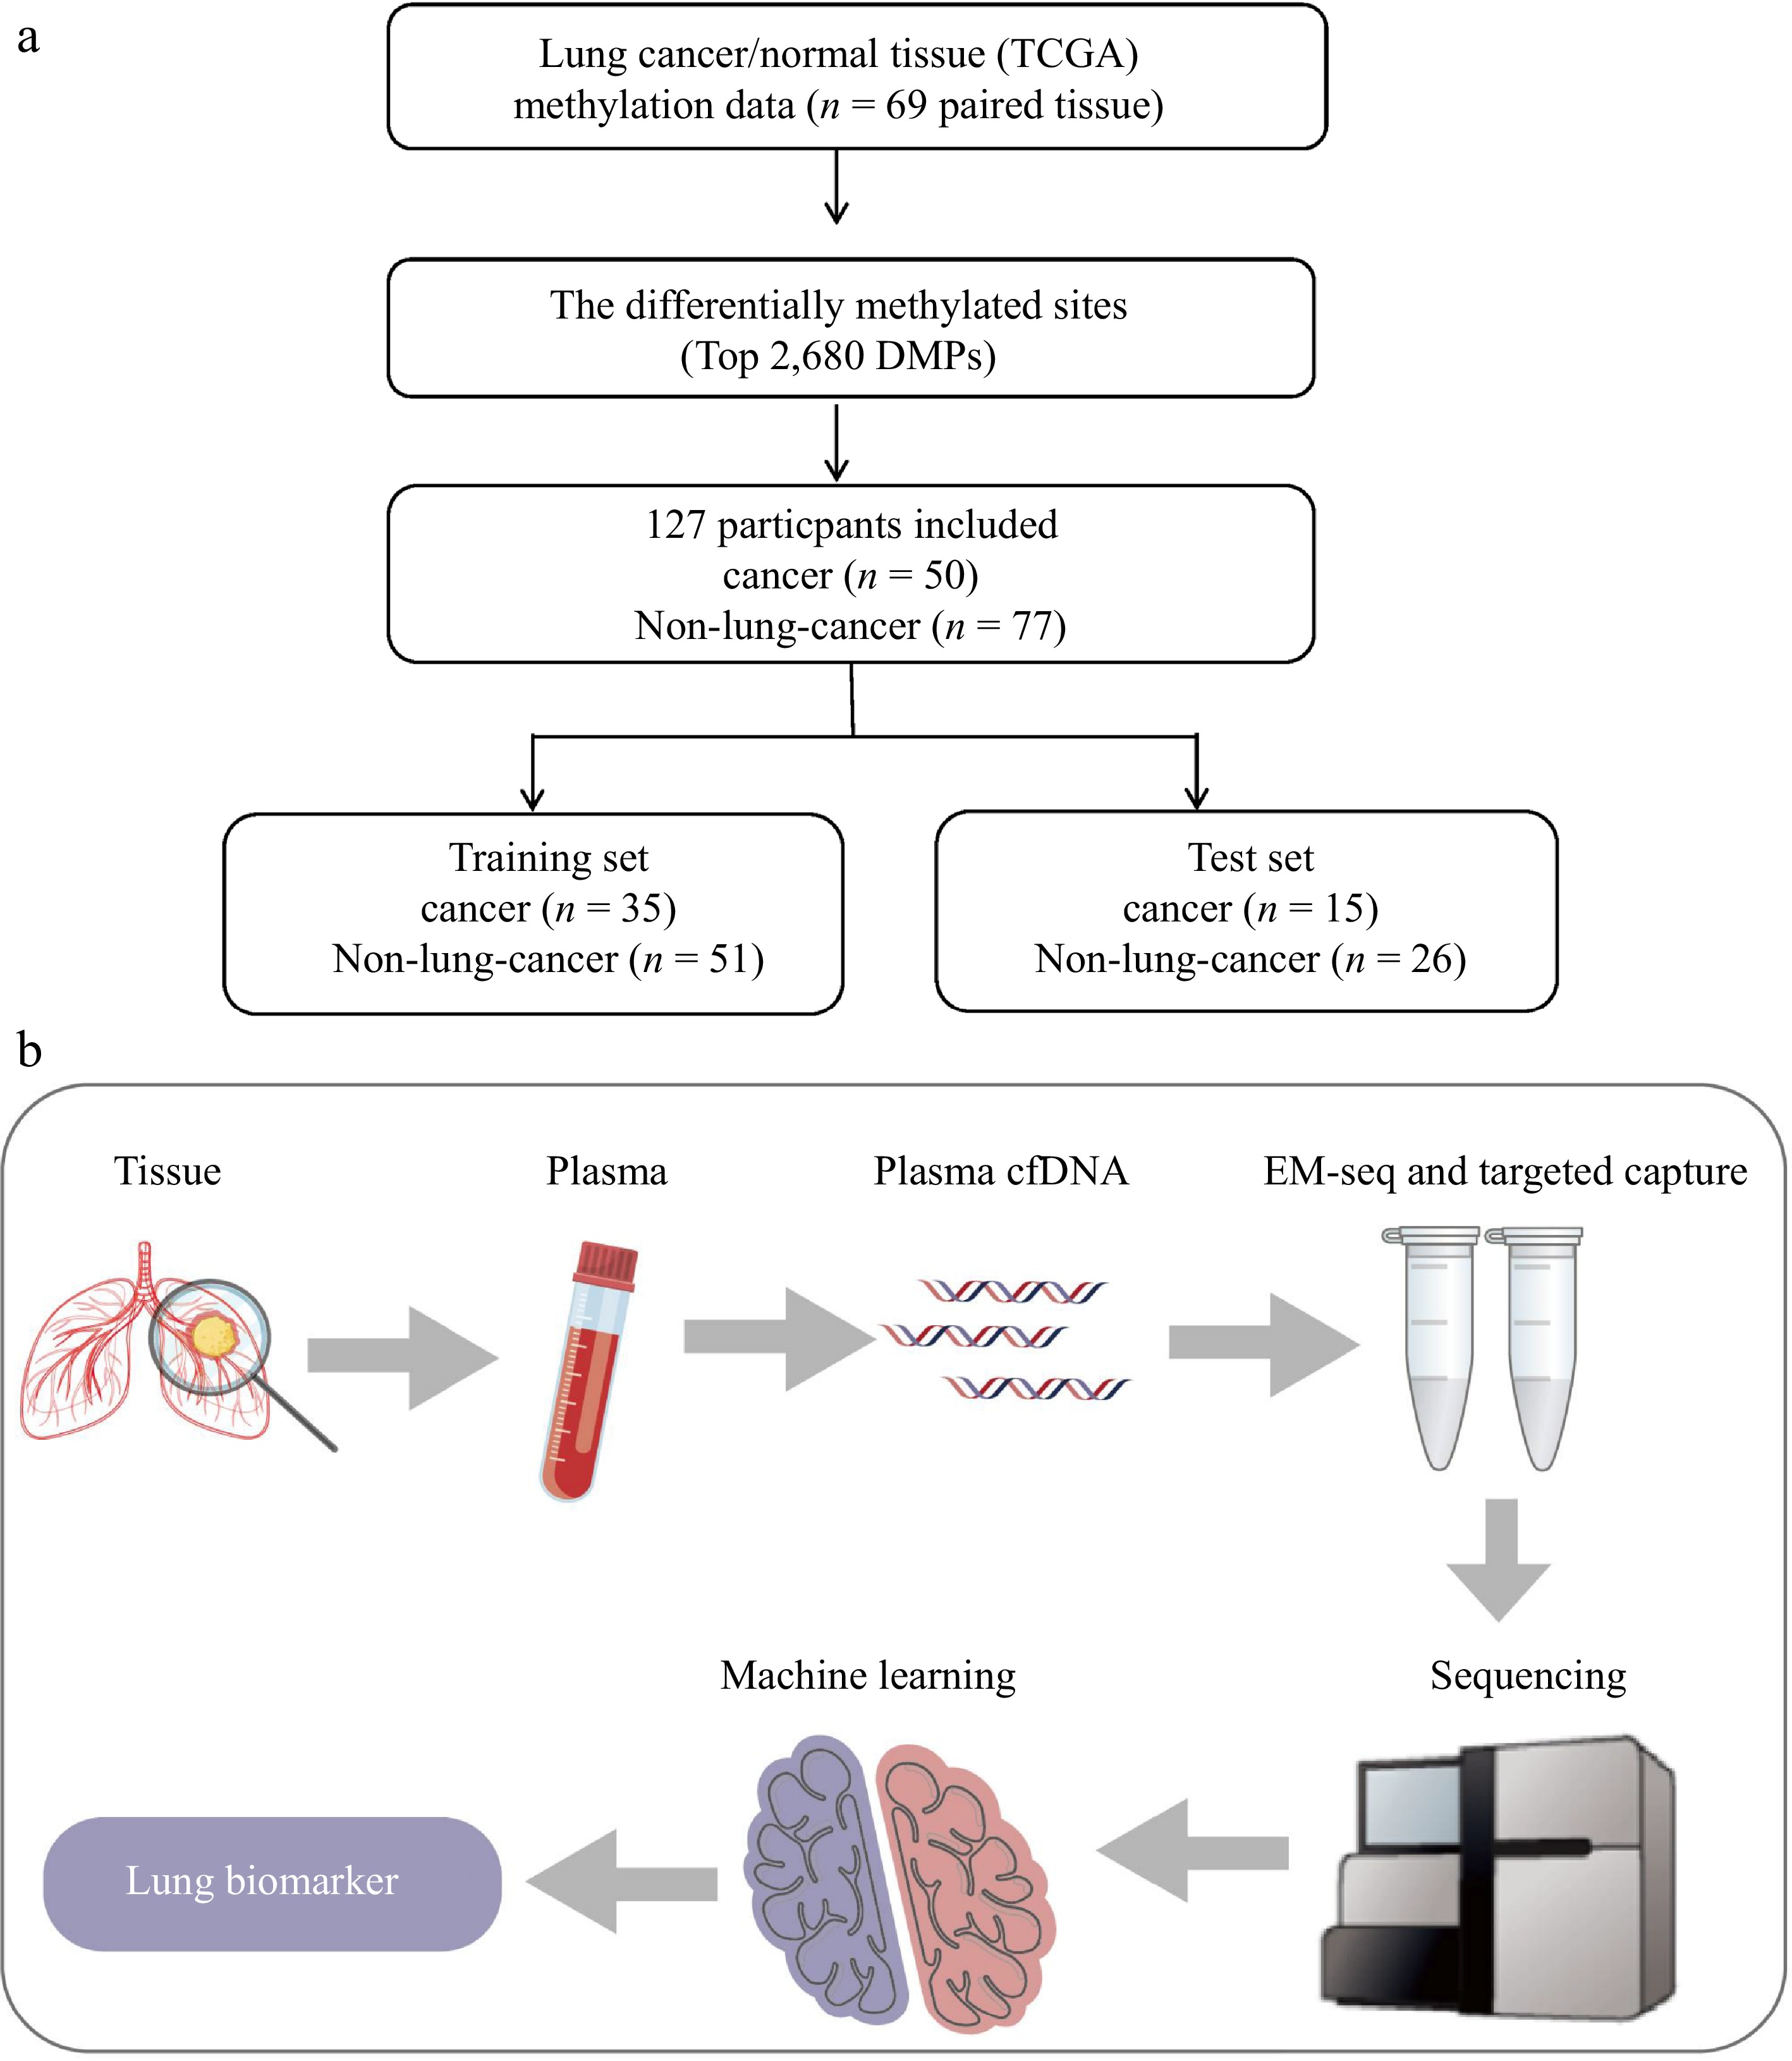
Figure 2.
Schematic illustration of the study. (a) Study design. A total of 127 participants were included in this study. Researchers performed methylation sequencing of cfDNA in plasma. Eighty-six participants (35 LC, 51 NL) were assigned to training to build a machine learning model based on a logistic regression algorithm. Forty-one participants (15 LC, 26 NL) were assigned to testing to confirm the performance of the model. (b) Schematic diagram of the plasma cell free DNA testing process.
-
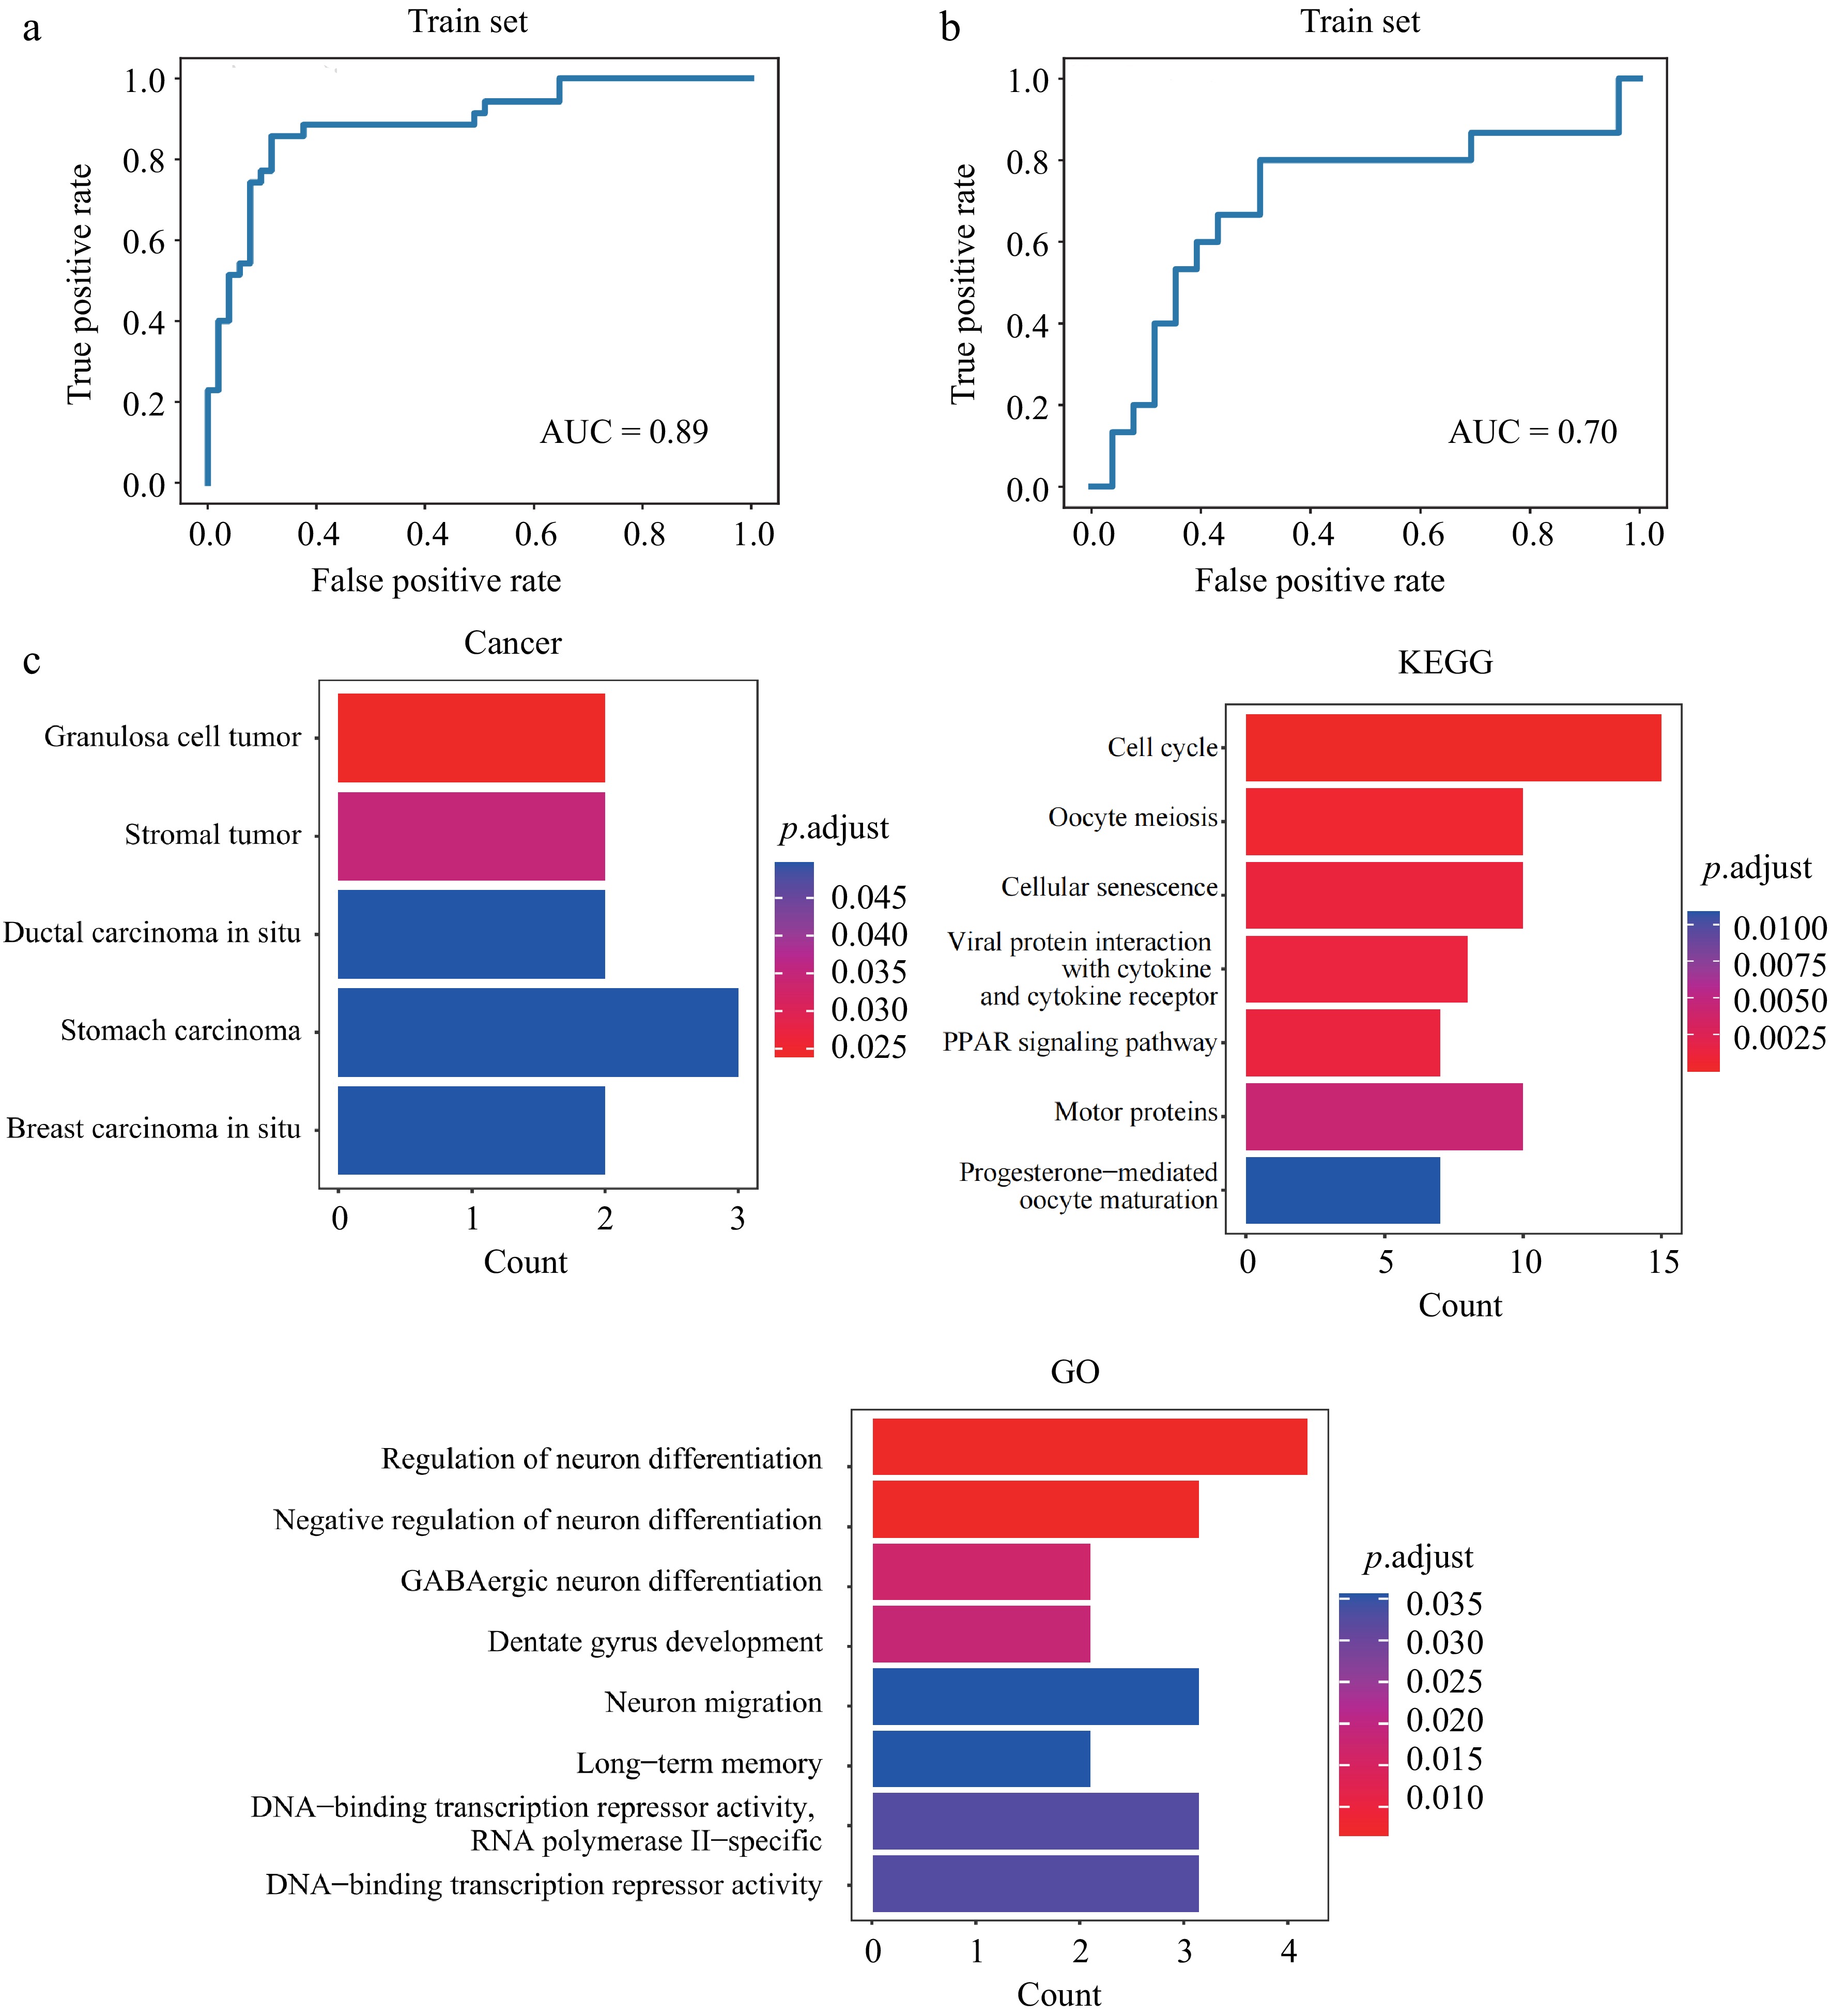
Figure 3.
Verification and construction of the LC screening model. (a) ROC curve for the model in the training dataset. (b) ROC curve for the model in the test dataset. (c) Gene ontology analyses applied to the genes characterized by the model features.
Figures
(3)
Tables
(0)